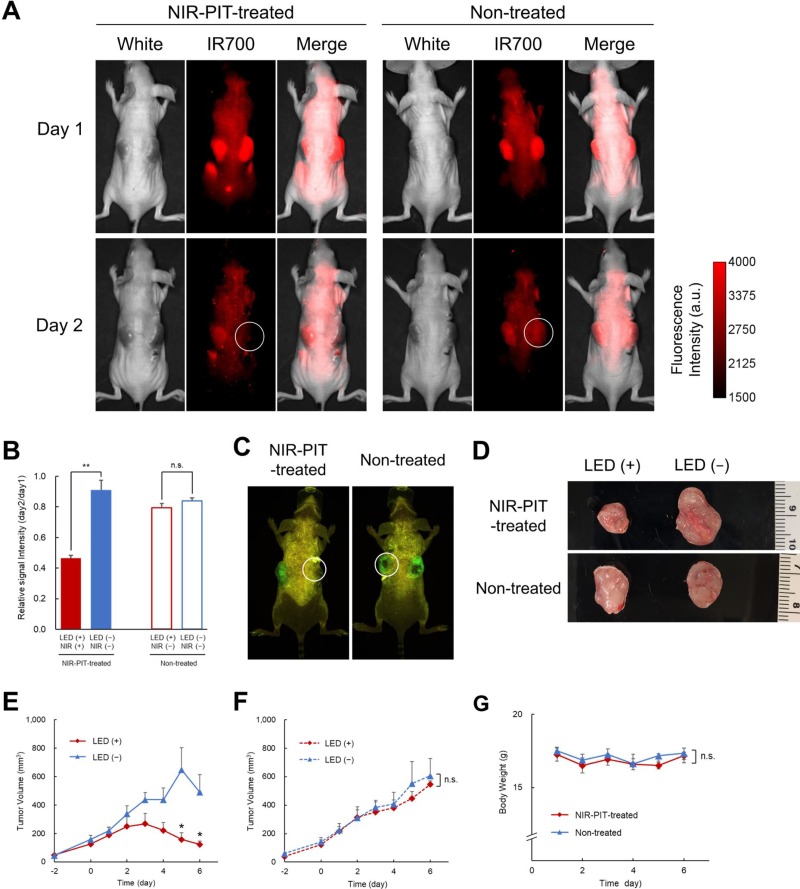
Figure 5. In vivo NIR-PIT in mice: results.
(A) IR700 fluorescence images on day 1 (top) and day 2 (bottom) of treated (left) and non-treated (right) mice. White circles indicate the NIR-LED in treated mice and the dummy LED in non-treated mice. (B) The relative signal intensity (day2/day1) of IR700 on LED (+)_NIR (+) tumor in treated mice was significantly lower than in tumors with no LED whereas no significant difference in relative signal intensity between the dummy LED (LED (+)_NIR (−)) tumor and the tumor with no LED was detected in non-treated mice (n = 6 treated mice, n = 3 non-treated mice) (**p < 0.01). (C) GFP fluorescence imaging on day 6 showed that the intensity in LED (+)_NIR (+) tumors in treated mice was lower than in (LED (+)_NIR (−)) tumors in non-treated mice. (D) Ex vivo images of tumors in treated (top) and non-treated (bottom) mice, showing reduced tumor size in NIR-LED exposed tumors compared to dummy LED and to tumors with no LED. (E) Tumor volume as a function of time in LED (+)_NIR (+) tumors and LED (−)_NIR (−) tumors in treated mice. The chart shows that tumor growth was suppressed in LED (+)_NIR (+) tumors (n = 6 treated mice). The differences between LED (+)_NIR (+) and LED (−)_NIR (−) tumors were statistically significant on day 5 and 6 (*p = 0.011, p = 0.010, respectively). (F) Tumor volume as a function of time in LED (+)_NIR (−) tumors and LED (−)_NIR (−) tumors in non-treated mice. No significant difference in volume was observed between the two tumors in non-treated mice (n = 3 non-treated mice). (G) Body weight as a function of time in treated and non-treated mice. The chart shows that body weights did not change during experiments in neither group (n = 6 treated mice, n = 3 non-treated mice).

