Abstract
Purpose
The purpose of this study is to develop and evaluate a custom-designed 7T magnetic resonance imaging (MRI) coil and explore its use for upper extremity applications.
Methods
An RF system composed of a transverse electromagnetic transmit (TEM) coil and an 8-channel receive-only array was developed for 7T upper extremity applications. The RF system was characterized and evaluated using scattering parameters and B1+ mapping. Finite difference time domain (FDTD) simulations were performed to evaluate the B1+ field distribution and specific absorption rate (SAR) for the forearm region of the upper extremity. High Resolution 7T images were acquired and compared to 3T.
Results
The simulation and experimental results show very good B1+ field homogeneity across the forearm. High resolution images of musculo-tendinous, osseo-cartilagenous and neuro-vascular structures in the upper extremity are presented with T1-volumetric interpolate breath-hold exam (VIBE), T2-double-echo steady state (DESS), T2*-susceptibility weighted imaging (SWI), Diffusion tensor Imaging (DTI), and Time-of-flight (TOF) sequences. Comparison between 3T and 7T is shown. Intricate contextual anatomy can be delineated in synovial, fibrocartilagenous, interosseus and intraosseus trabecular structures of the forearm as well as palmar and digital vascular anatomy (including microvascular detail in SWI).
Conclusion
UHF 7T imaging holds great potential in improving the sensitivity and specificity of upper extremity imaging especially in wrist, hand pathology secondary to bone, ligament, nerve, vascular, and other soft or hard tissue etiology.
Keywords: Upper extremity ultra-high field (7T) Imaging, 3T, RF Coil, FDTD, SAR, Diffusion (Nerve) imaging, Musculoskeletal, and non-contrast enhanced angiography
Graphical abstract
An RF system composed of a transverse electromagnetic transmit (TEM) coil and an 8-channel receive-only array was developed for 7T upper extremity applications. Ultra high-resolution images of musculo-tendinous, osseo-cartilagenous and neuro-vascular structures in the upper extremity are presented with T1-VIBE, T1-GRE, T2-DESS, T2-SWI, DTI, DSI and TOF sequences. UHF 7T imaging holds great potential in improving the sensitivity and specificity of upper extremity imaging especially in areas related to wrist, hand pathology secondary to bone, ligament, nerve, vascular, and other soft or hard tissue etiology.
Introduction
MRI is a favored imaging modality for soft tissue imaging (with or without contrast) for a wide range of upper extremity pathologies including diagnosis and monitoring of several medical conditions. These include acute trauma and sports-related injuries, occult fractures, peripheral neuropathy (1), sporadic inclusion body myositis (2), inflammatory (muscle) myopathies (3), nerve entrapment syndromes (4), soft tissue dystrophic lesions and avascular necrosis (5), cartilage (6), tendon, and joint conditions (edema, synovitis, dactilytis, and enthesis) (7). Most upper extremity MR procedures are currently performed at field strengths of 1.5T and/or 3T. Compared to Food and Drug Administration (8) approved clinical systems (1.5T and 3T), 7T imaging can enhance some of the upper extremity clinical applications. These include i) sequential monitoring of regeneration after peripheral nerve (PN) repair (9, 10) which is critical for evaluation of re-innervation and in planning treatment strategies, and ii) monitoring outcomes after vascular interventions (11) without the need for contrast agents.
Currently, MR imaging at ultra-high fields (UHF ≥7T) remains an investigational modality. Higher field strengths could theoretically augment resolution but the primary challenges of UHF imaging include similar, but much more intensified, problems encountered at 3T. These include in-homogeneities in the B1+ field (circularly polarized component of transverse magnetic field that excites the spins) distribution, elevated radiofrequency (RF) power deposition affecting local and global specific absorption rate (SAR), and chemical shift and other tissue contrast issues. All these aspects affect image quality and require specific improvements to UHF hardware design and imaging protocols (12-16). Optimization of UHF upper extremity technology and pulse sequences can improve the role and relevance of 7T MRI in imaging of soft tissue (muscle, vessel, nerve, cartilage, ligament and tendon), bone (trabecular and bone marrow characteristics) anatomy, and contextual structures (17). Much prior and ongoing clinical focus in UHF imaging has been in brain applications as opposed to human torso and extremities (except for the knee (18-20)).
In this work, we describe the design for an upper extremity RF system composed of a transverse electromagnetic (TEM) resonator transmit coil in conjunction with eight-channels receive-only insert array. We comprehensively evaluate the performance of the proposed RF coil system with experimentally measured and numerically calculated B1+ maps as well as SAR. We investigate a wide variety of imaging sequences including: T1 VIBE (T1 weighted volumetric interpolate breath-hold exam), T2 DESS (T2 weighted double-echo steady state), T2* SWI (susceptibility weighted imaging), TOF (time-of-flight) and DTI (diffusion tensor imaging) on a 7T human MRI scanner. We also compare images obtained at 7T (using the designed RF coil system) and at 3T (using a commercially available eight-channel extremity coil).
Materials and Methods
The transmit-only and receive-only approach offers the following distinct advantages:
The TEM coil design acts as a multi-conductor transmit coil. With a distributive type of capacitance, it is easier to separate the resonant modes and adjust the B1+ field distribution for better homogeneity over the region of interest (21, 22).
The high-density eight channel receive-only array can provide excellent signal-to-noise ratio (SNR), and contrast-to-noise ratio (CNR). In addition, the receive coil can be tuned and matched such that it can be used for forearm, elbow, wrist and finger imaging.
Transmit Coil Design
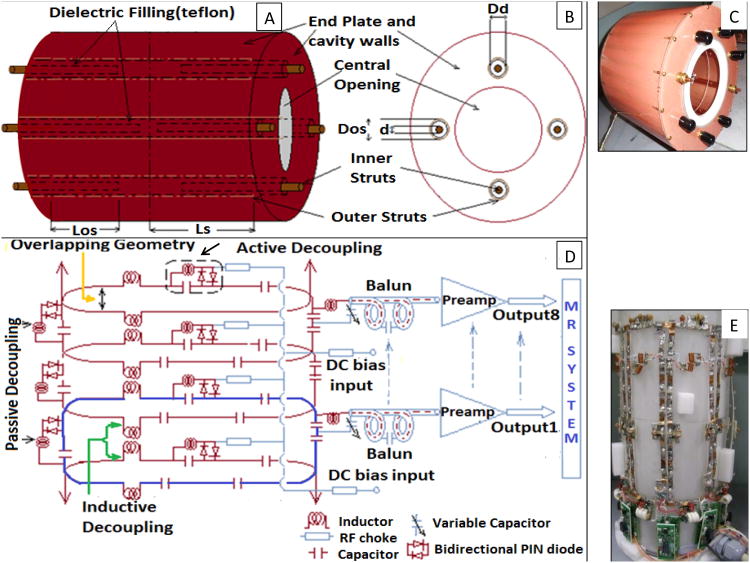
Given the low filling factor of arm/hand, a shielded design of actively detuned TEM resonator (22, 23) was adapted using 8 struts arranged along a concentric circle as shown in Figs. 1A and 1B. The inner and outer struts were separated by a dielectric sleeve (Teflon filling) as shown by arrow in Figs. 1A and 1B. In association with a conductive cylinder, this created a transmission line mechanism with the struts as inner conductors and the cavity wall as the outer conductor (inner/outer diameter of the cavity = 7.5/10.0 inch). The inner struts were electrically connected to the front and back end shield plates while the outer struts were electrically isolated by a small gap (0.5 inch) from end shield plates. The coil (Fig. 1C) was tuned by pulling/pushing the inner struts in and out of the cavity resonator. This movement ultimately changes the capacitance between inner and outer struts and therefore tunes the coil's mode of interest to 297.2 MHz. The system utilized an in-house made quad-hybrid for producing quadrature excitation. Other design parameters are shown in Table 1.
Figure 1.
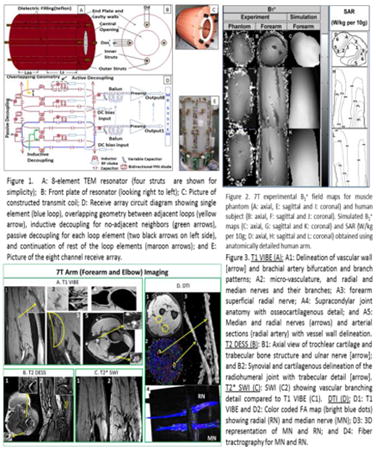
A: 8-element TEM resonator (four struts are shown for simplicity); B: Front plate of resonator (looking right to left); C: Picture of constructed transmit coil; D: Receive array circuit diagram showing single element (blue loop), overlapping geometry between adjacent loops (yellow arrow), inductive decoupling for no-adjacent neighbors (green arrows), passive decoupling for each loop element (two black arrows on left side), and continuation of rest of the loop elements (maroon arrows); and E: Picture of the eight channel receive array.
Table 1. TEM design parameters (See Fig. 1).
| Outer strut diameter (Dos) | 0.5 inch |
| Inner strut diameter (d) | 0.25 inch |
| Teflon filler outer diameter (Dd) | ∼0.5 inch |
| Distance from the center of the coil to the center of the outer strut (Lc) | 3.75 inch |
| Length of inner strut inside the cavity (Los) | ∼ 3-4 inch |
| Relative dielectric constant of Teflon (εr) | 2.1 |
| Distance from center of the outer strut to the outer conductor shield | 1.25 inch |
Transmit Active Decoupling method
As previously described (24, 25), the TEM elements were detuned by forward biasing with 100mA at 10V (as they are shunted to the outer conductor). During transmit mode, the coil functioned by reverse biasing PIN diodes (MA4P7446F-1091T, MA-COM, MA) with 30V. The selection of PIN diode was based on stray capacitance, switching speed, and heat capacity (25W power dissipation). 5.8uH RF chokes (J. W. Miller, CA, and Vishay, CT) were used to block the RF signal in the DC path whereas 5000pF American Technical Ceramics (ATC) capacitors were used for blocking DC in the RF path in order to control the long recovery time of low noise preamplifiers after input overload.
Receive Coil Design
In order to improve SNR over ROI (forearm and hand), eight inductively decoupled (26) surface loops (18 × 7 cm2) were distributed evenly on an acrylic former (McMaster Carr, Elmhurst, IL). A 5-mm wide copper foil with evenly distributed circumferential capacitors (ATC, Huntington Station, NY, USA; and Passive plus, Huntington, NY, USA) was utilized to achieve tuning at 297.2 MHz (Figs. 1D, 1E). Fig. 1D depicts the circuit diagram of three out of eight loops showing the overlapping geometry (yellow arrow), active (dotted rectangular marking) and passive (two black arrow) decouplers, balun and arrangement of the preamplifiers. Fig. 1E shows the eight-channel receive array configuration.
Receive Decoupling Method
Neighboring elements were decoupled using overlapping (yellow arrow in Fig. 1D) distance to minimize mutual inductance. The sole use of this technique however restricts the geometrical layout of the array and is ineffective in minimizing coupling on the next nearest neighboring array. Therefore, inductive decoupling (as shown in Figs. 1D (green arrow) and 1E) and low impedance pre-amplifier decoupling through the use of ‘tank circuit’ (26) were implemented to reduce coupling caused by non-adjacent loops. In addition to passive decoupling circuit, each loop contains an active decoupling circuit (as shown with black arrow in Fig. 1D) which turns ON (during transmit operation) using DC bias voltage from MR system. This functionality is important for the combined transmit-receive system since the transmit coil's emitted electromagnetic waves could create significant voltage on the receive loops damaging the receive preamplifiers (if active decouplers do not properly function).
FDTD Modeling
Growing demand for UHF technologies necessitates the use (in terms of design as well as evaluation) of full wave rather than low-frequency, lumped-circuit approaches. As the operational wavelength becomes closer to the RF coil dimensions and electrical size of load, full wave analysis becomes essential in predicting the electromagnetic interactions between the tissues and RF coil (27). In this work, the TEM volume resonator and the anatomically detailed human hand model were modeled as a single system (Figs. 2A and 2B show 3D view of the coil struts and side view of the human arm model, respectively) using finite difference time domain (FDTD) method. Our in-house FDTD package involved the modeling of the excitation sources using a transmission line model which allows for accurate calculations of the coupling and the input impedance (14, 28). MATLAB was used to create the grid of the resonator geometry. A 3D computational grid composed of 188×188×270 Yee cells (29) with spatial resolution of 1.58mm (dx=dy=dz) and temporal resolution of 3 × 10(-12) sec (used to meet the Courants stability criteria (30)) was developed. The computational domain was surrounded by 32 perfectly matched layers (PML) placed on the top and bottom of the coil model and 12 PMLs surrounding the coil model (as shown in Fig. 2C) in order to absorb electromagnetic waves radiated by the coil (31, 32). The original 1mm Duke male model (33) (age: 34, height: 1.74 m, weight: 70 kg, body mass index (bmi): 23.1 kg/m2) was rescaled to a resolution of 1.58×1.58×1.58 mm3.
Figure 2.
A: FDTD model of TEM coil (excitation ports shown by yellow circles); B: Side view (YZ slice) with human arm model positioned inside TEM structure (showing struts in green, and shield in red); and C: Top view (XY slice) showing all 8 elements of the coil and locations of the PMLs.
RF Power and Specific Absorption Rate (SAR)
At UHF frequency, the most important safety concern is the local absolute temperature maintained over a prolonged time (thermal dose). The supplied RF power to the coil can be approximately calculated as the sum of the radiated (escaping the coil without getting absorbed in tissue), the absorbed power (in tissue), power lost through coupling and the power dissipated in the coil and RF shield (34). Since tissue dissipation and RF heating concerns are associated with the power absorbed in tissue, we investigated the power absorbed in the human model. The total power absorbed is scaled to obtain a mean (in ROI) and continuous B1+ field intensity of 1.957 μT, which is the field strength required to produce a flip angle of π/2 with a 3-ms rectangular RF pulse. The linearity of Maxwell's equation helps in calculating the absorbed power as Feed Voltage ∝ E ∝ H; and therefore, the absorbed Power ∝ E2 ∝ B1+2 where E and H are the electric and magnetic field intensities, and ∝ indicates linear dependence. Therefore the absorbed power in a tissue of a given density from transmit RF coil is described as SAR. In FDTD, the SAR is calculated utilizing our in-house FDTD package as:
Where ρ(i,j,k) is tissue mass density (unit: kg/m3), and σ(i,j,k) is tissue conductivity (unit: S/m) at the (i, j, k) location. Ex, Ey, and Ez (V/m) are the magnitudes of the electric field components in the x, y, and z directions, respectively. By summing the SAR from all tissues, an indication of the total power deposition can be obtained. SAR is presented in the unit W/kg per 10 gm of tissue by continuously averaging finite number of FDTD cells which results in approximately achieving an averaged SAR value over any 10 gm of tissue.
Experimental Imaging Protocols
All the workbench measurements were performed using a calibrated vector network analyzer (Agilent E5062A ENA series, CA, USA) together with a multi-port S parameter test set (87050EA, Agilent, CA, USA). All MR experiments were performed on 3T and 7T whole body human scanners (Siemens Healthcare, Erlangen, Germany). All imaging experiments were collected on three healthy volunteers recruited under the approval of a University of Pittsburgh Institutional Review Board (IRB). All the pulse sequences parameters are listed in Table 2. Noise correlation measurements were acquired by setting RF amplitude to 0 V with TR = 2000, TE = 0.15, Number of acquisition = 1, Acquisition duration= 204 ms, Vector size =2048, bandwidth = 10 KHz. Accelerated images were acquired for AF = 0, 1, 2 and 4 for T1W VIBE sequence.
Table 2. 7T musculoskeletal imaging protocols used to acquire MR images (see Figs. 4, 5, 7 to 9).
| ISO Sequences | Orientation | FOV | TR/TE (ms) | Slices |
|---|---|---|---|---|
| T2 DESS | Coronal | 105 × 160mm (294 × 448) | 18/5.2 | 238 |
| T1 VIBE | Coronal | 95 × 160mm (304 × 512) | 12/4.5 | 288 |
| T2 SWI | Axial | 105 × 160mm (336 × 512) | 23/15 | 128 |
| DTI (Dir:64, b=0,1300) | Axial | 700 × 620mm (490 × 434) | 7000/83 | 65 |
| TOF | A/S/C | 85 × 208mm (236 × 640) | 12/4.5 | - |
| B1+ map Seq. | Axial | 140 × 140mm (64 × 64) | 2000/2.5 | 88 |
SNR was measured and listed in the Results section. At 7T, the above described RF coil system was used; at 3T, a dedicated eight-channel knee coil (Siemens, Erlangen, Germany) was used. Within both systems, the coils were positioned in the center of the magnet bore during the scan. The subjects are placed in a prone position with pillow for additional comfort.
Results
Coil Evaluation
Transmit Coil
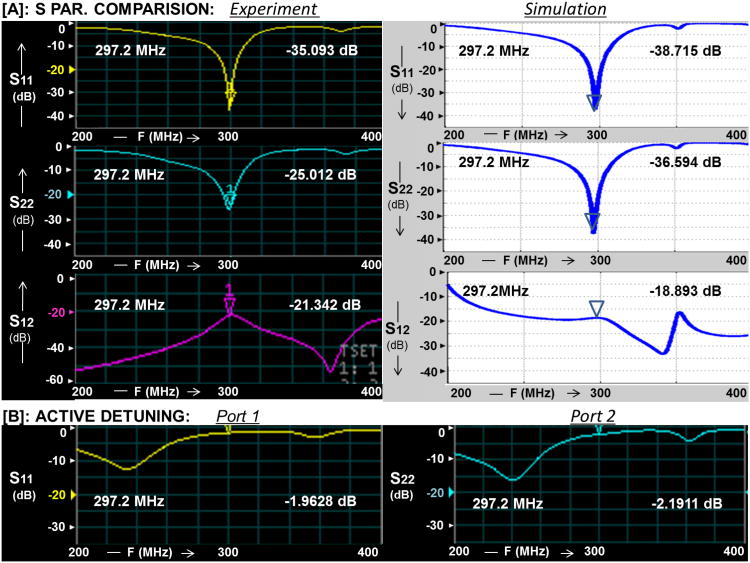
Bench Measurements: The S-parameters were measured and shown in Fig. 3. The measured reflection coefficients (S11, S22) were greater than or equal to -23 dB under loaded (forearm) condition and -20dB for muscle phantom with conductivity of 0.8 S/m and relative permittivity of 79 (measured with DAK SPEAEG system Zurich). Fig. 3A shows excellent agreement between the FDTD calculated scattering parameters (S11, S22 and S12) and that measured utilizing the network analyzer. The transmission coefficient (Isolation, S12) was ≤ -18 dB (<3%) as shown in Fig. 3A. The Q factor unloaded to loaded ratio of the TEM volume resonator was 240/90.
Bench Measurements: The tuning and matching of the transmit coil were minimally affected by the receive loops after turning on the active decoupling (see Fig. 3B for Ports 1 and 2).
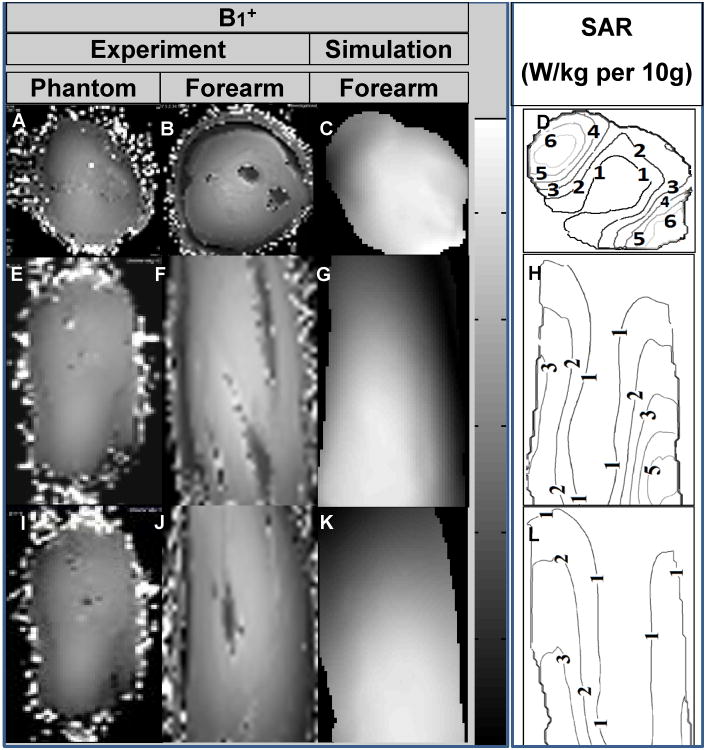
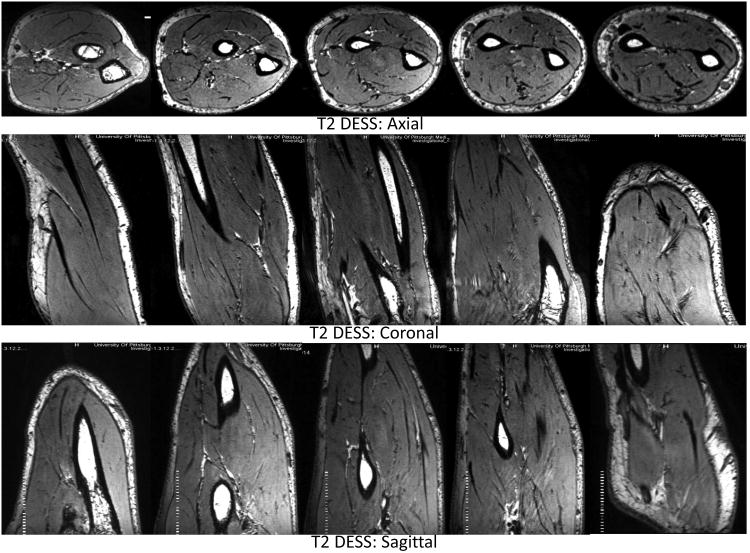
Imaging Measurements: Measured B1+ maps demonstrate very good agreement with the simulated B1+ field distribution as shown in Fig. 4. The B1+ field coverage and homogeneity are excellent except near the drive ports (towards wrist). Homogenous T2W DESS images shown in axial, coronal and sagittal planes covering the whole volume of the forearm are demonstrated in Fig. 5.
Simulations: The FDA (35) and International European Commission (IEC) (36) have formulated safety limits based on SAR. In the extremities, the IEC 60601-2-33 states that MRI systems must limit locally deposited RF power to under 20 W/kg/10g under combined mode of tissue without cranial exposure (36). For 3ms square RF pulse, a B1+ field intensity of 1.97μT is required to generate 90° excitation. Based on a continuous 1.97μT (averaged over the volume of the arm inside the TEM coil), the average SAR is 2.02 W/Kg and peak SAR is 8.98 W/Kg/10g. As expected with smaller (when compared to the human head at 7T) electrical size loads, the simulated SAR (Fig. 4) shows higher SAR intensities near the periphery (37).
Figure 3.
A: Correlation between the FDTD calculated scattering parameters (S11, S22 and S12) and that measured utilizing the network analyzer for the TEM coil; and B: TEM active Detuning (with DC ON) for S11 and S22.
Figure 4.
7T experimental B1+ field maps for muscle phantom (A: axial, E: sagittal and I: coronal) and human subject (B: axial, F: sagittal and J: coronal). Simulated B1+ maps (C: axial, G: sagittal and K: coronal) and SAR (W/kg per 10g; D: axial, H: sagittal and L: coronal) obtained using anatomically detailed human arm.
Figure 5.
7T T2 DESS over the complete volume of forearm in axial (elbow to wrist), coronal and sagittal planes.
Receive Array
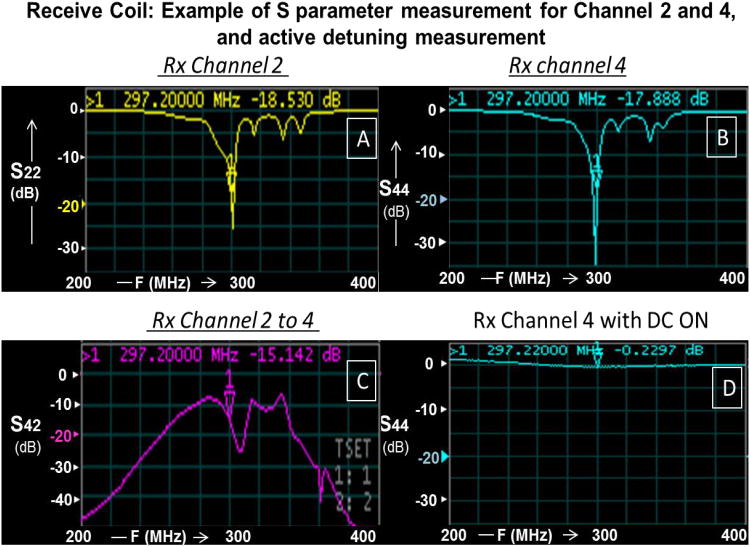
Bench measurements: All eight receive channels had a minimum reflection coefficient of -15dB (as shown in Figs. 6A and 6B for Rx Channels 2 and 4) and transmission coefficient (between adjacent neighbors and next to adjacent neighbors) ≤ -13 dB (< 5 %, as shown in Fig. 6C). These isolation measurements were carried out inside the resonator while decoupling the transmit coil using active DC bias.
Bench measurements: Active decoupling was measured to be ≤ -18 dB using a decoupled flux probe and switching the power supply mode (E530712, Hewlett-Packard (HP) universal power source, USA). Also, active detuning circuit was turned ON using DC bias and measured on network analyzer as shown in Fig. 6D (Rx Channel 4 with DC ON).
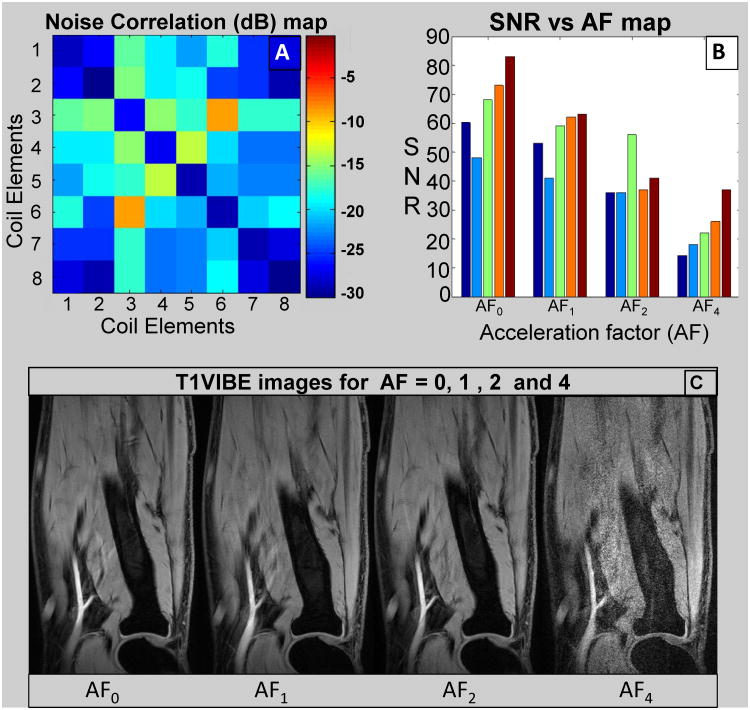
Imaging Measurements: Fig. 7A shows typical noise correlation matrix for receive only array acquired using the 7T system. The average off-diagonal correlation is -20.5dB and only higher coupling (-9.7dB) was found between opposite elements 3 and 6.
Imaging Measurements: Fig. 7B shows measured SNR for five slices throughout the forearm for each acceleration factor (AF = 0, 1, 2, and 4). The average SNR (mean of five slices) falls down to one third for AF = 4 (SNR = 23) compared to AF = 0 (SNR = 66) where SNR for AF = 1 and AF = 2 were 56 and 41 respectively. For AF = 0, 1, and 2, the quality goes from excellent to good (based on clear delineation of various anatomical structure) but it becomes substantially blurry for AF = 4 as shown in Fig. 7C.
Figure 6.
Receive Coil Measurements. A: S22 measurement (Channel 2 of 8); B: S44 measurement (Channel 4 of 8); C: S42 (isolation) measurement (Channels 2 and 4); and D: Active Detuning (with DC ON) for Channel 4.
Figure 7.
A: Noise correlation matrix for receive only array; B: SNR vs acceleration factor (AF) map, each set (five bars) represents five slices throughout the forearm volume; and C: Respective images (center slice) for AF as shown in B.
In-vivo imaging
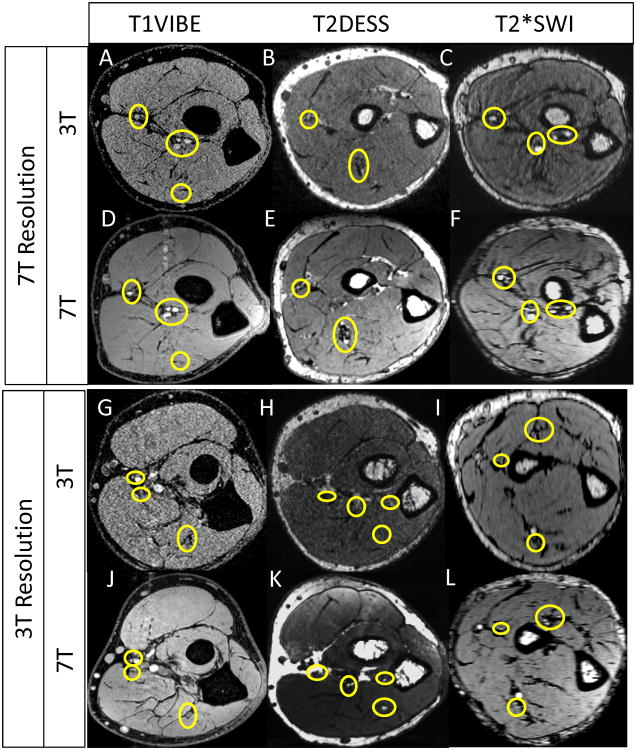
Fig. 8 shows comparison of 3T vs 7T for three sequences (T1 VIBE, T2 DESS and T2* SWI). 3T and 7T protocols were optimized for same scanning time comparing i) higher resolution 3T vs 7T Protocol (the protocol was optimized for best 7T quality/resolution and the same scans were acquired for 3T) ii) lower resolution 3T vs 7T protocol (the protocol was optimized for best 3T quality/resolution and the same scans were acquired at 7T).
Figure 8.
3T vs. 7T imaging. Protocols are described in Table 2. The circles show nerve and small vessel finding in 3T vs 7T.
T1 VIBE
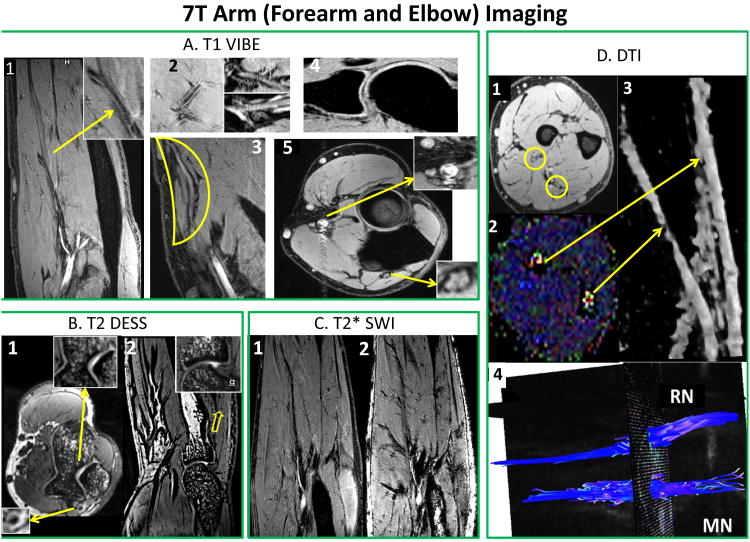
Figs. 9A1-5 demonstrate high resolution T1 VIBE images identifying various anatomical structures as follows:
Figure 9.
T1 VIBE (A): A1: Delineation of vascular wall [arrow] and brachial artery bifurcation and branch patterns; A2: micro-vasculature, and radial and median nerves and their branches; A3: forearm superficial radial nerve; A4: Supracondylar joint anatomy with osseocartilagenous detail; and A5: Median and radial nerves (arrows) and arterial sections (radial artery) with vessel wall delineation. T2 DESS (B): B1: Axial view of trochlear cartilage and trabecular bone structure and ulnar nerve [arrow]; and B2: Synovial and cartilagenous delineation of the radiohumeral joint with trabecular detail [arrow]. T2* SWI (C): SWI (C2) showing vascular branching detail compared to T1 VIBE (C1). DTI (D): D1: T1 VIBE and D2: Color coded FA map (bright blue dots) showing radial (RN) and median nerve (MN); D3: 3D representation of MN and RN; and D4: Fiber tractrography for MN and RN.
A1: forearm (vessel wall delineation [arrow], brachial artery and its branches;
A2: micro-vasculature; radial and median nerves and its branches;
A3: forearm superficial radial nerve;
A4: supracondylar joint anatomy with osseocartilagenous detail; and
A5: median and radial nerves (arrows) and arterial sections (radial artery) with vessel wall delineation.
T2 DESS
High resolution T2 3D gradient echo imaging is carried out by DESS sequence. Figs. 9B1 and 9B2 show excellent high intensity signal separating nerves (B1) and exquisite contrast for viewing cartilage and synovial fluid (B2) with excellent cartilage delineation and joint structures.
T2* SWI (typically not used in upper extremity imaging)
Fig. 9C shows improved contrast that is complementary to conventional spin-density, T1, and T2 imaging methods (38). Fig. 9C1 shows T1 VIBE image displaying axial section with vascular branching detail. Fig. 9C2 shows the corresponding SWI image with marked enhancement of vascular patterns of brachial and radial arteries, and muscular perforators.
DTI
Figs. 9D1 and 9D2 represent T1 VIBE (D1) and FA color coded map (D2) slices in forearm identifying radial (RN) and median nerve (MN) locations [yellow circles]. Fig. 9D3 shows 3D view of both corresponding nerves [stretched yellow arrows]. Also, Fig. 9D4 shows the fiber tractrography for median and radial nerve after post-processing using DSI studio (39).
MRI (Non-contrast) Angiography
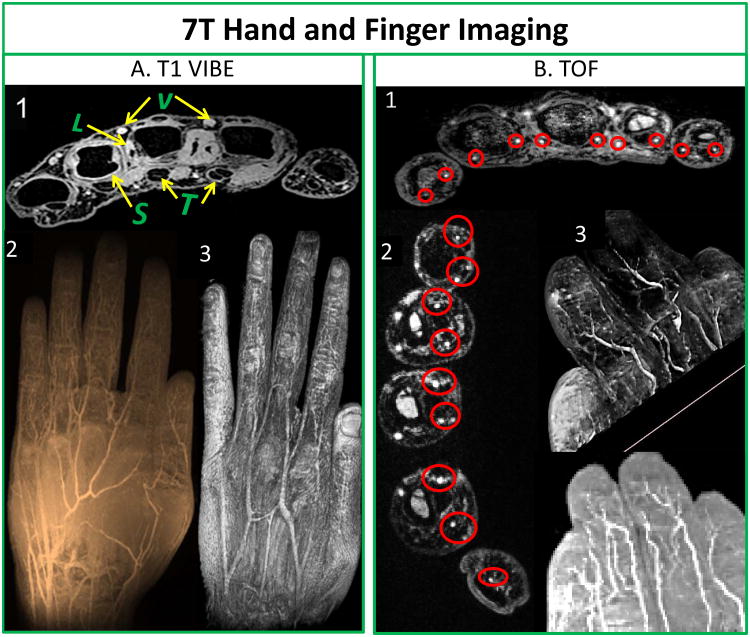
Fig.10 shows not only first and second order arteries (superficial palmar and deep palmar arch) but also smaller proper palmar digital arteries in fingers and its pulps. Fig. 10A1 depicts cross-sectional transmetacarpal view highlighting intrinsic muscles, flexor and extensor tendon apparatus with synovial sheaths as well as ligamentous structures, and intermetacarpal vasculature. Fig. 10A2 shows minimum intensity projection and Fig. 10A3 shows 3D texture reconstruction of the hand. Fig. 10B1 also shows excellent depiction of all proper palmer digital arteries, digital tendons and synovial sheaths on transverse view in the fingers towards the palm. Fig. 10B2 shows transverse slice close to the finger tips showing capillaries branching out. Fig. 10B3 demonstrates capillaries in the finger pulp utilizing volume rendering and minimum intensity projection.
Figure 10.
T1 VIBE (A): A1: Cross-sectional trans-metacarpal view highlighting intrinsic muscles, flexor and extensor tendon (T) apparatus with synovial sheaths (S), as well as ligamentous structures (L), and inter-metacarpal vasculature (V); A2: Minimum intensity projection image; and A3: 3D texture reconstruction of hand. Non contrast enhanced TOF (B): B1: Proper palmar digital arteries, digital tendons and synovial sheaths on axial view (red circles) in fingers towards palm; B2: Digital arteries and its microvasculature close to finger tips in the hand (red circles); and B3: Volume rendering of fingers and minimum intensity projection showing digital arteries and its branches including the capillaries in finger pulps.
Discussion and Conclusion
RF Coil
This is the first successful demonstration of a homogeneous volume resonator in conjunction with an eight channel receive only array for targeted field of view UHF upper extremity imaging. This RF coil system was optimized for the human forearm but can be utilized to image the hand, wrist, arm or even elbow as there is no significant change in tuning properties. With a small filling factor, the use of combined transmit and receive coil is ideal to detect the incoming signal with nearly homogeneous excitation (40-43). Furthermore, the transmit coil's B1+ field homogeneity can be further improved with more elements. It is also noted that there are other designs such as a smaller loop (44) or birdcage coil (45) that can be used in transmit–receive design for specific applications like the wrist or joint.
Since the receive array does not significantly affect the distribution or intensity of the B1+ field (46), it could be replaced with higher density designs with acceptable decoupling/isolations (12-16 channels given satisfactory isolation between receive elements as shown in 32-channel head arrays (47)). Additional channels would further improve the SNR of RF coil system. In addition to overlapping geometry and inductive decoupling, preamp decoupling is also extremely important to achieve desired operation. This is necessary because ionic currents in the tissues can induce electromagnetic force in the Rx array which can cause correlated noise in the coil and reduction in SNR values (26, 48).
The Tx coil and Rx-only insert sizes were chosen to accommodate for anthropometric parameters consistent with bigger forearms. That helps the coil to be positioned comfortably anywhere from the arm (shoulder) to the hand (including digits). The coil placement allows the patient to lay comfortably on a padded MRI table in prone (superman or statue of liberty) position with arm or forearm in extension for the duration of the study. In order to make the use of the coil safe, 1) the preamplifiers were kept close to matching circuit and balun, and 2) extra consideration was given to cable arrangement by keeping the cables away from patient.
3T vs. 7T
Visualization of small forearm vessels and nerves in both the superficial and deep soft tissues at high and low resolution 7T imaging is clearly superior to that of 3T imaging (as marked by yellow circles in Fig. 8). Delineation of muscle fibers/fascial plane interfaces as well as cortical bone/soft tissue interfaces is significantly enhanced at 7T illustrating the benefit of higher CNR. When compared to 3T, Fig. 8 also shows superior delineation of the radial and median nerves, small vessel detail without the use of contrast agents, higher delineation of muscle planes, and detail of osseous trabecular. Specifically, the superior eminence of small vessels (and finer details of soft tissues) is the result of overall less noise at 7T compared to the 3T images. Noting that two different coil designs were utilized at 3T and 7T but both contained 8 receive channels, the overall clarity of the 7T images as compared to 3T demonstrates the advantage of having the high SNR ratio associated with higher field strength.
Characterization of 7T Images
According to a Musculoskeletal radiologist, AFs = 0, 1 and 2 (Fig. 7C) provide excellent quality to depict various anatomical structures (nerves, macro-and-micro vasculature, cartilage, synovial fluidic areas between cartilage, tendons, ligaments, osseous bone anatomy). On the other hand, AF = 4 results in poor image quality (Fig. 7C).
MR Diffusion imaging accesses water diffusion parameters like fiber anisotropy (FA) and apparent diffusion coefficient (ADC) in nerves. This can be a non-invasive and non-disruptive strategy for sequential assessment of pre and post-surgeries including post-surgical nerve regeneration repair, or transplantation related outcomes. As a result, reconstructive surgeries and/or evaluation of transplantations (10, 49) may use i) volume (and texture) based rendering and ii) 3D depiction of the course of the peripheral nerves (as shown Fig. 9D). As shown in Fig. 9, 7T provides superior delineation of the radial and median nerves, without the use of contrast agents.
Contrast-enhanced MR angiography using commercial MR scanners (≤ 3T) has been used extensively in imaging of intracranial vessel diseases (50, 51) and 7T imaging has also been explored (52). Limited, if any, imaging with 7T MRI has been reported of the extremities except specifically focusing on the wrist (53) or hand (54) with limitation to the palmer vasculature. The current work goes beyond wrist and palmer region to high resolution non-contrast enhanced imaging of digital arteries in finger and its pulps as shown in Fig. 10 (TOF). The fact that this may be accomplished without the use of intravenous contrast is invaluable in patients with vasculitis associated with either autoimmune disorders or diabetes as these diseases often have concomitant renal vasculitis and renal insufficiency.
Moreover, detection of small vessel anatomy using high resolution 7T imaging has a potential in preoperative planning (55) of neovascularity associated with both soft tissue as well as osseous tumors. 7T TOF imaging also allows for excellent depiction of microvascularity of the hand, forearm, and hand (wrist) which may be invaluable in upper extremity surgery and/or monitoring the microvascularity integrity as it relates to certain vascular disease processes (56, 57). In addition, SWI (Fig. 9C2) could be especially useful in various micro-vascular conditions such as vascular trauma, abnormalities, visualizing blood products and the vascularization of tumors, and high-resolution MR venography (38, 58, 59)
In conclusion, the in-house built TEM volume resonator in conjunction with an eight channel receive only array was designed, built and successfully evaluated at 7T to confirm the potential for next generation UHF imaging in upper extremity applications. A wide variety of outstanding images with high spatial resolution, SNR, and CNR were achieved and compared favorably to those aquired at 3T.
Table 3. 7T and 3T protocols (See Fig. 8).
| MRI System: Imaging: Parameters |
7T TR/TE Fov/Acquisition Matrix Scan time/Slices |
3T TR/TE Fov/Acquisition Matrix Scan time/Slices |
|---|---|---|
| T1VIBE: 7T-Resolution |
12/4.49 ms 95 × 160 mm2/277 × 512 5:34 min/288 |
12/5.21 ms 95 × 160 mm2/277 × 512 5:34 min/288 |
| T1VIBE: 3T-Resolution |
12/4.47 ms 93 × 100 mm2/273 × 320 4:36 min/288 |
12/5.14 ms 95 × 159 mm2/191 × 352 4:01 min/288 |
| T2 DESS: 7T-Resolution |
18/5.22 ms 105 × 160 mm2/270 × 448 4:43 min/288 |
18/5.22 ms 105 × 160 mm2/270 × 448 4:43 min/288 |
| T2 DESS: 3T-Resolution |
18/5.22 ms 91 × 140 mm2/193 × 320 3:36 min/176 |
18/5.22 ms 104 × 159 mm2/232 × 384 4:08 min/240 |
| T2*SWI: 7T-Resolution |
23/15 ms 105 × 160 mm2/302 × 512 6:08 min/128 |
23/14.2 ms 118 × 180 mm2/302 × 512 6:08 min/128 |
| T2* SWI: 3T-Resolution |
23/15 ms 118 × 180 mm2/227 × 384 4:42 min/128 |
23/14.2 ms 118 × 180 mm2/227 × 384 4:42 min/128 |
Acknowledgments
Grant Support: The work was partially funded by the United States National Institute of Health (NIH) and Department of Defense (DOD)
Abbreviations used
- UHF
Ultra-High Field
- RF
Radio Frequency
- MRI
Magnetic Resonance Imaging
- UE
Upper Extremity
- TEM
Transverse Electromagnetic
- B1+
circularly polarized component of transverse magnetic field that excites the spins
- Tx
Transmit
- Rx
Receive
- #
Number
- FDTD
Finite Difference Time Domain
- SAR
Specific Absorption Rate
- SNR
Signal -to-Noise Ratio, CNR, Contrast-to-Noise Ratio
- 3D
3Dimentional
- T1 VIBE
T1-Volumetric Interpolate Breath-hold Exam
- T2 DESS
T2-Double Echo Steady State
- SWI
Susceptibility Weighted Imaging
- TOF
Time-of-Flight
- DTI
Diffusion Tensor Imaging
- FDA
Food and Drug Administration
- ROI
Region of Interest
- ATC
American Technical Ceramics
- IRB
Institutional Review Board
- AOI
Anatomy of Interest
- IEC
International European Commission
- HP
Hewlett-Packard
- AF
Acceleration Factor
References
- 1.Du R, Auguste KI, Chin CT, Engstrom JW, Weinstein PR. Magnetic resonance neurography for the evaluation of peripheral nerve, brachial plexus, and nerve root disorders Clinical article. J Neurosurg. 2010;112(2):362–71. doi: 10.3171/2009.7.Jns09414. [DOI] [PubMed] [Google Scholar]
- 2.Cox FM, Reijnierse M, van Rijswijk CSP, et al. Magnetic resonance imaging of skeletal muscles in sporadic inclusion body myositis. Rheumatology. 2011;50(6):1153–61. doi: 10.1093/rheumatology/ker001. [DOI] [PubMed] [Google Scholar]
- 3.Kuo GP, Carrino JA. Skeletal muscle imaging and inflammatory myopathies. Current opinion in rheumatology. 2007;19(6):530–5. doi: 10.1097/BOR.0b013e3282efdc66. [DOI] [PubMed] [Google Scholar]
- 4.Miller TT, Reinus WR. Nerve Entrapment Syndromes of the Elbow, Forearm, and Wrist. Am J Roentgenol. 2010;195(3):585–94. doi: 10.2214/AJR.10.4817. [DOI] [PubMed] [Google Scholar]
- 5.Steinbach LS, Smith DK. MRI of the wrist. Clinical imaging. 2000;24(5):298–322. doi: 10.1016/s0899-7071(00)00218-7. [DOI] [PubMed] [Google Scholar]
- 6.Shindle MK, Foo LF, Kelly BT, Khanna AJ, Domb BG, Farber A, Wanich T, Potter HG. Magnetic resonance imaging of cartilage in the athlete: Current techniques and spectrum of disease. J Bone Joint Surg Am. 2006;88A:27–46. doi: 10.2106/JBJS.F.00614. [DOI] [PubMed] [Google Scholar]
- 7.Eshed I, Bollow M, McGonagle DG, Tan AL, Althoff CE, Asbach P, Hermann KGA. MRI of enthesitis of the appendicular skeleton in spondyloarthritis. Ann Rheum Dis. 2007;66(12):1553–9. doi: 10.1136/ard.2007.070243. [DOI] [PMC free article] [PubMed] [Google Scholar]
- 8.Sarwar G, Schmeisky H, Hussain N, Muhammad S, Ibrahim M, Safdar E. Improvement of soil physical and chemical properties with compost application in rice-wheat cropping system. Pak J Bot. 2008;40(1):275–82. [Google Scholar]
- 9.Aagaard BD, Lazar DA, Lankerovich L, Andrus K, Hayes CE, Maravilla K, Kliot M. High-resolution Magnetic Resonance Imaging Is a Noninvasive Method of Observing Injury and Recovery in the Peripheral Nervous System. Neurosurgery. 2003;53(1):199–204. doi: 10.1227/01.NEU.0000069534.43067.28. [DOI] [PubMed] [Google Scholar]
- 10.Takagi T, Nakamuraa M, Yamadae M, Hikishima K, Momoshima S, Fujiyoshi K, Shibata S, Okano HJ, Toyama Y, Okano H. Visualization of peripheral nerve degeneration and regeneration: Monitoring with diffusion tensor tractography. NeuroImage. 2009;44(3):884–92. doi: 10.1016/j.neuroimage.2008.09.022. [DOI] [PubMed] [Google Scholar]
- 11.Robinson SP, Rijken PF, Howe FA, Mccsheehy PM, van der Sanden B, Heerschap A, Stubbs M, van der kogel AJ, Griffiths JR. Tumor Vascular Architecture and Function Evaluated by Non-Invasive Susceptibility MRI Methods and Immunohistochemistry. JMRI. 2003;17:445–54. doi: 10.1002/jmri.10274. [DOI] [PubMed] [Google Scholar]
- 12.Wiggins GC, Potthast A, Triantafyllou C, et al. Eight-channel phased array coil and detunable TEM volume coil for 7 T brain imaging. Magnet Reson Med. 2005;54(1):235–40. doi: 10.1002/Mrm.20547. [DOI] [PubMed] [Google Scholar]
- 13.Vaughan JT, Garwood M, Collins CM, et al. 7T vs. 4T: RF power, homogeneity, and signal-to-noise comparison in head images. Magnet Reson Med. 2001;46(1):24–30. doi: 10.1002/Mrm.1156. [DOI] [PubMed] [Google Scholar]
- 14.Ibrahim TS, Hue YK, Tang L. Understanding and manipulating the RF fields at high field MRI. Nmr Biomed. 2009;22(9):927–36. doi: 10.1002/Nbm.1406. [DOI] [PMC free article] [PubMed] [Google Scholar]
- 15.Zhao Y, Zhao T, Raval SB, et al. Dual optimization method of radiofrequency and quasistatic field simulations for reduction of eddy currents generated on 7T radiofrequency coil shielding. Magnetic resonance in medicine : official journal of the Society of Magnetic Resonance in Medicine / Society of Magnetic Resonance in Medicine. 2014 doi: 10.1002/mrm.25424. [DOI] [PMC free article] [PubMed] [Google Scholar]
- 16.Avdievich NI, Hetherington HP, Kuznetsov AM, et al. 7T Head Volume Coils: Improvements for Rostral Brain Imaging. Journal of Magnetic Resonance Imaging. 2009;29(2):461–5. doi: 10.1002/Jmri.21660. [DOI] [PMC free article] [PubMed] [Google Scholar]
- 17.Juras V, Welsch G, Bar P, Kronnerwetter C, Fujita H, Trattnig S. Comparison of 3 T and 7 T MRI clinical sequences for ankle imaging. Eur J Radiol. 2012;81(8):1846–50. doi: 10.1016/j.ejrad.2011.05.023. [DOI] [PubMed] [Google Scholar]
- 18.Regatte RR, Schweitzer ME. Ultra-high-field MRI of the musculoskeletal system at 7.0T. Journal of Magnetic Resonance Imaging. 2007;25(2):262–9. doi: 10.1002/Jmri.20814. [DOI] [PubMed] [Google Scholar]
- 19.Pakin SK, Cavalcanti C, La Rocca R, et al. Ultra-high-field MRI of knee joint at 7.0T: Preliminary experience. Acad Radiol. 2006;13(9):1135–42. doi: 10.1016/j.acra.2006.06.007. [DOI] [PubMed] [Google Scholar]
- 20.Moon CH, Kim JH, Zhao TJ, et al. Quantitative Na-23 MRI of Human Knee Cartilage Using Dual-Tuned H-1/Na-23 Transceiver Array Radiofrequency Coil at 7 Tesla. Journal of Magnetic Resonance Imaging. 2013;38(5):1063–72. doi: 10.1002/Jmri.24030. [DOI] [PubMed] [Google Scholar]
- 21.Bogdanov G, Ludwig R. Coupled microstrip line transverse electromagnetic resonator model for high-field magnetic resonance imaging. Magnet Reson Med. 2002;47(3):579–93. doi: 10.1002/Mrm.10083. [DOI] [PubMed] [Google Scholar]
- 22.Vaughan JT, Hetherington HP, Otu JO, et al. High-Frequency Volume Coils for Clinical Nmr Imaging and Spectroscopy. Magnet Reson Med. 1994;32(2):206–18. doi: 10.1002/mrm.1910320209. [DOI] [PubMed] [Google Scholar]
- 23.Roschmann P inventor; U.S. Philips Corporation, Tarrytown, N.Y., assignee. High-Frequency Coil System for A Magnetic Resonance Imaging Apparatus U.S.1988 Nov. 3, 1986. US patent US4746866 A. 1986
- 24.Vaughan JT, Adriany G, Garwood M, et al. Detunable transverse electromagnetic (TEM) volume coil for high-field NMR. Magnet Reson Med. 2002;47(5):990–1000. doi: 10.1002/Mrm.10141. [DOI] [PubMed] [Google Scholar]
- 25.Avdievich NI, Hetherington HP. High-field head radiofrequency volume coils using transverse electromagnetic (TEM) and phased array technologies. Nmr Biomed. 2009;22(9):960–74. doi: 10.1002/Nbm.1262. [DOI] [PubMed] [Google Scholar]
- 26.Roemer PB, Edelstein WA, Hayes CE, et al. The Nmr Phased-Array. Magnet Reson Med. 1990;16(2):192–225. doi: 10.1002/mrm.1910160203. [DOI] [PubMed] [Google Scholar]
- 27.Tang L, Hue YK, Ibrahim TS. Studies of RF Shimming Techniques with Minimization of RF Power Deposition and Their Associated Temperature Changes. Concept Magn Reson B. 2011;39B(1):11–25. doi: 10.1002/Cmr.B.20185. [DOI] [PMC free article] [PubMed] [Google Scholar]
- 28.Ibrahim TS, Mitchell C, Schmalbrock P, Lee R, Chakeres DW. Electromagnetic Perspective on the Operation of RF Coils at 1.5–11.7 Tesla. MRM. 2005;54:683–90. doi: 10.1002/mrm.20596. [DOI] [PubMed] [Google Scholar]
- 29.Yee KS. Numerical Solution of Initial Boundary Value Problems Involving Maxwells Equations in Isotropic Media. Ieee T Antenn Propag. 1966 Ap;14(3):302–&. [Google Scholar]
- 30.Taflove A, Hageness SC. Computational electrodynamics: the finite-difference time-domain method. 3rd. Boston: Artech House; 2005. [Google Scholar]
- 31.Berenger JP. Three-dimensional perfectly matched layer for the absorption of electromagnetic waves. J Comput Phys. 1996;127(2):363–79. doi: 10.1006/jcph.1996.0181. [DOI] [Google Scholar]
- 32.Berenger JP. A Perfectly Matched Layer for the Absorption of Electromagnetic-Waves. J Comput Phys. 1994;114(2):185–200. doi: 10.1006/jcph.1994.1159. [DOI] [Google Scholar]
- 33.Christ A, Kainz W, Hahn EG, et al. The Virtual Family-development of surface-based anatomical models of two adults and two children for dosimetric simulations. Phys Med Biol. 2010;55(2):N23–N38. doi: 10.1088/0031-9155/55/2/N01. [DOI] [PubMed] [Google Scholar]
- 34.I TS. A numerical analysis of radio-frequency power requirements in magnetic resonance imaging experiment. IEEE Trans Microwave Theory Tech. 2004;52(8):1999–2003. doi: 10.1109/TMTT.2004.832021. [DOI] [Google Scholar]
- 35.Food and Drug Administration US. Guidance for industry and FDA staff: criteria for significant risk investigations of magnetic resonance diagnostic devices. MD: U.S. Department of Health and Human Services; Jun, 2014. [Google Scholar]
- 36.Commission IE. IEC 60601-2-33. Geneva: 2010. Medical Electrical Equipment - Part 2-33:Particular:Particular requirements for the basic safety and essential performence of magnetic resonance equipment for medical diagnosis. 2010. [Google Scholar]
- 37.Ibrahim TS, Tang L. Insight into RF power requirements and B-1 field homogeneity for human MRI via rigorous FDTD approach. Journal of Magnetic Resonance Imaging. 2007;25(6):1235–47. doi: 10.1002/Jmri.20919. [DOI] [PubMed] [Google Scholar]
- 38.Haacke EM, Mittal S, Wu Z, et al. Susceptibility-Weighted Imaging: Technical Aspects and Clinical Applications, Part 1. Am J Neuroradiol. 2009;30(1):19–30. doi: 10.3174/Ajnr.A1400. [DOI] [PMC free article] [PubMed] [Google Scholar]
- 39.Yeh F DSI Studio. Department of Psychology. CMU,Pittsburgh,PA: Carnegie Mellon University; 2010. [Google Scholar]
- 40.Boskamp EB. Improved Surface Coil Imaging in Mr - Decoupling of the Excitation and Receiver Coils. Radiology. 1985;157(2):449–52. doi: 10.1148/radiology.157.2.4048454. [DOI] [PubMed] [Google Scholar]
- 41.Edelstein WA, Hardy CJ, Mueller OM. Electronic Decoupling of Surface-Coil Receivers for Nmr Imaging and Spectroscopy. J Magn Reson. 1986;67(1):156–61. doi: 10.1016/0022-2364(86)90421-X. [DOI] [Google Scholar]
- 42.Barberi EA, Gati JS, Rutt BK, et al. A transmit-only/receive-only (TORO) RF system for high-field MRI/MRS applications. Magnet Reson Med. 2000;43(2):284–9. doi: 10.1002/(Sici)1522-2594(200002)43:2<284∷Aid-Mrm16>3.0.Co;2-C. [DOI] [PubMed] [Google Scholar]
- 43.Chen CN, Hoult DI. Biomedical Magnetic Resonance Technology. 1st. Bristol, NewYork: CRC Press; 1989. January 1, 1989. [Google Scholar]
- 44.Kraff O, Bitz AK, Dammann P, Ladd SC, Ladd ME, Quick HH. An eight-channel transmit/receive multipurpose coil for musculoskeletal MR imaging at 7 T. Med Phys. 2010;37(12):6368–76. doi: 10.1118/1.3517176. [DOI] [PubMed] [Google Scholar]
- 45.Raghuraman S, Mueller MF, Zbyn S, Baer P, Breuer FA, Friedrich KM, Trattnig S, Lanz T, Jakob PM. 12-channel receive array with a volume transmit coil for hand/wrist imaging at 7 T. Journal of Magnetic Resonance Imaging. 2013;38(1):238–44. doi: 10.1002/jmri.23883. [DOI] [PubMed] [Google Scholar]
- 46.Krishnamurthy N, Zhao T, Ibrahim TS. Effects of receive-only inserts on specific absorption rate, B1 (+) field, and Tx coil performance. Journal of magnetic resonance imaging. 2014;39(2):475–84. doi: 10.1002/jmri.24152. Epub 2013/08/06. [DOI] [PMC free article] [PubMed] [Google Scholar]
- 47.Pradhan S, Bonekamp S, Gillen JS, Rowland LM, Wijtenburg SA, Edden RA, Barker PB. Comparison of single voxel brain MRS AT 3T and 7T using 32-channel head coils. Magn Reson Imaging. 2015 doi: 10.1016/j.mri.2015.06.003. Epub 2015/06/29. [DOI] [PMC free article] [PubMed] [Google Scholar]
- 48.Pinkerton RG, Barberi EA, Menon RS. Noise properties of a NMR transceiver coil array. J Magn Reson. 2004;171(1):151–6. doi: 10.1016/j.jmr.2004.08.014. [DOI] [PubMed] [Google Scholar]
- 49.Thawait SK, Wang K, Subhawong TK, Williams EH, Hashemi SS, Machado AJ, Thawait GK, Soldatos T, Carrino JA, Chhabra A. Peripheral Nerve Surgery: The Role of High-Resolution MR Neurography. Am J Neuroradiol. 2012;33(2):203–10. doi: 10.3174/Ajnr.A2465. [DOI] [PMC free article] [PubMed] [Google Scholar]
- 50.Obusez EC, Hui F, Hajj-ali RA, Cerejo R, Calabrese LH, Hammad T, Jones SE. High-resolution MRI vessel wall imaging: spatial and temporal patterns of reversible cerebral vasoconstriction syndrome and central nervous system vasculitis. AJNR. 2014;35:1527–32. doi: 10.3174/ajnr.A3909. [DOI] [PMC free article] [PubMed] [Google Scholar]
- 51.Pomper MG, Miller TJ, Stone JH, Tidmore WC, Hellmann DB. CNS vasculitis in autoimmune disease: MR imaging findings and correlation with angiography. AJNR. 1999;20:75–85. [PubMed] [Google Scholar]
- 52.Van der Kolk AG, Hendrikse J, Zwanenburg JJM, Visser F, Luijten PR. Clinical applications of 7T MRI in the brain. Eur J Rad. 2013;82:708–18. doi: 10.1016/j.ejrad.2011.07.007. [DOI] [PubMed] [Google Scholar]
- 53.Chang G, Friedrich KM, Wang L, Vieira RL, Schweitzer ME, Recht MP, Wiggins GC, Regatte RR. MRI of the Wrist at 7 Tesla using an 8 Channel Array Coil Combined with Parallel Imaging: Preliminary Results. JMRI. 2010;31(3):740–6. doi: 10.1002/jmri.22072. [DOI] [PMC free article] [PubMed] [Google Scholar]
- 54.Behr B, Stadler J, Michaely HJ, Damert HG, Schneider W. MR imaging of the human hand and wrist at 7 T. Skeletal Radiol. 2009;38:911–7. doi: 10.1007/s00256-009-0673-2. [DOI] [PubMed] [Google Scholar]
- 55.Bode AS, Planken RN, Van der Sande FM, Tordoir JHM, Leiner T, editors. ECR. European Society of Radiology; 2011. Feasibility of Non-contrast-enhanced Magnetic Resonance Angiography for Imaging Upper Extremity Vasculature Prior to Vascular Access Creation. [DOI] [PubMed] [Google Scholar]
- 56.Braidy C, Daou I, Diop AD, Helweh O, Gageanu C, Boyer L, Chabrot P. Unenhanced MR Angiography of Renal Arteries: 51 Patients. Vascular and Interventional Radiology. 2012;199(5):W629–W37. doi: 10.2214/AJR.12.8513. [DOI] [PubMed] [Google Scholar]
- 57.Sadikin C, Teng MM, Chen TCL, C F, Lirng J, Sun Y. The Current Role of 1.5T Non-contrast 3D Time-of-flight Magnetic Resonance Angiography to Detect Intracranial Steno-occlusive Disease. Elsevier & Formosan Medical Association. 2007;106(9):691–9. doi: 10.1016/S0929-6646(08)60030-3. [DOI] [PubMed] [Google Scholar]
- 58.Koopmans PJ, Manniesing R, Niessen WJ, Viergever MA, Barth M. MR venography of the human brain using susceptibility weighted imaging at very high field strength. Magnetic Resonance Materials in Physics, Biology and Medicine. 2008;21(1):149–58. doi: 10.1007/s10334-007-0101-3. [DOI] [PubMed] [Google Scholar]
- 59.Budde J, Shajan G, Hoffmann J, Ugurbil K, Pohmann R. Human Imaging at 9.4 T Using T-2*-, Phase-, and Susceptibility-Weighted Contrast. Magnet Reson Med. 2011;65(2):544–50. doi: 10.1002/Mrm.22632. [DOI] [PubMed] [Google Scholar]


