

Abstract
Molecular targeted compounds are emerging as a strategy to improve classical chemotherapy. Herein, we describe that using low dose of the multikinase inhibitor sorafenib improves cyclophosphamide antitumor activity by inhibiting angiogenesis, metastasis and promoting tumor healing in MDA-MB231 xenografts and the 4T1-12B syngeneic breast cancer metastasis model. Mechanistic studies in MDA-MB231 cells revealed that alkylation upregulates inflammatory genes/proteins such as COX-2, IL8, CXCL2 and MMP1 in a MEK1/2-ERK1/2-dependent manner. These proteins enrich the secretome of cancer cells, stimulating cell invasion and angiogenesis via autocrine and paracrine mechanisms. Sorafenib inhibits MEK1/2-ERK1/2 pathway thereby decreasing inflammatory genes and mitigating cell invasion and angiogenesis at basal and alkylation-induced conditions whereas NRF2 and ER stress pathways involved in alkylation survival are not affected. In non-invasive/non-angiogenic breast cancer cells (SKBR3 and MCF7), alkylation did not elicit inflammatory responses with the only sorafenib effect being ERK1/2-independent ROS-dependent cytotoxicity when using higher drug concentrations. In summary, our data show that alkylating agents may elicit inflammatory responses that seems to contribute to malignant progression in specific breast cancer cells. Identifying and targeting drivers of this phenotype may offer opportunities to optimize combined drug regimens between classical chemotherapeutics and targeted agents.
Keywords: alkylation, sorafenib, inflammation, MEK1/2-ERK1/2, secretome
1. Introduction
Alkylating agents are a mature class of cytotoxic chemotherapeutics that includes cyclophosphamide, ifosphamide, temozolomide, melphalan and busulfan among others. Their canonical mechanism of action involves alkylation of DNA bases leading to modified bases, strand breaks, cell cycle arrest and apoptosis in cancer cells as well as normal proliferating cells (1,2). In addition to the classical DNA damage response pathway, we previously demonstrated that alkylation mediates a significant proportion of its cytotoxicity by alkylating proteins and activation of the unfolded protein response, though this response is tempered by alkylation-induced activation of the NRF2/glutathione pathway (3,4).
Tumor associated inflammation has been recently recognized as an emerging hallmark of cancer. The inflammatory microenvironment within a tumor includes a variety of factors secreted by cancer cells, stroma and infiltrating immune cells, including cytokines, prostaglandins, metalloproteases and angiogenic factors that can either promote self sustained tumor growth in an autocrine fashion and/or modulates stromal and immune cells in a paracrine and intrincate mechanism (5). This is not simply a consequence of the immune system’s battle against tumor cells, but also an orchestrated process elicited by cancer cells themselves, that contributes to disease invasion, angiogenesis and metastasis (5,6). Classical chemotherapeutics have been described to promote both systemic and tissue specific inflammation via induction of COX2, TNF-α, IL6, MCP-1/CCL2 and/or MMPs (matrix metaloproteases) in different models; eg. Cyclophosphamide (7,8), cisplatin (9) and doxorubicin (10). However, whether and how chemotherapy impacts inflammatory pathways in the tumor microenvironment as well as its potential effect on therapy efficacy or associated adverse outcomes are not well understood (11,12).
Sorafenib (Srfn; Nevaxar) is a broad-spectrum oral multikinase small-molecule inhibitor that effectively inhibits multiple kinases in vitro, including B-RAF (including the oncogenic V600E variant), CRAF, VEGFR2, VEGFR3, PDGFR-b, FLT-3 and c-KIT to varying degrees in a dose dependent manner (13–15). Sorafenib disrupts Ras-MAPK and VEGFR signaling in cell-based assays and has been used to treat colon, kidney, lung and breast tumors in xenograft models by inhibiting proliferation and angiogenesis (13–15). In breast cancer clinical trials, sorafenib monotherapy and combinations with taxanes and bevacizumab showed low efficacy, while efficacy from combinations with gemcitabine and/or capecitabine in locally advanced or metastatic disease were promising. With regard to toxicity, sorafenib was generally well tolerated, though for some trials its dosage had to be reduced and discontinuation rates were high (14). While RAS and RAF activating mutations occur in only ~ 5% of breast cancers, RAS is active in a majority of breast cancer cell lines (16,17) and correlates with overexpression of RAS-RAF-MAPK upstream activators EGF and HER-2 receptors in breast tumors (16). Downstream of RAS, increased constitutive phosphorylation of ERK1/2 was reported in invasive (MDA-MB231, MDA-MB436 and BT549) compared to non-invasive (ZR-75-1, T47D and MCF7) breast cancer cells (18). Inhibiting MEK1/2 has been shown to decrease breast cancer cell invasion (18). Because sorafenib has shown clinical benefits in advanced breast cancer when used in combination with chemotherapy, we hypothesize that mechanism of action of sorafenib upon angiogenesis and ERK1/2 pathways could be useful to improve the efficacy of alkylating agents in treating breast cancer.
Herein, we investigated the antitumoral effect of combining sorafenib with the alkylating agent cyclophosphamide in a model of locally aggressive (MDA-MB231 xenografts) and metastatic breast cancer (orthotopic 4T1-12B cells model (19)). We found that low dose sorafenib improved cyclophosphamide efficacy leading to formation of smaller and well-localized fibrotic tumors in MDA-MB231 xenografts as well as inhibited metastasis and improved survival in the 4T1 model. Alkylating agent (methyl methanesulfonate (MMS) and cyclophosphamide) exposure induced expression of various inflammation-related genes, including IL8, MMP1, CXCL2 and COX-2, thereby affecting cancer cell secretome and tumor microenvironment in vitro and in xenografts. In vitro cell culture work demonstrated that these genes exert pro-invasive and angiogenic activities in response to alkylation, and this response can be blocked by sorafenib or MEK1/2 inhibitor with only minor impact on cell viability. This sorafenib-mediated inhibition of inflammation-related genes, as well as their induction by alkylating agents (and the resulting invasive/angiogenic phenotypes), were only detectable in cells with a triple-negative phenotype. Overall, this study shows that low dose sorafenib improves therapeutic response to alkylating agents by blocking both angiogenesis and invasion/metastasis associated with the inflammatory secretome of breast cancer.
2. Materials and Methods
2.1. Cell cultures and treatments
MDA-MB231, Hs578T, SKBR3 and MCF7 breast cancer cells lines were obtained from ATCC while 4T1-12B was obtained from TUFTS University. Cell lines were grown in DMEM supplemented with 10% inactivated FBS plus antibiotics. Cells were treated at a 50–60% confluence in the presence of 10% FBS. Sorafenib (from Santa Cruz Biotechnology), UO126 and celecoxib (from Sigma-Aldrich) stock solutions were prepared at 50–100 mM in DMSO and stored at −20°C; MMS was from Sigma-Aldrich and 4-HC (4-hydroperoxycyclophosphamide) from US Biologicals. When used in combination assays, pharmacological inhibitors were pre-incubated for 3–6 h before MMS treatments. Unless otherwise specified, MMS treatments were performed at ~IC50 in MDA-MB231 (40 μg/mL), HS578t (29 μg/mL), SKBR3 (26 μg/mL) and MCF7 (52 μg/mL) as determined by Celltiter-Glo assay.
2.2. Cell viability and caspase-3/7 activity
CellTiter-Glo® Luminescent Viability Assay and Caspase-Glo®-3/7 Assay kits from Promega were used to assess cell viability and caspase-3/7 activity following manufacturer’s instructions.
2.3. DCF assay
Intracellular ROS production was detected using the cell-permeant 2′,7′-dichlorodihydrofluorescein diacetate (DCFH-DA; Sigma) as previously described (4).
2.4. Western blot
Protein lysates were prepared using RIPA buffer containing protease and phosphatase inhibitors (1 mM PMSF, 1 mM sodium orthovanadate, 1 mM NaF, and 30 μL/mL aprotinin), clarified by centrifugation, and quantified by Bradford Protein Assay (Biorad, Hercules, CA). Proteins (20–30 μg) were resolved using 10% SDS-PAGE, transferred onto nitrocellulose membranes (Hybond-ECL, GE Healthcare Lifesciences, Piscataway, NJ). Blots were stained with Ponceu S for loading control. Primary antibodies included p-ERK1/2Thr202/Tyr204 (D13.14.4E) XP® (#4370), ERK1/2 (#9102), p-MEK1/2 Ser217/Ser221 (#9121), MEK1/2 (#9122), p-p38Thr180/Tyr182 (28B10) (#9216), p38 (#9212), COX-2 (#4842), p-JNK1/2Thr183/Tyr185 (98F2) and JNK1/2 (#9252) from Cell Signaling Technology and beta-actin (ab8227) from Abcam. Primary antibodies were used at 1:1000 dilutions (overnight at 4 °C) and secondary at 1:3000 (2 h at room temperature) in TBS-T with 5% BSA. Protein bands were developed using LumiGlo (Cell Signaling Technology) and X-Ray films.
2.5. siRNA-mediated knockdown
Small-interference RNA (siRNA) transfections were performed using Lipofectamine RNAi MAX Reagent following manufacturer instructions (Invitrogen). siRNA duplexes targeting human IL8 (sc-39631), CXCL2 (sc-43934), MMP1 (sc-41552), VEGFA (sc-29520) PTGS2/COX-2 (sc-29279) and scrambled siRNA-A (sc-37007) were purchased from Santa Cruz Biotechnology, and incubated at 20 to 50 nM siRNA range for 24 h prior to treatments. Knockdown efficiency was confirmed by ELISA.
2.6. ELISA
ELISA quantification of MMP1 and MMP3 content in culture medium was assessed using RayBio-MMP3 and RayBio-MMP1 Elisa Kit (RayBiotech, Inc); IL8 protein was analyzed by Human IL8 Elisa kit (Pierce Biotechnology). Levels of prostaglandin E2 (PGE2) and CXCL2 were determined using the Prostaglandin E2 EIA Kit Monoclonal (Cayman Chemical Company) and the CXCL2 human ELISA kit (Abnova), respectively. Culture media were diluted up to 50 times as appropriate for each target and concentration values were normalized by 106 cells.
2.7. Conditioned media (CM) preparation
For invasion and in vitro angiogenesis experiments, conditioned media (CM) from breast cancer cells was prepared as follows. Twelve-well plated cells were treated with IC50 levels of MMS (40 μg/mL) or 4-HC (25 μM) in the presence or absence of sorafenib or UO126 (3–6 h pre-treated; 10 μM) or siRNA (24 h pre-incubated) for 12 h, washed with HBSS and then incubated with 700 μL fresh DMEM for an additional 12 h. Thereafter, CM was collected and immediately used for invasion and angiogenesis assays in order to reduce freezing-associated loss of activity. Importantly, if alkylation was used, cell viability assays were carried out in parallel to ensure that alkylating agents were not causing cytotoxicity at 24 h (12 h treatment + 12 h CM preparation), which could mask the secretome composition as well as ELISA quantification of inflammatory mediators. In some assays, CM was prepared from siRNA-incubated cells. Cells were transfected for 24 h, and the medium was replaced by drug-free DMEM which was conditioned for additional 24 h and then used for angiogenesis assays.
2.8. Invasion assay
Extracellular matrix (ECM) invasion potential of breast cancer cells was estimated using the QCMTM 24-Well Cell Invasion Assay Fluorimetric (Millipore). Serum starved cells were trypsinized, centrifuged, resuspended to 5000 cells/μL, and 50 μL of this suspension (250,000 cells) was seeded onto 8μm pore size inserts coated with ECM in serum-free conditions. Afterwards, 200 μL of serum-free conditioned or fresh medium (with/out pharmacological inhibitors) was added to the top chambers. Bottom chambers consisted of 250 μL of CM/fresh medium plus 250 μL of DMEM supplemented with 20% FBS as a chemoattractant. Cells were allowed to migrate for 24–48 h at 37°C before assaying. Invaded cells were detached from the bottom side of the insert, lysed and incubated with CyQuant GR fluorescent Dye for 15 min. Fluorescence was read at Ex/Em = 480/520 nm. Percentage of invading cells was compared to cell number standard curves.
2.9. In vitro angiogenesis
Angiophase kit (MBL Inc.) was used to assess the angiogenic potential of conditioned media (CM) from breast cancer cells or the direct effect of sorafenib/UO126 on vessel-like formation in vitro. Kit-provided human endothelial cells co-cultures were expanded, plated in 24-well plates and kept for 96 h without treatments. Cells were then incubated with either CM from breast cancer cells or fresh-DMEM controls for a total of 14 days to form threadlike structures of anastomosing tubules, which resemble the capillary bed. Medium was changed/re-treated each 3 days. At the end of treatments, cells were fixed and immune-stained for CD31 following by incubation with secondary antibody conjugate. ELISA was developed using the soluble substrate p-nitrophenyl-phosphate (p-NPP) whose product was colorimetrically read at 405 nm. In some experiments, the wells were washed with dH2O, and CD31 positive tubules were stained with BCIP/NBT substrate, which form insoluble precipitates.
2.10. Reporter gene assays
Prior to transfection, cells were plated in 96-well plates an allowed to grow up to 80% confluence. Then the cells were transfected with a mixture of 40:1 of AP1- or NFκB-responsive firefly luciferase constructs (from Stratagene) and constitutive CMV-Renilla luciferase construct (Qiagen) for 24 h. Mixtures of non-inducible firefly luciferase construct and constitutively expressing Renilla luciferase construct (40:1) were used as negative controls. After 24 h transfection, the cells were pre-treated with sorafenib or UO126 for 6 h and then treated with 40 μg/mL MMS for 8 h followed by drug withdrawal for 16 h to minimize the interference of chemotherapy cytotoxicity. Afterwards, firefly and renilla luciferase activities were determined by Dual-Luciferase® Reporter Assay System protocol (Promega). Firefly luciferase activity was normalized to the levels of renilla luciferase, and expressed as fold-change compared to controls.
2.11. RNA sequencing
Gene expression profiling of MDA-MB231 cells was analyzed by RNA-sequencing using Illumina HiSeq 2000 system (Illumina, San Diego, CA). Briefly, MDA-MB231 cells were pre-incubated with 1 μM sorafenib for 12 h prior to 40 μg/mL MMS in two independent experiments. RNA was harvested 8 and 24 h post MMS treatment using the RNeasy protocol (Qiagen). RNA purity was determined using Agilent 2100 BioAnalyzer. Total RNA samples about 1–2 μg were used for sequencing library preparation according to Illumina TruSeq Total RNA Sample Preparation Guide (Illumina Cat. #: RS-122-2201). Each library was bar-coded and then pooled for cluster generation and sequencing run with 100 bp single-end (SE) sequencing protocol. Short read sequences from RNAseq were first aligned to UCSC hg19 genome build using TopHat2 algorithm and then quantified for gene expression by HTSeq to obtain raw read counts per gene, and then converted to RPKM (Read Per Kilobase of gene length per Million reads of the library) according to gene length and total mapped read count per sample (GEO repository number: GSE99536). Genes with low-read counts (RPKM<5) with all samples as determined by examining read counts in non-exonic regions were excluded from analysis. Gene expressions greater or lower than 1.75 Fold-change (treated vs untreated control; and consistent between the two experiments) were selected as differentially expressed genes (DEG). In MMS/sorafenib combination, a greater than 33.3% inhibition/potentiation of MMS-induced gene expression was considered significant.
2.12. Pathway Enrichment Analysis (PEA)
Canonical pathways associated with gene expressions changes by MMS and sorafenib were assessed using the Pathway Annotation Tool available in the Enrichr database (http://amp.pharm.mssm.edu/Enrichr/) (20). MMS/sorafenib DEG (8 and 24 h pooled together) were used as an input, and KEGG, Reactome, NCI-Nature, Panther and Wikipathway databases were selected as a default for PEA. Non-informative pathway terms such as disease-related pathways were excluded from the output.
2.13. Transcription Factor Enrichment (TFE)
TFE was performed using the ChIP Enrichment Analysis (ChEA, 2015 release) available with the Enrichr bioinformatics tool (http://amp.pharm.mssm.edu/Enrichr/enrich) (20). From an input gene list of MMS/sorafenib DEG, the ChEA program computes over-representation of transcription factor targets based on shared overlapping targets and binding site proximity from the ChIP-x (CheA) database.
2.14. Breast cancer patient survival analysis
Correlations of sorafenib-inhibited gene expressions with survival of breast cancer patients was estimated using the BreastMark tool (http://glados.ucd.ie/BreastMark/) (21). The algorithm integrates data from various published breast cancer microarray datasets (n= ~539 samples; accessed in 10/2016), split samples into two groups according to median expression of the gene of interest, and then Kaplan-Meier survival plots are drawn. In the initial set of analysis, the genes associated with sorafenib-inhibited pathways (identified from PEA) were evaluated as single-gene inputs in univariate analysis. Then the top-3 genes associated with patient survival were analyzed in combined signatures. Overall survival (OS) was selected as a clinical endpoint, Log-Rank test p-value and Hazard ratios (HR) were calculated for single and combined gene analysis as detailed in (21).
2.15. Animal studies
MDA-MB231 xenografts
The study was approved by the University of Texas Health at San Antonio Institutional Animal Care and Use Committee (IACUC) as outlined in our protocol number 11024. The facility is operated in compliance with the Public Law 89-544 (Animal Welfare Act) and its amendments, and Public Health Services Policy on Humane Care and Use of Laboratory Animals (PHS Policy) using The Guide for the Care and Use of Laboratory Animals (Guide) as the basis of operation. Selection of cyclophosphamide and sorafenib doses was based on previously published reports (15,22,23). MDA-MB-231 cells were harvested by trypsinization, washed and re-suspended in serum-free medium. Thereafter, cells were mixed with matrigel (1:1), and approximately 5×10⁶ cells were subcutaneously injected in the right flank of athymic nude mice. When the average tumor volume reached about 100 mm3, mice were randomized into groups of 8 animals each, and the following treatment protocol was implemented: Group 1 (Vehicle control): 100 μL of saline (i.p.); Group 2: sorafenib (0.02 mg/kg; i.p., daily) for 9 days; Group 3: cyclophosphamide 0.1 g/kg on days 2, 4, 6 and 8; Group 4: Sorafenib+cyclophosphamide (combination of same above described regimens). All animals were sacrificed 5 days after the end of treatments (15th day of treatment protocol). Body weight of mice was recorded weekly, and tumor size was measured three times a week in two dimensions using a digital caliper. Tumor volume was calculated by the formula 0.5236 L1(L2)2, where L1 is the long axis, and L2 is the short axis of the tumor. At the termination of the study, mice were euthanized; tumors were excised and a part was fixed in 10% phosphate-buffered formalin for H&E and part was sent to UTHSCSA pathology core to H&E, Masson’s staining and IHC analysis.
Syngenic 4T1.12B cell model of breast cancer metastasis
For metastastatic model, 4T1.12B-luc (5 × 10⁵) (kindly provided by Dr. Sahagian) cells were mixed with an equal volume of Matrigel and implanted in a mammary fat pad of 6-week-old female BALB/c mice as described (19). After a week, animals were imaged using Xenogen Small-Animal Imaging System for cellular imaging in live mice. Animals were then randomized into four groups and received following treatment protocol. Group 1 (Vehicle control): 100 μL of saline (i.p.); Group 2: sorafenib (0.02 mg/kg; i.p., daily) for 9 days; Group 3: cyclophosphamide 0.1 g/kg on days 2, 4, 6 and 8; Group 4: Sorafenib+cyclophosphamide (combination of same above described regimens). On Day 10 and Day 32 the animals were imaged for primary tumor and metastatic sites assessement, and thereafter monitored for determination of overall survival in accordance with human endpoint criteria detailed in the IACUC protocol 11024.
2.16. Pharmacokinetics
Sorafenib plasma concentrations were measured using a validated liquid chromatography-tandem mass spectrometry method as previously described (24). The lower limit of detection was 1 ng/mL. The analytical standard for sorafenib was obtained from Toronto Research Chemicals, Inc. (Ontario, Canada) and the internal standard, tolnaflate, from Sigma-Aldrich (St. Louis, MO). Three athymic nude mice per treatment timepoint were injected with sorafenib (0.02 mg/kg, i.p), and plasma was collected at 0, 15, 30, 60, 120 min and 24 h post treatment.
2.17. Histological procedures (H&E, Massom’s staining and IHC)
H&E and Massom’s trichrome staining were performed using routine protocols with UTHSCSA Histology & Immunohistochemistry Laboratory. For IHC, anti-CD31 (cat. # ab28364; Abcam) and anti-PCNA (cat. # NA03; EMD Millipore) antibodies were used to determine microvessel density and tumor cell proliferation, respectively. Anti-IL8 (cat. #LS-C104558; LSbio), MMP1 (Abcam, cat# ab52631), CXCL2 (cat. #LS-C415005; LSbio), COX-2/PTGS2 (Sigma, SAB-4502491) and IL6 (Abcam, cat# ab6672) antibodies were used for assessment of inflammatory proteins in tumor sections (1:100-1:500 dilution range). Immunohistochemical staining was performed on 5 μm formalin-fixed, paraffin-embedded mouse xenograft tissue sections. Sections were deparaffinized and hydrated, and endogenous peroxidase activity was blocked with 3% H2O2. Antigen retrieval was performed using Dako Target Retrieval Solution (S1699, DakoCytomation). Sections were blocked with an avidin/biotin block (Vector Laboratories) and rabbit serum. The sections were incubated overnight at 4°C with primary antibodies, followed by a 30 min incubation with peroxidase-conjugated secondary antibody (Vector Impress kit; Vector Laboratories, CA). Negative controls had the primary antibody replaced by Dako Antibody Diluent or IgG isotype control. The 3,3-diaminobenzidine was used as the chromagen. Sections were counterstained with Mayer’s hematoxylin for 1 minute and washed with water.
2.18. IHC data analysis
For quantification of microvessels, collagen and keratin, tissue sections were viewed at x100 magnification (x10 objective lens and x10 ocular lens). Six fields per tumor section were randomly analyzed. The average number of vessels (and keratin/collagen deposits) was counted and expressed as “number/field”. Proliferation index was estimated as average percentage of PCNA positive cells from microscopy analysis of 6 fields per slide. Average staining of IL8, IL6, CXCL2, MMP1 and PTGS2 proteins were quantified by deconvolution of IHC microphotographs using the IHC profiler plug-in of Image J(25) applied in 5 fields/tumor; the most frequent score was selected; IHC score: 3+ (highly positive); 2+ (positive); 1+ low-positive; 0+ negative. With IHC analysis, peripheral surrounding connective and central necrotic areas were excluded. Histologic slides were blind-coded during the assessment.
3. Results
3.1. Low-dose sorafenib improves tumor response to cyclophosphamide
We first determined the antitumor benefit of combining a low dose sorafenib with the alkylating agent cyclophosphamide in MDA-MB231 xenografts. Pharmacokinetic studies showed plasma peak levels of ~47 nM (22 ng/mL) at 30 min after a single i.p. injection of 0.02 mg/kg sorafenib (Fig. 1A), which are similar to plasma peak levels observed after 1 mg/kg oral sorafenib (26). Noteworthy, the doses and plasma levels achieved in our model are much lower than those used in mouse studies (15,22,27) or current clinical settings (28,29). Low dose sorafenib and cyclophosphamide alone each attenuated tumor growth while sorafenib/cyclophosphamide combination led to even smaller tumors compared to either drug monotherapy (Fig. 1B). Tumor growth inhibition was not accompanied by any overt inhibition of proliferation based on H&E (Fig. 1C) and PCNA staining scores (Fig. 1D–E). On the other hand, sorafenib exerted a significant antiangiogenic response either alone or combined with cyclophosphamide as observed by H&E (Fig. 1C) and CD31 immunostaining (Fig. 1D–E). Analysis of tumor borders follow H&E staining indicated that sorafenib/cyclophosphamide treated tumors were well-encapsulated and presented well-defined pushing borders between the tumor and capsule. This observation indicating decreased tumor infiltration (Fig. 1C). In the combination treatment this improved encapsulation was accompanied by an increased amount of fibrosis within the tumor compared to either drug alone (Fig. 1C). The fibrotic phenotype was confirmed by Masson’s trichrome staining, which revealed a “marked fibrosis” characterized by accumulation of both collagen (blue stained) and keratin (red stained) within the tumors of combined sorafenib/cyclophosphamide treated mice when compared to cyclophosphamide or sorafenib alone, which showed “mild fibrosis” (Fig. 1D–E).
Figure 1. Tumor growth kinetics and histological characteristics of cyclophosphamide/sorafenib treated MDA-MB231 xenografts.

(A) Sorafenib plasma concentration-time curves in nude mice after single intraperitoneal injection (0.02 mg/Kg; n=3/group). (B) Effect of sorafenib and cyclophosphamide on the growth kinetics of MDA-MB231 tumors in xenografts. Data are presented as mean±SD. *different from vehicle-treated; #different from sorafenib and from cyclophosphamide alone (Kruskal-Wallis/Dunns; p<0.05 as compared at the same time point). (C) Histopathological characteristics of MDA-MB231 tumors at the end of treatments as determined by H&E staining. (D) Representative microphotographs (10x magnification) showing the effect of cyclophosphamide/sorafenib on tumor vessels formation (CD31-IHC), proliferation (PCNA-IHC), and collagen and keratin deposition (Massom’s trichrome) in MDA-MB231 tumors. Blue and red areas represent collagen and keratin, respectively. The insert in the 4th panel of the Massom’s staining represents a collagen-rich area in cyclophosphamide/sorafenib treated tumors. (E) Quantification of relative microvessel, PCNA positivity, and collagen and keratin deposition in MDA-MB231 xenografts at the end of treatments. Asterisks denote differences from vehicle-treated controls (p<0.05; ***p<0.001); #different from sorafenib and from cyclophosphamide alone treatments at p<0.05 (Kruskal-Wallis/Dunns). Legends: Cyclo (Cyclophosphamide); Srfn (sorafenib).
3.2. Sorafenib/cyclophosphamide combination reduces metastasis in orthotopic breast cancer
Angiogenesis and tumor infiltration are key steps that facilitate metastasis. Results from MDA-MB231 xenografts suggest that sorafenib is promoting tumor healing phenotypes via anti-angiogenic and, possibly, anti-invasion mechanisms. Based on this evidence, we used orthotopic implants of luciferase-expressing 4T1 cells in the mammary fat pad of immunocompetent BALB-c mice in order to assess the impact of sorafenib in metastatic progression. Primary tumors were implanted and, after a week to allow establishment, they were treated for 10 days (Fig. 2A). Bioluminescence analysis of tumors showed no evidence of metastasis until 10 days. Although tumor burden decreased in combined cyclophosphamide/sorafenib, the reduction observed with the monotherapies did not reach statistical significance (Fig. 2B–C). Twenty two days after the last day of treatment (Day 32 of the experiment), the antitumor effect of drug combination persisted (Fig. 2C), and the frequency of animals with at least one metastatic site decreased in either drug alone and even more significantly in combined treatment (Fig. 2B). It is worthy to note that the number of metastatic sites per mouse is clearly higher in the 4 remaining vehicle-treated animals while monotherapy-treated animals showed only 1–2 metastatic sites; which were even less frequent in combined cyclophosphamide/sorafenib at day 32 (Fig. 2B). Overall survival monitoring demonstrated that the 10-day regimen used cumulated in a median survival of 35 days in vehicle, 45 days in cyclophosphamide alone (Log-rank p=0.015), 40 days in sorafenib alone (log-rank p=0.082), and a more significant 50 days (log-rank p<0.001) in combined therapy group (Fig. 2D). The benefit of combined treatment is well-evidenced when comparing subjects at risk between day-35 and day-50 (Fig. 2D, bottom).
Figure 2. Effects of sorafenib and cyclophosphamide in 4T1 model of breast cancer metastasis.

(A) Schematic of experimental design used for treatments and assessment of tumor growth, metastasis and survival in the 4T1 model. (B) Representative animal images showing primary (mammary fat pad) and metastatic breast tumors at different time points (0, 10 and 32 days). The bottom table represent the proportion of animals displaying at least one metastatic site per group. *different from vehicle-treated at a p<0.05; **different from vehicle-treated at a p<0.005 (Z-test for proportions; One-tailed) (C) Quantification of tumor burden at different time points using luciferase-dependent bioluminescence. Total ROI luminescence (primary site+metastatic site) was measured. Asterisks denote differences at the indicated comparisons (2-way ANOVA, p<0.05). (D) Kaplan-Meier survival curves showing the impact of cyclophosphamide/sorafenib on overall survival. Log-rank test for curve comparisons and number of subjects at risk are also presented. Legends: Cyclo (Cyclophosphamide); Srfn (sorafenib).
3.3. Differential effects of sorafenib on MEK1/2-ERK1/2 inhibition and ROS production are concentration dependent
Following our in vivo observations, we worked to recapitulate the tumor inhibition and wound-healing phenotypes using in vitro tissue culture systems experiments. To facilitate this, we used methylmethanesulfonate (MMS), a prototypical alkylating agent that does not require the metabolic bioactivation that cyclophosphamide does as well as 4-HC (4-hydroperoxycyclophosphamide), an active metabolite of cyclophosphamide. We first evaluated whether sorafenib potentiates alkylation toxicity in four breast cancer cell lines of differing molecular phenotypes; MDA-MB231 and Hs578t (triple–negative), SKBR3 (HER2+, ER−) and MCF7 (HER2−, ER+) (Fig. 3A). From 1 to 10 μM, sorafenib alone caused 0–25% decreases in cell numbers depending on the cell line (Fig. 3A). Sorafenib levels below 10 μM induce neither caspase-3 activation nor caused cell morphology changes nor LDH leakage (data not shown), indicating a cytostatic effect (Fig. 3B). At ≥20 μM, sorafenib appeared to more significantly reduce cell numbers (Fig. 3A) and stimulated caspase-3 activation (Fig. 3B). However, in combination with MMS and 4-HC (at IC50 levels), sorafenib effects upon cell number and caspase-3 were additive (Fig. 3A–B). Although we expected the B-RAF (G464V) mutations with MDA-MB231 (30) would render them more sensitive to sorafenib, we found no difference in sorafenib toxicity across the cell lines tested; agreeing with prior reports (22,30,31).
Figure 3. Effects of differing levels of sorafenib upon proliferation, invasion and angiogenesis of breast cancer cell lines.

(A) Effect of differing concentrations of sorafenib alone or combined with IC50 levels of MMS (see Methods) and 4-HC (25 μM) in MDA-MB231, SKBR3, MCF7 and Hs578T after 48 h treatment as determined by Celltiter-Glo assay. (B) Effect of differing concentrations of sorafenib upon Caspase-3/7 activity in MDA-MB231 cells treated for 48 h. (C) Immunoblots showing the effect of sorafenib alone, (D) MMS and 4-HC alone and (E) sorafenib/MMS combination on the phosphorylation of MAPKs in breast cancer cells after 8 h treatment. (F) ROS production in MDA-MB231 cells as assessed by DCF assay after 24h treatment. Relative fluorescence values are expressed as fold-change compared to control. (G) Celltiter-Glo assays showing the effect of NAC upon sorafenib and MMS toxicity in MDA-MB231 cells after 48 h treatment. (H) Transwell assays showing the impact of sorafenib treatment upon cell invasion in MDA-MB231 and Hs578T cells. The left columns show comparative invasiveness of untreated/basal SKBR3, MCF7, MDA-MB231 and Hs578T cells. (I) CM prepared from sorafenib-treated cells attenuate basal and alkylation-induced cell invasion of MDA-MB231 cells (24 h invasion protocol). “fresh DMEM” column denotes cells incubated with non-conditioned DMEM. (J) Sorafenib inhibits recombinant VEGF-induced angiogenesis and decreases angiogenic effect of CM prepared from untreated (control) and MMS-treated cells. CM was prepared from MDA-MB231 treated with sorafenib +/− MMS. The “control” column denotes non-conditioned fresh DMEM incubated with endothelial cells. Data are presented as mean±SD. Unless otherwise specified, sorafenib was used at 1 μM; UO126 at 10 μM; and alkylating agent at IC50 concentration. Legends: Srfn (Sorafenib); VEGF (recombinant VEGFA); NAC (N-acetyl-cysteine, 7.5 mM) * different from untreated/control or at indicated comparisons. & different from MMS and sorafenib alone at same concentration (1-way-ANOVA-Tukey; p<0.05, n=3 in quadruplicate for “A”; n=3 in duplicate for “C” and “D”). See Figure S1 for supplementary data.
While sorafenib-induced cell death occurred at higher concentration, sorafenib inhibition of MEK1/2 and ERK1/2 phosphorylations was detectable from 1 μM in MDA-MB231, while basal phospho-ERK1/2 levels in MCF7 and SKBR3 were not altered (Fig. 3C). These results indicate that MEK-ERK1/2 inhibition is not the basis for sorafenib toxicity in MCF7 and SKBR3. MMS and 4-HC increased ERK1/2 phosphorylation in both MDA-MB231 and SKBR3 (Fig. 3D), though, intringuingly, sorafenib only inhibited alkylation-induced ERK1/2 in MDA-MB231 (Fig. 3E) but not SKBR3 (data not shown). Moreover, sorafenib altered neither basal nor MMS-induced p38 and JNK1/2 phosphorylations in MDA-MB231, indicating selectivity to MEK-ERK1/2 pathway at low concentrations (Fig. 3E). To further demonstrate the specificity of sorafenib effects associated with ERK1/2 inhibition from potential inhibition of other kinases, we performed a parallel set of experiments with the MEK1/2 selective inhibitor UO126 (UO). In keeping with the sorafenib results, UO alone only had a minor impact on cell growth and no apparent synergy with MMS in the three cell lines evaluated (Fig. S1).
Sorafenib, at 200–400 mg b.i.d., has previously been reported to exert a cytotoxic effect via production of reactive oxygen species (ROS) in hepatocellular carcinoma (32). Given this observation and the additive nature of combining higher doses of sorafenib and alkylating agent, we considered whether higher concentrations of sorafenib might be causing cytoxicity via ROS production. In fact, sorafenib ≥ 20 μM increased ROS (Fig. 3F) and depleted thiol groups (Fig. S1); an effect potentiated in the presence of MMS and inhibited by the antioxidant N-acetyl-cysteine (NAC; Fig. 3F). NAC abrogated cytotoxicity associated with 20 μM sorafenib (Fig. 3G). Thus, we concluded that cytostatic effects of lower concentrations of sorafenib (1–10 μM) are associated with MEK1/2-ERK1/2 inhibition, while cytotoxicity at higher concentrations of sorafenib is dependent upon ROS/oxidative stress. Therefore, we hereafter sought to delineate sorafenib mechanisms at MEK1/2-ERK1/2 selective concentrations (1–10 μM). Importantly, these concentrations of sorafenib are below the plasma levels obtained in clinical trials at therapeutic doses (10–20 μM with 400 mg b.i.d.; (28,29)). This lower dosing also better mimicked what we achieved with our in vivo studies, but was high enough to produce measurable phenotypes for our in vitro assays.
3.4. Low concentration sorafenib inhibits invasion and angiogenic response to alkylation by modulating MDA-MB231 secretome
While 1–10 μM sorafenib only caused minor effects on cell viability, we considered the other phenotypes impacted by low-dose sorafenib in our xenograft model. In particular, we were struck by the impact on angiogenesis and invasion. First we established the invasive phenotype of MDA-MB231 and Hs578T was inhibited by sorafenib (1–10 μM) using transwell assays (Fig. 3H). Then, because it was reported that the secretome of cancer cells may promote angiogenesis and invasion (33), we prepared conditioned medium (CM) from untreated and short-pulse MMS-treated cells (with/out sorafenib) to determine its invasive and angiogenic inducing capability. CM from MMS and 4-HC-treated MDA-MB231 cells accelerated cell invasion compared to CM from untreated MDA-MB231 in a 24 h transwell assay (Fig. 3I and S2). Interestingly, CM prepared from sorafenib alone, or MMS/sorafenib treated cells, was less efficient in promoting cell invasion (Fig. 3I). It also should be noted that we did not find differences for an extended in vitro invasion assay (>48 h, data not shown) likely because the pro-invasive secretome of MDA-MB231 in the transwell apparatus overrides the effect of CM.
We then went on to evaluate angiogenesis. Sorafenib (1 μM) inhibited new vessel formation induced by recombinant VEGFA in human endothelial cells (Fig. 3J, black columns). Further, CM from untreated MDA-MB231 cells stimulated the formation of CD31-positive vessel-like structures and this effect was greater when using CM from cells exposed to MMS or 4-HC (Fig. 3J and S2). CM prepared from sorafenib treated cells showed decreased angiogenic potential compared to their respective untreated and MMS-treated counterparts (Fig. 3J). Using the MEK1/2 selective inhibitor UO emulated the inhibitory effects of sorafenib on invasion and angiogenesis, indicating ERK1/2 signaling as the likely target of these effects (Fig. 3H–J). As controls we also examined MCF7 and SKBR3 cells, neither of which displayed invasive (Fig. 3H, left bars) or angiogenic ability (data not shown), so it was not possible to determine the impact of sorafenib in these cells. Also, direct exposure of endothelial cells to MMS/4-HC impeded vessel-like formation due to alkylation toxicity, as expected (data not shown).
3.5. Sorafenib inhibits an inflammatory gene set without affecting alkylation survival pathways
To better delineate the mechanisms involved in sorafenib-mediated inhibition of breast cancer cell invasion and CM-induced angiogenesis, we performed RNA sequencing of MDA-MB231 cells treated with 1 μM sorafenib in the presence and absence of MMS (Fig. 4). MMS induced 536 genes (Fig. 4A; heatmap parts A+B) of which 61 (11.4% of altered genes; heatmap part B) were inhibited by sorafenib. Sorafenib alone inhibited an additional 134 genes (Fig. 4A; heatmap part C), totaling 195 sorafenib-inhibited genes in all conditions. In addition, MMS downregulated ~600 genes not affected by sorafenib (Fig. 4A; heatmap part D). Based on pathway enrichment analysis (PEA), sorafenib did not alter MMS-induced expression of NRF2 signaling/GSH synthesis and Endoplasmic Reticulum (ER) stress pathway genes (Fig. 4B–C; see pathway terms in Table S1), which we previously described as modulating breast and lung cancer cell survival of MMS (3,4). In keeping with gene expression data, sorafenib failed to inihibit MMS-induced NRF2 and ER stress markers (CHOP and ATF3) at a protein level in MDA-MB231 cells (Fig. S3). Interestingly, PEA indicated various MMS up-regulated genes that are associated with inflammatory pathways such as “cytokine”, “interleukin”, “TNF”, “Plasminogen” and “NFκB” (Fig. 4B, Table S1). These genes included cytokines (IL8, IL24, CXCL2, CXCL3), cycloxigenase COX-2 (PTGS2) and matrix metaloproteases (MMP1, MMP3, MMP10), amongst others (TNFSF9, GAL, ESM1, SERPINB2, RELN, HAS2 and EREG) (Fig. 4A–C; heatmap region B). RNA sequencing data showed that MMS gene expression inductions occurred with 8 h exposure and returned to basal/suppressed levels by the 24 h timepoint (Fig. S3). This shutdown of gene expression response is likely a consequence of a shift towards cell death mechanisms at later time points of alkylation exposure or activation of negative feedback loops. While not affecting NRF2 and ER stress responses, sorafenib either alone, or combined with MMS, inhibited several inflammation-related genes such as cytokines (IL8, IL11, IL1A, IL1B, IL24, CXCL2, CXCL3 and CSF3), metaloproteases and ECM proteins (MMP1, MMP3, MMP10, MMP9, ESM1, TNC), angiogenesis (VEGFA, PECAM1, ANGPTL4, CXCR4), plasminogen cascades (PLAU, PLAT, PLAUR and SERPINB2), PTGS2/COX2, EREG (epiregulin) and TNFSF15, amongst others (Fig. 4C).
Figure 4. MMS and sorafenib-induced changes in gene expression of MDA-MB231 cells.

(A) Heatmap and Venn diagram representation, (B) Pathway Enrichment Analysis and (C) Graphical representation of the most significant mRNA changes associated with MMS, Sorafenib (Srfn) and MMS+Srfn in 8 h treated MDA-MB231 cells as assessed by RNA sequencing. Heatmap and bar-charts represent the average mRNA log2 fold-change obtained from two independent experiments calculated as compared to control samples. Heatmap Region A: MMS-induced not altered by Srfn; Region B: MMS-induced Srfn-inhibited genes; Region C: Srfn-inhibited genes (alone); Region D: MMS-inhibited not altered by Srfn. See figure S3 for supplementary data.
To validate our results, we selected genes that were i) alkylation-induced/sorafenib-inhibited (see Fig. 3B for MMS/Srfn log2 fold-changes); ii) expressed at high mRNA RPKM/reading counts (from RNAseq); and iii) being a soluble/extracelullar mediator. These included MMP1, CXCL2, IL8, PTGS2/COX2 and MMP3. ELISA quantification of IL8, CXCL2, MMP1, MMP3 and PGE2 in the culture medium (and COX-2 immunoblot in cell extracts) of MDA-MB231 cells confirmed MMS inductions and sorafenib inhibitions identified from the RNA sequencing (Fig. 5A). The UO MEK1/2 inhibitor (10 μM) emulated sorafenib effects by blocking both constitutive and MMS-induced inflammatory protein expression (Fig. 5A). We then asked if alkylation effects upon IL8, CXCL2, MMP1, MMP3 and PGE2 induction could be a general response of breast cancer cells. Similar to our observations with MDA-MB231, Hs578T also showed readily detectable IL8, CXCL2 and PGE2 in the culture medium, which increased following MMS exposure and were blocked by sorafenib (Fig. S2); MMP1 was not detectable by ELISA in this cell line (data not shown). IL8, CXCL2, MMP1 and MMP3 were undetectable by ELISA in MCF7 and SKBR3 and no further induction by MMS was observed (Fig. 5A). Corroborating our PEA of sorafenib inhibited genes (Fig. 4B; Table S1), Transcription Factor Enrichment Analysis (TFE) indicated that JUN and RELA, two members of AP-1 and NFκB family, respectively, are putative regulators of sorafenib-inhibited genes (Table S1; TFE panel). These transcription factors are master transcriptional activators of MMP1 (34), IL8 (35), CXCL2 (36) and PTGS2/COX2 (37,38). In our model, sorafenib attenuated both basal and MMS-induced activity of AP-1- and NFκB-luciferase reporter genes. Again, this effect was reproduced by UO supporting that this is a MEK1/2-ERK1/2 dependent activity (Fig. 5B).
Figure 5. Sorafenib inhibits expression of secretome genes involved in invasive and angiogenic activity.

(A) ELISA assays showing sorafenib inhibition of basal and MMS-induced IL8, MMP1, MMP3, CXCL2 and PGE2 levels as determined in the culture medium of MDA-MB231 after 12 h treatment. Inflammatory protein levels in MCF-7 and SKBR3 cells are also shown. COX2 immunocontent was determined by western blot. (B) AP-1- and NFκB-luciferase reporter gene assays showing the effect of sorafenib and UO126 upon basal and MMS-induced NFkB and AP-1 transcription factor activity in MDA-MB231 cell line. Unless otherwise specified, sorafenib was used at 1 μM; UO126 at 10 μM; and alkylating agent at IC50 concentration. Legends: Srfn (sorafenib); ND (not detected); UO126 (10 μM). Data are presented as mean±SD. * different from untreated controls; &different from control and from MMS-treated cells (1-way-ANOVA-Tukey; p<0.05, n=3 in duplicate).
3.6. Sorafenib inhibits basal and alkylation-induced inflammation in MDA-MB231 xenografts
Based on our data of MMS-induced inflammation in vitro, we surmised that pro-inflammatory responses to alkylation could be occurring with cyclophosphamide in vitro and in the tumor microenvironment as well. In vitro, 12 h incubation with 4-HC resulted in an increased content of the IL8, CXCL2, MMP1 and PGE2 in the culture medium of MDA-MB231 cells (Fig. 6A). Experiments with MDA-MB231 implanted xenografts confirmed the detection of IL8, CXCL2, MMP1 and COX2 (Fig. 6B) recapitulating our in vitro tissue culture results. Tumors treated with cyclophosphamide displayed a stronger immunostaining for these proteins when compared to vehicle-treated mice (Fig. 6B). Importantly, low dose sorafenib alone, or in combination with cyclophosphamide, decreased this immunoreactivity, thereby confirming in vitro findings by RNA sequencing and ELISA. Of note, IL6 is known to be constitutively expressed in MDA-MB231 cells and has been reported to promote cell invasion (39,40). Even though IL6 did not meet our stasticial threshold for MMS and sorafenib gene expression changes in RNA sequencing, we observed an increased IL6 immunocontent in response to cyclophosphamide in vivo, and, similar to other inflammatory responses, its expression was attenuated by sorafenib (Fig. 6B).
Figure 6. Sorafenib inhibits cyclophosphamide-induced inflammatory gene expression in vitro and MDA-MB231 xenografts.

(A) 4-HC induces inflammatory proteins production in MDA-MB231 cells. The cells were treated for 12 h with 25 μM 4-HC for 12 h, and afterwards the culture medium was collected for ELISA analysis. (B) Representative IHC microphotographs showing protein content of MMP1, IL8, CXCL2, COX2 and IL6 in MDA-MB231 tumor xenografts treated with cyclophosphamide, sorafenib or combination of both. IHC score (0 to 3+) for each mice/tumor (n=8) is represented as a heatmap in the bottom of each microphotograph. IL8 IHC microphotographs also show peritumoral regions weakly stained.
3.7. Role of alkylating agent-induced and sorafenib-inhibited genes in cell survival, invasion and angiogenesis and correlation with breast cancer patient survival
Since sorafenib can inhibit invasion and angiogenesis to improve alkylation therapy, we went on to examine whether inflammatory secretome genes targeted by sorafenib may, in fact, influence cell viability/proliferation, invasion or angiogenesis. To test this concept we used siRNA knockdown experiments and pharmacological blockage of sorafenib targets. Firstly, IL8, CXCL2 and MMP1 knockdown, COX-2 inhibition (10 μM celecoxib) or antagonism of CXCR2 receptor for IL8 and CXCL2 with SB225002 impacted neither basal cell proliferation nor MMS survival response after 72 h treatment (Fig. 7A). The efficacy of each siRNA and celecoxib upon their respective targets was verified by ELISA (Fig. S3). Transwell assays demonstrated that cell invasion was mostly dependent upon MMP1, whereas depletion/inhibition of IL8, CXCL2, COX-2 or VEGFA only resulted in a partial or no effect (Fig. 7B). Given that IL8 and CXCL2 share the CXCR2 receptor (which is expressed in MDA-MB231 (41,42)), it is possible that their individual depletions might not be sufficient to deplete CXCR2 agonists. In fact, CXCR2 antagonist SB225002 led to a more significant inhibition of cell invasion compared to either IL8 or CXCL2 siRNA alone (Fig. 7B). With regard to angiogenic potential, IL8 depletion and COX2 inhibition made the CM from MDA-MB231 cells less angiogenic; MMP1 depletion had no impact (Fig. 7C). SB225002 added to MDA-MB231 CM resulted in a more pronounced anti-angiogenesis (Fig. 7C). As expected, CM obtained from MDA-MB231 cells with VEGFA knockdown displayed an attenuated angiogenic potential, while combined VEGFA depletion with CXCR2 antagonism displayed an even stronger blockade of angiogenesis (Fig. 7C). Altogether, these results suggest that the breast cancer secretome proteins that can be induced by alkylation exert differential as well as cooperative roles upon invasion and angiogenesis.
Figure 7. Impact of alkylation-induced and sorafenib-inhibited genes on malignance parameters of breast cancer cells and correlation with patient survival.

(A) Celltiter-Glo cell viability assays showing the impact of inflammatory genes knockdown and celecoxib treatment upon MMS cytotoxicity in MDA-MB231 cells after 72 h treatment. (B) Effect of inflammatory gene depletion on invasiveness of MDA-MB231 cells. siRNA transfections were performed directly in the cell seeding step on top-chambers of transwell plates and cell invasion was assessed after 48 h. Celecoxib and SB225002 were incubated directly in the top chamber of transwell plates. (C) The effect of inflammatory gene knockdown (by siRNA), COX-2 inhibition (celecoxib, 10 μM) and CXCR2 antagonist (SB225002, 15 μM) on the angiogenic potential of MDA-MB231 conditioned medium in vitro. (D) Log-rank test p-value (antilog) and Hazard ratio (HR) for the univariate analysis of correlation between sorafenib-inhibited inflammation-related genes expression and breast cancer patient overall survival (OS) as assessed by BreastMark tool. The most significant HR are annotated with the graph. (E) Kaplan-Meier plots of the top-3 survival related genes (IL8, MMP1 and VEGFA; obtained from “D”) as a single or combined predictor signatures of breast cancer patients survival. Legends: si (siRNA); rec (recombinant). Data are presented as mean±SD. * different from untreated/scrambled siRNA controls or at indicated comparisons. &different from control and from alkylation/MMS-treated cells (1way-ANOVA-Tukey; p<0.05, n=3 in duplicate). See S3 for supplementary data.
Based on these results we set out to investigate whether any of the 58 sorafenib-inhibited inflammation-related genes previously identified by PEA were related to patient survival outcome. Examining the relationship between increased expression of these various genes and breast cancer patient survival (Breast Mark tool), three have significant effect; VEGFA, IL8 and MMP1 had Hazard ratios (HR) of 1.5 (CI: 1.25–1.79), 1.6 (CI: 1.30–1.85) and 1.7 (CI: 1.44–2.04), respectively (Fig. 7D–E). Combinations of these gene signatures was associated with reduced patient survival compared to each individual gene, with a HR of 1.95 (CI: 1.61–2.37) for those patients displaying co-upregulation of VEGFA/MMP1/IL8 (Fig. 7D–E). In contrast, if either low MMP1, low IL8 or low VEGFA is present, the poor survival associated with the other 2-genes signature is lost (HR~1; Fig. 7D–E). Altogether, our in vitro/in vivo experiments and bioinformatics analyses of patient cohorts indicate that alkylation stimulates an inflammatory response that promotes malignant phenotypes and correlates with poor patient survival.
4. Discussion
Sorafenib has shown limited efficacy as single agent in breast cancer therapy with dose limiting toxicity in many instances (reviewed in (14)). Most of these clinical protocols used the maximum patient tolerated doses of sorafenib; antitumor effects in these studies was correlated with induced oxidative damage (32). On the other hand, combined regimens of sorafenib and classical chemotherapeutics have been promising in breast cancer clinical trials. In this study, we tested whether sorafenib could improve alkylating agent efficacy. Sorafenib combined with cyclophosphamide led to smaller tumors compared to either drug alone in MDA-MB231 xenografts. Tumors from combined treatment were noted to be well-encapsulated, fibrotic, with a pushing border phenotype and decreased angiogenesis, therefore suggesting a “healed” phenotype (43). Our results also suggest that alkylation, aside from directly killing cancer cells, also induces a secretome capable of stimulating invasion and angiogenesis, which can be blocked with low dose sorafenib treatment. This interpretation was corroborated with decreased metastatic progression and prolonged survival in the 4T1 orthotopic model. Sorafenib and UO block of this invasion and angiogenic promoting secretome indicates an ERK1/2-dependent effect, though it is possible that other targets of sorafenib inhibition could also play a role in mediating this phenotype. Based on tumor histology and in vitro data, induction of cell death is not likely the main mechanism associated with low dose sorafenib benefit in tumor treatment. However, we cannot exclude that the small decreases in proliferation – such as observed in MDA-MB231 (at 10 μM) and Hs578t (at 5 and 10 μM) cells - could play a role in vivo. In addition, sorafenib effects upon VEGFR2-mediated angiogenesis could also be involved by indirectly impacting tumor cell proliferation via decreased availability of nutrients and oxygen in vivo.
It has been stated that “tumors are wounds that do not heal” (43). This concept is supported by growing evidence of constitutive inflammation associated with tumors and seems to involve production of cytokines by both cancer and stromal cells present in the tumor microenvironment (43–45). In our model, MDA-MB231 cells, and its derived tumors, constitutively express a repertoire of inflammation-related genes that we validated as cooperating to promote cell invasion and angiogenesis, including MMP1, CXCL2, IL8, COX-2 and VEGFA. This pro-tumoral inflammatory secretome was further induced by alkylation. We went on to note that higher expression of IL8, MMP1 and VEGFA were associated with poor survival in patients. Constitutive expression of IL8 (35,41,42), COX-2 (17), MMP1 (46,47) and IL6 (39,40) has been associated with the aggressive basal-like/triple-negative phenotype of breast cancer, which is in keeping with our data in MDA-MB231/Hs578T versus MCF-7/SKBR3. IL8 (48,49), MMP1 (50,51), COX2 (51,52), CXCL2 (53) and IL6 (54) are described as contributors to breast cancer invasiveness, angiogenesis and/or metastasis. These results are in consonance with the current paradigm that the tumor secretome is part of a major integrated network that may regulate autocrine and paracrine crosstalk between tumor and tumor-infiltrated counterparts (5,6). In fact, by depleting different inflammatory mediators (Fig. 7) we noted that different genes play differential, as well as cooperative, roles in controlling invasion and angiogenesis. This indicates a situation where cancer cells use a repertoire of different input signals to promote a given phenotype. This functional cooperation suggests that blockage of individual inflammatory gene/pathway may be easily circumvented by other inflammatory factors. That said, our results indicated this network of inflammatory genes is regulated, at least in part, via MEK1/2-ERK1/2 in a concerted manner, and that inhibiting this pathway by, for example, sorafenib (or a MEK1/2 selective inhibitor), is a more effective strategy to inhibit expression of multiple genes involved in the inflammatory phenotype.
Due to its capability of blocking multiple protein kinases, with differing efficacy in a concentration dependent manner (13,15), sorafenib has been reported to elicit a variety of responses in vitro. This includes inhibition of proliferation, cytotoxicity, mitochondrial dysfunction, ROS production and ER stress-dependent cell death, which all appear to be cell line and concentration dependent (32,55,56). In our model, sorafenib effects were selective to the MEK1/2-ERK1/2 arm of alkylation response. In contrast, the NRF2 and ER stress signature which we have reported as being involved in alkylation survival (3,4) was not affected at either a gene or protein level (summarized in Fig. 8). Sorafenib-induced cytotoxicity/apoptosis occured only at higher concentrations (> 10 μM) and this was ROS-mediated. This cytotoxicity did not correlate with ERK1/2 inhibition or the hormone receptor/triple-negative status of the cell lines tested. Prior studies also demonstrated that sorafenib toxicity is neither correlated with inhibition of ERK1/2, nor dependent on the ER (estrogen receptor) status of breast cancer cell lines (22,31,57). The original study describing sorafenib showed ERK1/2 inhibition from ~0.1 μM in MDA-MB231 cells in vitro (15). Others reported required 7.5 μM sorafenib to reduce RAF1 activity by ~70% and at least 5 μM to inhibit ERK1/2, VEGFR2 and PDGFR phosphorylations in MDA-MB231 (30) or to cause cytotoxicity in other breast cancer cell lines (22,57). Our data showed decreased ERK1/2 phosphorylation and inhibition of inflammatory genes, invasion and angiogenesis from 1 μM sorafenib. Although plasma sorafenib levels range from ~6 to 14 μM in clinical used doses (100 to 400 mg bid) (28,29), the translational potential of the micromolar levels used in most reported scientific studies have been subject of concern (58). However, sorafenib is not capable of inhibiting ERK1/2 phosphorylation in all breast cancer cell lines, and there is a no clear correlation between ERK1/2 inhibition by sorafenib and ER status of the cells (31,59). The effectiveness of sorafenib and other RAF inhibitors is further complicated by both the presence of signaling feedback loops and mutations that may alter response to these inhibitors (reviewed in (60)). Triple negative cells such as MDA-MB231, BT549 and Hs578T display higher levels of phosphorylated ERK1/2, as well as more active KRAS/RAF1 (61–63) compared to other types of breast cancer cells such as MCF7 and T47D (18). In our model, hyperactive ERK1/2 is likely the consequence of mutant KRASG13D and B-RAFG464V in MDA-MB231 and mutant HRAS gene in Hs578T (64). Interestingly, phosphorylated ERK1/2 is a prognostic marker for sorafenib response in hepatocarcinoma models (65). Thus, blocking alkylating agent stimulated RAS-RAF-MEK1/2-ERK1/2 pathway activity in triple-negative breast cancer cells by low dose, more on-target, sorafenib may be of benefit in chemotherapy regimes. However, further work will be necessary to determine best treatment protocols to improve the initial efficacy observed with our 10 day regime.
Figure 8.
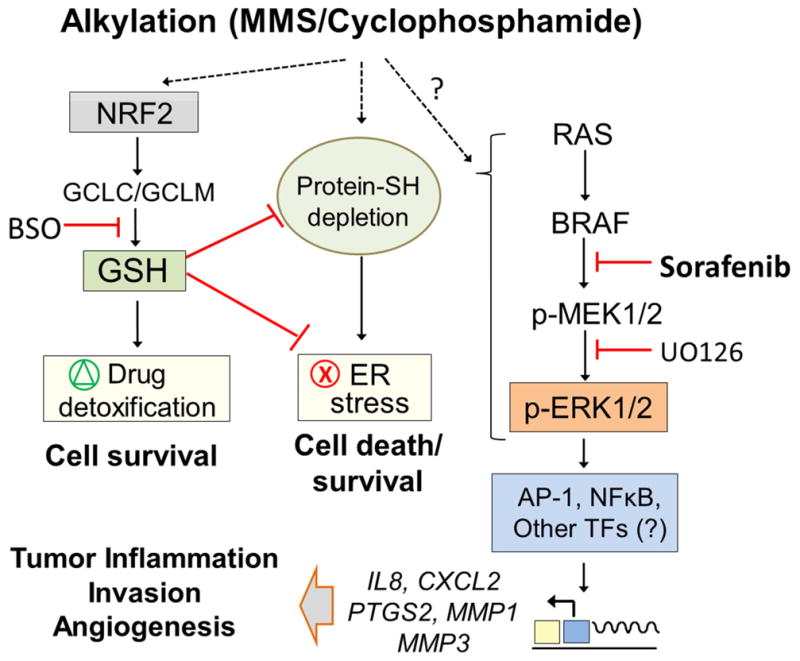
Schematic representation of the different alkyation responses identified in MDA-MB231 cells. MMS induces NRF2 and ER stress pathways involved in cell survival control whereas the BRAF-MEK1/2-ERK1/2 branch promotes inflammatory gene expression, angiogenesis and invasion in a sorafenib-inhibited manner.
Various lines of evidence report that different classes of chemotherapeutics, including cyclophosphamide, may promote inflammatory gene expression in both peripheral and tumor associated cells (7–12). Based on our results it would appear that alkylating agent-induced inflammation is not merely a correlative response as these same genes have been identified in studies of patient survival and metastatic signature (MMP1, IL8, VEGFA herein and in (37,50,66), EREG (37,66) and PTGS2/COX-2 (66)). Interestingly, these genes have also been associated with cancer cell resistance to cispatin and paclitaxel (IL6 and IL8) (67–69). Our data with xenograft and 4T1 metastatic models, as well as the above-mentioned studies, suggest inflammatory responses to cyclophosphamide may negatively affect chemo-efficacy. However, whether chemotherapy-induced inflammation in vivo is caused by active secretion from cancer cells (as we found in vitro), or by inflammation related to tumor cell necrosis, or senescence associated secretory phenotype (SASP) (11), or both, is difficult to determine. In vitro, we were unable to detect SASP as most cells underwent apoptosis. As such, additional studies are necessary to determine which chemotherapeutics and tumor cell phenotypes are prone to produce an inflammatory response, and the therapeutic impact of the latter in immunocompetent mice.
Taken together, our data suggest that inflammatory microenvironments produced by some cancers may contribute to malignant phenotypes (i.e., invasion and angiogenesis) as well as appear to negatively impact therapeutic response to cyclophosphamide (and possibly other drugs). Identifiying genetic alterations that confer inflammatory phenotypes may be useful to develop combined drug regimens that involve classical chemotherapeutics and molecular targeted compounds in order to improve efficacy, such as herein reported, with low dose sorafenib in aggressive breast cancer.
Supplementary Material
Pathway Enrichment Analysis (PEA) and Transcription Factor Enrichment (TFE) associated with MMS-induced, MMS-induced/sorafenib-inhibited and all sorafenib-inhibited genes in RNA sequenced MDA-MB231 cells.
(A) Dose validation of UO126 upon ERK1/2 phosphorylation in MDA-MB231 cells (8 h treatment), and the impact of differing UO126 concentrations upon MMS toxicity as determined by Celltiter-Glo after 48 h treatment. (B) Effect of sorafenib, UO126 and MMS upon ROS production in MDA-MB231 cells as assessed by DCF assay. At 12 and 24h treatment, the 96-well plated MDA-MB231 cells were incubated with 20 μM DCFH-DA in DMEM/0.5 % FBS. After 1h, DCF fluorescence was monitored (Ex/Em = 485/532 nm), and relative fluorescence values were expressed as fold-change compared to control. (C) Dibromobimane assays showing the effect of different levels of sorafenib upon total thiol content. MDA-MB231 cells were plated in 96-well plates and treated for 12 h. The cells were then washed in PBS and incubated with 40 μM dibromobimane in PBS for an additional 40 min at 37°C. Fluorescence of dibromobimane adducts with GSH and protein-SH was measured at Ex/Em 393/477 nm, and data were expressed as fold compared to control samples. Legends: srfn (sorafenib); NAC (N-acetylcysteine, 7.5 mM); UO (UO126, 10 μM). Data are presented as mean±SD. *different from untreated; &different from untreated and from MMS-treated alone; #different from MMS+sorafenib and from sorafenib alone (1way-ANOVA/Tukey; p<0.05).
(A) Cell invasion and (B) In vitro angiogenesis assays comparing the effect of conditioned medium (CM) from MMS and 4-HC-treated MDA-MB231 cells. CM was prepared from MDA-MB231 cells treated for 12 h with 40 μg/mL or 25 μM 4-HC (see methods). (C) Representative CD31 immunocytochemistry of vessel-like structures formed in angiogenesis assay. Upper panels show the effect of sorafenib treatment (Srfn, 1 μM) upon VEGF-induced angiogenesis; lower panels show the effect of CM prepared from MDA-MB231 cells treated with MMS/4-HC in the presence or absence of sorafenib. (D) ELISA assays in culture medium of MDA-MB231 and Hs578T cells after 12 h treatment with 4-HC (4-hydroperoxycyclophosphamide; 25 μM) or MMS (40 μg/mL). Data are presented as mean±SD. *different from untreated controls or at indicated comparisons (1-way ANOVA-Tukey, p<0.05).
(A) RNA sequencing of MDA-MB231 cells treated for 8 and 24 h with MMS shows that inflammatory, NRF2 and ER stress gene expressions peak 8 h treatment. (B) Immunoblots showing that sorafenib (Srfn, 5 μM) has no impact upon MMS-induced NRF2, CHOP and ATF3 proteins in MDA-MB231 after 8 h treatment. (C) ELISA assays for quantification of cytokines/MMP and PGE2 in the culture medium of MDA-MB231 cells incubated with IL8, CXCL2, MMP1 and IL6 siRNA or COX2 inhibitor, celecoxib, for 48 h. Data are presented as mean±SD. *different from untreated; #different from crtl si (scrambled siRNA) (1-way-ANOVA/Tukey; p<0.05; n=3 in triplicate)
Highlights.
Inflammatory secretome from cancer cells augments cell invasion and angiogenesis
Inflammatory gene expression is dependent upon MEK1/2-ERK1/2 pathway activation
Alkylating agent induces inflammatory gene expression in vitro and in xenografts.
Sorafenib blocks MEK1/2-ERK1/2, inhibits inflammation, invasion and angiogenesis
Sorafenib inhibits tumor inflammation and improves alkylation therapy in mice models.
Acknowledgments
We are grateful to the funding agencies that supported this study. Funding was by the NIH [K22ES012264, 1R15ES019128 and 1R01CA152063], Voelcker Fund Young Investigator Award, GCCRI Ambassador’s Circle Research Support Award and San Antonio Area Foundation grant to AJRB; DOD-CDMRP Breast Cancer Research Program [W81XWH-14-1-0026] and MCTI/CNPq Universal [485758/13-0] to AZF; NCI-T32 training grant [5T32CA148724] to SST; Greehey Fellowship, CPRIT training grant [RP101491], a Translational Science Training Across Disciplines Scholarship from the UT System Graduate Programs Initiative and a NCI-T32 training grant [5T32CA148724] to A.G.; CPRIT (RP140105) to J.C.R.; and a NIH-P30 Cancer Center Support Grant [CA054174] to CTRC.
Footnotes
Conflict of Interest Statement: The authors declare that no conflict of interest exists
Author contributions
AZF conducted a majority of the in vitro assays and wrote the manuscript; PM, JCR and EL provided technical support; SST and AG contributed to RNA sequencing and IHC experiments; YC normalized RNA sequencing data and performed initial bioinformatics; SR performed xenograft procedures; RMG performed patient survival analysis; RLR performed histopathological analysis; RB and JK performed sorafenib plasma quantitation; AJRB conceived and directed the project and wrote the manuscript with AZF.
Publisher's Disclaimer: This is a PDF file of an unedited manuscript that has been accepted for publication. As a service to our customers we are providing this early version of the manuscript. The manuscript will undergo copyediting, typesetting, and review of the resulting proof before it is published in its final citable form. Please note that during the production process errors may be discovered which could affect the content, and all legal disclaimers that apply to the journal pertain.
References
- 1.Fu D, Calvo JA, Samson LD. Balancing repair and tolerance of DNA damage caused by alkylating agents. Nat Rev Cancer. 2012;12:104–20. doi: 10.1038/nrc3185. [DOI] [PMC free article] [PubMed] [Google Scholar]
- 2.Klapacz J, Pottenger LH, Engelward BP, Heinen CD, Johnson GE, Clewell RA, et al. Contributions of DNA repair and damage response pathways to the non-linear genotoxic responses of alkylating agents. Mutat Res Rev Mutat Res Netherlands. 2016;767:77–91. doi: 10.1016/j.mrrev.2015.11.001. [DOI] [PMC free article] [PubMed] [Google Scholar]
- 3.Zanotto-Filho A, Dashnamoorthy R, Loranc E, de Souza LHT, Moreira JCF, Suresh U, et al. Combined Gene Expression and RNAi Screening to Identify Alkylation Damage Survival Pathways from Fly to Human. PLoS One United States. 2016;11:e0153970. doi: 10.1371/journal.pone.0153970. [DOI] [PMC free article] [PubMed] [Google Scholar]
- 4.Zanotto-Filho A, Masamsetti VP, Loranc E, Tonapi SS, Gorthi A, Bernard X, et al. Alkylating Agent-Induced NRF2 Blocks Endoplasmic Reticulum Stress-Mediated Apoptosis via Control of Glutathione Pools and Protein Thiol Homeostasis. Mol Cancer Ther United States. 2016;15:3000–14. doi: 10.1158/1535-7163.MCT-16-0271. [DOI] [PMC free article] [PubMed] [Google Scholar]
- 5.Hanahan D, Weinberg RA. Hallmarks of cancer: the next generation. Cell United States. 2011;144:646–74. doi: 10.1016/j.cell.2011.02.013. [DOI] [PubMed] [Google Scholar]
- 6.Espinoza-Sanchez NA, Chimal-Ramirez GK, Mantilla A, Fuentes-Panana EM. IL-1beta, IL-8, and Matrix Metalloproteinases-1, -2, and -10 Are Enriched upon Monocyte-Breast Cancer Cell Cocultivation in a Matrigel-Based Three-Dimensional System. Front Immunol Switzerland. 2017;8:205. doi: 10.3389/fimmu.2017.00205. [DOI] [PMC free article] [PubMed] [Google Scholar]
- 7.Nafees S, Rashid S, Ali N, Hasan SK, Sultana S. Rutin ameliorates cyclophosphamide induced oxidative stress and inflammation in Wistar rats: role of NFkappaB/MAPK pathway. Chem Biol Interact Ireland. 2015;231:98–107. doi: 10.1016/j.cbi.2015.02.021. [DOI] [PubMed] [Google Scholar]
- 8.Moschella F, Torelli GF, Valentini M, Urbani F, Buccione C, Petrucci MT, et al. Cyclophosphamide induces a type I interferon-associated sterile inflammatory response signature in cancer patients’ blood cells: implications for cancer chemoimmunotherapy. Clin Cancer Res United States. 2013;19:4249–61. doi: 10.1158/1078-0432.CCR-12-3666. [DOI] [PubMed] [Google Scholar]
- 9.Humanes B, Camano S, Lara JM, Sabbisetti V, Gonzalez-Nicolas MA, Bonventre JV, et al. Cisplatin-induced renal inflammation is ameliorated by cilastatin nephroprotection. Nephrol Dial Transplant England. 2017 doi: 10.1093/ndt/gfx005. [DOI] [PMC free article] [PubMed] [Google Scholar]
- 10.Supriya R, Tam BT, Pei XM, Lai CW, Chan LW, Yung BY, et al. Doxorubicin Induces Inflammatory Modulation and Metabolic Dysregulation in Diabetic Skeletal Muscle. Front Physiol. 2016;7:1–13. doi: 10.3389/fphys.2016.00323. [DOI] [PMC free article] [PubMed] [Google Scholar]
- 11.Toste PA, Nguyen AH, Kadera BE, Duong M, Wu N, Gawlas I, et al. Chemotherapy-Induced Inflammatory Gene Signature and Protumorigenic Phenotype in Pancreatic CAFs via Stress-Associated MAPK. Mol Cancer Res [Internet] 2016;14:437–47. doi: 10.1158/1541-7786.MCR-15-0348. Available from: http://mcr.aacrjournals.org/cgi/doi/10.1158/1541-7786.MCR-15-0348. [DOI] [PMC free article] [PubMed] [Google Scholar]
- 12.Cheung YT, Lim SR, Ho HK, Chan A. Cytokines as mediators of chemotherapy-associated cognitive changes: Current evidence, limitations and directions for future research. PLoS One. 2013:8. doi: 10.1371/journal.pone.0081234. [DOI] [PMC free article] [PubMed] [Google Scholar]
- 13.Adnane L, Trail PA, Taylor I, Wilhelm SM. Sorafenib (BAY 43-9006, Nexavar), a dual-action inhibitor that targets RAF/MEK/ERK pathway in tumor cells and tyrosine kinases VEGFR/PDGFR in tumor vasculature. Methods Enzymol United States. 2006;407:597–612. doi: 10.1016/S0076-6879(05)07047-3. [DOI] [PubMed] [Google Scholar]
- 14.Zafrakas M, Papasozomenou P, Emmanouilides C. Sorafenib in breast cancer treatment: A systematic review and overview of clinical trials. World J Clin Oncol United States. 2016;7:331–6. doi: 10.5306/wjco.v7.i4.331. [DOI] [PMC free article] [PubMed] [Google Scholar]
- 15.Wilhelm SM, Carter C, Tang L, Wilkie D, McNabola A, Rong H, et al. BAY 43-9006 exhibits broad spectrum oral antitumor activity and targets the RAF/MEK/ERK pathway and receptor tyrosine kinases involved in tumor progression and angiogenesis. Cancer Res United States. 2004;64:7099–109. doi: 10.1158/0008-5472.CAN-04-1443. [DOI] [PubMed] [Google Scholar]
- 16.von Lintig FC, Dreilinger AD, Varki NM, Wallace AM, Casteel DE, Boss GR. Ras activation in human breast cancer. Breast Cancer Res Treat Netherlands. 2000;62:51–62. doi: 10.1023/a:1006491619920. [DOI] [PubMed] [Google Scholar]
- 17.Eckert LB, Repasky GA, Ulku AS, McFall A, Zhou H, Sartor CI, et al. Involvement of Ras activation in human breast cancer cell signaling, invasion, and anoikis. Cancer Res United States. 2004;64:4585–92. doi: 10.1158/0008-5472.CAN-04-0396. [DOI] [PubMed] [Google Scholar]
- 18.Chen H, Zhu G, Li Y, Padia RN, Dong Z, Pan ZK, et al. Extracellular signal-regulated kinase signaling pathway regulates breast cancer cell migration by maintaining slug expression. Cancer Res United States. 2009;69:9228–35. doi: 10.1158/0008-5472.CAN-09-1950. [DOI] [PMC free article] [PubMed] [Google Scholar]
- 19.Tao K, Fang M, Alroy J, Sahagian GG. Imagable 4T1 model for the study of late stage breast cancer. BMC Cancer [Internet] 2008;8:228. doi: 10.1186/1471-2407-8-228. Available from: http://bmccancer.biomedcentral.com/articles/10.1186/1471-2407-8-228. [DOI] [PMC free article] [PubMed] [Google Scholar]
- 20.Kuleshov MV, Jones MR, Rouillard AD, Fernandez NF, Duan Q, Wang Z, et al. Enrichr: a comprehensive gene set enrichment analysis web server 2016 update. Nucleic Acids Res England. 2016;44:W90–7. doi: 10.1093/nar/gkw377. [DOI] [PMC free article] [PubMed] [Google Scholar]
- 21.Madden SF, Clarke C, Gaule P, Aherne ST, Donovan NO, Clynes M, et al. BreastMark: An Integrated Approach to Mining Publicly Available Transcriptomic Datasets Relating to Breast Cancer Outcome. Breast Cancer Res [Internet] BioMed Central Ltd. 2013;15:R52. doi: 10.1186/bcr3444. Available from: http://breast-cancer-research.com/content/15/4/R52. [DOI] [PMC free article] [PubMed] [Google Scholar]
- 22.Nagaria TS, Williams JL, Leduc C, Squire JA, Greer PA, Sangrar W. Flavopiridol synergizes with sorafenib to induce cytotoxicity and potentiate antitumorigenic activity in EGFR/HER-2 and mutant RAS/RAF breast cancer model systems. Neoplasia United States. 2013;15:939–51. doi: 10.1593/neo.13804. [DOI] [PMC free article] [PubMed] [Google Scholar]
- 23.Huyan X, Lin Y, Gao T, Chen R, Fan Y. Int Immunopharmacol [Internet] Vol. 11. Elsevier B.V: 2011. International Immunopharmacology Immunosuppressive effect of cyclophosphamide on white blood cells and lymphocyte subpopulations from peripheral blood of Balb/c mice; pp. 1293–7. Available from: http://dx.doi.org/10.1016/j.intimp.2011.04.011. [DOI] [PubMed] [Google Scholar]
- 24.Li L, Zhao M, Navid F, Pratz K, Smith BD, Rudek MA, et al. Quantitation of sorafenib and its active metabolite sorafenib N-oxide in human plasma by liquid chromatography-tandem mass spectrometry. J Chromatogr B, Anal Technol Biomed life Sci Netherlands. 2010;878:3033–8. doi: 10.1016/j.jchromb.2010.08.049. [DOI] [PMC free article] [PubMed] [Google Scholar]
- 25.Varghese F, Bukhari AB, Malhotra R, De A. IHC Profiler: an open source plugin for the quantitative evaluation and automated scoring of immunohistochemistry images of human tissue samples. PLoS One United States. 2014;9:e96801. doi: 10.1371/journal.pone.0096801. [DOI] [PMC free article] [PubMed] [Google Scholar]
- 26.Wecksler AT, Hwang SH, Liu JY, Wettersten HI, Morisseau C, Wu J, Weiss RHHB. Biological evaluation of a novel sorafenib analogue, t-CUPM. Cancer Chemother Pharmacol. 2015;75:161–71. doi: 10.1007/s00280-014-2626-2. [DOI] [PMC free article] [PubMed] [Google Scholar]
- 27.Hu S, Niu H, Inaba H, Orwick S, Rose C, Panetta JC, et al. Activity of the multikinase inhibitor sorafenib in combination with cytarabine in acute myeloid leukemia. J Natl Cancer Inst United States. 2011;103:893–905. doi: 10.1093/jnci/djr107. [DOI] [PMC free article] [PubMed] [Google Scholar]
- 28.Strumberg D, Clark JW, Awada A, Moore MJ, Richly H, Hendlisz A, et al. Safety, pharmacokinetics, and preliminary antitumor activity of sorafenib: a review of four phase I trials in patients with advanced refractory solid tumors. Oncologist United States. 2007;12:426–37. doi: 10.1634/theoncologist.12-4-426. [DOI] [PubMed] [Google Scholar]
- 29.Fucile C, Marenco S, Bazzica M, Zuccoli ML, Lantieri F, Robbiano L, et al. Measurement of sorafenib plasma concentration by high-performance liquid chromatography in patients with advanced hepatocellular carcinoma: is it useful the application in clinical practice? A pilot study. Med Oncol United States. 2015;32:335. doi: 10.1007/s12032-014-0335-7. [DOI] [PubMed] [Google Scholar]
- 30.Liu C-Y, Tseng L-M, Su J-C, Chang K-C, Chu P-Y, Tai W-T, et al. Novel sorafenib analogues induce apoptosis through SHP-1 dependent STAT3 inactivation in human breast cancer cells. Breast Cancer Res England. 2013;15:R63. doi: 10.1186/bcr3457. [DOI] [PMC free article] [PubMed] [Google Scholar]
- 31.Fumarola C, Caffarra C, La Monica S, Galetti M, Alfieri RR, Cavazzoni A, et al. Effects of sorafenib on energy metabolism in breast cancer cells: role of AMPK-mTORC1 signaling. Breast Cancer Res Treat Netherlands. 2013;141:67–78. doi: 10.1007/s10549-013-2668-x. [DOI] [PubMed] [Google Scholar]
- 32.Coriat R, Nicco C, Chereau C, Mir O, Alexandre J, Ropert S, et al. Sorafenib-induced hepatocellular carcinoma cell death depends on reactive oxygen species production in vitro and in vivo. Mol Cancer Ther United States. 2012;11:2284–93. doi: 10.1158/1535-7163.MCT-12-0093. [DOI] [PubMed] [Google Scholar]
- 33.Pavlou MP, Diamandis EP. The cancer cell secretome: a good source for discovering biomarkers? J Proteomics Netherlands. 2010;73:1896–906. doi: 10.1016/j.jprot.2010.04.003. [DOI] [PubMed] [Google Scholar]
- 34.Nakayama K. cAMP-response element-binding protein (CREB) and NF-kappaB transcription factors are activated during prolonged hypoxia and cooperatively regulate the induction of matrix metalloproteinase MMP1. J Biol Chem United States. 2013;288:22584–95. doi: 10.1074/jbc.M112.421636. [DOI] [PMC free article] [PubMed] [Google Scholar]
- 35.Freund A, Jolivel V, Durand S, Kersual N, Chalbos D, Chavey C, et al. Mechanisms underlying differential expression of interleukin-8 in breast cancer cells. Oncogene England. 2004;23:6105–14. doi: 10.1038/sj.onc.1207815. [DOI] [PMC free article] [PubMed] [Google Scholar]
- 36.Burke SJ, Lu D, Sparer TE, Masi T, Goff MR, Karlstad MD, et al. NF-kappaB and STAT1 control CXCL1 and CXCL2 gene transcription. Am J Physiol Endocrinol Metab United States. 2014;306:E131–49. doi: 10.1152/ajpendo.00347.2013. [DOI] [PMC free article] [PubMed] [Google Scholar]
- 37.Lerebours F, Vacher S, Andrieu C, Espie M, Marty M, Lidereau R, et al. NF-kappa B genes have a major role in inflammatory breast cancer. BMC Cancer England. 2008;8:41. doi: 10.1186/1471-2407-8-41. [DOI] [PMC free article] [PubMed] [Google Scholar]
- 38.Yang C-M, Chen Y-W, Chi P-L, Lin C-C, Hsiao L-D. Resveratrol inhibits BK-induced COX-2 transcription by suppressing acetylation of AP-1 and NF-kappaB in human rheumatoid arthritis synovial fibroblasts. Biochem Pharmacol England. 2017;132:77–91. doi: 10.1016/j.bcp.2017.03.003. [DOI] [PubMed] [Google Scholar]
- 39.Jin S, Mutvei AP, Chivukula IV, Andersson ER, Ramskold D, Sandberg R, et al. Non-canonical Notch signaling activates IL-6/JAK/STAT signaling in breast tumor cells and is controlled by p53 and IKKalpha/IKKbeta. Oncogene England. 2013;32:4892–902. doi: 10.1038/onc.2012.517. [DOI] [PMC free article] [PubMed] [Google Scholar]
- 40.Ndlovu ’Matladi N, Van Lint C, Van Wesemael K, Callebert P, Chalbos D, Haegeman G, et al. Hyperactivated NF-{kappa}B and AP-1 transcription factors promote highly accessible chromatin and constitutive transcription across the interleukin-6 gene promoter in metastatic breast cancer cells. Mol Cell Biol United States. 2009;29:5488–504. doi: 10.1128/MCB.01657-08. [DOI] [PMC free article] [PubMed] [Google Scholar]
- 41.Freund A, Chauveau C, Brouillet J-P, Lucas A, Lacroix M, Licznar A, et al. IL-8 expression and its possible relationship with estrogen-receptor-negative status of breast cancer cells. Oncogene England. 2003;22:256–65. doi: 10.1038/sj.onc.1206113. [DOI] [PMC free article] [PubMed] [Google Scholar]
- 42.Sharma B, Nawandar DM, Nannuru KC, Varney ML, Singh RK. Targeting CXCR2 enhances chemotherapeutic response, inhibits mammary tumor growth, angiogenesis, and lung metastasis. Mol Cancer Ther United States. 2013;12:799–808. doi: 10.1158/1535-7163.MCT-12-0529. [DOI] [PMC free article] [PubMed] [Google Scholar]
- 43.Arnold KM, Opdenaker LM, Flynn D, Sims-Mourtada J. Wound healing and cancer stem cells: inflammation as a driver of treatment resistance in breast cancer. Cancer Growth Metastasis United States. 2015;8:1–13. doi: 10.4137/CGM.S11286. [DOI] [PMC free article] [PubMed] [Google Scholar]
- 44.Dittmer J, Leyh B. Paracrine effects of stem cells in wound healing and cancer progression (Review) Int J Oncol Greece. 2014;44:1789–98. doi: 10.3892/ijo.2014.2385. [DOI] [PMC free article] [PubMed] [Google Scholar]
- 45.Esquivel-Velazquez M, Ostoa-Saloma P, Palacios-Arreola MI, Nava-Castro KE, Castro JI, Morales-Montor J. The role of cytokines in breast cancer development and progression. J Interferon Cytokine Res United States. 2015;35:1–16. doi: 10.1089/jir.2014.0026. [DOI] [PMC free article] [PubMed] [Google Scholar]
- 46.Liu H, Kato Y, Erzinger SA, Kiriakova GM, Qian Y, Palmieri D, et al. The role of MMP-1 in breast cancer growth and metastasis to the brain in a xenograft model. BMC Cancer England. 2012;12:583. doi: 10.1186/1471-2407-12-583. [DOI] [PMC free article] [PubMed] [Google Scholar]
- 47.Bachmeier B, Fichtner I, Killian PH, Kronski E, Pfeffer U, Efferth T. Development of resistance towards artesunate in MDA-MB-231 human breast cancer cells. PLoS One United States. 2011;6:e20550. doi: 10.1371/journal.pone.0020550. [DOI] [PMC free article] [PubMed] [Google Scholar]
- 48.Lin Y, Huang R, Chen L, Li S, Shi Q, Jordan C, et al. Identification of interleukin-8 as estrogen receptor-regulated factor involved in breast cancer invasion and angiogenesis by protein arrays. Int J cancer United States. 2004;109:507–15. doi: 10.1002/ijc.11724. [DOI] [PubMed] [Google Scholar]
- 49.Todorovic-Rakovic N, Milovanovic J. Interleukin-8 in breast cancer progression. J Interferon Cytokine Res United States. 2013;33:563–70. doi: 10.1089/jir.2013.0023. [DOI] [PMC free article] [PubMed] [Google Scholar]
- 50.Li Y, Cai G, Yuan S, Jun Y, Li N, Wang L, et al. The overexpression membrane type 1 matrix metalloproteinase is associated with the progression and prognosis in breast cancer. Am J Transl Res United States. 2015;7:120–7. [PMC free article] [PubMed] [Google Scholar]
- 51.Wu K, Fukuda K, Xing F, Zhang Y, Sharma S, Liu Y, et al. Roles of the cyclooxygenase 2 matrix metalloproteinase 1 pathway in brain metastasis of breast cancer. J Biol Chem United States. 2015;290:9842–54. doi: 10.1074/jbc.M114.602185. [DOI] [PMC free article] [PubMed] [Google Scholar]
- 52.Esbona K, Inman D, Saha S, Jeffery J, Schedin P, Wilke L, et al. COX-2 modulates mammary tumor progression in response to collagen density. Breast Cancer Res England. 2016;18:35. doi: 10.1186/s13058-016-0695-3. [DOI] [PMC free article] [PubMed] [Google Scholar]
- 53.Erin N, Nizam E, Tanriover G, Koksoy S. Autocrine control of MIP-2 secretion from metastatic breast cancer cells is mediated by CXCR2: a mechanism for possible resistance to CXCR2 antagonists. Breast Cancer Res Treat Netherlands. 2015;150:57–69. doi: 10.1007/s10549-015-3297-3. [DOI] [PubMed] [Google Scholar]
- 54.Sanguinetti A, Santini D, Bonafe M, Taffurelli M, Avenia N. Interleukin-6 and pro inflammatory status in the breast tumor microenvironment. World J Surg Oncol England. 2015;13:129. doi: 10.1186/s12957-015-0529-2. [DOI] [PMC free article] [PubMed] [Google Scholar]
- 55.Chiou J-F, Tai C-J, Wang Y-H, Liu T-Z, Jen Y-M, Shiau C-Y. Sorafenib induces preferential apoptotic killing of a drug- and radio-resistant Hep G2 cells through a mitochondria-dependent oxidative stress mechanism. Cancer Biol Ther United States. 2009;8:1904–13. doi: 10.4161/cbt.8.20.9436. [DOI] [PubMed] [Google Scholar]
- 56.Rahmani M, Davis EM, Crabtree TR, Habibi JR, Nguyen TK, Dent P, et al. The kinase inhibitor sorafenib induces cell death through a process involving induction of endoplasmic reticulum stress. Mol Cell Biol United States. 2007;27:5499–513. doi: 10.1128/MCB.01080-06. [DOI] [PMC free article] [PubMed] [Google Scholar]
- 57.Liu C-Y, Tseng L-M, Su J-C, Chang K-C, Chu P-Y, Tai W-T, et al. Breast Cancer Res. England: 2013. Novel sorafenib analogues induce apoptosis through SHP-1 dependent STAT3 inactivation in human breast cancer cells; p. R63. [DOI] [PMC free article] [PubMed] [Google Scholar]
- 58.Smith MA, Houghton P. Clin Cancer Res. United States: 2013. A proposal regarding reporting of in vitro testing results; pp. 2828–33. [DOI] [PMC free article] [PubMed] [Google Scholar]
- 59.Pedersen AM, Thrane S, Lykkesfeldt AE, Yde CW. Sorafenib and nilotinib resensitize tamoxifen resistant breast cancer cells to tamoxifen treatment via estrogen receptor alpha. Int J Oncol Greece. 2014;45:2167–75. doi: 10.3892/ijo.2014.2619. [DOI] [PubMed] [Google Scholar]
- 60.Holderfield M, Deuker MM, McCormick F, McMahon Martin. Targeting RAF kinases for cancer therapy: BRAF mutated melanoma and beyond. Nat Rev Cancer. 2014;14:455–67. doi: 10.1038/nrc3760. [DOI] [PMC free article] [PubMed] [Google Scholar]
- 61.Koh MS, Moon A. Biochem Biophys Res Commun [Internet] Vol. 406. Elsevier Inc; 2011. Activation of H-Ras and Rac1 correlates with epidermal growth factor-induced invasion in Hs578T and MDA-MB-231 breast carcinoma cells; pp. 25–9. Available from: http://dx.doi.org/10.1016/j.bbrc.2011.01.092. [DOI] [PubMed] [Google Scholar]
- 62.Kim RK, Suh Y, Yoo KC, Cui YH, Kim H, Kim MJ, et al. Activation of KRAS promotes the mesenchymal features of Basal-type breast cancer. Exp Mol Med [Internet] Nature Publishing Group. 2015;47:e137–9. doi: 10.1038/emm.2014.99. Available from: http://dx.doi.org/10.1038/emm.2014.99. [DOI] [PMC free article] [PubMed] [Google Scholar]
- 63.Lev DC, Kim LS, Melnikova V, Ruiz M, Ananthaswamy HN, Price JE. Dual blockade of EGFR and ERK1/2 phosphorylation potentiates growth inhibition of breast cancer cells. Br J Cancer [Internet] 2004;91:795–802. doi: 10.1038/sj.bjc.6602051. Available from: http://www.ncbi.nlm.nih.gov/pubmed/15280923%0Ahttp://www.pubmedcentral.nih.gov/articlerender.fcgi?artid=PMC2364773. [DOI] [PMC free article] [PubMed] [Google Scholar]
- 64.Kraus MH, Yuasa Y, Aaronson Sa. A position 12-activated H-ras oncogene in all HS578T mammary carcinosarcoma cells but not normal mammary cells of the same patient. Proc Natl Acad Sci U S A. 1984;81:5384–8. doi: 10.1073/pnas.81.17.5384. [DOI] [PMC free article] [PubMed] [Google Scholar]
- 65.Liang Y, Chen J, Yu Q, Ji T, Zhang B, Xu J, et al. Phosphorylated ERK is a potential prognostic biomarker for Sorafenib response in hepatocellular carcinoma. Cancer Med. 2017;6:2787–95. doi: 10.1002/cam4.1228. [DOI] [PMC free article] [PubMed] [Google Scholar]
- 66.Minn AJ, Gupta GP, Siegel PM, Bos PD, Shu W, Giri DD, et al. Genes that mediate breast cancer metastasis to lung. Nature England. 2005;436:518–24. doi: 10.1038/nature03799. [DOI] [PMC free article] [PubMed] [Google Scholar]
- 67.Wang Y, Niu XL, Qu Y, Wu J, Zhu YQ, Sun WJ, et al. Autocrine production of interleukin-6 confers cisplatin and paclitaxel resistance in ovarian cancer cells. Cancer Lett Ireland. 2010;295:110–23. doi: 10.1016/j.canlet.2010.02.019. [DOI] [PubMed] [Google Scholar]
- 68.Duan Z, Lamendola DE, Penson RT, Kronish KM, Seiden MV. Overexpression of IL-6 but not IL-8 increases paclitaxel resistance of U-2OS human osteosarcoma cells. Cytokine England. 2002;17:234–42. doi: 10.1006/cyto.2001.1008. [DOI] [PubMed] [Google Scholar]
- 69.Wang Y, Qu Y, Niu XL, Sun WJ, Zhang XL, Li LZ. Autocrine production of interleukin-8 confers cisplatin and paclitaxel resistance in ovarian cancer cells. Cytokine England. 2011;56:365–75. doi: 10.1016/j.cyto.2011.06.005. [DOI] [PubMed] [Google Scholar]
Associated Data
This section collects any data citations, data availability statements, or supplementary materials included in this article.
Supplementary Materials
Pathway Enrichment Analysis (PEA) and Transcription Factor Enrichment (TFE) associated with MMS-induced, MMS-induced/sorafenib-inhibited and all sorafenib-inhibited genes in RNA sequenced MDA-MB231 cells.
(A) Dose validation of UO126 upon ERK1/2 phosphorylation in MDA-MB231 cells (8 h treatment), and the impact of differing UO126 concentrations upon MMS toxicity as determined by Celltiter-Glo after 48 h treatment. (B) Effect of sorafenib, UO126 and MMS upon ROS production in MDA-MB231 cells as assessed by DCF assay. At 12 and 24h treatment, the 96-well plated MDA-MB231 cells were incubated with 20 μM DCFH-DA in DMEM/0.5 % FBS. After 1h, DCF fluorescence was monitored (Ex/Em = 485/532 nm), and relative fluorescence values were expressed as fold-change compared to control. (C) Dibromobimane assays showing the effect of different levels of sorafenib upon total thiol content. MDA-MB231 cells were plated in 96-well plates and treated for 12 h. The cells were then washed in PBS and incubated with 40 μM dibromobimane in PBS for an additional 40 min at 37°C. Fluorescence of dibromobimane adducts with GSH and protein-SH was measured at Ex/Em 393/477 nm, and data were expressed as fold compared to control samples. Legends: srfn (sorafenib); NAC (N-acetylcysteine, 7.5 mM); UO (UO126, 10 μM). Data are presented as mean±SD. *different from untreated; &different from untreated and from MMS-treated alone; #different from MMS+sorafenib and from sorafenib alone (1way-ANOVA/Tukey; p<0.05).
(A) Cell invasion and (B) In vitro angiogenesis assays comparing the effect of conditioned medium (CM) from MMS and 4-HC-treated MDA-MB231 cells. CM was prepared from MDA-MB231 cells treated for 12 h with 40 μg/mL or 25 μM 4-HC (see methods). (C) Representative CD31 immunocytochemistry of vessel-like structures formed in angiogenesis assay. Upper panels show the effect of sorafenib treatment (Srfn, 1 μM) upon VEGF-induced angiogenesis; lower panels show the effect of CM prepared from MDA-MB231 cells treated with MMS/4-HC in the presence or absence of sorafenib. (D) ELISA assays in culture medium of MDA-MB231 and Hs578T cells after 12 h treatment with 4-HC (4-hydroperoxycyclophosphamide; 25 μM) or MMS (40 μg/mL). Data are presented as mean±SD. *different from untreated controls or at indicated comparisons (1-way ANOVA-Tukey, p<0.05).
(A) RNA sequencing of MDA-MB231 cells treated for 8 and 24 h with MMS shows that inflammatory, NRF2 and ER stress gene expressions peak 8 h treatment. (B) Immunoblots showing that sorafenib (Srfn, 5 μM) has no impact upon MMS-induced NRF2, CHOP and ATF3 proteins in MDA-MB231 after 8 h treatment. (C) ELISA assays for quantification of cytokines/MMP and PGE2 in the culture medium of MDA-MB231 cells incubated with IL8, CXCL2, MMP1 and IL6 siRNA or COX2 inhibitor, celecoxib, for 48 h. Data are presented as mean±SD. *different from untreated; #different from crtl si (scrambled siRNA) (1-way-ANOVA/Tukey; p<0.05; n=3 in triplicate)