Abstract
Noninvasive diagnosis of kidney allograft inflammation in transplant recipients with stable graft function (subclinical rejection) could permit more effective therapy and prevent later development of de novo anti-donor HLA antibodies and/or graft dysfunction. Here we tested whether quantifying post-transplant donor-specific alloreactive T cells by IFN-γ ELISPOT assay noninvasively detects subclinical T-cell mediated rejection and/or predicts development of anti-donor HLA antibodies. Using an initial cross-sectional cohort of 60 kidney transplant patients with six-month surveillance biopsies, we found that negative ELISPOT assays accurately ruled out the presence of subclinical T cell mediated rejection. These results were validated using a distinct prospective cohort of 101 patients where donor specific IFN-γ ELISPOT results at both three- and six-months post-transplant significantly differentiated patients with subclinical T cell mediated rejection at six-month, independent of other clinical variables (odds ratio 0.072, 95% confidence interval 0.008-0.653). The post-transplant donor-specific IFN-γ ELISPOT results independently associated with subsequent development of significant anti-donor HLA antibodies (0.085, 0.008-0.862) and with significantly worse two-year function (estimated glomerular filtration rate) compared to patients with a negative test. Thus, post-transplant immune monitoring by donor-specific IFN-γ ELISPOT can assess risk for developing subclinical T cell mediated rejection and anti-donor HLA antibodies, potentially limiting the need for surveillance biopsies. Our study provides a guide for individualizing immunosuppression to improve post-transplant outcomes.
Keywords: Kidney transplantation, non-invasive biomarkers, T-cell alloreactivity, de novo alloantibodies
INTRODUCTION
Despite excellent short-term outcomes following kidney transplantation, long-term graft function and survival remain suboptimal as half-lives are currently estimated at only ~11 years (1). Early post-transplant identification of individuals at highest risk of late graft loss could allow targeted therapies aimed at improving long-term outcomes. One high-risk group includes individuals on standard immunosuppression that, despite stable graft function, have unrecognized intragraft inflammation, commonly called subclinical rejection (sc-AR) that has been shown by a number of groups to negatively impact long-term graft outcomes (2–5). While recognition of sc-AR within the initial 6 months post-transplant has the potential to prevent de novo development of anti-donor HLA alloantibodies (dnDSA) and improve graft survival, routine surveillance biopsies for clinical care are performed, although only in a minority of transplant centers. Serial surveillance biopsies carry a defined albeit small risk of significant morbidity, are impractical and costly for many transplant programs, histological interpretation is subject to inter-reader bias and sampling error and the optimal time-points for obtaining such biopsies remains controversial (6). A reliable, noninvasive approach for detection of sc-AR early after transplantation could potentially improve patient management and long-term outcomes.
The alloreactive T-cell IFN-γ enzyme-linked immunosorbent spot (ELISPOT) assay measures the frequency of alloreactive memory IFN-γ-producing T cells (7,8). Various single and multicenter studies showed that pre-transplant frequencies of donor-reactive IFN-γ-producing PBMCs by ELISPOT identify subjects at elevated risk of early acute cellular rejection (TCMR) and worse graft function (9–11). The clinical utility of post-transplant d-sp IFN-γ ELISPOT assays has not been carefully studied and there are no published data addressing whether this approach assesses risk of sc-AR and/or its associated late sequelae (e.g., dnDSA formation or graft failure).
Herein, we report our findings from an analysis of the relationship between post-transplant ELISPOT results and sc-AR in a cross sectional test cohort, followed by an independent, prospective validation cohort of kidney transplant patients at a single center who underwent surveillance biopsy at 6 months (figure 1). We also explored the association between the ELISPOT results and the later development of dnDSA over a 2-year follow-up period. The findings support the use of post-transplant ELISPOT assays as risk assessment tool in kidney transplant recipients.
Figure 1.
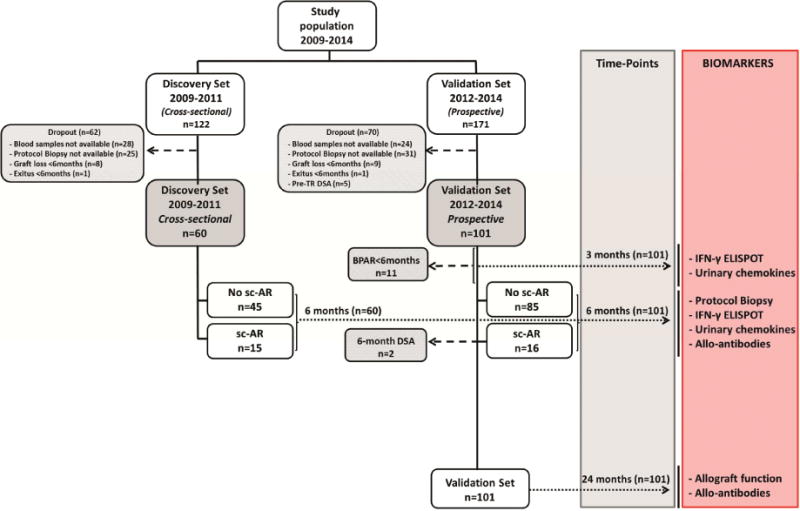
Flow-chart of the study population.
RESULTS
Six-month d-sp IFN-γ ELISPOT is associated with concurrent subclinical rejection: data from a cross-sectional discovery cohort
We initially evaluated the association between d-sp IFN-γ ELISPOT performed at the time of the 6-mo protocol biopsy and sc-AR detected on that biopsy in 60 stable transplant recipients (Table 1). 15/60 biopsies showed sc-AR, 10 (66.7%) of which were pure sc-TCMR and 5 (33.3%) were sc-ABMR (1 with mixed TCMR and ABMR). We observed significantly higher frequencies of d-sp IFN-γ-producing cells in subjects with sc-AR versus those without (64±24.1 vs 12.5±3.6 IFN-γ spots/3×105 PBMC, p=0.049) and higher d-sp IFN-γ T-cell responses in subjects with sc-TCMR versus those with sc-ABMR (p<0.001, figure 2a).
Table 1.
Baseline demographics of the Discovery and Validation cohorts
| DISCOVERY SET | VALIDATION SET | |||||||
|---|---|---|---|---|---|---|---|---|
| Baseline Demographics (%) | No 6-mo sc-AR (n=45; 75%) | 6-mo sc-AR (n=15; 25%) | p value | No 6mo sc-AR (n=85; 84.2%) | 6-mo sc-AR (n=16; 15.8%) | p value | ||
| Sc-TCMR (10; 66.7%) | Sc-ABMR (5; 33.3%) | Sc-TCMR (14; 87.5%) | Sc-ABMR (2; 12.5%) | |||||
| Donor Age (years) | 49.4±12.8 | 45 ±11.7 | 46.4 ±12.9 | 0.58 6 | 56.3±15.2 | 57.1 ±14.8 | 53 ±9.9 | 0.93 2 |
| Recipient Age (years) | 48.2±11 | 48.5 ±12.1 | 47.2 ±12.1 | 0.97 4 | 52.4±13.7 | 55.7 ±13.9 | 48.5±5 | 0.64 3 |
| Recipient Gender (F) | 13 (28.9) | 3 (30) | 4 (100) | 0.07 4 | 30 (35.3) | 5 (35.7) | 0 (0) | 0.58 1 |
| Caucasian ethnicity (yes) | 42 (93.3) | 10 (100) | 5 (100) | 0.59 1 | 80 (94.1) | 13(92.9) | 2 (100) | 0.92 2 |
| Donor (Deceased) | 37 (82.2) | 9 (90) | 5 (100) | 0.51 2 | 60 (70.6) | 11 (78.6) | 1 (50) | 0.66 1 |
| Number of transplants (>1) | 0 (0) | 0 (0) | 0 (0) | 1 | 9 (10.6) | 0 (0) | 0 (0) | 0. 39 4 |
| Dialysis duration (months) | 25.6±22.1 | 26 ±13.1 | 25.2 ±16.8 | 0.99 6 | 27.7±26 | 54.8 ±64.1 | 13.2±18.7 | 0.03 3 |
| Number HLA Mismatch | 4.12±0.9 | 3.9±0.6 | 3.5±1.2 | 0.41 3 | 3.8±1.2 | 3.7±1.1 | 5.5±0.7 | 0.14 2 |
| Pre-TR anti-HLA Abs (yes) | 2 (4.4) | 0(0) | 0(0) | 0.71 1 | 12 (14.1) | 4(28.6) | 0(0) | 0.32 3 |
| Pre-TR DSA (yes) | 0 (0) | 0(0) | 0(0) | 1 | 0(0) | 0(0) | 0(0) | 1 |
| rATG induction (yes) | 32 (71.1) | 10(100) | 5(100) | 0.06 4 | 17 (20) | 2(14.3) | 0(0) | 0.69 1 |
| CNI-based IS (yes) | 36 (80) | 7(70) | 2(50) | 0.14 3 | 85 (100) | 14(100) | 1(100) | 1 |
| CNI IS trough levels (ng/ml) | 6.9±2.9 | 7.28±1.57 | 13.1±0 | 0.10 3 | 6.94±2.22 | 7.35±1.95 | 4.5±1.6 | 0.25 7 |
| DGF (yes) | 8 (17.8) | 1(10) | 0(0) | 0.51 2 | 27 (32.5) | 4(28.6) | 0(0) | 0.60 2 |
| Clinical BPAR (< 6 months) (yes) | 1 (2.2) | 0(0) | 0(0) | 0.84 4 | 4 (4.7) | 6(42.9) | 1(50) | <0.001 |
| 6-mo sCreat (umol/L) | 124.8±33.3 | 149.2 ±86.8 | 109.4±28.4 | 0.21 3 | 129.3±38.8 | 138.6±46 | 131.5±33.2 | 0.72 2 |
| 6-mo dnAbs (yes) | 3 (6.7) | 0(0) | 5(100) | <0.001 | 12 (14.1) | 4(28.6) | 2(100) | 0.004 |
| 6-mo dnDSA (yes) | 1 (2.2) | 0(0) | 5(100) | <0.001 | 0 (0) | 0(0) | 2(100) | < 0.001 |
BPAR, biopsy proved acute rejection; CNI, calcineurin inhibitor; DGF, delayed graft function; dnAbs, de novo anti-HLA antibodies; dnDSA, de novo donor-specific antibodies; HLA, human leukocyte antigen; IS, immunosuppression; Neg, negative ELISPOT; Pre-TR, pre-transplant; rATG, rabbit anti-thymoglobulin; sc-ABMR, antibody mediated subclinical rejection; sc-AR, subclinical rejection; sc-TCMR, T-cell mediated subclinical rejection; sCreat, serum creatinine; 6-mo, 6-month. Data is presented as number (%) and Mean±SD. ‘p’ values correspond to inter-group comparison (No sc-AR vs SC-TCMR vs sc-ABMR, being sc-TCMR and sc-ABMR treated as different groups) for X2 and One-way ANOVA analysis.
Figure 2.
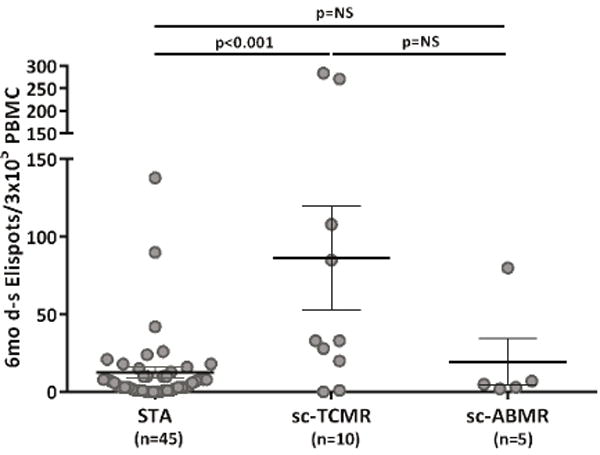
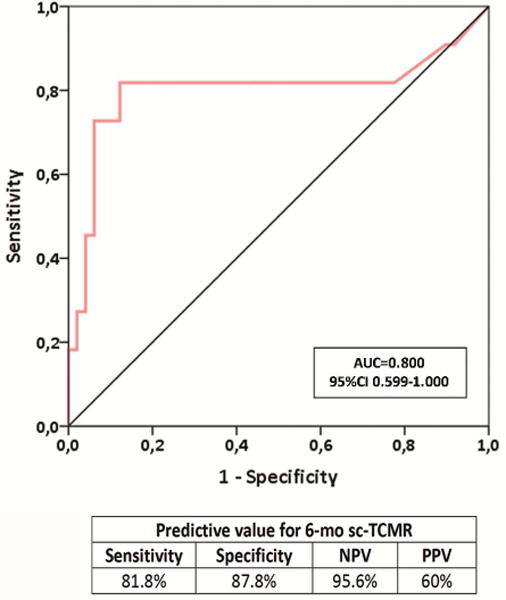
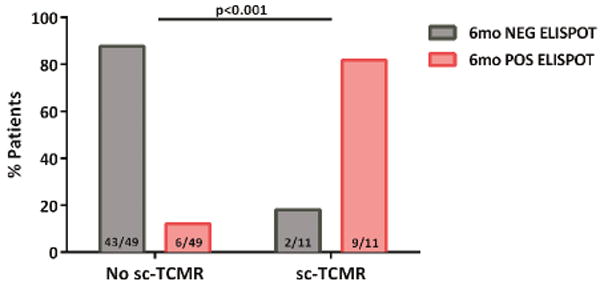
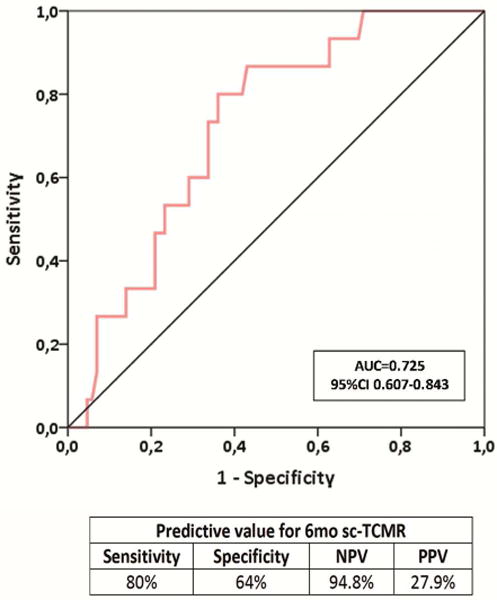
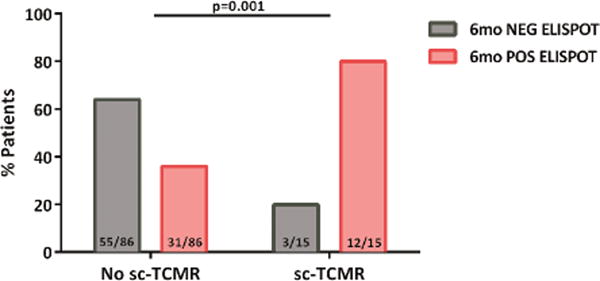
Six-month d-sp T-cell alloreactivity discriminates patients with sc-TCMR at 6-mo protocol biopsies (Discovery Set, n=60 and Validation set, n=90).
2a. Six-month d-sp IFN-γ-producing T-cell frequencies in patients with sc-TCMR and sc-ABMR as compared to STA patients (Discovery Set, n=60). Patients displaying sc-TCMR showed significantly higher frequencies of IFN-γ d-sp secreting T cells compared to patients without sc-TCMR (86.30±33.64 vs 12.49±3.61 IFN-γ spots/3×105 PBMC, in sc-TCMR vs STA, p<0.001; 86.30±33.64 vs 19.40±15.17 IFN-γ spots/3×105 PBMC in sc-TCMR vs sc-ABMR, p=NS; 19.40±15.17 vs 12.49±3.61 FN-γ spots/3×105 PBMC, in sc-ABMR vs STA, p=NS; range 0-138 in STA patients, range 0-284 in sc-TCMR patients and range 2-80 in sc-ABMR patients). ELISPOT results from the one subject with mixed cellular and antibody sc-AR (80/3×105) were similar to that of subjects with sc-TCMR (86.30±33.64 IFN-γ spots/3×105 PBMC). Some spots are jittered as there were several overlapping results, many of them very low. Results are shown as mean spot numbers ±SD.
2b. ROC curve analysis of the d-sp IFN-γ ELISPOT assay predicting sc-TCMR in a discovery set of kidney transplant patients (n=60). A frequency of 19 IFN-γ-producing T cells per 3×10⁵ stimulated PBMC, was shown as the most accurate cut-off value discriminating sc-TCMR at 6-month protocol biopsies (AUC=0.800; 95% CI 0.599-1.000, p=0.002), with 81.8% sensitivity, 87.8% specificity, 95.6 of NPV and 60% of PPV.
2c. Distribution of patients showing sc-TCMR according to the d-sp IFN-γ ELISPOT at 6 months (Discovery Set, n=60). Most patients with sc-TCMR displayed a positive d-sp IFN-γ ELISPOT 9/11(81.8%), whereas those without showed a negative test 43/49(87.8%) (p<0.001).
2d. ROC curve analysis of the d-sp IFN-γ ELISPOT assay predicting sc-TCMR in an independent validation cohort of kidney transplant patients (Validation set, n=101). The assay showed an AUC=0.725, 95% CI 0.607-0.843; p=0.006, with 80% sensitivity, 64% specificity, 94.8% of NPV and 27.9% of PPV.
2e. Distribution of patients showing sc-TCMR according to the d-sp IFN-γ ELISPOT at 6 months. Most patients with sc-TCMR displayed a positive d-sp IFN-γ ELISPOT (12/15(80%), whereas those without showed a negative test 55/86(64%) (p=0.001).
We generated a ROC curve to identify the optimal threshold of ELISPOT frequencies that differentiate sc-TCMR (including the one subject with mixed AR) from absence of sc-TCMR (figure 2b). A threshold of 19 IFN-γ spots/3×105 PBMC best discriminated sc-TCMR [AUC=0.800, 95%CI 0.599-1.000, (p=0.002) with a sensitivity, specificity, positive predictive value (PPV) and negative predictive value (NPV) of 81.8%, 87.8%, 60% and 95.6%, respectively (OR:0.031 95%CI 0.005-0.179 p<0.001)] (figures 2b–c). While the 4 subjects with pure sc-ABMR were ELISPOT negative, their serum contained DSA at 6 months. None of the subjects with pure sc-TCMR had DSA.
IFN-γ ELISPOT identifies subclinical rejection in a prospective validation cohort
In an effort to validate the above findings, we studied an independent prospective cohort of 101 consecutive, stable, kidney transplant patients who also had 6-mo surveillance biopsies. Clinical and demographic characteristics of the test and validation sets were similar, as well as the incidence and the subtype distribution of sc-AR (Table 1). 11/101 patients displayed clinical BPAR before the 6-mo protocol biopsy (range 1week - 3months), 10 of which were TCMR (2 IA, 4 IB, 2 IIA and 2 IIB) and 1 ABMR, and they all responded to steroid pulses or plasma exchange plus IVIG, respectively, fully recovering baseline allograft function. None of the subjects died or experienced graft loss within 24-mo after transplant.
To mimic “real life” conditions, the predictive capacity of the d-sp IFN-γ ELISPOT was first tested including patients with previous BPAR with recovered allograft function at the time of 6-mo protocol biopsy (n=101). Using the threshold for ELISPOT positivity defined in the discovery set analysis, d-sp IFN-γ ELISPOT assay positivity at 6-mo similarly associated with concurrent sc-TCMR (AUC=0.725; 95%CI 0.607-0.843; p=0.006) with high sensitivity (80%) and NPV (94.8%) (OR: 0.141, 95%CI 0.037-0.538 p=0.004) (figures 2d–e).
Likewise, when patients who had experienced clinical BPAR before month 6 were excluded from the analysis as a potential confounder (n=90), the d-sp IFN-γ ELISPOT assay also correlated with 6-mo sc-TCMR with AUC 0.763; 95%CI 0.655-0.870; p=0.010, 88.9% sensitivity, 64.2% specificity, 98.1% NPV and 21.6% PPV (OR: 0.070, 95%CI 0.008-0.585 p=0.014) (supplemental figures 1a–b). Two patients had dnDSA at the time of 6-month protocol biopsies. Both had sc-ABMR or mixed sc-AR, while none had sc-TCMR (p<0.001). 3/57 (5.3%) patients with negative d-sp ELISPOT and DSA data had sc-AR (either sc-TCMR or sc-ABMR), whereas 13/44 (29.5%) of those with positive d-sp ELISPOT and/or DSA had sc-AR (PPV 29.5%; NPV 94.7%).
We further analyzed the relationship among the injury within various histological compartments of the allograft and d-sp IFN-γ ELSIPOT results. Patients with biopsies showing different degrees of acute Banff scores (>1) at the tubuli, interstitium and microvascular inflammation (MVI) displayed significantly higher d-sp T-cell frequencies than those without (supplemental table 1) (34.51±56.09 vs 18.63±27.45, p=0.017 for tubuli; 32.20±54.09vs18.85±27.08, p=0.039 for interstitial and 43.30±70.06 vs 18.46±24.92 IFN-γ spots/3×105PBMCs, p=0.001 for MVI scores>1 vs score=0, respectively).
Three-month d-sp IFN-γ ELISPOT associates with sc-TCMR in 6-month protocol biopsies
We next tested whether d-sp ELISPOT results performed at 3-mo post-transplant could discriminate the presence or absence of intragraft inflammation observed on 6-mo surveillance biopsy. We found a strong correlation between d-sp IFN-γ ELISPOT at 3- and 6-mo, illustrating that most T-cell alloreactive patients remain persistently positive (figure 3a–b). At month 3, the same cut-off value than that obtained at month 6 discriminated negative and positive patients with high accuracy in a ROC curve analysis. A negative d-sp IFN-γ ELISPOT showed a lower but similarly consistent accuracy predicting the absence of sc-TCMR at 6-mo (AUC 0.711, 95%CI 0.595-0.827, p=0.009; 80% sensitivity; 94.9% NPV; OR:0.134 95%CI 0.035-0.512 p=0.003) (figures 3c–d). When we excluded patients with previous BPAR from the analysis (n=90), the 3-mo IFN-γ ELISPOT assay similarly discriminated 6-mo sc-TCMR (AUC 0.703; 95%CI 0.559-0.847; p=0.047) with high sensitivity and NPV (77.8%, 96.4%, respectively) (OR:0.143 95%CI 0.028-0.735 p=0.020) (supplemental figures 2a–b).
Figure 3.
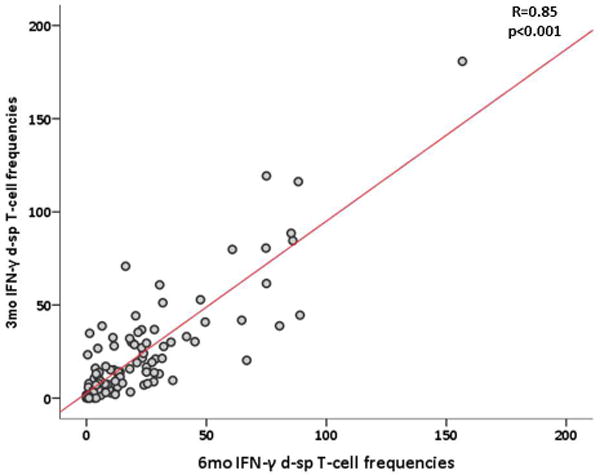
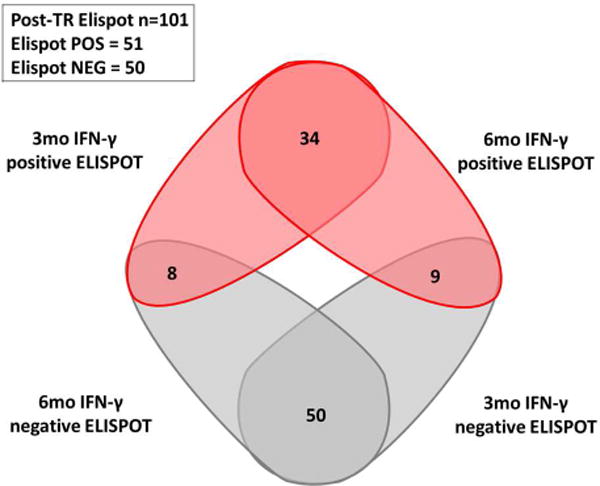
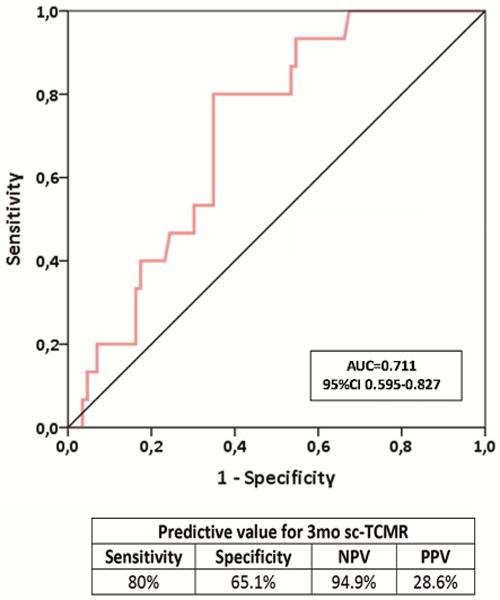
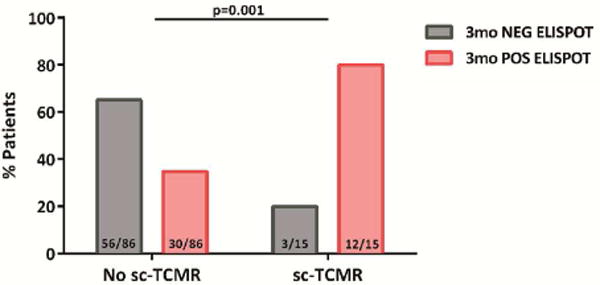
High d-sp IFN-γ-producing T-cell alloreactivity measured 3 months prior to protocol biopsies predicted the advent of sc-TCMR at 6 months (n=101).
3a. Positive correlation between 3 and 6-mo d-sp IFN-γ producing T-cell frequencies (R=0.85, p<0.01).
3b. Venn diagram showing the relationship between 3 and 6-month ELISPOT.
3c. Three months prior to protocol biopsies, the assessment of circulating d-sp IFN-γ ELISPOT assay predicted the presence of 6-month sc-TCMR (AUC 0.711; 95% CI 0.595-0.827; p=0.009) showing 80% sensitivity, 65.1% specificity, 94.9% NPV and 28.6% PPV.
3d. Proportion of patients with 3-month d-sp IFN-γ T-cell alloreactivity and incidence of subsequent sc-TCMR at 6 months after transplantation. Twelve out of 15(80%) of patients developing sc-TCMR were highly alloreactive patients and 3/15(20%) were not; only 30/86 (34.8%) of patients without sc-TCMR were T-cell alloreactive, whereas 56/86(65.1%) were not, p=0.001.
In a multivariate Cox regression analysis including relevant clinical variables and those correlating with sc-TCMR in an univariate analysis, only a negative post-transplant d-sp IFN-γ ELISPOT was an independent predictor of no sc-TCMR at 6-mo surveillance biopsy (Table 2).
Table 2.
Clinical variables predicting sc-TCMR
| Variables predicting sc-TCMR | Univariate analysis | Multivariate analysis | ||||
|---|---|---|---|---|---|---|
| OR | CI 95% | p value | OR | CI 95% | p value | |
| Clinical BPAR (<6 months) (no) | 0.093 | 0.023-0-365 | 0.001 | 0.088 | 0.015-0.500 | 0.006 |
| Post-transplant d-sp IFN-γ ELISPOT (NEG) | 0.054 | 0.007-0-429 | 0.006 | 0.072 | 0.008-0.653 | 0.019 |
| Time HD (months) | 1.015 | 0.999-1.030 | 0.074 | 1.012 | 0.992-1.032 | 0.245 |
| Induction type rATG (no) | 1.601 | 0.330-7.779 | 0.568 | 0.678 | 0.0877-5.952 | 0.731 |
| Donor type (L/D) | 1.127 | 0.328-3.877 | 0.851 | |||
| 6-month sCreat | 1.006 | 0.994-1.019 | 0.342 | |||
| DGF | 1.303 | 0.380-4.468 | 0.678 | |||
| Donor Age | 1.005 | 0.969-1.043 | 0.797 | |||
| HLA mismatch | 1.063 | 0.663-1.703 | 0.802 | |||
BPAR, biopsy proved acute rejection; D, deceased; DGF, delayed graft function; HD, hemodialysis; L, living; Neg, negative ELISPOT; rATG, rabbit anti-thymoglobulin; sc-TCMR, T-cell mediated subclinical rejection; sCreat, serum creatinine. Data is presented as Mean±SD. ‘p’ values for binary logistic regression.
Consistent with previously published studies (11–13), pre-transplant d-sp IFN-γ ELISPOT positivity correlated with development of TCMR only in subjects who did not receive rATG [12/13(92.3%) patients developing TCMR showed a positive ELISPOT and 1/13(7.7%) was negative, whereas 45/69 (65.2%) without TCMR showed a negative ELISPOT and 24/69 (34.8%) were positive (p=0.045)]. We did not observe a correlation between the pre- and post-transplant ELISPOT results (R=0.273, p=0.01). Nor did we observe an independent relationship between pre-transplant ELISPOT and 6-mo sc-AR, controlling for clinical variables including the type of induction therapy or previous BPAR (supplemental tables 2).
Previous works showed that urinary CXCL-9 and CXCL-10 measurement can noninvasively detect concurrent BPAR and predict patients who will develop BPAR after calcineurin inhibitor withdrawal (14–16), but their ability to detect and predict sc-AR remains unclear. We measured urinary levels of these inflammatory chemokines at 3- and 6-mo to test their utility as biomarkers of sc-AR as compared to the d-sp IFN-γ ELISPOT assay. While both urinary chemokines were significantly higher within all sc-AR types at 6-mo (p=0.01 and p=0.001 for CXCL10 and CXCL9, respectively vs those without sc-AR), neither 3-mo urinary CXCL-9 nor CXCL-10 associated with 6-mo sc-AR (supplemental figures 3a–b). Combining CXCL-9 and/or CXCL-10 with d-sp IFN-γ ELISPOT at 6-mo slightly increased the predictive capacity of d-sp ELISPOT alone for sc-TCMR (supplemental figures 3c, supplemental table 3).
Negative post-transplant d-sp IFN-γ ELISPOT patients do not develop de novo DSA
Since d-sp IFN-γ ELISPOT associates with sc-AR, which in turn has been associated with dnDSA formation, we explored the relationship between post-transplant d-sp IFN-γ ELISPOT and later development of dnDSA. We excluded 2/101 subjects from the analysis because they exhibited DSA at 6 months. At 2-years, 24/99 (24.2%) patients developed de novo anti-HLA antibodies (dnAbs), with 8/24 (33.3%) containing dnDSA (7 reactive to HLA class II alone and 1 reactive to class I and II: 5 anti-DQ, 3 anti-DR and 1 anti-A and anti-B).
6/14 (42.8%) patients with 6-mo sc-TCMR developed dnAbs, whereas only 18/85 (21.2%) patients without sc-TCMR did so (p=0.07). All patients with 6-mo sc-TCMR who developed dnAbs (6/6; 100%) were d-sp ELISPOT positive at 6-mo, while 12/18 (66.7%) patients without sc-TCMR developing dnAbs were positive. Banff scores from 6-mo biopsies were higher in subjects who later developed both dnAbs and dnDSA at 2-years, particularly at the microvascular circulation (supplemental figure 4a–b). No differences were observed in CNI trough levels between patients developing dnDSA and those that did not, and drug levels did not correlate with ELISPOT results (supplemental table 4).
7/8 (87.5%) patients with dnDSA at 24 months showed a positive d-sp IFN-γ ELISPOT at 6 months, whereas only 1/8 (12.5%) displayed a negative test (p=0.029) (figure 4). PPV and NPV of d-sp IFN-γ ELISPOT for predicting development of dnDSA were 14% and 98%, respectively. Two out of 7 (28.6%) patients with positive ELISPOT showed sc-TCMR.
Figure 4.
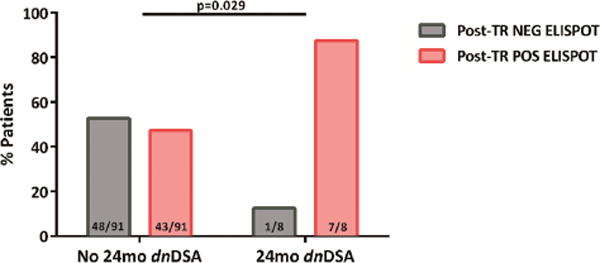
Most patients with emerging dnDSA at 24 months show high d-sp IFN-γ-producing T-cell frequencies during the first 6 months post-transplantation than patients that do not.
50/99 patients without DSA at 6 months were highly d-sp T-cell alloreactive either at 3 or 6 months, whereas 49/99 were not. Seven out of 8(87.5%) of patients showing dnDSA were highly d-sp T-cell alloreactive, whereas 1/8(12.5%) were not; 48/91(52.7%) of patients without dnDSA showed a positive d-sp IFN-γ ELISPOT and 43/91(47.3%) displayed a negative test (p=0.029).
Previous work by others showed that higher numbers of HLA eplet mismatches correlate with the risk of developing dnDSA (17). In our cohort we detected a trend toward a higher number of estimated HLA eplet mismatches in patients who developed dnDSA, but this association did not reach statistical significance. Nor did we detect a relationship with post-transplant ELISPOT positivity (supplemental table 5).
Univariate and multivariate logistic regression analysis including most relevant clinical, histological and immunological variables potentially associated with dnDSA at 24-mo after transplantation showed that the absence of d-sp T-cell alloreactivity measured by the IFN-γ ELISPOT was an independent variable that predicted absence of 24-mo dnDSA (Table 3).
Table 3.
Clinical variables predicting the development of dnDSA at 24 months.
| Variables predicting dnDSA | Univariate analysis | Multivariate analysis | ||||
|---|---|---|---|---|---|---|
| OR | CI 95% | p value | OR | CI 95% | p value | |
| Post-transplant d-sp IFN-γ ELISPOT (NEG) | 0.128 | 0.015-0.99 | 0.049 | 0.085 | 0.008-0.862 | 0.037 |
| Induction type rATG (no) | 0.356 | 0.077-1.642 | 0.192 | 0.154 | 0.023-1.005 | 0.051 |
| Clinical BPAR (no) | 0.413 | 0.074-2.303 | 0.314 | 0.430 | 0.046-4.062 | 0.462 |
| 6-month sc-TCMR | 0.456 | 0.082-2.524 | 0.372 | 1.126 | 0.145-8.743 | 0.916 |
| DGF | 0.765 | 0.171-3.427 | 0.739 | 0.913 | 0.173-4.823 | 0.918 |
| HLA mismatch | 1.387 | 0.693-2.775 | 0.366 | |||
| Eplet HLA AB mismatch | 1.055 | 0.931-1.195 | 0.404 | |||
| Eplet HLA DRB1 and DQA/B mismatch | 1.013 | 0.951-1.079 | 0.688 | |||
| Donor Age | 0.994 | 0.947-1.043 | 0.798 | |||
| Donor type (L/D) | 1.200 | 0.227-6.334 | 0.831 | |||
| Time HD (months) | 1.002 | 0.981-1.024 | 0.854 | |||
BPAR, biopsy proved acute rejection; D, deceased; DGF, delayed graft function; dnDSA, de novo donor-specific antibodies; HD, hemodialysis; L, living; NEG, negative ELISPOT; rATG, rabbit anti-thymoglobulin. Data is presented as Mean±SD. ‘p’ values for binary logistic regression.
Correlation between post-transplant d-sp IFN-γ ELISPOT and 24-month allograft function
We observed lower 2-year eGFR in subjects with 6-mo sc-AR (either TCMR, ABMR or mixed) and in those who developed dnDSA (supplemental figure 5a–b). Lower 2-year eGFR values were also observed in subjects with a positive post-transplant d-sp IFN-γ ELISPOT compared to those with negative ELISPOT (supplemental figure 5c). Finally, when we performed an unsupervised principal component analysis (PCA) taking into account post-transplant d-sp T-cell alloreactivity, the development of dnDSA in relation to kidney allograft function at 24-mo, transplant patients segregated into 2 distinct groups, those without d-sp T-cell alloreactivity and absence of dnDSA with better 24-mo allograft function and those with high d-sp alloreactivity and presence of dnDSA with worse 24-month allograft function (PCA mapping=92.2%) (figure 5).
Figure 5.
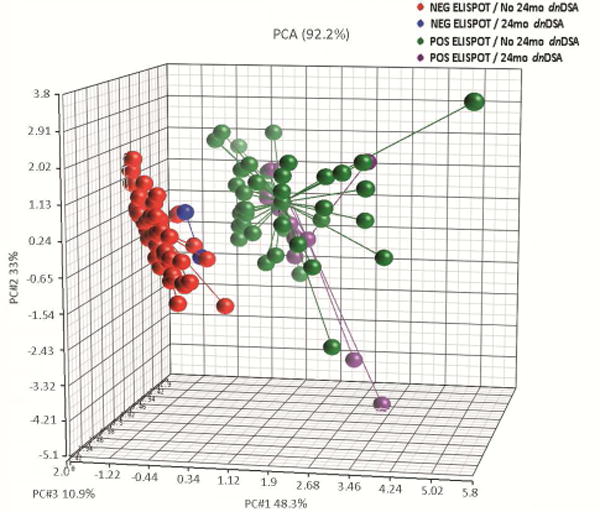
Unsupervised principal component analysis (PCA) plot evaluating the development dnDSA, post-transplant d-sp T-cell alloreactivity in relation to kidney allograft function (serum creatinine) at 24 months. The unsupervised principal component analysis (PCA) segregated the patients into 2 different groups, those without d-sp T-cell alloreactivity (negative d-sp IFN-γ ELISPOT), absence of dnDSA and better preserved 24-month kidney allograft function from those transplant patients with high d-sp alloreactivity (positive d-sp IFN-γ ELISPOT), presence of de novo humoral immunity and worse 24-month allograft function. Percentages of variance were: 48.3% for principal component 1, 33% for principal component 2 and 10.9% for principal component 3 (PCA mapping= 92.2%).
DISCUSSION
Our new data, involving test and validation sets, show that post-transplant measurements of donor-reactive memory T cells by IFN-γ ELISPOT assay can discriminate, within kidney transplant patients on CNI-based chronic immunosuppression and stable renal function, subjects with minimal risk of having concurrent or future intragraft infiltrates from those with an elevated chance of displaying histological features of sc-AR. Our findings also indicate that patients with a negative d-sp IFN-γ ELISPOT more unlikely develop dnDSA and show better allograft function at 2-years after transplant.
The data indicate that a negative post-transplant d-sp IFN-γ ELISPOT along with absence of serum DSA, confer an extremely low likelihood (<5%) of developing sc-TCMR or ABMR at 6 months. This result is independent of the baseline pre-transplant ELISPOT status of transplant patients, which we herein and others (11–13) have shown is associated with high risk of developing clinical TCMR in the absence of T-cell depleting induction therapy.
Our data support the contention that 6-mo surveillance biopsies can be avoided in transplant patients with negative 3- or 6-mo d-sp IFN-γ ELISPOT results (and absent DSA) the risk of undetected sc-AR is extremely low in this population. Since >60% of patients in our cohort fit these criteria the absence of biopsy-related morbidities and cost savings associated with avoiding surveillance biopsies is significant. Our group previously reported an association between 6-mo IFN-γ ELISPOT and simultaneous sc-TCMR in a small cohort of patients (18). However, our current data significantly expand upon this result by identifying a threshold for ELISPOT that is predictive as well as diagnostic in a prospective validation set, specifically identifying the large subset of patients at lowest risk as well as patients at increased risk of later development of dnDSA and eGFR decline despite stable graft function. Therefore, the testing strategy thereby identifies subjects who are most likely to benefit from a surveillance biopsy and in whom maintenance or intensification of clinical monitoring and immunosuppression may be beneficial (figure 6).
Figure 6.
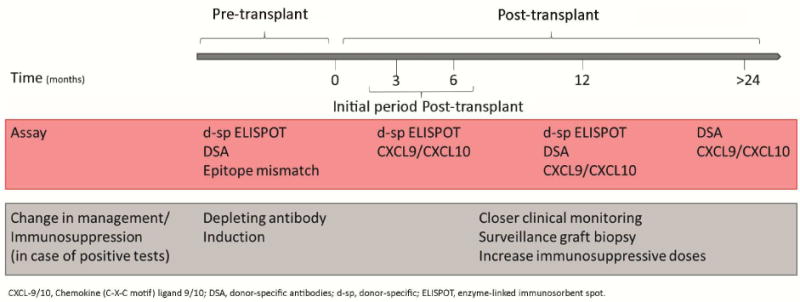
Proposed algorithm for tailoring clinical monitoring and immunosuppression based on the results of 6-month d-sp IFN-γ ELISPOT.
In our prospectively followed-up cohort, patients with a positive post-transplant ELISPOT developed more frequently dnDSA at 2 years after transplantation than patients with a negative test, suggesting the potential utility of ELISPOT to guide anti-HLA antibody screening over time. Our findings are consistent with experimental studies demonstrating the crucial role of alloreactive T cells (measured by IFN-γ ELISPOT) for B-cell activation and memory formation (19). The association between the frequency of circulating memory T cells measured by IFN-γ ELISPOT, T cell graft infiltrates in surveillance biopsy, and dnDSA reported herein also provides a mechanistic explanation for previous reports showing the higher risk of chronic ABMR or dnDSA formation in patients experiencing clinical or sc-TCMR (20–22), and for the persistence of directly-primed alloreactive T cells through the semidirect antigen-presenting pathway over the course of the transplant (23–25). In our study, we did not observe a correlation between the number of HLA eplet mismatch and the development of dnDSA or post-transplant ELISPOT data. Nonetheless, a limitation of this approach is that the HLA typing was done with a low-resolution approach and was inferred using the matchmaker program converting it into high resolution using a local frequency table typed by SBT (17).
One limitation of our work is the lack of surveillance biopsies at 3-mo after transplantation to assess whether histological abnormalities detected at 6-mo were already present at 3-mo. Without this information, we cannot formally establish whether a positive d-sp IFN-γ ELISPOT at 3-mo detects an ongoing sc-AR or precedes its occurrence. However, finding that patients with sc-AR at 6 months had positive CXCL-9 and CXCL-10 in the urine collected at the time of surveillance biopsy but not 3-mo prior suggests that the presence of intragraft infiltrates at 3-mo is unlikely. Indeed, these chemokines have been consistently reported to be elevated in the presence of graft infiltrates (14,15). The predictive power of using combined of CXCL-9 and CXCL-10 information increased over the one obtained using single chemokines, but still did not reach statistical significance. Additional measurements between 3- and 6-mo were not done, hence preventing to test changes in urinary chemokine levels before the protocol biopsy.
In conclusion, early post-transplant d-sp IFN-γ ELISPOT identifies kidney transplant patients at increased risk of intragraft infiltrates despite stable renal function and predicts the subsequent development of dnDSA and graft dysfunction over a 2-year follow-up period. The high NPV of this assay could be used to avoid invasive surveillance biopsies and guide transplant clinicians in decision-making on clinical monitoring and immunosuppression. Prospective, interventional studies are warranted and are on-going (http://www.biodrim.eu/) to test the hypothesis that titrating immunosuppression in kidney transplant patients according to the result of d-sp IFN-γ ELISPOT and DSA provides better patient and graft outcomes than current standard protocol-driven immunosuppression.
MATERIAL AND METHODS
Patients and study design
All patients included in the study gave written informed consent to participate and the study was approved by the IRB at Bellvitge University Hospital. We evaluated 407 peripheral blood samples and 202 urine and serum specimens from 161 adult kidney transplant recipients (figure 1). A first group of 60 consecutive kidney transplants showing stable allograft function, transplanted between December 2009 and June 2011, in whom donor and recipient peripheral blood samples were available at the time of 6-mo protocol biopsies, were used as a discovery set and evaluated in a cross-sectional analysis with the d-sp IFN-γ ELISPOT assay for its predictive value of 6-mo sc-AR. A slightly higher incidence of sc-AR in the training set than in the general population was accepted, to have sufficient number of immune-mediated events to be evaluated. Subsequently, an additional cohort of 101 consecutive kidney transplant recipients transplanted between January 2012 and January 2014, showing stable 6-mo allograft function and in whom donor and recipient peripheral blood samples and recipient urine specimens were available both at 3-mo and at the time of 6-mo protocol biopsies were prospectively followed for at least 2 years (mean 35.82 months, range 24-49.6 months) and used as a validation cohort. In this second independent set, the d-sp IFN-γ ELISPOT assay and urinary CXCL-10 and CXCL-9 chemokine levels were evaluated at 3- and 6-mo and assessment of de novo anti-HLA antibodies were prospectively investigated at 6 and 24-mo after transplantation. Moreover, in 145 out of the 161 patients, a pre-transplant d-sp IFN-γ ELISPOT was also tested (45 patients from the discovery set and 96 from the validation set). Patients displaying pre-transplant DSA were excluded from the analysis, and most patients did not show clinically detectable drug non-compliance (supplemental table 4). The d-sp IFN-γ ELISPOT, urinary chemokines and anti-HLA antibody data were not available to the clinicians during the course of the transplant, so they had no influence on the choice of immunosuppression and clinical management.
Main baseline demographic variables were collected at the time of transplantation (supplemental table 6). Both groups were comparable regarding main clinical variables. As per protocol in our unit, a higher use of T-cell depletion and m-TOR-inhibitors was given during the first period of time. Patients of the study were not treated with rescue therapies after performing 6-mo surveillance biopsies.
Donor and recipient cell source: sample collection and processing
Donor and recipient cell collection process is described in detail as supplemental material.
Donor-specific IFN-γ ELISPOT assays
Donor-specific (d-sp) IFN-γ ELISPOT assays were performed following recently described standard operating procedures (7). Description of the methodology is provided as supplemental material.
Analysis of urine CXCL9 and CXCL10 chemokines
Urine samples were collected at 3 and 6 months post-transplantation and frozen at −80°C within 2 hours of collection. Thawed samples were centrifuged at 2000g for 30min and urine supernatants were analyzed for CXCL-9 and CXCL-10 chemokines following manufacturers ELISA procedures (R&D Systems, Minneapolis, USA). To correct the data for different urine dilution, the values of urine chemokine excretion are given in relation to the respective urine creatinine (ng protein/mmol creatinine), measured by the Jaffe’s reaction using Olympus AU400 analyzer (Germany).
HLA typing and Eplet mismatch analysis
Automated nucleotide sequencing was performed from genomic DNA by selective amplification (PCR) of target exons from each locus for a particular allele. Loci sequenced included HLA class I (A, B, and C) and II (DRB1/3/4/5 and DQA1/DQB1). Nucleotide sequencing was done as previously described (26).
The HLA Matchmaker program (Rene Duquesnoy, 2016. Tools: 4ABCEpletMatchingVs02protoype.xlsb.and DRDQDPEpletMatchingVs02protoype.xlsb. from http://www.epitopes.net/downloads.html) was used to asses eplet matching for all transplants. Donor and recipient typing (A, B, DR and DQ) were converted into high resolution using a local frequency table typed by SBT. Total number of incompatible eplets and antibody proven eplets were calculated (17).
Assessment of anti-HLA antibodies
Screening for circulating anti-HLA class I and II alloantibodies was done in serum samples at pre-transplant, 6 and 24 months after transplantation and determined using single-antigen flow beads assays on a Luminex platform (Lifecodes, division of Immucor, Stanford, CT). All beads showing a normalized MFI>1500 MFI were considered positive if (MFI/(MFI lowest bead))>5.
Renal allograft histology
Protocol kidney allograft biopsies were performed at 6 months after transplantation in all patients. By definition, all biopsies were done as part of the routine care of kidney transplant recipients in our center and not motivated by changes in graft function and all of them displayed stable kidney allograft function, depicted as<20% change in serum creatinine levels 1 month prior and after performing the biopsy as previously described (4). All renal biopsies were analyzed following the Banff’13 score classification (27) and histological analyses were blindly evaluated by a single renal pathologist. Acute sc-AR was considered as Banff score grade ≥IA and a preserved graft parenchyma was considered as stable (STA) (supplemental table 1). None of the patients from the discovery set showed borderline changes (BL), whereas 13/101 (12.9%) of the validation cohort did. Patients with BL were merged with STA individuals since they showed preserved allograft function as STA patients at 2 years and significantly better than sc-AR (data not shown). In addition, none of the BL patients showed DSA and the majority [10/13(77%)] displayed a negative d-sp IFN-γ ELISPOT.
Statistical analysis
All data are presented as mean ± standard deviation. Groups were compared using the X2-test for categorical variables and the one-way ANOVA analysis or Student’s T-test for normally distributed data for quantitative variables, and nonparametric Kruskal– Wallis or Mann–Whitney U-test for non-normally distributed variables. Bivariate correlation analyses were done using Pearson or Spearman test for non-parametric variables. A sensitivity/specificity receiver operating characteristic (ROC) curve test was done to determine the best cut-off value of the IFN-γ ELISPOT and urinary chemokines for predicting the advent of sc-AR. Logistic regression analyses were performed to determine the independent correlation of variables that were statistically significant in the univariate analyses and those potentially associated with 6-mo sc-TCMR and with the development of dnDSA. For the prediction analysis of sc-AR all patients of the validation cohort (n=101) were taken into account. The same analysis was also done excluding those with previous BPAR (n=90). For the analysis of development of de novo anti-HLA Ab or dnDSA, all patients but those with sc-ABMR at 6-mo protocol biopsies were considered (n=99). We performed a direct comparison between patients excluded in some of the analyses (BPAR and 6-mo dnDSA) with the rest of the patients included to show that both populations were comparable (supplemental table 7). The statistical significance level was defined as 2-tailed p<0.05. We performed an unsupervised principal component analysis on the basis of combined post-transplant d-sp T-cell ELISPOT, presence of dnDSA and allograft function depicted by serum creatinine at 24 months.
All statistical analyses were performed with IBM® Spss Statistics (version 23) and GraphPad Prism (version 6.0; GraphPad Software, USA). Unsupervised principal component analysis (PCA) was done using Partek Genomics Suite v.6.6 (Partek Inc., USA).
Supplementary Material
Acknowledgments
We acknowledge the Bio-bank coordinator and Ms Gema Cerezo at Bellvitge University Hospital for carefully processing all biological samples. This study was partially supported by two Spanish public grant (FIS PI13/01263; ICI14/00242), the Spanish REDinREN consortium and a European Commission grant from the Biomarker-Driven Immunosuppression Minimization (BIODRIM) Consortium (12CEE014) awarded to OB. OB was awarded with an intensification grant from the ISCiii (2015/2016). The work was also supported in part by U01 AI63594 awarded to PH. PC is supported by NIH T32 training grant 5T32AI078892-07.
Footnotes
Publisher's Disclaimer: This is a PDF file of an unedited manuscript that has been accepted for publication. As a service to our customers we are providing this early version of the manuscript. The manuscript will undergo copyediting, typesetting, and review of the resulting proof before it is published in its final citable form. Please note that during the production process errors may be discovered which could affect the content, and all legal disclaimers that apply to the journal pertain.
DISCLOSURE
The authors of this manuscript have no conflicts of interest to disclose.
Supplementary information is available at Kidney International’s .
References
- 1.Lamb KE, Lodhi S, Meier-Kriesche HU. Long-term renal allograft survival in the United States: a critical reappraisal. Am J Transplant. 2011 Mar;11(3):450–62. doi: 10.1111/j.1600-6143.2010.03283.x. [DOI] [PubMed] [Google Scholar]
- 2.Rush D, Nickerson P, Gough J, et al. Beneficial effects of treatment of early subclinical rejection: a randomized study. J Am Soc Nephrol. 1998;9:2129–34. doi: 10.1681/ASN.V9112129. [DOI] [PubMed] [Google Scholar]
- 3.Cosio FG, Grande JP, Wadei H, et al. Predicting subsequent decline in kidney allograft function from early surveillance biopsies. Am J Transplant. 2005;5:2464–72. doi: 10.1111/j.1600-6143.2005.01050.x. [DOI] [PubMed] [Google Scholar]
- 4.Moreso F, Ibernon M, Gomà M, et al. Subclinical rejection associated with chronic allograft nephropathy in protocol biopsies as a risk factor for late graft loss. Am J Transplant. 2006;6:747–52. doi: 10.1111/j.1600-6143.2005.01230.x. [DOI] [PubMed] [Google Scholar]
- 5.Moreso F, Carrera M, Goma M, et al. Early subclinical rejection as a risk factor for late chronic humoral rejection. Transplantation. 2012;93:41–6. doi: 10.1097/TP.0b013e31823bb647. [DOI] [PubMed] [Google Scholar]
- 6.Thaunat O, Legendre C, Morelon E, et al. To biopsy or not to biopsy? Should we screen the histology of stable renal grafts? Transplantation. 2007;84:671–6. doi: 10.1097/01.tp.0000282870.71282.ed. Review. [DOI] [PubMed] [Google Scholar]
- 7.Bestard O, Crespo E, Stein M, et al. Cross-validation of IFN-γ Elispot assay for measuring alloreactive memory/effector T cell responses in renal transplant recipients. Am J Transplant. 2013;13:1880–90. doi: 10.1111/ajt.12285. [DOI] [PubMed] [Google Scholar]
- 8.Ashoor I, Najafian N, Korin Y, et al. Standardization and cross validation of alloreactive IFN-γ ELISPOT assays within the clinical trials in organ transplantation consortium. Am J Transplant. 2013;13:1871–9. doi: 10.1111/ajt.12286. [DOI] [PMC free article] [PubMed] [Google Scholar]
- 9.Heeger PS, Greenspan NS, Kuhlenschmidt S, et al. Pre-transplant frequency of donor-specific, IFN-γ-producing lymphocytes is a manifestation of immunologic memory and correlates with the risk of post-transplant rejection episodes. J Immunol. 1999;163:2267–2275. [PubMed] [Google Scholar]
- 10.Nickel P, Presber F, Bold G, et al. Enzyme-linked immunosorbent spot assay for donor-reactive interferon-gamma-producing cells identifies T-cell presensitization and correlates with graft function at 6 and 12 months in renal-transplant recipients. Transplantation. 2004;78:1640–1646. doi: 10.1097/01.tp.0000144057.31799.6a. [DOI] [PubMed] [Google Scholar]
- 11.Crespo E, Lucia M, Cruzado JM, et al. Pre-transplant donor-specific T-cell alloreactivity is strongly associated with early acute cellular rejection in kidney transplant recipients not receiving T-cell depleting induction therapy. PLoS One. 2015;10:e0117618. doi: 10.1371/journal.pone.0117618. [DOI] [PMC free article] [PubMed] [Google Scholar]
- 12.Augustine JJ, Poggio ED, Heeger PS, et al. Preferential benefit of antibody induction therapy in kidney recipients with high pretransplant frequencies of donor-reactive interferon-gamma enzyme-linked immunosorbent spots. Transplantation. 2008;86:529–34. doi: 10.1097/TP.0b013e31818046db. [DOI] [PMC free article] [PubMed] [Google Scholar]
- 13.Cherkassky L, Lanning M, Lalli PN, et al. Evaluation of alloreactivity in kidney transplant recipients treated with anti-thymocyte globulin versus IL-2 receptor blocker. Am J Transplant. 2011;11:1388–96. doi: 10.1111/j.1600-6143.2011.03540.x. [DOI] [PMC free article] [PubMed] [Google Scholar]
- 14.Jackson JA, Kim EJ, Begley B, et al. Urinary chemokines CXCL9 and CXCL10 are non-invasivemarkers of renal allograft rejection and BK viral infection. Am J Transplant. 2011;11:2228–2234. doi: 10.1111/j.1600-6143.2011.03680.x. [DOI] [PMC free article] [PubMed] [Google Scholar]
- 15.Hricik DE, Nickerson P, Formica RN, et al. Multicenter validation of urinary CXCL9 as a risk-stratifying biomarker for kidney transplant injury. Am J Transplant. 2013;13:2634–44. doi: 10.1111/ajt.12426. [DOI] [PMC free article] [PubMed] [Google Scholar]
- 16.Hricik DE, Formica RN, Nickerson P, et al. Adverse Outcomes of Tacrolimus Withdrawal in Immune-Quiescent Kidney Transplant Recipients. J Am Soc Nephrol. 2015;26:3114–22. doi: 10.1681/ASN.2014121234. [DOI] [PMC free article] [PubMed] [Google Scholar]
- 17.Wiebe C, Pochinco D, Blydt-Hansen TD, et al. Class II HLA epitope matching-A strategy to minimize de novo donor-specific antibody development and improve outcomes. Am J Transplant. 2013;13:3114–22. doi: 10.1111/ajt.12478. [DOI] [PubMed] [Google Scholar]
- 18.Bestard O, Cruzado JM, Lucia M, et al. Prospective assessment of antidonor cellular alloreactivity is a tool for guidance of immunosuppression in kidney transplantation. Kidney Int. 2013;84:1226–36. doi: 10.1038/ki.2013.236. [DOI] [PubMed] [Google Scholar]
- 19.Gorbacheva V, Fan R, Fairchild RL, et al. Memory CD4 T Cells Induce Antibody-Mediated Rejection of Renal Allografts. J Am Soc Nephrol. 2016 doi: 10.1681/ASN.2015080848. pii: ASN. 2015080848 [Epub ahead of print] [DOI] [PMC free article] [PubMed] [Google Scholar]
- 20.Wiebe C, Gibson IW, Blydt-Hansen TD, et al. Evolution and clinical pathologic correlations of de novo donor-specific HLA antibody post kidney transplant. Am J Transplant. 2012;12:1157–67. doi: 10.1111/j.1600-6143.2012.04013.x. [DOI] [PubMed] [Google Scholar]
- 21.Chemouny JM, Suberbielle C, Rabant M, et al. De Novo Donor-Specific Human Leukocyte Antigen Antibodies in Nonsensitized Kidney Transplant Recipients After T Cell-Mediated Rejection. Transplantation. 2015;99:965–72. doi: 10.1097/TP.0000000000000448. [DOI] [PubMed] [Google Scholar]
- 22.El Ters M, Grande JP, Keddis MT, et al. Kidney allograft survival after acute rejection, the value of follow-up biopsies. Am J Transplant. 2013;13:2334–41. doi: 10.1111/ajt.12370. [DOI] [PubMed] [Google Scholar]
- 23.Baker RJ, Hernandez-Fuentes MP, Brookes PA, et al. Loss of direct and maintenance of indirect alloresponses in renal allograft recipients: implications for the pathogenesis of chronic allograft nephropathy. J Immunol. 2001;167:7199–206. doi: 10.4049/jimmunol.167.12.7199. [DOI] [PubMed] [Google Scholar]
- 24.Herrera OB, Golshayan D, Tibbott R, et al. A novel pathway of allorecognition presentation by dendritic cells. J Immunol. 2004;173:4828–4837. doi: 10.4049/jimmunol.173.8.4828. [DOI] [PubMed] [Google Scholar]
- 25.Bestard O, Nickel P, Cruzado JM, et al. Circulating alloreactive T cells correlate with graft function in longstanding renal transplant recipients. J Am Soc Nephrol. 2008;19:1419–29. doi: 10.1681/ASN.2007050539. [DOI] [PMC free article] [PubMed] [Google Scholar]
- 26.Baxter-Lowe LA. HLA-DR sequence-based typing. In: Noreen H, editor. Am Soc Histocompat Immunogenet. 2.4.2. ASHI Laboratory Manual; 2003. V.C.8.1. [Google Scholar]
- 27.Haas M, Sis B, Racusen LC, Solez K, Glotz D, et al. Banff 2013 meeting report: inclusion of c4d-negative antibody-mediated rejection and antibody-associated arterial lesions. Am J Transplant. 2014;14:272–83. doi: 10.1111/ajt.12590. [DOI] [PubMed] [Google Scholar]
Associated Data
This section collects any data citations, data availability statements, or supplementary materials included in this article.


