

Abstract
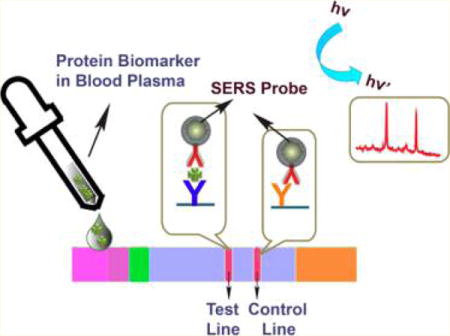
An inexpensive and disposable paper-based lateral flow strip (PLFS) has been developed as an immunoassay, in which surface-enhanced Raman scattering (SERS) is utilized for sensing signal transduction. The Au nanostar@Raman Reporter@silica sandwich nanoparticles are developed as the SERS probes, which is the key to the high sensitivity of the device. Compared with a colorimetric PLFS, the SERS-PLFS exhibits superior performance in terms of sensitivity and limit of detection (LOD) in a blood plasma-containing sample matrix. In addition, the SERS-PLFS has been successfully used for detection of neuron-specific enolase (NSE), a traumatic brain injury (TBI) protein biomarker, in diluted blood plasma samples, achieving a LOD of 0.86 ng/mL. Moreover, the SERS-PLFS was successfully employed to measure the NSE level in clinical blood plasma samples taken from deidentified TBI patients. This work demonstrates that the SERS-PLFS has great potential in assisting screening of TBI patients in the point-of-care setting.
Graphical abstract
Traumatic brain injury (TBI) is a leading cause of death and disability in both the United States and the developed world. Approximately 2.8 million TBI-related emergency department (ED) visits, hospitalizations and deaths occurred in the United States in 2013.1 The estimated direct and indirect medical costs of TBI were estimated to be in excess of $76 billion in 2010.2 The current ED standard of care for the initial assessment of a patient’s potential TBI includes employment of the Glasgow Coma Scale (GCS), in which a clinician numerically assesses the brain impairment based on the bedside physical examination, and computed tomography (CT) scans. These screening tools are presently used for initial clinical management and prognosis of TBI.3 However, they cannot provide information on pathophysiological processes, and they are not very sensitive or specific, particularly in the case of mild or moderate TBI. On the other hand, some ED patients with traumatic injuries and a poor GCS are subject to brain impairment due to intoxication from alcohol and/or drugs instead of from a true brain injury. Although early CT scans are useful for detection of intracerebral hemorrhage, they are often less effective at early detection of the more common cerebral contusions and diffuse axonal injury. Additionally, there has been a growing concern regarding radiation exposure from the use of screening CT scans in patients with possible TBI. Magnetic resonance imaging (MRI) is much more sensitive for detecting early TBI and does not expose patients to radiation. However, these studies are expensive and time-consuming,4 often require patient sedation, and are frequently unavailable at the ED. Early and accurate diagnosis of TBI is clinically important, as currently routine yet potentially unnecessary screening imaging might be avoided. Additionally, many patients with even mild TBI may experience short- or long-term sequelae including changes in attention and memory and emotional disturbances that may benefit from early diagnosis and intervention.2 Importantly, TBI clinical trials such as those testing potential early therapies aimed at, for example, decreasing secondary injury have been severely hampered by the dilemma of early diagnosis of true TBI as opposed to intoxication, with this “noise” requiring an increase in sample size and expense, and possible dilution of the measurable effect of the potential therapy. Measurement of protein biomarkers can provide an alternative route for rapid and accurate disease diagnosis. Protein biomarkers are present in human fluids, such as blood, saliva, or urine, which makes the tests much less invasive, rapid, and inexpensive and avoids the radiation involved with CT scans and time, sedation, and expense of MRIs.
The most common TBI biomarkers are glial fibrillary acidic protein (GFAP), S100-β, and neuron-specific enolase (NSE),5,6 which are released into circulation after the brain damage occurs.7 Several methods have been employed to measure the protein biomarkers, including enzyme-linked immunosorbent assay (ELISA), Western blot, and agarose. However, those methods generally involve time-consuming operation processes and large sample volume and require expensive instruments, which cannot be used as the point-of-care (POC) analytical tools for rapid and low-cost clinical diagnosis. Therefore, great efforts have been devoted to developing portable biosensors toward POC testing. Recently, several biosensors have been employed for NSE biomarker detection, including electro-chemistry,8–12 chemiluminescence,13 and field-effect transistor.14 However, most of these biosensors were tested in buffer solutions and did not demonstrate the direct detection of NSE biomarker in human fluidic samples. Moreover, many biosensors still need multiple steps of operation in vials, which are not user-friendly. Hence, it remains a challenge for those sensors to be used in a POC setting.
Paper-based lateral flow strips (PLFS) have received increasing attention as POC tools because they are inexpensive, user-friendly, and easy to operate.15,16 Colorimetric,17,18 fluorescent,19 and electrochemical20 transducers are commonly used in PLFS. Unfortunately, they usually suffer from poor sensitivity and serious interference from sample matrices when they are used in blood plasma samples. In contrast, surface-enhanced Raman scattering (SERS) has strong anti-interference ability in real-world samples because the wavelengths of both the excitation light and the scattering Raman signals can be tailored into the near-infrared biological transparency window, and Raman spectra are characteristic of fingerprint signatures of target molecules.21–23 Several papers have recently reported the incorporation of SERS transducers into PLFS for detection of proteins and nucleic acids in water or buffer solutions.24–26 In these reported SERS-PLFS, bare Au nanoparticles were used as the SERS substrates. Bare Au nanoparticle-based SERS probes are unstable in aqueous solutions with high ionic strength or in blood samples,27 which raises serious concern about reliability and robustness. Hence, the SERS-PLFS based on bare Au nanoparticle have not been applied to blood samples yet.
To address the instability issue of bare gold nanosphere-based SERS probes, Au nanostar@Raman Reporter@silica sandwich nanoparticles have been developed as the SERS probes in our research group,27 in which the Raman reporter molecules are sandwiched between an Au nanostar and a thin silica shell. This structure prevents Raman reporter molecules from leaking out. The Au nanostar generates a strong plasmonic field for amplifying SERS signal. The silica shell not only provides a platform for bioconjugation but also makes the SERS probe water-soluble. Our previous study has shown that these types of sandwich SERS probes are very stable in aqueous solutions with high ionic strength while bare Au nanoparticles tend to aggregate under the same condition.27 In the present work, the sandwich SERS probes are incorporated into a PLFS to detect the NSE biomarker in blood plasma. By comparison, a colorimetric PLFS with bare plasmonic Au nanospheres is also used for protein detection. Compared to the colorimetric PLFS, the SERS-based PLFS shows much higher sensitivity in blood plasma samples. To the best of our knowledge, this report for the first time demonstrates the successful detection of protein biomarkers in clinical blood plasma samples using a SERS-based PLFS without any purification or separation procedure. The results show a great potential of SERS-PLFS in the POC setting.
MATERIALS AND METHODS
Reagents and Materials
Malachite green isothiocyanate (MGITC) was purchased from Molecular Probes, Inc. 4-Mercaptobenzoic acid (technical grade, 90%) (4-MBA) was purchased from Sigma-Aldrich. 3-Triethoxylsilylpropyl succinic anhydride (TEPSA) was obtained from Gelest Inc. N-hydroxysuccinimide (NHS), 1-ethyl-3-(3-(dimethylamino)-propyl) carbodiimide (EDC), and tetraethyl orthosilicate (TEOS) were purchased from Sigma-Aldrich; HAuCl4, sucrose, Na3PO4·12H2O, Tween 20, Triton X-100, trisodium citrate, PBS (pH = 7.4), Na3PO4·12H2O, BSA (bovine serum albumin), Triton X-100, and sodium chloride were acquired from Sigma-Aldrich and used without further purification. Sucrose was purchased from VWR.
Goat antihuman IgG polyclonal antibody, mice antigoat IgG polyclonal antibody, IgG from human serum, Neuron-specific enolase from human brain (NSE), and antineuron-specific enolase antibody were procured from Sigma-Aldrich. Neuron-specific Enolase Quantikine ELISA Kits were purchased from R&D System and Eagle Bio. The blood plasma was purchased from US Biological Life Science (P4252-56 Plasma, Human, IgG Free). Glass fibers (GFCP000800), cellulose fiber sample pads (CFSP001700), laminated cards with Hi Flow plus cards (HF090MC100 with RK12312 Membrane (0.45 μm)), and nitrocellulose membrane (RK13464 (0.22 μm)) were purchased from Millipore (Billerica, MA).
Clinical blood plasma samples were collected from TBI patients presenting to the ED as part of the Resuscitative Endocrinology: Single-dose Clinical Uses for Estrogen pilot clinical trial for traumatic brain injury (RESCUE-TBI) conducted by researchers at the University of Texas Southwestern Medical Center and Parkland Hospital. As part of this study, the clinical samples were serially collected at various time points over the first 5 days following TBI and stored at −80 °C prior to measurement. All work conducted in the pilot clinical trial was approved by the National Heart, Lung, and Blood Institute’s Resuscitation Outcomes Consortium Protocol Review Committee and Data Safety Monitoring Board, the U.S. Food and Drug Administration, and the University of Texas Southwestern Medical Center Institutional Review Board. Use of these deidentified human samples at West Virginia University was approved by the West Virginia University Institutional Review Board.
Instruments and Characterization
All Raman spectra were acquired with a portable B&W Tek i-Raman Plus. Fourier transform infrared (FT-IR) spectra were obtained under the attenuated total reflection (ATR) mode with Thermo Nicolet 6700 spectrometer. The nanoparticles were characterized with a transmission electron microscope (TEM, JEOL JEM-2100F) at an acceleration voltage of 200 kV. UV–visible absorption spectra were obtained with a Shimadzu UV-2550 spectrometer.
Synthesis of SERS Probes and Conjugation with Detection Antibodies
The Au nanostars, the SERS probes, and the nanoparticles conjugated with detection antibodies were synthesized according to our previous paper.23 The preparation procedure is illustrated in Figure S1. Briefly, the Au nanostar@Raman molecule@Silica sandwich SERS probes were synthesized by adding 1.0 μM Raman molecules into the Au nanostar suspension. Then, 200 μL of 1% TEOS and 15 μL of ammonium solution were added into the mixture, successively. After the SERS probes were formed, the resulting solutions were centrifuged and resolved in 500 μL of ethanoic solution. Figure S2 shows the TEM images of the sandwich-typed SERS nanoparticles. The Au nanostars were coated with a 2–3 nm thick silica layer on the outer surface. The coating of the silica layer was further approved by the UV–visible absorption spectra. That is, the localized surface plasmon resonance (LSPR) absorption band of the nanoparticles shifted from 770 to 790 nm after it was coated with silica (Figure S3). Next, 100 μL of TEPSA was added to the SERS probe solution and then incubated overnight to achieve the carboxyl-group-terminated SERS probes. In the current study, the conjugation of carboxyl-group onto the surface of SERS nanoparticles was confirmed by FT-IR spectra (Figure S4). The carboxyl-group-terminated sandwich nanoparticles were then activated by adding a PBS buffer solution containing 50 mM NHS and 200 mM EDC and then incubated for 1 h. Subsequently, 100 μL of 1.0 mg/mL detection antibody was added, and the mixture was incubated overnight. After that, the mixture was centrifuged and washed with a PBS buffer three times to remove excessive free antibody. The resulting SERS probe conjugates were stored in 100 μL of eluent buffer (20 nM of Na3PO4·12H2O containing 5% BSA, 0.25% Tween 20, and 10% sucrose) solution for future use. The successful conjugation of detection antibody onto SERS nanoparticles was confirmed by the FT-IR spectra (Figure S5).
Preparation of SERS-Based PLFS
Figure 1a shows the schematic diagram of the PLFS, which consists of four components: a sample pad, a conjugate pad, a nitrocellulose membrane (NC membrane), and an absorbent (or wick) pad. All the components were mounted on a common backing layer (typically an inert plastic, e.g., polyester). The sample pad was saturated with a Tris-HCl buffer (pH 8.0) containing 0.23% Triton X-100 and 0.05 and 0.15 M NaCl. The pad was then dried at 37 °C for 2 h and stored in a desiccator at room temperature (RT). Then, 200 μL of 2.5 mg/mL capture antibodies and secondary antibodies were dispensed onto the NC membrane by a homemade dispenser to form a test line and a control line, respectively. The capture antibody and the secondary antibody were dispensed twice and once, respectively. The distance between the test line and control line was 3 mm. The membrane was then dried at 37 °C for 1 h and stored at 4 °C under a dry condition. Successful conjugation of antibody onto the NC membrane was confirmed by FT-IR spectra (Figure S6), in which the peak at 1534 cm−1 indicated the N–H bending. The SERS probes conjugated with the detection antibodies were dropped onto the conjugate pad. Finally, all the four processed components were assembled onto a plastic adhesive backing layer. The components were overlapped with 2 mm to ensure that the solution was able to flow through the whole strip. Each strip was cut to be 3 mm wide by a paper cutter (Swingline 12 in. ClassicCut Lite Trimmer). Before testing, 7 μL of SERS probes conjugated with the detection antibody was loaded onto the conjugate pad of PLFS. During testing, 100 μL of sample solution containing a certain concentration of analytes was dropped on the sample pad of PLFS.
Figure 1.
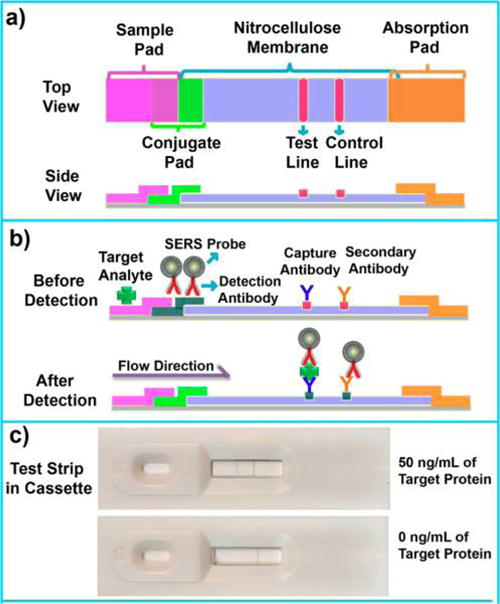
Schematic illustration of the operation principle of SERS paper-based lateral flow strip (PLFS). (a) Top and side views; (b) side view before and after detection of protein biomarker; (c) optical photos of PLFS assembled in cassettes in the presence (upper) and absence (bottom) of the target protein.
RESULTS AND DISCUSSION
Operation Principle of PLFS
The prepared PLFS is a carrier device containing dry reagents that are activated by applying a fluid sample (Figure 1b). Once the sample solution containing analyte is dropped onto the sample pad of PLFS, the solution will flow to the conjugate pad by the capillary force. On the conjugate pad, the target protein molecules interact with the SERS probes conjugated with detection antibodies to form a complex of target protein-detection antibodies labeled SERS probes. The resulting complex continues to move until it is captured by the capture antibody on the test line. At this moment, the SERS probes are accumulated on the test line through the formation of a sandwich-type configuration of SERS probe (linked with detection antibody)-protein-capture antibody. The excessive SERS probes linked with detection antibodies continue to migrate and then are captured by the control line where the secondary antibody is immobilized. As a result, two greyish bands are displayed on the test line and the control line, respectively (Figure 1c). A portable Raman spectrometer is employed to record the SERS signal. Under excitation by a 785 nm laser, the SERS signal is generated from the MBA (Raman reporter) molecules inside of the SERS probes. As shown in Figure S7, the SERS spectra acquired from the test line are characteristic of both the Raman reporter and the NC membrane. The amount of SERS probes captured on the test line is in proportion to the concentration of a target protein, which is employed for quantification. In the absence of the target protein, only the control line shows greyish color, indicating that the test strip functions properly.
Optimization of SERS-PLFS
In order to optimize the performance of the PLFS, it was used to detect 1 ng/mL of human IgG. The human IgG was selected as the model analyte because this protein is well-known, and its testing is much more inexpensive compared with NSE testing. In the optimization study, MIGTC was used as the Raman reporter initially, and the SERS spectra with a characteristic peak at 1173 cm−1 were recorded. The flow rate of the sample solution significantly influences the efficiency of binding between antibodies and antigens, as well as the signal intensity and the signal-to-noise (S/N) ratio. Generally, the flow rate of a liquid in the PLFS is dependent on the surfactant content and the pore size of the NC membrane. The surfactant in the running buffer is an important component, which regulates the binding time between an antibody and its antigen and, meanwhile, mitigates the nonspecific adsorption of SERS probe on the test line. TWEEN 20 was chosen as the surfactant, and its content in the running buffer was optimized. Figure S8a reveals that the S/N ratio of the SERS peak increased with the growing content of TWEEN 20 content in the running buffer until it reached 0.07%. Further increase in the TWEEN 20 content led to a decrease in the S/N ratio, as a high TWEEN 20 content caused a high flow rate of running buffer, leading to a significant decrease in the binding time between the antibody and the antigen. Another parameter governing the flow rate is the pore size of the NC membrane. Reducing the pore size decreases the flow rate and increases the time of binding between the target analyte and the antibody. As shown in Figure S8b, the S/N ratio for small pores (0.22 μm in a diameter) was higher than that for large pores (0.45 μm). In addition, the signal intensity and the detection sensitivity are significantly affected by the detection antibody-linked SERS probe amount on the conjugation pad and the capture antibody immobilized on the test line because both of the factors affect the ability of PLFS to capture the antigen. As shown in Figure S8c,d, the optimal detection antibody-linked SERS probe amount was 7 μL, and two-time dispenses were the best.
A comparative study was performed on the use of two types of Raman reporters (MGITC and MBA). The SERS-PLFS with two different Raman reporters were used to measure various concentrations of human IgG in the PBS buffer. Figure 2a shows the MBA-SERS spectra and the corresponding calibration curve (Figure 2b). The overall SERS intensity obtained from the MBA-based PLFS (Figure 2a) was stronger, and the peaks were much sharper than those from the MGITC-based PLFS (Figure 2c). The calibration curve in Figure 2b was obtained by plotting the SERS peak intensity at 1076 cm−1 from MBA as a function of the logarithmic concentration of human IgG. The calibration curve in Figure 2d was obtained from the PLFS by recording the SERS peak intensity at 1173 cm−1 from MGITC. The slope of calibration curve for the MBA-PLFS was 15 times higher than that for the MGITC-PLFS. The limit of detection (LOD) was determined at the signal-to-noise ratio of 3, which was 0.02 and 0.05 ng/mL for the MBA-PLFS and the MGITC-PLFS, respectively. In short, the MBA-PLFS exhibited higher sensitivity and lower LOD than the MGITC-PLFS. Therefore, MBA was employed for analyte detection instead of MGITC in the following experiments. The reproducibility of the MBA-based PLFS was examined. Human IgG samples at three levels were tested, and five SERS spectra were acquired at each level of human IgG (Figure S9). The SERS peak intensity of MBA at 1076 cm−1 exhibited good signal reproducibility. The corresponding relative standard deviation (RSD) values of MBA peak intensities were 7.0%, 4.1%, and 5.9% for measuring 10, 1, and 0 ng/mL of IgG in PBS, respectively.
Figure 2.
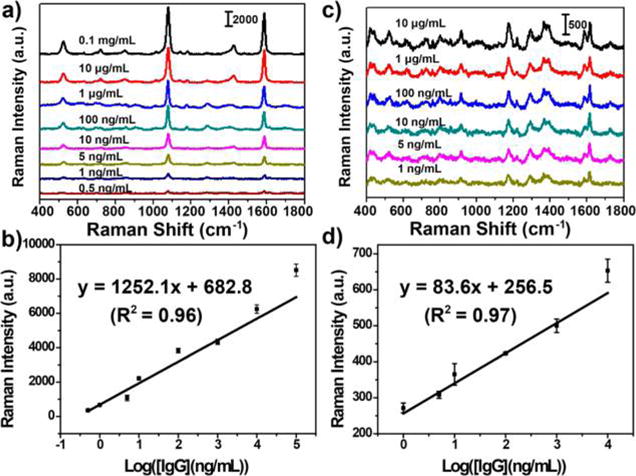
SERS spectra obtained from the SERS-PLFS with different Raman report molecules. (a) MBA as Raman reporter and the corresponding calibration curve (b); (c) MGITC as Raman reporter and the corresponding calibration curve (d).
Measurement of Anti-Interference Ability of PLFS in Blood Plasma
In order to study the anti-interference ability in real-world biological fluids, the developed SERS-PLFS was employed to measure the human IgG spiked in a PBS solution and in a mixture of 90% PBS and 10% blood plasma (a specially treated IgG-free blood plasma purchased from US Biological Life Science (P4252-56 Plasma, Human, IgG Free)), respectively. When the SERS-PLFS was used for detection of IgG in 100% PBS solution, the calibration curved showed a linear detection range from 0.5 ng/mL to 0.1 mg/mL (Figure 2b), achieving a LOD of 0.02 ng/mL. When it was used to test a mixture of 90% PBS and 10% blood plasma, the calibration curve showed a linear detection range from 1.0 ng/mL to 0.05 mg/mL (Figure 3), achieving a LOD of 0.08 ng/mL. In addition, the slope of the calibration curve obtained from the mixture of 90% PBS and 10% blood plasma (Figure 3) was much smaller than that from 100% PBS (Figure 2b). The results indicated that an abundance of biomolecules present in blood plasma affected the binding of antibody to the target protein.
Figure 3.
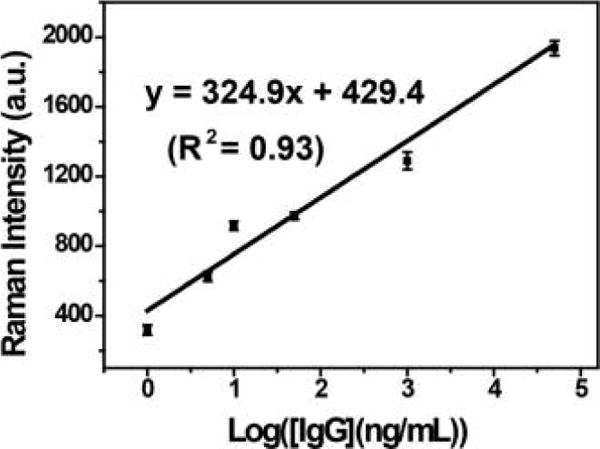
Calibration curve of SERS-PLFS with MBA as Raman reporter for detection of IgG in a mixture of 90% PBS and 10% blood plasma.
Comparison of Performance between Colorimetric and SERS-Based PLFS
Comparative studies were performed on the colorimetric and SERS PLFS. The plasmonic Au nanoparticles acted as the sensing transducer in the colorimetric PLFS while the Au nanostar@MBA@silica sandwich nanoparticles served as the sensing transducer in the SERS-PLFS. Figure 4a shows that the colorimetric PLFS worked well when it was used to measure IgG in the PBS solution. The calibration curve showed a linear range from 1 ng/mL to 50 μg/mL (Figure 4c), achieving a LOD of 0.5 ng/mL. However, when the colorimetric PLFS was employed for IgG detection in a mixture of 90% PBS and 10% blood plasma, the color intensity of the test line was much weaker than that tested in a PBS buffer (Figure 4b), and a high LOD (50 ng/mL) was observed. When the SERS-PLFS was used for detection of IgG in 100% PBS solution, a LOD of 0.02 ng/mL (Figure 2b) was achieved, which was 1 order of magnitude lower than that of the LOD (0.5 ng/mL, Figure 4c) of the colorimetric PLFS. In contrast, when they were applied to the sample matrix containing blood plasma, the SERS-PLFS (Figure 3) showed much better performance than the colorimetric PLFS (Figure 4c). The SERS-PLFS exhibited a LOD of 0.08 ng/mL, which was 3 orders of magnitude lower than that (50 ng/mL) of the colorimetric counterpart. This result demonstrated that the SERS-PLFS had much better anti-interference ability than the colorimetric counterpart when they were applied to the blood plasma sample matrix.
Figure 4.
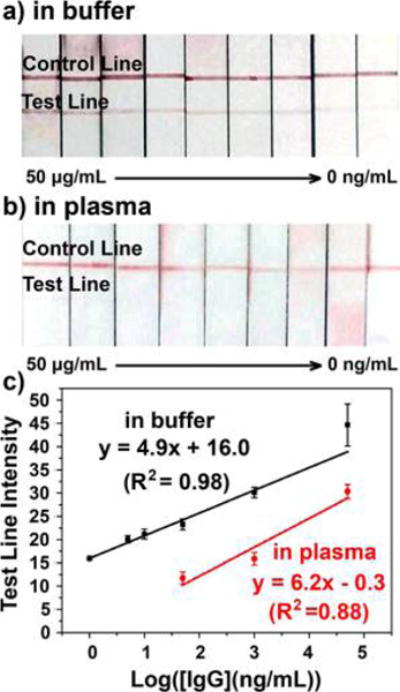
Optical photos and calibration curves of colorimetric PLFS for detection of IgG (0–50 μg/mL): (a) in PBS buffer and (b) in a mixture of 90% PBS and 10% blood plasma; (c) corresponding calibration curves.
Measurement of NSE Biomarker in Diluted Blood Plasma
The SERS probe is the key to the SERS-PLFS. In our sandwich-structured SERS probe, the silica shell is vital to ensure the stability of the SERS probe in the real-world blood plasma that typically exhibits high ionic strength, as shown in our previous paper.27 Herein, the stability of the bare Au nanospheres, the silica-coated Au nanospheres, and the silica-coated Au nanostars in the diluted blood plasma was tested (see Figure S10). It was found that the color of the 80% blood plasma sample containing the bare Au nanosphere became darker after 6 h of incubation, and the bare Au nanospheres were found to be aggregated at the bottom of the vial after overnight. In contrast, the color of the counterpart samples containing the silica-coated Au nanospheres and the silica-coated Au nanostar was not altered, and no aggregation was observed after overnight. This result indicated that the silica shell prevented the nanoparticles from aggregation in the diluted blood plasma.
In the SERS probe, the Au nanostar is chosen as the core rather than the Au nanosphere because the Au nanostar can result in much higher SERS enhancement than the Au nanosphere.27 This is due to the fact that the Au nanostar possesses a lot of “hot spots” and shows a LSPR band that is overlapped with the wavelength of excitation laser.
Under the optimal experiment condition, the developed SERS-PLFS was employed to detect various concentrations of NSE biomarker spiked into a mixture of 20% PBS solution and 80% blood plasma. It is noted that measurement of NSE in a diluted blood plasma can be finished within 30 min. Prior to NSE measurement, the baseline concentration of NSE in the blood plasma was measured by a commercial NSE ELISA kit (R & D System). Three ELISA measurements were performed. None of the tests showed any signal response, which indicated that the NSE content in blood plasma was lower than the LOD (0.038 ng/mL) of the ELISA Kit. Figure 5 shows that the intensity of SERS peak at 1076 cm−1 gradually rises with an increase in the NSE concentration in a mixture of 20% PBS and 80% blood plasma. The SERS peak intensity (y) versus the NSE concentration (x) was fitted as y = 6.7x + 275.3 with the relative coefficient (R2) of 0.98, showing a linear detection range from 1.0 to 75.0 ng/mL, achieving a LOD of 0.86 ng/mL. The LOD was estimated with three times the standard deviation of negative control divided by the slope of calibration curve. This LOD was below the cutoff value of NSE concentration (12.4 ng/mL) in blood plasma of TBI patients. The NSE level in TBI patients generally is elevated to >21.7 ng/mL.28 Our experimental results show the SERS-PLFS developed in the present work can work for NSE detection in blood plasma.
Figure 5.
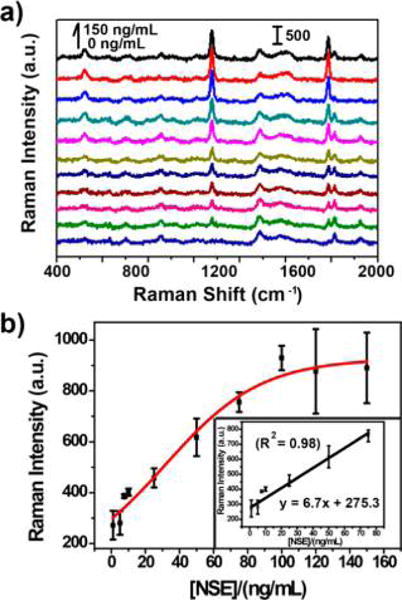
SERS spectra (a) and calibration curve (b) of SERS-PLFS with MBA as Raman reporter for detection of NSE in a mixture of 20% PBS and 80% blood plasma.
Measurement of NSE in Clinical Blood Plasma Samples with the SERS-PLFS
The calibrated SERS-PLFS was employed to measure the NSE biomarker level in clinical blood plasma taken from the TBI patients. The same clinical samples were also measured with the commercial ELISA kits to validate the measurement results obtained from the SERS-PLFS. Figure 6 shows the NSE concentrations in six clinical blood plasma samples measured by the SERS-PLFS and the NSE ELISA kits (R & D System and Eagle Bio), respectively. The results reveal that the data obtained by the SERS-PLFS were comparable to those by the ELISA. This result is appealing because the SERS-PLFS has evident advantages over ELISA when applied to clinical blood plasma samples. The SERS-PLFS is easy to operate, which enables clinical blood plasma samples to be measured rapidly with a portable Raman spectrometer. The clinical impact of such an inexpensive and rapid bedside diagnostic tool stands to change practice in the diagnosis of TBI in both the clinical and research arenas through early, easy, and accurate detection of true TBI and will reduce the diagnostic radiation exposure, increase the accuracy of the diagnosis, decrease costs, allow for earlier interventions aimed at mitigating both short- and long-term sequelae, and improve the quality of TBI clinical trials.
Figure 6.
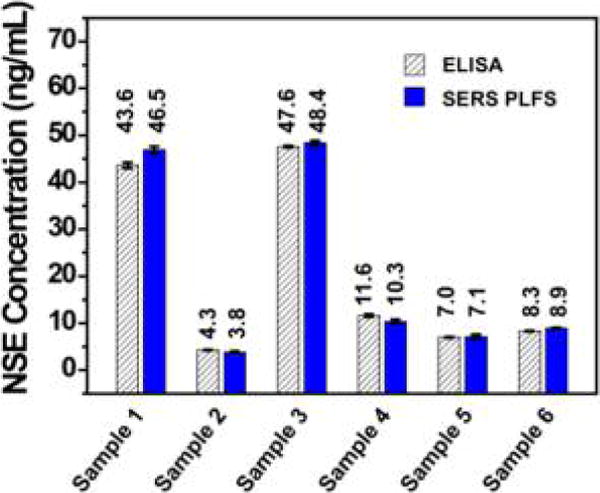
NSE concentrations in clinical blood plasma samples, which were measured by ELISA and the SERS-PLFS, respectively.
CONCLUSIONS
In summary, a SERS-PLFS was successfully developed in the present work. The LOD of SERS-PLFS was 1 order of magnitude lower than that of the colorimetric PLFS when they were used for detection of proteins in PBS buffer but was 3 orders of magnitude lower in a mixture of PBS and blood plasma. This result proves that the SERS-PLFS had much better anti-interference capability and improved sensitivity in blood plasma-containing sample matrix compared to the colorimetric PLFS. The key to success of SERS-PLFS is the employment of the Au nanostar@Raman reporter@silica sandwich nanoparticles as the SERS probes. Such SERS probes have strong SERS enhancement capability, excellent stability in complex blood plasma matrix, and good ability of anti-interference. The SERS-PLFS achieved a linear detection range from 1.0 ng/mL to 75.0 ng/mL toward NSE in a mixture of 80% blood plasma and 20% PBS. The SERS-PLFS was successfully employed for detection of NSE in clinical blood plasma samples. Obviously, the SERS-PLFS has advantages over the ELISA approach, including low cost, portability, short operation time, and simple operation procedure. These merits endow the SERS-PLFS with great potential to be employed as a POC tool for monitoring the protein biomarkers in real-world blood samples.
Supplementary Material
Acknowledgments
This work was supported by the National Institute of Neurological Disorders and Stroke of the National Institutes of Health (R15NS087515). The resources provided by the Byars-Tarnay Endowment in the WVU Foundation are also appreciated. The characterization was performed at WVU Shared Facility. In addition, J.G.W. was involved in the RESCUE study in this manuscript that was funded in part by the UT Southwestern High Impact/High Risk Grant, the National Center for Advancing Translational Sciences of the National Institutes of Health under award Number UL1TR001105, and the Resuscitation Outcomes Consortium cooperative agreements (5U01 HL077863-University of Washington Data Coordinating Center, HL077887-University of Texas Southwestern Medical Center in Dallas) from the National Heart, Lung and Blood Institute in partnership with the U.S. Army Medical Research & Material Command and the American Heart Association. The content is solely the responsibility of the authors and does not necessarily represent the official views of the National Institutes of Health.
Footnotes
Supporting Information
The Supporting Information is available free of charge on the ACS Publications website at DOI: 10.1021/acs.anal-chem.7b03015.
Illustration of the preparation process of the SERS probe conjugated with the detection antibody; TEM images; UV-visible absorption spectra; FT-IR spectra; SERS spectra; optimization of the experiment conditions for SERS-PLFS; reproducibility test of human IgG measurement; stability test results (PDF)
ORCID
Feng Yang: 0000-0002-6917-7053
Nianqiang Wu: 0000-0002-8888-2444
Notes
The authors declare no competing financial interest.
References
- 1.Centers for Disease Control and Prevention, National Center for Injury Prevention and Control, Division of Unintentional Injury Prevention. TBI: Get the Facts. 2017 https://www.cdc.gov/traumaticbraininjury/get_the_facts.html, accessed on July 25, 2017.
- 2.Centers for Disease Control and Prevention, National Center for Injury Prevention and Control, Division of Unintentional Injury Prevention. Severe TBI. 2017 https://www.cdc.gov/traumaticbraininjury/severe.html, accessed on July 25, 2017.
- 3.Mondello S, Muller U, Jeromin A, Streeter J, Hayes RL, Wang KK. Expert Rev Mol Diagn. 2011;11:65–78. doi: 10.1586/erm.10.104. [DOI] [PMC free article] [PubMed] [Google Scholar]
- 4.Lee B, Newberg A. NeuroRx. 2005;2:372–383. doi: 10.1602/neurorx.2.2.372. [DOI] [PMC free article] [PubMed] [Google Scholar]
- 5.Honda M, Tsuruta R, Kaneko T, Kasaoka S, Yagi T, Todani M, Fujita M, Izumi T, Maekawa T. J Trauma. 2010;69:104–109. doi: 10.1097/TA.0b013e3181bbd485. [DOI] [PubMed] [Google Scholar]
- 6.Zetterberg H, Smith DH, Blennow K. Nat Rev Neurol. 2013;9:201–210. doi: 10.1038/nrneurol.2013.9. [DOI] [PMC free article] [PubMed] [Google Scholar]
- 7.Herrmann M, Jost S, Kutz S, Ebert AD, Kratz T, Wunderlich MT, Synowitz H. J neurotrauma. 2000;17:113–122. doi: 10.1089/neu.2000.17.113. [DOI] [PubMed] [Google Scholar]
- 8.Fu X, Feng X, Xu K, Huang R. Anal Methods. 2014;6:2233–2238. [Google Scholar]
- 9.Han J, Zhuo Y, Chai Y-Q, Yuan Y-L, Yuan R. Biosens Bioelectron. 2012;31:399–405. doi: 10.1016/j.bios.2011.10.055. [DOI] [PubMed] [Google Scholar]
- 10.Yu T, Cheng W, Li Q, Luo C, Yan L, Zhang D, Yin Y, Ding S, Ju H. Talanta. 2012;93:433–438. doi: 10.1016/j.talanta.2012.02.047. [DOI] [PubMed] [Google Scholar]
- 11.Yu X, Wang Y, Chen X, Wu K, Chen D, Ma M, Huang Z, Wu W, Li C. Anal Chem. 2015;87:4237–4244. doi: 10.1021/ac504456w. [DOI] [PubMed] [Google Scholar]
- 12.Zhou L, Huang J, Yu B, You T. Sci Rep. 2016;6:22234. doi: 10.1038/srep22234. [DOI] [PMC free article] [PubMed] [Google Scholar]
- 13.Fu X, Meng M, Zhang Y, Yin Y, Zhang X, Xi R. Anal Chim Acta. 2012;722:114–118. doi: 10.1016/j.aca.2012.02.007. [DOI] [PubMed] [Google Scholar]
- 14.Cheng S, Hideshima S, Kuroiwa S, Nakanishi T, Osaka T. Sens Actuators, B. 2015;212:329–334. [Google Scholar]
- 15.Ngom B, Guo Y, Wang X, Bi D. Anal Bioanal Chem. 2010;397:1113–1135. doi: 10.1007/s00216-010-3661-4. [DOI] [PubMed] [Google Scholar]
- 16.Posthuma-Trumpie GA, Korf J, van Amerongen A. Anal Bioanal Chem. 2009;393:569–582. doi: 10.1007/s00216-008-2287-2. [DOI] [PubMed] [Google Scholar]
- 17.Gao X, Xu H, Baloda M, Gurung AS, Xu L-P, Wang T, Zhang X, Liu G. Biosens Bioelectron. 2014;54:578–584. doi: 10.1016/j.bios.2013.10.055. [DOI] [PMC free article] [PubMed] [Google Scholar]
- 18.Gao X, Xu L-P, Wu T, Wen Y, Ma X, Zhang X. Talanta. 2016;146:648–654. doi: 10.1016/j.talanta.2015.06.060. [DOI] [PubMed] [Google Scholar]
- 19.Li Z, Wang Y, Wang J, Tang Z, Pounds JG, Lin Y. Anal Chem. 2010;82:7008–7014. doi: 10.1021/ac101405a. [DOI] [PubMed] [Google Scholar]
- 20.Lin Y-Y, Wang J, Liu G, Wu H, Wai CM, Lin Y. Biosens Bioelectron. 2008;23:1659–1665. doi: 10.1016/j.bios.2008.01.037. [DOI] [PubMed] [Google Scholar]
- 21.Al-Ogaidi I, Gou H, Aguilar ZP, Guo S, Melconian AK, Al-Kazaz AKA, Meng F, Wu N. Chem Commun. 2014;50:1344–1346. doi: 10.1039/c3cc47701k. [DOI] [PubMed] [Google Scholar]
- 22.Li M, Cushing SK, Wu N. Analyst. 2015;140:386–406. doi: 10.1039/c4an01079e. [DOI] [PMC free article] [PubMed] [Google Scholar]
- 23.Li M, Cushing SK, Zhang J, Suri S, Evans R, Petros WP, Gibson LF, Ma D, Liu Y, Wu N. ACS Nano. 2013;7:4967–4976. doi: 10.1021/nn4018284. [DOI] [PMC free article] [PubMed] [Google Scholar]
- 24.Fu X, Cheng Z, Yu J, Choo P, Chen L, Choo J. Biosens Bioelectron. 2016;78:530–537. doi: 10.1016/j.bios.2015.11.099. [DOI] [PubMed] [Google Scholar]
- 25.Liang J, Liu H, Lan C, Fu Q, Huang C, Luo Z, Jiang T, Tang Y. Nanotechnology. 2014;25:495501. doi: 10.1088/0957-4484/25/49/495501. [DOI] [PubMed] [Google Scholar]
- 26.Wang X, Choi N, Cheng Z, Ko J, Chen L, Choo J. Anal Chem. 2017;89:1163–1169. doi: 10.1021/acs.analchem.6b03536. [DOI] [PubMed] [Google Scholar]
- 27.Li M, Cushing SK, Zhang J, Lankford J, Aguilar ZP, Ma D, Wu N. Nanotechnology. 2012;23:115501. doi: 10.1088/0957-4484/23/11/115501. [DOI] [PubMed] [Google Scholar]
- 28.North S, Taitt C, Shriver-Lake L, Ligler F. NRL Rev. 2013;13:164. [Google Scholar]
Associated Data
This section collects any data citations, data availability statements, or supplementary materials included in this article.