

Abstract
Development of targeted nanoparticle drug carriers often requires complex synthetic schemes involving both supramolecular self-assembly and chemical modification. Until recently, these processes were generally difficult to predict, execute, and control. We describe herein a targeted drug delivery system which is accurately and quantitatively predicted to self-assemble into nanoparticles based on the molecular structures of precursor molecules, which are the drugs themselves. The drugs assemble with the aid of sulfated indocyanines into particles with ultra-high drug loadings of up to 90%. Using quantitative structure-nanoparticle assembly prediction (QSNAP) calculations, we identified and validated electrotopological molecular descriptors as highly predictive indicators of nano-assembly and nanoparticle size. The resulting nanoparticles selectively targeted kinase inhibitors to caveolin-1-expressing human colon cancer and autochthonous liver cancer models to yield striking therapeutic effects while avoiding pERK inhibition in healthy skin. This finding enables a computational design of nanomedicines based on quantitative models for drug payload selection.
A significant limitation of targeted nanoparticle drug carrier design1–3 is that complex synthetic schemes are often required, resulting in low loadings and higher barriers to clinical translation4-6. Until recently, the process of drug encapsulation into stable nano-formulations has been largely experimentally-based7-8. However, recent reports on the prediction of nano-formulation in silico suggest that this goal will be a major contribution to the emergence of “nanoinformatics,” a new sub-field within nanotechnology9. In drug carrier design, quantitative structure-property relationship (QSPR) calculations have been used to predict colloidal drug aggregation10-12, drug loading in lipid formulations13, and in vivo performance14-16. Molecular dynamics simulations have been used to investigate nanoparticle supramolecular interactions17,18-19 and vehicle selection20. However, quantitative approaches have not yet provided appreciable predictive power to enable the design of delivery vehicles de novo based on drug payload selection.
Herein, we found that a subset of sulfated indocyanine dyes self-assemble with hydrophobic drugs to form stable tumor-targeted nanoparticles wherein the formation can be accurately predicted using quantitative information from the structure of the encapsulated drug. Via quantitative structure-nanoparticle assembly prediction (QSNAP) calculations, we identified two molecular descriptors to predict which drugs would assemble with indocyanine into nanoparticles and nanoparticle size with an average accuracy of up to 15 nm. Moreover, this approach also revealed important molecular structure features that enable self-assembly and nanoparticle formation. Importantly, the resulting indocyanine nanoparticles (INPs) were found to encapsulate drugs with high loadings of up to 90% by mass. We assessed the targeted drug delivery properties of two such nanoparticles, encapsulating the tyrosine kinase inhibitors sorafenib and trametinib. Strikingly, we found selective caveolin-1-mediated tumor uptake and exceptional net anti-tumor efficacies in a genetically modified mouse model for hepatocellular carcinoma and a xenograft model for human colorectal cancer. The nanoparticles prevented the inhibition of ERK phosphorylation in the skin, demonstrating that this targeting strategy exhibits strong therapeutic benefits and may obviate skin rash—a major side-effect of kinase inhibitors.
Indocyanine Stabilized Drug Nanoparticles
We explored the parameter space of excipients that could facilitate self-assembly of drugs into colloidally-stable nanoparticles with high drug loadings. We estimated that a clinically-useful nanoformulation would contain at least 2 mg/ml of drug suspended in water or PBS21. We designed a simple nanoprecipitation process to test the propensity of excipient molecules to stabilize hydrophobic drugs within sub-100 nm nanoparticles (Methods). We examined detergents, polyelectrolytes, and lipids previously used to form drug nanocrystals22-23, as well as azo dyes, shown recently to form colloidal drug aggregates24. We also tested water-soluble dyes of different classes, including phtalocyanines, triphenylmethanes, and cyanines. We then chose an initial set of 9 hydrophobic drugs (Supplementary Figure 1a) with poor water solubilities (<10 μg/ml). We found that a subset of drugs was able to form stable nanoparticles with sulfated organic dyes from three different dye families: azo, triphenylmethane and indocyanine25-26 (Fig 1a–b, Supplementary Figure 1b). Of these, the indocyanine IR783 most effectively stabilized drugs, resulting in the complete suspension of five out of nine molecules, and relatively small, monodisperse particles (Supplementary Figure 1b–d, 2).
Figure 1. Indocyanine-drug self-assembled nanoparticles.
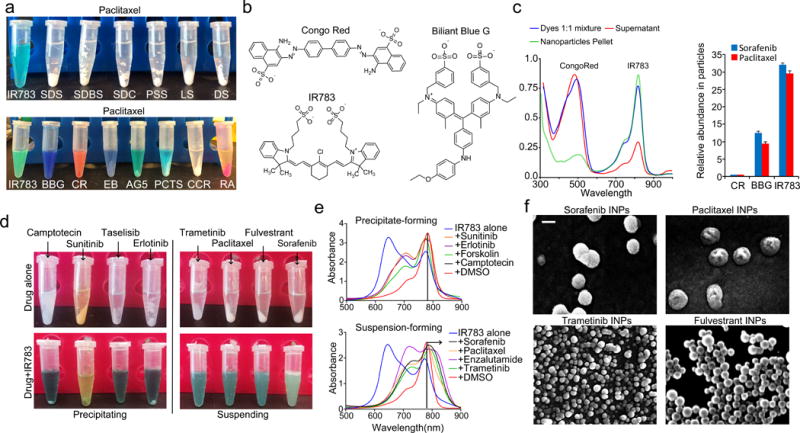
(a) Result of attempted water dispersion of paclitaxel with a panel of excipients. Sodium dodecyl sulfate (SDS), sodium dodecylbenzene sulfonate (SDBS), sodium deoxycholate (SDC), poly-4-styrensulfonate (PSS), lignin sulfonate (LS) and dextran sulfate (DS), Congo red (CR), Evans blue (EB), acid green 5(AG5), phtalocyanine tetra sulfonate (PCTS), Rhodamine 6G (RA), chromaxane cyanine R (CCR). (b) Chemical structures of dye excipients that most efficiently suspended drugs. (c) absorbance spectrum of Congo red/IR783 dye mixtures before and after suspension of paclitaxel as well as relative abundance of each dye in the suspensions. (d) Images of precipitating and suspending IR783-drug mixtures. (e) Absorption spectra of IR783 upon introduction of drugs which resulted in precipitate formation, and upon introduction of drugs which resulted in suspensions. (f) Scanning electron microscopy (SEM) images of indocyanine-drug nanoparticles. Scale bar = 100 nm.
Dye mixtures were assessed to determine which dyes were most responsible for nanoparticle formation. Nanoprecipitation of sorafenib and paclitaxel with equimolar dye concentrations were found to contain 30-fold more IR783 than Congo Red, and 3-fold more IR783 than Brilliant Blue G, indicating preference for indocyanine (Fig 1c).
We noted distinct color changes of the IR783-drug mixtures, depending on whether a given drug was successfully suspended (Fig 1d). Absorbance spectroscopy (Fig 1e) revealed a relative increase of the IR783 λmax = 780 nm peak and a decrease of the λmax = 640 nm peak, consistent with the dissolution of indocyanine H-aggregates27-28. The 780 nm peak also red-shifted up to 850 nm, suggesting the formation of J-aggregates29.
The resulting drug suspensions were characterized by dynamic light scattering (DLS), scanning electron microscopy (SEM), atomic force microscopy (AFM), and transmission electron microscopy (TEM), confirming nanoparticle formation (Fig 1f, Supplementary Figure 3). The drug loading was remarkably high, reaching 90% (mass %) for fulvestrant-based INPs, 84% for paclitaxel INPs, 82% for trametinib INPs, and 86% for sorafenib INPs. Additional characterization data is included in the Supplementary Information (Supplementary Figure 3). Although the high drug content of these particles resembles that of drug nanocrystals, there are distinct differences, including the lack of high-energy processes in the INP synthesis methods, and particle stability in aqueous solutions free of detergents23.
Retrospective quantitative structure-property relationships
We assessed a new library of 16 drug compounds, resulting in eight compounds forming nanoparticles with the indocyanine IR783, while the remainder did not (Fig 2a, Supplementary Figure 4). As the compounds were mostly similar in molecular weight, hydrophobicity, and charge, we investigated a larger set of chemical properties to understand the factors mediating nanoparticle self-assembly. We employed retrospective quantitative structure–property relationship (QSPR) analysis to search for molecular descriptors of drugs which correlated with the successful suspension into nanoparticles. We built a training set of the 16 hydrophobic drug molecules (water solubility <1 mg/mL) using a binary classification to denote nanoparticle-forming (ranked as 1) and precipitating compounds (ranked as 0), based on the observed stability of the suspensions. We used Dragon 6 software (Talette) to calculate 4886 descriptors from the molecular structures of the drugs in the training set which we assessed for correlations with the experimental data of nanoparticle formation (Methods).
Figure 2. Computational prediction and analyses of indocyanine nanoparticle formation.
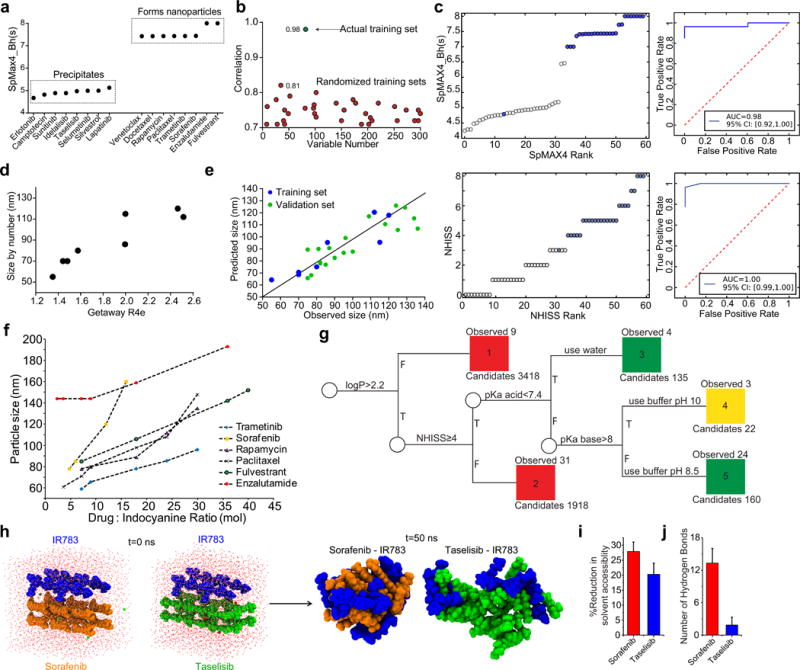
(a) Training set of 16 drugs experimentally determined to precipitate or form nanoparticles with indocyanine and plotted according to the SpMAX4_Bh(s) descriptor. (b) Pearson coefficient of SpMAX4_Bh(s) correlation to experimental data for 300 randomized training sets (red circles) and the actual training set (green circle). (c) Statistical analyses of experimentally validated predictions made with SpMAX4_Bh(s) and NHISS. Descriptor score of each drug plotted by ascending rank of that drug and corresponding receiver operating characteristic (ROC) curves. Blue = forms nanoparticles experimentally. White = does not form nanoparticles. (d) A training set of experimentally-determined nanoparticle size formed with indocyanine, and linearly correlated to the molecular descriptor GETAWAY R4e. R2 = 0.84 (95% CI [0.22, 0.98], N=8) (e) Validation set of drug molecules based on the Getaway-R4e descriptor. (f) Nanoparticle size as a function of drug:indocyanine ratio. (g) Decision tree for INP self-assembly. Green=formation of stable nanoparticles in PBS pH 7.4, yellow=formation of stable nanoparticles in basic pH, and red = non forming nanoparticles. Descriptors were calculated by Dragon and ChemAxon. (h) Snapshots from the top clusters acquired from all-atom molecular dynamics simulations of drug-indocyanine systems. Indocyanine, sorafenib, and taselisib molecules are blue, orange, and green, respectively. (i) Reduction in solvent accessible surface area of drug due to the presence of indocyanine. (j) Number of intra-nanoparticle hydrogen bonds averaged over the simulated trajectory. Error bars indicate standard deviation, n=5000. Bar graphs are of mean ±SD.
The retrospective analysis identified four molecular descriptors that correlated highly with the experimental data for nanoparticle formation, giving Pearson correlation coefficients (r) of over 0.85 (Supplementary Figure 5). One descriptor, SpMAX4_Bh(s), the fourth leading eigenvalue of the Burden matrix, a topochemical index which scores molecules by their geometrical complexity, bond order, and heteroatoms, weighted by the intrinsic state30, gave an impressive Pearson correlation coefficient of r = 0.98 (95% confidence intervals (CI) [0.94, 0.99], (Methods)50. The analysis showed that the calculated eigenvalues of the nanoparticle-forming drugs were above 7, while the non-assembling drug eigenvalues were below 5.5 (Fig 2a). To assess the robustness of this correlation, we compared the training set to 300 randomly-generated training sets comprised of the same 16 molecules with scrambled categorization. From these, 80% of the random sets had an r value below 0.7, and the other 20% were below 0.8; no randomly-generated training sets had an r near 0.98 (Fig 2b).
Prediction of nanoparticle self-assembly
To assess the predictive utility of QSNAP Model 1 via the SpMAX4_Bh(s) descriptor, we calculated SpMAX4_Bh(s) values of 400 hydrophobic drugs (defined as having an ALogP2 value, a molecular descriptor of hydrophobicity, of over 4.5). Out of the analyzed molecules, we identified 131 compounds with an SpMAX4_Bh(s) value of 6.99 and above. A prospective validation set of 44 molecules was constructed by selecting 19 compounds with SpMAX4_Bh(s) values above 6.99 (Supplementary Figure 6) and 25 compounds with SpMAX4_Bh(s) values below 6.99 (Supplementary Figure 7). The validation set was experimentally tested for nanoparticle formation. Remarkably, all drugs but one (avasimibe) behaved as predicted using SpMAX4_Bh(s), while descriptors for hydrophobicity performed only slightly better than random (Fig 2c, Supplementary Figure 8–9 and Table S1). It is worth noting that two INPs (ABT737 and venetoclax), exhibited low stability in PBS. This could be explained by the interaction of basic groups in these molecules (pKas ≥ 8, calculated by ChemAxon), with the sulfate groups on IR783, resulting in destabilization of the nanoparticle.
Mechanistic analysis of predictive QSNAP descriptors
It was apparent that compounds with high SpMAX4_Bh(s) values often contained multiple fluorine atoms and therefore compared similar drugs with and without fluorine. Our structural screen revealed two similar molecules, celecoxib, with 3 fluorine atoms and SpMAX4_Bh(s) = 7.7, and valdecoxib, with zero fluorines and SpMAX4_Bh(s) = 4.7. The drugs behaved experimentally as predicted, where the high-SpMAX4_Bh(s) compound formed nanoparticles but the low-SpMAX4_Bh(s) molecule did not (Supplementary Figure 10).
We noticed that all four descriptors that correlated highly with nanoparticle formation were weighted by the intrinsic state, so we investigated further. The intrinsic state (I) encodes the electronic state of an atom from the molecular graph as the following (Eq. 1):
| (Eq. 1) |
where L is the principal quantum number of the atom, δv is the number of valence electrons, and δ is the number of sigma electrons31. The calculated intrinsic state values for various atoms show that, indeed, fluorine and groups containing double bonds to oxygen (including carbonyl, sulfoxide, nitro, etc.) exhibit the highest intrinsic state values (8 and 7 respectively, Supplementary Table 2). Further investigation of SpMAX4_Bh(s) reveals that all molecular structures with SpMAX4_Bh(s) values ≥6.99 contain at least four atoms with an intrinsic state ≥7. Likewise, structures with SpMAX5_Bh(s) ≥ 6.99, have at least 5 atoms with intrinsic states ≥7, and so on (Supplementary Figure 11).
Simplified QSNAP descriptors for nanoparticle formation
To simplify the prediction process, we created a new descriptor, Number of High Intrinsic State Substructures (NHISS), calculated as the total number of functional groups in a molecule with intrinsic state atoms ≥7 (Methods). Comparing NHISS to SpMAX4_Bh(s) for 430 compounds resulted in an agreement of 98.8% (Supplementary Tables 3 and 4). We thus conclude that NHISS, can replace SpMAX4_Bh(s) to assess nanoparticle formation (Fig 2g).
QSNAP prediction of nanoparticle size
We additionally employed QSNAP to predict nanoparticle size. We generated a training set of 8 INP-forming drug molecules by measuring particle size by DLS (Supplementary Table 5 and Methods). From the 4886 descriptors calculated by Dragon 6, we found, the GETAWAY R4e, correlated strongly with the DLS data; R2 = 0.84 (95% CI [0.22, 0.98], N=8, Fig 2d). This descriptor is based on the leverage matrix from the spatial coordinates of a molecule using molecular weighting of electronegativity32. We then generated a validation set by calculating this descriptor for an additional 18 nanoparticle-forming drugs and measured the INP sizes experimentally. The resulting nanoparticle sizes were successfully predicted by the GETAWAY R4e descriptor within an error of ±15nm (Fig 2e, Supplementary Table 5). To reduce nanoparticle particle sizes to below 100 nm, an optimal dye:drug ratio of 1:5 was found (Fig 2f).
Prediction of indocyanine nanoparticle formation of a drug library
We used our predictive model of nanoparticle formation to assess which drugs may form nanoparticles with IR783. We first built a decision tree11, to categorize small molecule drugs from the DrugBank database33 according their ability to self-assemble and likely preparation conditions, based on our new understanding of the chemical properties leading to nanoparticle formation from QSNAP Model 1 and experimental observations of pH-related stability issues (Fig 2g). The decision tree incorporates descriptors and chemical features required for nanoparticle formation. Out of 5653 small molecules, the analysis predicted that 317 drugs are capable of forming indocyanine nanoparticles and that 295 drugs out of the 317 would be stable in buffer at pH 7.4 (Supplementary Methods). The category placements of 63 drug molecules in the decision tree were validated experimentally (Supplementary Table 6).
Molecular simulations of nanoparticle formation
To better understand the self-assembly process, we conducted all-atom replica exchange molecular dynamics (REMD) simulations 17, 34-35. Four indocyanine (IR783) molecules and twelve drug molecules (either sorafenib, a nanoparticle-forming drug, or taselisib, a non-particle-forming drug) were included in a box with explicit water and run with 32 different temperature replicas for 50 ns (Supplementary Figure 12a–b, additional details in Supplementary Methods). The simulations resulted in the formation of indocyanine-drug assemblies with clear morphological differences (Fig 2h). The sorafenib-indocyanine simulation formed a significantly more compact assembly than the taselisib-indocyanine simulation. In the taselisib simulation, the resulting complex remained relatively loosely assembled, as evident from the relative radial particle density (Supplementary Figure 12c) and solvent accessibility to the drug molecules (Fig 2i). One possible clue to these differences may be the in the number of hydrogen bonds formed in the two simulations. The sorafenib-indocyanine complex formed over four-fold more hydrogen bonds compared to the taselisib-indocyanine complex (p<0.001, Fig 2j), mainly between the drug molecules themselves (Supplementary Figure 12f).
Kinase inhibitor-encapsulated INPs
Two INPs encapsulating kinase inhibitors were prepared with the indocyanine IR783 for targeting and anti-tumor efficacy studies. Nanoparticles encapsulating sorafenib, a multikinase inhibitor, and trametinib, a MEK inhibitor, were 80 nm and 55 nm in diameter, and exhibited drug loadings of 86% and 83%, respectively. Both nanoparticles were relatively stable in serum and sink conditions for up to 24 h, and they exhibited sustained drug release for over 48 hours (Supplementary Figure 13).
Mechanism of nanoparticle uptake via endocytosis
The internalization of these nanoparticles was studied in multiple cell lines chosen to represent a range of cell types: endothelial cells, epithelial cancers, leukemia, lymphomas, and fibroblasts. Differential uptake was observed across cell types, with a significant preference for endothelial cells, colon and liver cancer cells (Fig 3a). We assessed the mechanism of nanoparticle uptake using various inhibitors of endocytic pathways. Inhibitors of caveolin-mediated endocytosis, but not clathrin-mediated endocytosis, significantly attenuated nanoparticle uptake (Fig 3b). As it was reported that nanoparticles coated with highly sulfated and aromatic polystyrene sulfonate exhibited differential uptake in cells via caveolae36, we hypothesized that the INPs, incorporating a high loading of hydrophobic drug and sparsely coated by sulfated indocyanines, may elicit similar caveolae-targeting effects.
Figure 3. Internalization of indocyanine nanoparticles in 2D and 3D cell culture.
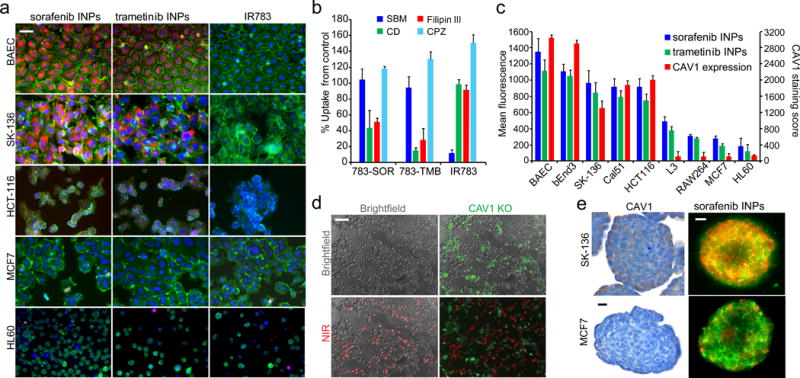
(a) Fluorescence micrographs of INP internalization in different cell lines. Green = membrane stain (CellMask), red = indocyanine nanoparticle, blue = nuclear staining. (b) Inhibition of internalization mechanisms with chemical inhibitors, including cyclodextrin (CD) and filipin III inhibitors of caveolae, chloropromazine (CBZ) inhibitor of clathrin-mediated endocytosis, and bromo-sulfophthalein (SBM) inhibitor of OAT1-3. (c) Indocyanine nanoparticle uptake in cell lines, quantified by fluorescence intensity correlated with CAV1 expression (R2=0.86). (d) Nanoparticle uptake in a co-culture of CAV1 knockout (green) and WT HCT116 cells (unstained). Red = near-infrared (NIR) dye fluorescence. (e) CAV1 staining in tumor spheroids composed of two different cell lines and nanoparticle fluorescence in tumor spheroids. Green = CellMask, red = nanoparticle fluorescence. Scale bar = 25μm. Bar graphs are of mean ±SD.
To further investigate the caveolae-targeting hypothesis, we interrogated the human protein atlas and Broad Institute cancer cell line encyclopedia (CCLE) databases for expression levels of CAV1, the main protein scaffold of caveolae (Supplementary Figure 14a). We found a strong correlation (R2=0.86) between CAV1 expression, assessed by immunohistochemistry (Supplementary Figure 14b), and the nanoparticle fluorescent signal across cell lines (Fig 3c). We also knocked out the CAV1 gene in a colon cancer cell line, HCT116, wherein GFP was also introduced in the vector. We found that the CAV1 knockout exhibited reduced nanoparticle uptake as compared to the wild-type (WT) cells in a co-culture of the two lines (Fig 3d). This difference did not depend on the presence of serum or albumin (Supplementary Figure 15-16).
We assessed the ability of the nanoparticles to target three-dimensional tumor spheres in vitro using MCF-7 and SK-13637 cells in low-adhesion plates (Fig 3e). Fluorescent imaging of the tumor spheres after 40 min of incubation with 20 μg/ml of sorafenib INPs or trametinib INPs revealed a similar pattern to the 2-D cell culture experiments, preferentially targeting the CAV1-expressing SK-136 tumor spheres (Fig 3e and Supplementary Figures 17-18) despite greater interstitial spacing in SK-136 spheres37.
Pharmacokinetics and biodistribution in healthy mice
We measured the biodistribution of the indocyanine nanoparticles in healthy mice. After intravenous administration by tail vein injection, the nanoparticles appeared in the liver first—within 20 min. The near-infrared signal from the indocyanine in the lungs increased from 0–24 hours (Supplementary Figure 19). The significant lung accumulation may be explained by the large number of endothelial cells and caveolae present in these organs38-39. At 24 h, low signal in the liver and spleen was observed. The pharmacokinetics of sorafenib, delivered by INPs and in the free drug form, was measured in healthy mice. The blood half-life of sorafenib INPs was found to be 5 times longer than that of Kolliphor EL-suspended sorafenib injected i.v (Supplementary Figure 19d).
Biodistribution of nanoparticles in hepatic tumor model
Next, we evaluated biodistribution of INPs in a MYC-driven murine hepatic tumor model40-41. To generate autochthonous liver tumors, Sleeping Beauty transposon vectors encoding c-Myc and mutant β-catenin (linked to GFP) were hydrodynamically delivered into immunocompetent FVB mice along with a vector encoding Sleeping Beauty transposase (see Methods). At three weeks after inoculation, tumor nodules could be detected in the liver (Supplementary Figure 20a–c), and antibody stains of CAV1 revealed its presence in virtually all tumor vessels as well as larger vessels of normal liver tissue (Fig 4a, Supplementary Figure 20d–e). Fluorescence imaging of livers harvested 24 h after i.v. injection of sorafenib-encapsulated indocyanine nanoparticles revealed localization specifically within tumor tissue, indicated by co-localization of sorafenib INPs and GFP-positive areas (Fig. 4b). However, we did not observe significant accumulation of sorafenib INPs in normal liver, and free indocyanine did not accumulate in tumors (Supplementary Figure 20f). Microdistribution of the nanoparticles was imaged in frozen sections and revealed both endothelial (stained with CD31) and cancer cell uptake of the nanoparticles (Fig 4c, Supplementary Figure 21). In addition, sorafenib INPs exhibited little accumulation in liver metastases of uveal melanoma tumors, which lack CAV1 (Supplementary Figure 22), suggesting that CAV1 expression mediates specific uptake of sorafenib INPs in vivo.
Figure 4. Indocyanine nanoparticle targeting and efficacy in MYC-driven autochthonous murine hepatic tumor model.
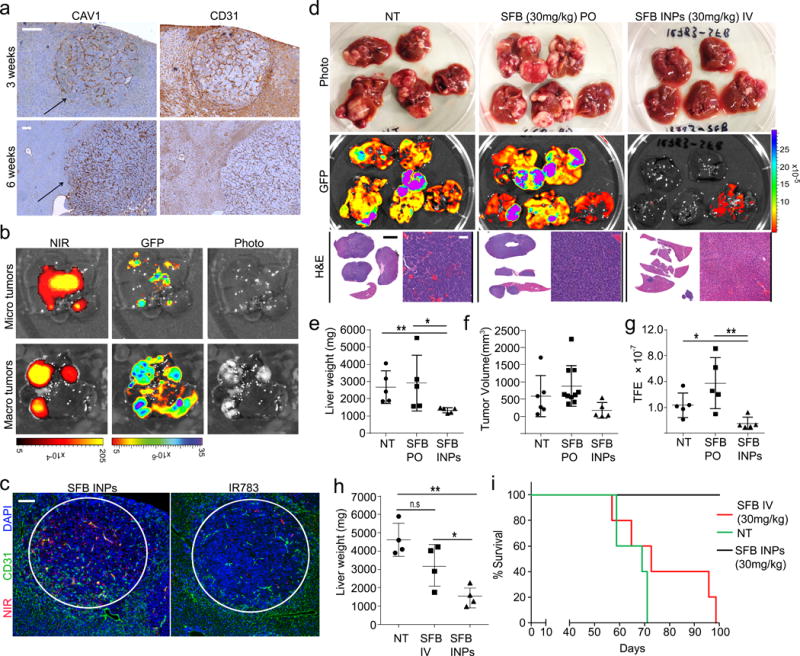
(a) CAV1 and CD31 staining in liver sections 3 weeks and 6 weeks after hydrodynamic injection. Arrow indicates tumor nodule. Scale bar = 50μm. (b) Fluorescence images of livers with multiple GFP-positive tumor nodules 24 h after administration of nanoparticles. NIR = INP indocyanine emission, GFP = cancer fluorescence. (c) Immunofluorescence images of tissue slices from the autochthonous liver cancer model 24 h after injections of sorafenib INPs or free IR783 dye. Red = NIR fluorescence, green = CD31 antibody for blood vessels, blue = DAPI nuclear stain. Scale bar = 100 μm. (d) Imaging data including photographs, tumor GFP fluorescence and H&E of livers extracted from mice treated with sorafenib (SFB) orally (PO) or sorafenib INPs (SFB INPs) intravenously (IV) for 28 days. Scale bar = 50 μm. White scale bar=50μm, Black scale bar=10mm (e) Liver weights, N=5, **P=0.006, *P=0.0426. (f) Tumor volume as measured in the livers if detectable. (g) Quantification of GFP fluorescence, N=5, **P=0.0098, *P=0.0201. (h) Comparison of liver weights from mice inoculated with 2× plasmids and treated with IV-administered sorafenib (SFB) or sorafenib INPs (SFB INPs) weekly for three weeks, N=4, **P=0.0021 *P=0.039 n.sP=0.067 (i) Survival data after treatments with i.v.-administered sorafenib (SFB IV) or sorafenib INPs, N=5, log-rank test z = 3.18, P = 0.00113.
Anti-tumor efficacy of nanoparticle-bound versus unencapsulated drugs
To test the therapeutic potential of the INPs in vivo, we compared the anti-tumor efficacy of equivalent drug doses in the murine liver cancer model described above, administered intravenously via INPs or orally for the free drug. Sorafenib or sorafenib INPs were injected weekly over the course of three weeks. Strikingly, whereas mice treated with free sorafenib exhibited multiple liver tumors at the experimental endpoint of 60 days, the livers of mice treated with nanoparticles containing the same sorafenib concentration showed virtually no residual tumor tissue, evident by visual inspection, GFP imaging, and histology (Fig. 4d). Furthermore, quantitative measures of liver weight, tumor volume, and GFP emission confirmed virtually complete tumor eradication in INP-treated livers (Fig. 4e–g). The INP-delivered sorafenib was also more efficacious in comparison to the free drug administered via the same route in a more aggressive version of the model (see Supplementary Methods, Fig 4h). A survival study found that 100% of mice administered sorafenib INPs survived, while no mice administered the free drug survived (Fig 4i).
Biodistribution and anti-tumor efficacy of a nanoparticle-encapsulated MEK inhibitor
We investigated the biodistribution and anti-tumor efficacy of INPs encapsulating the MEK inhibitor trametinib in a CAV1-expressing colon cancer model which is sensitive to MEK inhibition. The subcutaneous HCT116 human colorectal carcinoma model expresses CAV1 in cancer cells and tumor-associated endothelium (Fig 5a). We assessed the nanoparticle biodistribution in subcutaneous HCT116 xenografts and observed substantial nanoparticle accumulation in tumors (Supplementary Figure 23). Nanoparticle fluorescence in the tumor tissue was five-fold higher than in the lungs after 24 hours.
Figure 5. Anti-tumor efficacy in HCT116 colon cancer model.
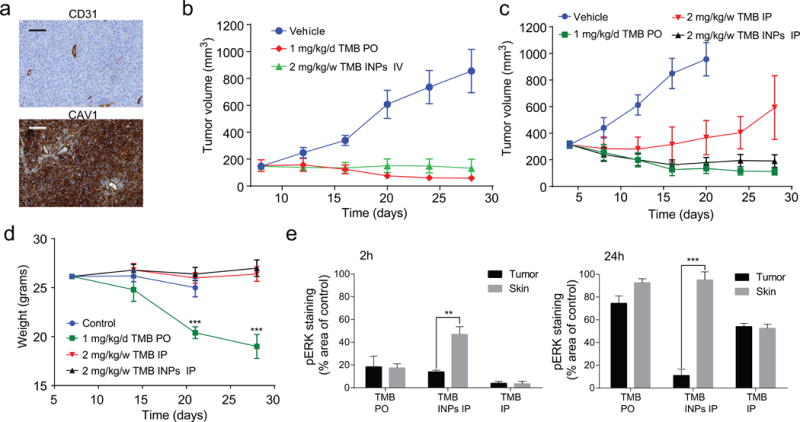
(a) Immunohistochemical staining of tumor section for CAV1 and CD31 expression in HCT116 xenografts 2 weeks after inoculation. (b) Tumor growth inhibition in response to i.v injected nanoparticles weekly or free drug given orally daily (N=6) at equivalent doses. (c) Tumor growth inhibition in response to a weekly dose of nanoparticles or free drug injected i.p (N=6) vs. an oral daily dose of free drug. (d) Weights of tumor-bearing mice during treatments. Error bars are ±SD of mean, N=6, ***P=0.0002, 0.00061. (e) Quantification of IHC staining area of pERK in skin and tumor tissue divided by the average staining area of untreated tumors. Error bars are ±SE of mean, N=5, **P=0.008, and ***P=0.00014.
We compared the anti-tumor efficacy of trametinib INPs to free trametinib. As with sorafenib, a weekly dose of trametinib did not affect tumor progression, but the nanoparticles, encapsulating an equivalent dose of drug, elicited significant tumor inhibition (Supplementary Figure 23d). The anti-tumor efficacy using a weekly dose of 2 mg/kg trametinib INPs was comparable to a daily dose of 1 mg/kg free trametinib orally, which was cumulatively 2.5× higher (Fig 5b). The trametinib INPs, administered weekly (2 mg/kg/w), were as effective as a daily dose of free drug (1 mg/kg/d), while the weekly dose of free trametinib, administered using the same route of administration, resulted in little tumor inhibition (Fig 5c).
Toxicity and assessment of off-target MEK inhibition
The toxicities of the INPs and kinase inhibitors were evaluated. Significant mouse weight loss was observed under daily treatments of free trametinib, but no weight loss was apparent for any of the weekly treatments, including with trametinib INPs (Fig 5d, Supplementary Figure 23d). We used the downstream phosphorylation status of ERK as a marker for drug activity7. The systemic administration of free trametinib resulted in a pronounced inhibition in ERK phosphorylation in the skin and tumor at 2 h, but pERK returned in both after 24 h. In contrast, trametinib INPs elicited prolonged pERK inhibition in the tumor, including after 24 h, but minimal inhibition in the skin was apparent at that timepoint (Fig 5e). As pERK suppression in the skin is associated with dose-limiting skin rash in humans, these results suggest that the nanoparticles could increase the therapeutic index of MEK inhibitors. Finally, drug/dye distribution ratio in tumors and organs was evaluated by comparing the administration of nanoparticles to free drug and dye in HCT116 xenografts (Supplementary Figure 24a–d). The nanoparticle formulation showed a similar distribution trend of drug and dye in tumors and organs, while the free molecules distributed differently, with up to a 5-fold ratio difference between the tumors, liver and lungs (Supplementary Figure 24e–f).
Conclusion
This study found a targeted drug carrier nanoparticle, formed by the self-assembly of small molecules, and that the particle self-assembly process can be predicted with an unprecedented degree of certainty via computational methods. The nanoparticles exhibited extremely high drug loadings of up to 90%. Nanoparticles incorporating kinase inhibitors sorafenib and trametinib selectively targeted CAV1-expressing human colon cancer and autochthonous liver cancer models to yield striking therapeutic effects while preventing inhibition in healthy tissues that normally cause dose-limiting toxicities. The possibility to predict targeted nanoparticle synthesis using molecular structure information of drug compounds presents a significant advancement in the field of drug delivery by facilitating a process that is normally conducted by bench chemistry.
Methods
Materials and Reagents
All non-drug chemicals were purchased from Sigma Aldrich (St. Louis, MO). Solvents were purchased from Acros organics (Morris Plains, NJ). All drugs were purchased from LC-Laboratories (Woburn, MA), except glibenclamide, glimepiride, and cyclosporine which were purchased from Sigma Aldrich, TAK632 from AdooQ Bioscience (Irvine, CA), and talazoparib, fulvestrant, venetoclax, selumetinib, and taselisib from Selleckchem (Houston, TX).
Cell lines
All cell lines reported in this study except SK-136 (see details below in tumor spheroids section) were purchased from ATCC (Manassas, VA) and were cultured in DMEM (Life Technologies) medium supplemented with 10% fetal bovine serum (FBS) and 1% Penicillin Streptomycin (Life Technologies) in a 37°C and 5% CO2 incubator. Cells were checked for mycoplasma contamination by PCR. The MCF-7 cell line is on the ICLAC Register of Misidentified Cell Lines (the contaminating cell line is OVCAR-8), and therefore we used these cells only up to ten passages after receiving the frozen vial directly from ATCC. Our CAV1 immunohistochemistry data for MCF-7 is in agreement with the Broad Institute Cancer Cell Line Encyclopedia mRNA data, but not with OVCAR-8.
Preparation of indocyanine nanoparticles
0.1 ml of each drug, dissolved in DMSO (10 mg/ml), was added drop-wise (20 μL per 15 sec) to a 0.6 ml aqueous solution containing IR783 (Sigma Aldrich, 1 mg/ml) and 0.05 mM sodium bicarbonate or deionized water (for drugs from group 3) under slight vortexing. The solution was centrifuged twice (20,000 G, 30 min), and the pellet was re-suspended in 1 ml of sterile PBS. In cases of a pellet that was difficult to re-suspend, it was ultrasonicated for 5 sec with a 1/8″ probe tip (Sonics & Materials) at 40% intensity. The nanoparticles were lyophilized in a 5% saline/sucrose solution. Absorbance spectra of solutions and suspensions were acquired using a TECAN M1000 plate reader.
Nanoparticle characterization
Dynamic light scattering (DLS) and zeta potential measurements were conducted using a Zetasizer Nano ZS (Malvern). Scanning electron microscopy (SEM) was conducted using a Zeiss Supra 25 Field Emission scanning electron microscope. SEM samples were prepared by gold sputtering and critical point drying. For AFM measurements, nanoparticles were observed on a freshly cleaved mica surface using an Asylum MFP 3D Bio AFM with an Olympus AC240TS probe. For transmission electron microscopy (TEM), a carbon-coated copper TEM grid (Ted Pella) was used with a JEOL 1200 EX transmission electron microscope operated at 80 kV.
Quantitative structure-nanoparticle assembly prediction (QSNAP)
Training set molecules were selected from drugs with solubilities of under 0.1 mg/ml in water. Molecular structure mol2 files, obtained from ChemSpider.com were energy minimized using the ChemBio3D Ultra 14 Suite. 4886 molecular descriptors were calculated for each molecular structure using Dragon 6 software (Talette). The descriptors were correlated to the binary experimental observations of nanoparticle formation, confirmed from DLS (entered as a rank of 5 in the vector) or precipitation (denoted as a rank of 0) from visual inspection.
QSNAP Model 1: Prediction of INP formation
The training set consisted of 16 drug molecules which were hydrophobic (water solubility <1 mg/ml) and highly soluble in DMSO (>10 mg/ml). 4886 descriptors from Dragon 6 software (Talette) were calculated, and their correlation with the experimental data of nanoparticle formation was analyzed. The descriptor with highest Pearson correlation coefficient (r), SpMAX4_Bh(s), was used for self-assembly prediction. 95% confidence intervals of r were estimated based on a procedure described by Nicholls42. An SpMAX4_Bh(s) value of 6.99 was observed to be the critical value. Molecules with SpMAX4_Bh(s) values equal or above 6.99 were predicted to form nanoparticles with indocyanine dye. According to this model, 18 predicted nanoparticle formers and 18 predicted nanoparticle non-formers were picked according to commercial availability to build a training set. Nanoparticle formation of the training set was tested under the same experimental conditions.
QSNAP Model 2: Prediction of INP size
A training set was formed using 8 INP-forming drug molecules with experimentally observed sizes. Using the Dragon 6 software, the GETAWAY R4e descriptor was found to exhibit the highest correlation to INP size. We built a linear model using the regression module of Microsoft Excel 2010 Data Analysis ToolPak to predict nanoparticle sizes based on GETAWAY R4e descriptor as following (Eq. 2):
| (Eq. 2) |
Coefficients in the above equation were determined by linear regression to 8 data points of the training set. 95% confidence intervals of R2 were estimated based on procedure described by Nicholls42. The descriptor was calculated for an additional 18 nanoparticle-forming drugs, to be used as a validation set. The nanoparticle sizes were measured experimentally by DLS (Supplementary Table 3).
Molecular dynamics simulations of INP self-assembly
Four indocyanine molecules and twelve drug molecules of sorafenib or taselisib were placed in a 5 nm × 5 nm × 5 nm water-box with periodic boundary conditions containing approximately 3,700 TIP3P model water molecules and sodium counter-ions to balance the negative charges of the indocyanine. The total system was comprised of ~12,000 atoms. To run the REMD simulations, the Gromacs 4.6.7 simulation package was used with the Charmm36 force field. Long-range electrostatics were calculated using the particle mesh Ewald method with a 0.9 nm real space cutoff. For van der Waals interactions, a cutoff value of 1.2 nm was used. Simulation parameters for the indocyanine and drug particles were obtained from SwissParam (Swiss Institute of Bioinformatics). The indocyanine-drug configurations were energy minimized and subjected to 100 ps NVT equilibration at 300 K. Thirty-two replicas of the configuration were created with temperatures ranging from 300 K to 563 K. Temperature intervals increased with absolute temperature to maintain uniform exchange probability around 10% acceptance. The 32 replicas were run in parallel for 50 ns of NVT production. Exchange between adjacent temperatures replicas was attempted every 2 ps. The time step of the simulation was 2 fs. The trajectories were saved every 10 ps, yielding a total of 5,000 snapshots for production analysis. Structures were visualized in VMD.
Indocyanine nanoparticle self-assembly prediction of DrugBank small molecule drugs
Based on our understanding of chemical properties leading to drug-dye nanoparticle formation from QSNAP analysis and inspection of 52 drug molecules experimentally determined to form or not form INPs (All drug molecules listed in Table S1, except the following which were not experimentally tested at the time for INP formation: bithionol, probucol, cholesterol, mubritinib, pyrene, [one more missing drug that needs to be added to] and tazarotene), a decision tree was built that categorizes small molecule drugs from DrugBank according their ability to self-assemble and their predicted preparation conditions (Fig 2g). We analyzed all small molecule type drug entries with reported structures in DrugBank Version 4.5.0 (https://www.drugbank.ca/ released on 2016.04.20) and categorized them according to the decision tree.
Simplified molecular-input line-entry system (SMILES) strings, LogP, strongest acidic pKa and strongest basic pKa values were extracted from DrugBank records. LogP, strongest acidic pKa, and strongest basic pKa are calculated physical properties reported in DrugBank by ChemAxon. All Python scripts used in the analysis, dataframe of chemical descriptors and partitioning results based on decision tree (Fig 2g) can all be found in the nano-drugbank repository, hosted on the collaborative open source software development platform GitHub (http://www.github.com/choderalab/nano-drugbank). A full list of small molecule drugs from DrugBank predicted to self-assemble into indocyanine nanoparticles according to the decision tree analysis is available as a CSV file in the repository (df_drugbank_decision_tree.csv).
Calculation of Number of High Intrinsic State Substructures (NHISS) descriptor
NHISS was calculated as the total number of functional groups in a molecule with intrinsic state atoms ≥7. These groups included fluorine atoms (-F) and double-bonded oxygen atoms (=O). To determine the NHISS scores of a set of molecules, we conducted a substructure search for fluorine, carbonyl, nitro, nitroso, sulfinyl, and sulfonyl functional groups using the SMILES strings of each molecule. A substructure search using SMiles ARbitrary Target Specification (SMARTS) was performed programmatically using the OpenEye OEChem Toolkit [3]. SMARTS used for each functional group and matching substructures patterns are reported in Supplementary Figure 24. SMARTS editor and SMARTSviewer [4] were used to generate SMARTS strings that match desired substructures. Number of substructure matches (n) of fluorine, carbonyl, sulfinyl, and nitroso groups incremented the NHISS value by 1, and nitro and sulfone groups incremented by 2.
| (Eq. 3) |
A performance comparison of drug categorization based on NHISS ≥ 4 and SpMAX4_Bh(s) ≥ 7.0 critical values was analyzed and reported in a confusion matrix (Supplementary Table 3–4). Python scripts used in the calculation of the NHISS descriptor can be found in the nano-drugbank GitHub repository at https://github.com/choderalab/nano-drugbank.
Analysis of self assembly prediction performance of hydrophobicity descriptors compared to structure based descriptors SpMAX4_Bh(s) and NHISS
To analyse the discrimination performance of logP (OpenEye XlogP, Chem3D ClogP, Dragon ALOGP2), logD (Chemicalize, pH=7.4), SpMAX4_Bh(s) and NHISS descriptors a Receiver Operating Characteristic (ROC) curves was plotted, using experimental data points (all molecules listed in Table S1, except pyrene which was not included in this analysis since it is not a drug) that pass the first decision point of the decision tree: 60 drugs with ChemAxon logP >= 2.2 that were tested for nanoparticle formation.
We computed the area under the curve (AUC) for the receiver-operator characteristic (ROC) function, which measures how much information a descriptor carries about whether the drug will form or not form INPs. An ROC AUC of 0.5 indicates that the descriptor carries no information about whether the drug will form INPs, while an AUC of 1.0 indicates the descriptor is perfectly predictive; intermediate values indicate various degrees of predictiveness. This measure is standard in design fields such as virtual screening to assess the relative utility of various predictive models.
We computed 95% confidence intervals of the ROC AUC by bootstrapping experimental data: the dataset of 60 drug molecules was resampled 1000 times with replacement. Confidence intervals are estimated based on the distribution of AUC values of resampled datasets of size 60.
Drug release measurements
Nanoparticles were incubated in PBS at pH 5.5, 7.4 at 37 °C or with serum with a concentration equivalent to 1 μM of drug. The amount of released drug was determined by extracting into ethanol/acetonitrile and measuring absorbance at 260 nm (for sorafenib) and 314 for trametinib using a UV-VIS-NIR spectrophotometer (Jasco 670) or plate reader (Tecan infinite M1000). All experiments were carried out in duplicate.
Protein adsorption
Protein adsorption was evaluated using surface zeta potential measurements of nanoparticles incubated with escalating doses of BSA (0-40 mg/ml). Measurements were performed 15 min after incubation with BSA with a Malvern Zetasizer Nano ZS system.
Nanoparticle uptake in cell lines
Cell lines bEnd.3, BAEC, SK136, L3, MCF7, and HL60 were used. The cells were plated in a 24 well plate (50,000 cells in 1 ml) and incubated with 20 μg/ml of nanoparticles for 45 min and with CellMask Green (Life Technologies) for another 15 min to stain cell membranes and Hoescht 33342 (Life technologies) to stain nuclei. The cells were rinsed twice with PBS. Images were acquired with an inverted Olympus IX51 fluorescent microscope equipped with XM10IR Olympus camera and Excite Xenon lamp. Similar exposure times and excitation intensities were applied throughout all experiments. Filter sets: cell membrane: ex 488 nm, em 525 nm, nucleus: ex 350 nm, em 460 nm, IR783 dye in particles: ex 780 nm, em 820 nm. Images were processed with ImageJ software.
Development of tumor spheroids
To generate multi-cellular tumor spheroids, we developed a cell line, SK-136, derived from the autochthonous liver cancer model. The cells were generated and harvested from c-MYC/β-catenin amplified hepatoblastoma cells from FVB mice using a method described previously. The harvested cells were plated on ultra-low attachment 96-well plates (Corning) and incubated for 3 days. The wells were examined with an inverted light microscope to confirm the formation of multicellular tumor spheroids. The wells containing tumor spheres were centrifuged, trypsinized, and seeded in 75 cm cell culture treated flasks with DMEM. This process was repeated 3 times to generate a sub-clone of spheroid-forming cells. To identify CAV1 expression in 7 day-old tumor spheroids, they were collected at the bottom of an Eppendorf tube, suspended in PFA, and embedded in paraffin. 10 μm slices were stained with anti-caveolin-1 antibody (Cell Signaling, cat# 3267, 1ug/ml) as well as H&E. To characterize the surface of the tumor spheroids, SK-136 cells were grown in ultra-low attachment flasks (Corning) for 5 days. Once the spheres were formed, the media containing tumor spheres was removed and placed in 1 ml Eppendorf tube. The spheres were allowed to settle by gravity for 2 min and the media was replaced with fresh media. The spheroids were placed on poly-l-lysine-coated plastic coverslips (Thermonex). The spheroids were then fixed in 2.5% paraformaldehyde in 0.075M cacodylate buffer for one hour, rinsed in cacodylate buffer, and dehydrated in a graded series of alcohols: 50%, 75%, 95% and 100%. The samples were then dried in a JCP-1 Critical Point Dryer (Denton). The coverslips were attached to SEM stubs and sputter-coated with gold/palladium using a Desk IV sputter system (Denton Vacuum). The images were obtained in a Scanning Field Emission Supra 25 scanning electron microscope (Zeiss).
Penetration of nanoparticles in tumor spheroids
104 SK-136 cells were seeded in 25 cm2 ultra-low attachment flasks (Corning) and grown for 7 days in DMEM with media replacement every 3 days. When spheres reached a diameter of approximately 250 μm, 0.2 ml of growth suspension was plated in normal adhesion 96-well plates, yielding 3–5 spheres per well. After 30 min, spheres adhered to the bottom of the wells. Nanoparticles were added at a concentration of 50 μg/ml and incubated for 20-40min. The wells were washed 3 times with HBSS buffer and imaged with an inverted Olympus IX51 fluorescence microscope equipped with a XM10 Olympus CCD camera. The fluorescence intensity was analyzed using ImageJ software.
Animal Studies
All of the animal studies were conducted according to protocols approved by the Memorial Sloan Kettering Cancer Center Institutional Animal Care and Use Committee (IACUC). Mice were maintained and treated in accordance with the institutional guidelines of Memorial Sloan Kettering Cancer Center.
MYC/β-catenin driven liver tumor studies
Hydrodynamic transfection of C-MYC and β-catenin was performed as follows: 10μg pT3-EF1a-c-myc, 10μg pT3-EF1a-β-CateninT41A-IRES-GFP and CMV-SB13 Sleeping Beauty transposase (1:5 ratio) were mixed in sterile saline solution. A total volume of plasmid-saline solution mix corresponding to 10% of the body weight was injected into the lateral tail vein of 6- to 8-week old female FVB/N mice (Jackson Laboratory, Maine, USA) within 5–7 seconds. Mice were administered either 30 mg/kg sorafenib orally, or 30 mg/kg sorafenib in sorafenib INP form via tail vein injection. For targeting and biodistribution experiments, mice were injected with sorafenib INPs or indocyanine 3 weeks and 6 weeks after transfection. Livers were harvested 24 hours after injection. For efficacy studies, treatments were administered weekly for three weeks. Livers were harvested at day 59. Tumors were evaluated using fluorescence imaging (IVIS imaging system, Xenogen Corp., Hopkinton, MA) and immunohistochemistry (H&E). Tumor volume was measured using a caliper. For the aggressive model 20μg pT3-EF1a-c-myc, 20μg pT3-EF1a-β-CateninT41A-IRES-GFP and CMV-SB13 Sleeping Beauty transposase were used (×2 than above).
Colon cancer xenograft studies
Six-week-old female athymic NU/NU nude mice purchased from Charles River Laboratories were injected with 5×10⁵ of HCT116 human colorectal carcinoma cells subcutaneously in 100 ml culture media/Matrigel (BD Biosciences) at a 1:5 ratio. Animals were randomized at a tumor volume of 70 to 120 mm3 into four to six groups, with n = 8–10 tumors per group. Animals were treated p.o. with trametinib (1 mg/kg) or i.v. with trametinib INPs (1mg/kg) once a week. Tumor size was measured with a digital caliper, and tumor volumes were calculated using the formula: (length × width2) × (π/6). Animals were euthanized using CO2 inhalation. Mice were housed in air-filtered laminar flow cabinets with a 12-hr light/dark cycle and food and water ad libitum.
Blood pharmacokinetics
Serial blood samples were collected in lithium–heparin-containing tubes before and at 0.05, 0.5, 2, 4, 24 and 48 h after the administration of the first dose of sorafenib INPs or free sorafenib in Kolliphor EL. Samples were processed within 30 min of collection by centrifugation for 10 min at 1500 × g under refrigeration (~4°C). The resultant plasma was stored at −70°C until subsequent analysis for sorafenib using a validated liquid chromatography/tandem mass spectrometry method. Briefly, sorafenib was extracted from plasma using acetonitrile precipitation. Separation of sorafenib, C18 (150 mm × 2.1 mm i.d., 3.5 μm; Agilent Technologies USA) analytical column using a mobile phase consisting of acetonitrile containing 0.1% trifluoroacetic and DI water containing 0.1% trifluoroacetic. The gradient from 0 to 95% acetonitrile in 17min and flow at 1 ml/min showed retention time of 12.5min and absorbance at 280nm.
In vivo imaging of INPs with IVIS
24 hours after tail vein injection of 200 μl (1 mg/ml) INP (sorafenib, trametinig, fulvestrant and valrubicin). Organs were extracted and placed on a petri dish (liver, kidney, lungs, heart, spleen and tumor if present). Images were taken with an IVIS imaging system (Xenogen Corp.). Radiance efficiency (photons/sec/cm2) was calculated for the tumor region of interest (ROI) using LivingImage V4.2 software.
Drug biodistribution
24 h after administration of nanoparticles or free drugs, the organs were cut to small pieces, and homogenized with lysis buffer and the drugs mixed with chloroform overnight. The solution mixture was filtered and the homogenate was treated twice with chloroform with repeated filtration. Chloroform was evaporated under vacuum and reconstituted in chloroform-d6. 19F-NMR spectroscopy was applied for fluorine quantification which arise solely from the drugs.
Liver metastasis model of uveal melanoma in NOD SCID GAMMA (NSG mice)
Human liver metastatic-enriched uveal melanoma cells expressing GFP-luciferase (L3 from OMM-1 cells, ATCC) were supplied by V.K.R. 5×10⁵ cells were injected via the retro-orbital sinus on NSG mice (JAX laboratories). The appearance of liver metastases by bioluminescence was observed within 14 days after inoculation. Nanoparticles were injected 24 h before imaging with (IVIS imaging system, Xenogen Corp., Hopkinton, MA).
Immunohistochemistry
For xenograft samples, dissected tissues were fixed immediately after removal in a 10% buffered formalin solution for a maximum of 24 h at room temperature before being dehydrated and paraffin embedded under vacuum. The tissue sections were deparaffinized with EZPrep buffer (Ventana Medical Systems). Antigen retrieval was performed with CC1 buffer (Ventana Medical Systems), and sections were blocked for 30 minutes with Background Buster solution (Innovex).
The immunohistochemical detection was performed at Molecular Cytology Core Facility of Memorial Sloan Kettering Cancer Center using Discovery XT processor (Ventana Medical Systems). All the tissues were harvested from mice and fixed in 4%PFA overnight. Fixed tissues were dehydrated and embedded in paraffin before 5 μm sections were put on slides. The tissue sections were deparaffinized with EZPrep buffer (Ventana Medical Systems), antigen retrieval was performed with CC1 buffer (Ventana Medical Systems) and sections were blocked for 30 minutes with Background Buster solution (Innovex) or 10% normal rabbit serum in PBS (for CAV1 staining). CAV1 sections were incubated with antibodies against caveolin-1 (Cell Signaling, cat# 3267, 1ug/ml) for 5h, followed by 60 minutes of incubation with biotinylated rabbit anti-goat IgG (Vector, cat #BA-5000) at 1:200 dilution. pMAPK sections were blocked with avidin/biotin block for 12 minutes, followed by incubation with pMAPK antibodies (Cell Signaling, cat# 4370, 1ug/ml) for 5h, followed by 60 minutes incubation with biotinylated goat anti-rabbit IgG (Vector labs, cat#PK6101) at 1:200 dilution. Ki67 sections were incubated with Ki67 antibodies (Vector, cat# VP-K451, 0.4ug/ml) for 5h, followed by 60 minutes incubation with biotinylated goat anti-rabbit IgG (Vector labs, cat#PK6101) at 1:200 dilution. CD31 sections were incubated with CD31 antibodies (Dianova, cat# DIA-310, 1ug/ml) for 5h, followed by 60 minutes incubation with biotinylated rabbit anti-rat IgG (Vector labs, cat#PK-4004) at 1:200 dilution. Detection was performed with a DAB detection kit (Ventana Medical Systems) according to manufacturer instructions, followed by counterstaining with hematoxylin (Ventana Medical Systems) and coverslipped with Permount (Fisher Scientific).
Code availability
All Python scripts used in the analysis, dataframe of chemical descriptors and partitioning results based on decision tree (Fig 2g) can all be found in the nano-drugbank repository, hosted on the collaborative open source software development platform GitHub (http://www.github.com/choderalab/nano-drugbank). A full list of small molecule drugs from DrugBank predicted to self-assemble into indocyanine nanoparticles according to the decision tree analysis is available as a CSV file in the repository (df_drugbank_decision_tree.csv).
Statistical analysis
Statistical analysis for in vitro and in vivo experiments was performed using GraphPad Prism (GraphPad 7 Software). A two-tailed Student’s unpaired t test was condcuted to compare control versus treated groups. The significance level was set at P < 0.05. Independent experiments were conducted with a minimum of two biological replicates per condition to allow for statistical comparison. Error bars represent the SEM, and P values are indicated in the figure captions and main text. All cellular experiments were repeated at least two times. Survival plots of experimental metastasis models were analyzed using the Mantel-Cox log-rank test. For all in vivo experiments, the sample size was at least N = 5 mice per treatment group. These sample sizes were chosen based on previous literature and our own expertise. All animals were included in analyses. Animal cohorts were randomly selected. Investigators were not blinded. Representative images of tissue histology were from at least 5 images of the same tissue, and duplicate staining was done for each tissue from experiments so that at least 2 out of 5 organs/tissues were embedded and stained.
Supplementary Material
Acknowledgments
This work was supported in part by the NIH New Innovator Award (DP2-HD075698), the National Cancer Institute (CA 013106), the Cancer Center Support Grant (P30 CA008748), the Expect Miracles Foundation - Financial Services Against Cancer, the Anna Fuller Fund, the Louis V. Gerstner Jr. Young Investigator’s Fund, the Frank A. Howard Scholars Program, the Honorable Tina Brozman Foundation for Ovarian Cancer Research, Cycle for Survival, the Alan and Sandra Gerry Metastasis Research Initiative, Mr. William H. Goodwin and Mrs. Alice Goodwin and the Commonwealth Foundation for Cancer Research, the Experimental Therapeutics Center, the Imaging & Radiation Sciences Program, and the Center for Molecular Imaging and Nanotechnology of Memorial Sloan Kettering Cancer. This work is supported in part by a New York State Department of Health Fixed Term Agreement (Contract# DOH01-C30315GG-3450000). The opinions, results, findings and/or interpretations of data contained therein are the responsibility of the contractor and do not necessarily represent the opinions, interpretations or policy of the state or if funded with federal funds, the applicable federal funding agency. YS was supported by the Center for Metastasis Research (CMR) Scholars Fellowship Program. D.R. was supported by an American Cancer Society – Roaring Fork Valley Postdoctoral Fellowship. SWL is a Howard Hughes Medical Institute Investigator and the Geoffrey Beene Chair for Cancer Biology (MSKCC). J.B. was supported by the Tow Foundation Postdoctoral Fellowship, Center for Molecular Imaging and Nanotechnology at MSKCC. We would like to thank the following facilities at MSKCC: Molecular Cytology Core Facility, Small Animal Imaging, Anti-tumor Assessment, and Electron Microscopy. The molecular dynamics work used the Extreme Science and Engineering Discovery Environment (XSEDE), supported by National Science Foundation grant number TG-MCB-130013. We would like to thank Nina Lampen for assistance with Electron Microscopy. We would also like to thank Prakrit V. Jena, R. Williams, J. Harvey, T. Galassi, J. Humm, and C. Horoszko for helpful discussions.
Footnotes
Author Contribution
Y.S. and D.A.H. conceived the project and designed experiments. Y.S. analyzed data, designed, and conducted the self-assembly experiments. D.R. performed MD experiments and analysis. D.F.T. and J.L. performed the in vivo liver cancer model. Y.S., V.K.R., A.M. and J.S. performed all other in-vivo experiments, electron microscopy and tissue staining. Y.S., V.K.R., K.N., J.L.S., M.R.N., E.C. and J.S. performed in vitro experiments. Y.S. developed the tumor spheroid model. E.B., J.L.S., K.N., R.S., M.R.N., E.C., K.S.G., M.D. and D.C.J. performed experiments for the computational drug screening and nanoparticle self-assembly validation experiments. J.B. performed F-NMR studies for drug biodistribution. M.I. performed self-assembly categorization of DrugBank small molecule drugs. M.I. and J.D.C. conducted statistical analysis of QSNAP descriptors. Y.S. and D.A.H. wrote the paper. D.A.H., S.W.L., and J.D.C. supervised the research.
Competing financial interests
The authors declare no competing financial interests
Data availability.
The data sets generated and/or analysed during the current study are available from the corresponding authors upon reasonable request.
References
- 1.Peer D, Karp JM, Hong S, FaroKHzad OC, Margalit R, Langer R. Nanocarriers as an Emerging Platform for Cancer Therapy. Nature nanotechnology. 2007;2:751–760. doi: 10.1038/nnano.2007.387. [DOI] [PubMed] [Google Scholar]
- 2.Schroeder A, Heller DA, Winslow MM, Dahlman JE, Pratt GW, Langer R, Jacks T, Anderson DG. Treating Metastatic Cancer with Nanotechnology. Nature reviews Cancer. 2012;12:39–50. doi: 10.1038/nrc3180. [DOI] [PubMed] [Google Scholar]
- 3.Yaari Z, et al. Theranostic Barcoded Nanoparticles for Personalized Cancer Medicine. Nature communications. 2016;7:13325. doi: 10.1038/ncomms13325. [DOI] [PMC free article] [PubMed] [Google Scholar]
- 4.Wilhelm S, Tavares AJ, Dai Q, Ohta S, Audet J, Dvorak HF, Chan WCW. Analysis of Nanoparticle Delivery to Tumours. Nat Rev Mater. 2016;1 [Google Scholar]
- 5.Cheng Z, Al Zaki A, Hui JZ, Muzykantov VR, Tsourkas A. Multifunctional Nanoparticles: Cost Versus Benefit of Adding Targeting and Imaging Capabilities. Science. 2012;338:903–10. doi: 10.1126/science.1226338. [DOI] [PMC free article] [PubMed] [Google Scholar]
- 6.Lammers T, Kiessling F, Hennink WE, Storm G. Drug Targeting to Tumors: Principles, Pitfalls and (Pre-) Clinical Progress. Journal of controlled release : official journal of the Controlled Release Society. 2012;161:175–87. doi: 10.1016/j.jconrel.2011.09.063. [DOI] [PubMed] [Google Scholar]
- 7.Shamay Y, et al. P-Selectin Is a Nanotherapeutic Delivery Target in the Tumor Microenvironment. Sci Transl Med. 2016;8:345ra87. doi: 10.1126/scitranslmed.aaf7374. [DOI] [PMC free article] [PubMed] [Google Scholar]
- 8.Mizrachi A, et al. Tumour-Specific Pi3k Inhibition Via Nanoparticle-Targeted Delivery in Head and Neck Squamous Cell Carcinoma. Nature communications. 2017;8:14292. doi: 10.1038/ncomms14292. [DOI] [PMC free article] [PubMed] [Google Scholar]
- 9.Maojo V, Fritts M, de la Iglesia D, Cachau RE, Garcia-Remesal M, Mitchell JA, Kulikowski C. Nanoinformatics: A New Area of Research in Nanomedicine. International journal of nanomedicine. 2012;7:3867–90. doi: 10.2147/IJN.S24582. [DOI] [PMC free article] [PubMed] [Google Scholar]
- 10.Irwin JJ, Duan D, Torosyan H, Doak AK, Ziebart KT, Sterling T, Tumanian G, Shoichet BK. An Aggregation Advisor for Ligand Discovery. Journal of medicinal chemistry. 2015;58:7076–87. doi: 10.1021/acs.jmedchem.5b01105. [DOI] [PMC free article] [PubMed] [Google Scholar]
- 11.Seidler J, McGovern SL, Doman TN, Shoichet BK. Identification and Prediction of Promiscuous Aggregating Inhibitors among Known Drugs. Journal of medicinal chemistry. 2003;46:4477–86. doi: 10.1021/jm030191r. [DOI] [PubMed] [Google Scholar]
- 12.Feng BY, Shelat A, Doman TN, Guy RK, Shoichet BK. High-Throughput Assays for Promiscuous Inhibitors. Nature chemical biology. 2005;1:146–8. doi: 10.1038/nchembio718. [DOI] [PubMed] [Google Scholar]
- 13.Alskar LC, Porter CJ, Bergstrom CA. Tools for Early Prediction of Drug Loading in Lipid-Based Formulations. Molecular pharmaceutics. 2016;13:251–61. doi: 10.1021/acs.molpharmaceut.5b00704. [DOI] [PMC free article] [PubMed] [Google Scholar]
- 14.Fourches D, Pu D, Tassa C, Weissleder R, Shaw SY, Mumper RJ, Tropsha A. Quantitative Nanostructure-Activity Relationship Modeling. ACS Nano. 2010;4:5703–12. doi: 10.1021/nn1013484. [DOI] [PMC free article] [PubMed] [Google Scholar]
- 15.Puzyn T, Rasulev B, Gajewicz A, Hu X, Dasari TP, Michalkova A, Hwang HM, Toropov A, Leszczynska D, Leszczynski J. Using Nano-Qsar to Predict the Cytotoxicity of Metal Oxide Nanoparticles. Nature nanotechnology. 2011;6:175–8. doi: 10.1038/nnano.2011.10. [DOI] [PubMed] [Google Scholar]
- 16.Zhang Y, Pelet JM, Heller DA, Dong Y, Chen D, Gu Z, Joseph BJ, Wallas J, Anderson DG. Lipid-Modified Aminoglycoside Derivatives for in Vivo Sirna Delivery. Advanced materials. 2013;25:4641–5. doi: 10.1002/adma.201301917. [DOI] [PMC free article] [PubMed] [Google Scholar]
- 17.Roxbury D, Jagota A, Mittal J. Sequence-Specific Self-Stitching Motif of Short Single-Stranded DNA on a Single-Walled Carbon Nanotube. Journal of the American Chemical Society. 2011;133:13545–50. doi: 10.1021/ja204413v. [DOI] [PubMed] [Google Scholar]
- 18.Lee OS, Stupp SI, Schatz GC. Atomistic Molecular Dynamics Simulations of Peptide Amphiphile Self-Assembly into Cylindrical Nanofibers. Journal of the American Chemical Society. 2011;133:3677–83. doi: 10.1021/ja110966y. [DOI] [PubMed] [Google Scholar]
- 19.Frederix PW, Scott GG, Abul-Haija YM, Kalafatovic D, Pappas CG, Javid N, Hunt NT, Ulijn RV, Tuttle T. Exploring the Sequence Space for (Tri-)Peptide Self-Assembly to Design and Discover New Hydrogels. Nature chemistry. 2015;7:30–7. doi: 10.1038/nchem.2122. [DOI] [PubMed] [Google Scholar]
- 20.Shi C, Guo D, Xiao K, Wang X, Wang L, Luo J. A Drug-Specific Nanocarrier Design for Efficient Anticancer Therapy. Nature communications. 2015;6:7449. doi: 10.1038/ncomms8449. [DOI] [PMC free article] [PubMed] [Google Scholar]
- 21.Alphandery E, Grand-Dewyse P, Lefevre R, Mandawala C, Durand-Dubief M. Cancer Therapy Using Nanoformulated Substances: Scientific, Regulatory and Financial Aspects. Expert review of anticancer therapy. 2015;15:1233–55. doi: 10.1586/14737140.2015.1086647. [DOI] [PubMed] [Google Scholar]
- 22.Agarwal A, Lvov Y, Sawant R, Torchilin V. Stable Nanocolloids of Poorly Soluble Drugs with High Drug Content Prepared Using the Combination of Sonication and Layer-by-Layer Technology. Journal of controlled release : official journal of the Controlled Release Society. 2008;128:255–60. doi: 10.1016/j.jconrel.2008.03.017. [DOI] [PubMed] [Google Scholar]
- 23.Muller RH, Keck CM. Challenges and Solutions for the Delivery of Biotech Drugs–a Review of Drug Nanocrystal Technology and Lipid Nanoparticles. Journal of biotechnology. 2004;113:151–70. doi: 10.1016/j.jbiotec.2004.06.007. [DOI] [PubMed] [Google Scholar]
- 24.McLaughlin CK, Duan D, Ganesh AN, Torosyan H, Shoichet BK, Shoichet MS. Stable Colloidal Drug Aggregates Catch and Release Active Enzymes. ACS chemical biology. 2016;11:992–1000. doi: 10.1021/acschembio.5b00806. [DOI] [PMC free article] [PubMed] [Google Scholar]
- 25.Shi C, Wu JB, Pan D. Review on near-Infrared Heptamethine Cyanine Dyes as Theranostic Agents for Tumor Imaging, Targeting, and Photodynamic Therapy. Journal of biomedical optics. 2016;21:50901. doi: 10.1117/1.JBO.21.5.050901. [DOI] [PubMed] [Google Scholar]
- 26.Yang X, et al. Near Ir Heptamethine Cyanine Dye-Mediated Cancer Imaging. Clinical cancer research : an official journal of the American Association for Cancer Research. 2010;16:2833–44. doi: 10.1158/1078-0432.CCR-10-0059. [DOI] [PMC free article] [PubMed] [Google Scholar]
- 27.McArthur EA, Godbe JM, Tice DB, Weiss EA. A Study of the Binding of Cyanine Dyes to Colloidal Quantum Dots Using Spectral Signatures of Dye Aggregation. The Journal of Physical Chemistry. 2012;116:6136–6142. [Google Scholar]
- 28.Slavnova TD, Gorner H, Chibisov AK. Cyanine-Based J-Aggregates as a Chirality-Sensing Supramolecular System. The journal of physical chemistry B. 2011;115:3379–84. doi: 10.1021/jp1121118. [DOI] [PubMed] [Google Scholar]
- 29.Fofang NT, Grady NK, Fan Z, Govorov AO, Halas NJ. Plexciton Dynamics: Exciton-Plasmon Coupling in a J-Aggregate-Au Nanoshell Complex Provides a Mechanism for Nonlinearity. Nano letters. 2011;11:1556–60. doi: 10.1021/nl104352j. [DOI] [PubMed] [Google Scholar]
- 30.Roberto Todeschini VC, Mannhold Raimund, Kubinyi Hugo, Timmerman Hendrik. Multivariate Analysis of Molecular Descriptors. Handbook of Molecular Descriptors. 2008;11:688. [Google Scholar]
- 31.Kier LB, Hall LH. An Electrotopological-State Index for Atoms in Molecules. Pharmaceutical research. 1990;7:801–7. doi: 10.1023/a:1015952613760. [DOI] [PubMed] [Google Scholar]
- 32.Consonni V, Todeschini R, Pavan M. Structure/Response Correlations and Similarity/Diversity Analysis by Getaway Descriptors. 1. Theory of the Novel 3d Molecular Descriptors. Journal of chemical information and computer sciences. 2002;42:682–92. doi: 10.1021/ci015504a. [DOI] [PubMed] [Google Scholar]
- 33.Wishart DS, Knox C, Guo AC, Shrivastava S, Hassanali M, Stothard P, Chang Z, Woolsey J. Drugbank: A Comprehensive Resource for in Silico Drug Discovery and Exploration. Nucleic acids research. 2006;34:D668–72. doi: 10.1093/nar/gkj067. [DOI] [PMC free article] [PubMed] [Google Scholar]
- 34.Rhee YM, Pande VS. Multiplexed-Replica Exchange Molecular Dynamics Method for Protein Folding Simulation. Biophysical journal. 2003;84:775–86. doi: 10.1016/S0006-3495(03)74897-8. [DOI] [PMC free article] [PubMed] [Google Scholar]
- 35.Zhou R. Replica Exchange Molecular Dynamics Method for Protein Folding Simulation. Methods in molecular biology. 2007;350:205–23. doi: 10.1385/1-59745-189-4:205. [DOI] [PubMed] [Google Scholar]
- 36.Voigt J, Christensen J, Shastri VP. Differential Uptake of Nanoparticles by Endothelial Cells through Polyelectrolytes with Affinity for Caveolae. Proceedings of the National Academy of Sciences of the United States of America. 2014;111:2942–7. doi: 10.1073/pnas.1322356111. [DOI] [PMC free article] [PubMed] [Google Scholar]
- 37.Jena PV, Shamay Y, Shah J, Roxbury D, Paknejad N, Heller DA. Photoluminescent Carbon Nanotubes Interrogate the Permeability of Multicellular Tumor Spheroids. Carbon. 2016;97:99–109. doi: 10.1016/j.carbon.2015.08.024. [DOI] [PMC free article] [PubMed] [Google Scholar]
- 38.Wang Z, Tiruppathi C, Cho J, Minshall RD, Malik AB. Delivery of Nanoparticle: Complexed Drugs across the Vascular Endothelial Barrier Via Caveolae. IUBMB life. 2011;63:659–67. doi: 10.1002/iub.485. [DOI] [PMC free article] [PubMed] [Google Scholar]
- 39.Chrastina A, Massey KA, Schnitzer JE. Overcoming in Vivo Barriers to Targeted Nanodelivery. Wiley interdisciplinary reviews Nanomedicine and nanobiotechnology. 2011;3:421–37. doi: 10.1002/wnan.143. [DOI] [PubMed] [Google Scholar]
- 40.Chen X, Calvisi DF. Hydrodynamic Transfection for Generation of Novel Mouse Models for Liver Cancer Research. The American journal of pathology. 2014;184:912–23. doi: 10.1016/j.ajpath.2013.12.002. [DOI] [PMC free article] [PubMed] [Google Scholar]
- 41.O’Donnell KA, et al. A Sleeping Beauty Mutagenesis Screen Reveals a Tumor Suppressor Role for Ncoa2/Src-2 in Liver Cancer. Proceedings of the National Academy of Sciences of the United States of America. 2012;109:E1377–86. doi: 10.1073/pnas.1115433109. [DOI] [PMC free article] [PubMed] [Google Scholar]
- 42.Nicholls A. Confidence Limits, Error Bars and Method Comparison in Molecular Modeling. Part 1: The Calculation of Confidence Intervals. Journal of computer-aided molecular design. 2014;28:887–918. doi: 10.1007/s10822-014-9753-z. [DOI] [PMC free article] [PubMed] [Google Scholar]
Associated Data
This section collects any data citations, data availability statements, or supplementary materials included in this article.