

ABSTRACT
The enrichment culture KS is one of the few existing autotrophic, nitrate-reducing, Fe(II)-oxidizing cultures that can be continuously transferred without an organic carbon source. We used a combination of catalyzed amplification reporter deposition fluorescence in situ hybridization (CARD-FISH) and nanoscale secondary ion mass spectrometry (NanoSIMS) to analyze community dynamics, single-cell activities, and interactions among the two most abundant microbial community members (i.e., Gallionellaceae sp. and Bradyrhizobium spp.) under autotrophic and heterotrophic growth conditions. CARD-FISH cell counts showed the dominance of the Fe(II) oxidizer Gallionellaceae sp. under autotrophic conditions as well as of Bradyrhizobium spp. under heterotrophic conditions. We used NanoSIMS to monitor the fate of 13C-labeled bicarbonate and acetate as well as 15N-labeled ammonium at the single-cell level for both taxa. Under autotrophic conditions, only the Gallionellaceae sp. was actively incorporating 13C-labeled bicarbonate and 15N-labeled ammonium. Interestingly, both Bradyrhizobium spp. and Gallionellaceae sp. became enriched in [13C]acetate and [15N]ammonium under heterotrophic conditions. Our experiments demonstrated that Gallionellaceae sp. was capable of assimilating [13C]acetate while Bradyrhizobium spp. were not able to fix CO2, although a metagenomics survey of culture KS recently revealed that Gallionellaceae sp. lacks genes for acetate uptake and that the Bradyrhizobium sp. carries the genetic potential to fix CO2. The study furthermore extends our understanding of the microbial reactions that interlink the nitrogen and Fe cycles in the environment.
IMPORTANCE Microbial mechanisms by which Fe(II) is oxidized with nitrate as the terminal electron acceptor are generally referred to as “nitrate-dependent Fe(II) oxidation” (NDFO). NDFO has been demonstrated in laboratory cultures (such as the one studied in this work) and in a variety of marine and freshwater sediments. Recently, the importance of NDFO for the transport of sediment-derived Fe in aquatic ecosystems has been emphasized in a series of studies discussing the impact of NDFO for sedimentary nutrient cycling and redox dynamics in marine and freshwater environments. In this article, we report results from an isotope labeling study performed with the autotrophic, nitrate-reducing, Fe(II)-oxidizing enrichment culture KS, which was first described by Straub et al. (1) about 20 years ago. Our current study builds on the recently published metagenome of culture KS (2).
KEYWORDS: neutrophilic, chemolithoautotrophic ferrous iron [Fe(II)] oxidation, nitrate-dependent Fe(II) oxidation (NDFO), Gallionellaceae, fluorescence in situ hybridization (FISH), nanoscale secondary-ion mass spectrometry (NanoSIMS), Bradyrhizobium
INTRODUCTION
Iron (Fe) is an essential element of life and involved in many microbiological and geochemical processes. Certain microorganisms can oxidize ferrous iron [Fe(II)] and reduce ferric iron [Fe(III)] and thus impact the biogeochemical redox cycling of Fe on Earth (3–5). Chemolithotrophic Fe(II)-oxidizing bacteria can use dissolved Fe(II) and solid Fe(II)/Fe(III) minerals as electron donors under both oxic and anoxic conditions. Microorganisms that can use Fe(II) as an electron donor can generally be grouped in two major classes, i.e., acidophilic and neutrophilic Fe(II) oxidizers (5, 6). The neutrophilic Fe(II) oxidizers can further be distinguished into microaerophilic, anoxygenic phototrophic, and anaerobic nitrate-reducing Fe(II) oxidizers (3, 4). In anoxic marine and freshwater environments, the coupling of nitrate (NO3−) reduction to the oxidation of Fe(II) by nitrate-reducing Fe(II)-oxidizing (NRFO) bacteria has been shown to be an important chemolithotrophic microbial energy metabolism, contributing to Fe redox cycling at circumneutral pH (7–10). The first autotrophic NRFO culture was enriched from freshwater sediment by Straub et al. (1). While most other NRFO cultures described so far require an organic cosubstrate, the enrichment culture from Straub et al. (1) (also referred to as culture KS in the literature) has maintained the ability for continuous Fe(II) oxidation and growth under autotrophic conditions for more than 20 years.
Conventional full-length 16S rRNA gene clone libraries and metagenomic sequence analyses have shown that culture KS is dominated by an Fe(II)-oxidizing bacterium belonging to the family Gallionellaceae (referred to here as Gallionellaceae sp.) closely related to the known microaerophilic Fe(II) oxidizers Sideroxydans lithotrophicus ES-1 and Gallionella capsiferriformans ES-2 (2, 11). A recent metagenome analysis of culture KS grown autotrophically with Fe(II) and nitrate revealed that Gallionellaceae sp. accounts for ∼96% of the total community, while the rest of the community consists of Bradyrhizobium sp. (1%), Rhodanobacter sp. (1%), Nocardioides sp. (<1%), Polaromonas sp. (<1%), and Thiobacillus sp. (<1%) (2).
Under autotrophic conditions, culture KS oxidizes dissolved Fe(II) while reducing nitrate completely to nitrogen gas (N2) (1). Attempts to isolate the Fe(II)-oxidizing Gallionellaceae sp. in pure culture have so far not been successful. Although the Gallionellaceae sp. in culture KS is closely related to the microaerophilic Fe(II)-oxidizing strains ES-1 and ES-2, contradictory results have been reported for similar growth experiments performed under microaerophilic conditions in Fe(II)-containing gradient tubes: Blöthe and Roden (11) observed no growth, while we were able to show growth of culture KS under microaerophilic conditions, as reported in the companion article (12). This suggests that Fe(II) oxidation and growth of the culture KS Gallionellaceae sp. depend on interactions with its flanking community members. Culture KS is not the first example of a community in which a dominant Fe(II) oxidizer partners with a heterotrophic strain. This was reported for several other mixed cultures of acidophilic Fe(II) oxidizers and phototrophic Fe(II) oxidizers (13–15). Interestingly, isolation and cultivation of the heterotrophic strains of these cultures were successful, whereas the Fe(II) oxidizer did not grow without the heterotrophs. Similar to culture KS, the survival of the Fe(II) oxidizers seemed to be dependent on the heterotrophic community members. Additionally, the growth of the autotrophic Fe(II) oxidizer seemed to be the only mechanism to guarantee the survival of the heterotrophic flanking community without an added organic carbon source. One example of a mixed culture of an Fe(II) oxidizer and a heterotroph is the coculture of the anaerobic phototrophic green sulfur bacterium Chlorobium ferrooxidans and the chemoheterotroph Geospirillum sp. (15). The Fe(II) oxidizer might depend on the presence of the heterotroph either for the removal of inhibitory metabolic end products or for the allocation of essential nutrients. Additionally, the isolation of acidophilic Fe(II) oxidizers often revealed heterotrophic bacteria in close association with the autotrophs. These heterotrophs were able to survive without the addition of an external organic carbon source (16–18). The interactions between such a coculture were demonstrated by Kermer et al. (19) for the autotrophic Fe(II) oxidizer Acidithiobacillus ferrooxydans and the heterotroph Acidiphilium cryptum using protein-based stable-isotope probing. The heterotroph oxidized [13C]galactose and produced [13C]CO2, which was fixed by A. ferrooxydans. But in addition, A. ferrooxydans produced and secreted 13C-labeled organic metabolites, which were assimilated by A. cryptum (19).
In a recent metagenome study, He et al. (2) obtained draft genome sequences of the culture KS Fe(II) oxidizer and flanking community members. The study confirmed that the Gallionellaceae sp. in culture KS is the Fe(II) oxidizer by identifying homologs of the MtoAB complex in its genome. The MtoAB complex is a porin-multiheme cytochrome c system that has previously been identified in ES-1 and ES-2 (20). In the draft genomes of the flanking community members, no genes for extracellular electron transfer pathways for Fe(II) oxidation have been identified, leading the authors to the conclusion that the flanking populations in culture KS might not be capable of autotrophic nitrate-dependent Fe(II) oxidation (2). Interestingly, most of the flanking community members carry genes for complete nitrate reduction. The genome of the Gallionellaceae sp. encodes the nitrate reductase complex (Nar) and both nitrite reductase systems (NirK/S) but lacks a nitric oxide and nitrous oxide reductase gene (2). Therefore, the Gallionellaceae sp. might be dependent on the flanking community for complete denitrification and the detoxification of its incomplete denitrification product nitric oxide (NO). However, in order to carry out complete denitrification, the heterotrophic flanking community requires an electron donor. It has been suggested that the Gallionellaceae sp. could provide a source of fixed carbon to the flanking heterotrophic community (2). The Gallionellaceae sp. carries the genetic potential for CO2 fixation because its genome contains form II RubisCO and all other genes of the reductive pentose phosphate pathway (2). The ability to incorporate CO2 into biomass under autotrophic conditions was already shown earlier for Gallionella ferruginea (21). But also in the genomes of some flanking community members (Bradyrhizobium sp. and Rhodanobacter sp.) IC-type RubisCO genes have been identified (2). However, whether the flanking community members do fix CO2 in culture KS or if the Gallionellaceae sp. provides them with fixed carbon for denitrification is currently unknown.
In this study, we report results from growth experiments of culture KS with Fe(II) and bicarbonate under autotrophic conditions and under heterotrophic conditions with acetate as the sole carbon source to verify carbon assimilation and potential carbon interspecies interdependencies in culture KS that have been previously derived from in silico analysis of the KS metagenome. Using catalyzed amplification reporter deposition fluorescence in situ hybridization (CARD-FISH), we quantified the growth of individual community members during autotrophic growth with 13C-labeled bicarbonate and heterotrophic growth with [13C]acetate. [15N]ammonium was used under the two growth conditions as an indicator for general cell activity. Secondary ion mass spectrometry at the nanoscale (NanoSIMS) enabled us to quantify carbon assimilation by single cells of CARD-FISH-identified populations in the enrichment culture KS during exponential growth and at the stationary phase.
RESULTS
Community composition.
Classification of the 454 pyrosequencing data revealed that culture KS was dominated by only a few operational taxonomic units (OTUs) under both growth conditions (Table 1). Under autotrophic conditions with Fe(II) as the electron donor, the culture is dominated by mainly one OTU (99% relative sequence abundance). The OTU has 94.2% 16S rRNA gene sequence similarity to the lithoautotrophic, microaerophilic Fe(II)-oxidizing Betaproteobacteria member Gallionella ferruginea. A second Gallionella sp. OTU with only 0.4% relative sequence abundance had 93.4% sequence similarity to Gallionella ferruginea. However, using the 16S rRNA gene sequence information obtained in this study and the entire genome of the respective OTU from a recent metagenomic study (2), it was not possible to unambiguously determine whether the OTU belongs to either Sideroxydans or Gallionella or might represent a novel genus within the Gallionellaceae (2). More sequence information might help to resolve the phylogeny of the dominant OTU in culture KS under autotrophic conditions. In this paper, we therefore refer to this OTU as Gallionellaceae sp. as previously suggested by He et al. (2) based on analysis of the KS metagenome. Other OTUs found in culture KS under autotrophic conditions had 100% 16S rRNA gene sequence similarity to Bradyrhizobium japonicum (0.1% relative sequence abundance), 100% and 94.2% sequence similarity to Rhodanobacter denitrificans and Rhodanobacter lindaniclasticus, respectively (0.1% and 0.2% relative sequence abundance), 99.6% sequence similarity to Ochrobactrum pseudogrignoense (0.1% relative sequence abundance), and 98.4% sequence similarity to Nocardioides pyridinolyticus (0.1% relative sequence abundance).
TABLE 1.
Community composition of culture KS under autotrophic and heterotrophic growth conditions as determined by 454 sequencing
| Phylum | OTUa | Closest cultivated relative (accession no.) | 16S rRNA gene similarity to closest relative (%) | Total no. of 16S rRNA gene sequence reads and relative abundance (%) under conditions of: |
|
|---|---|---|---|---|---|
| Autotrophic growth (Fe(II) + NO3−) | Heterotrophic growth (acetate + NO3−) | ||||
| Betaproteobacteria | 1 | Gallionella ferruginea (L07897) | 93.4 | 50 (0.4) | 412 (12.4) |
| 2 | Gallionella ferruginea (L07897) | 94.2 | 12,597 (99.0) | ||
| Alphaproteobacteria | 3 | Bradyrhizobium japonicum (AB510002) | 100.0 | 13 (0.1) | 2,683 (81.0) |
| Gammaproteobacteria | 4 | Rhodanobacter denitrificans (FJ851443) | 100.0 | 12 (0.1) | 62 (1.8) |
| 5 | Rhodanobacter lindaniclasticus (AB244763) | 94.2 | 30 (0.2) | ||
| Firmicutes | 6 | Ochrobactrum pseudogrignoense (JX660688) | 99.6 | 12 (0.1) | |
| Actinobacteria | 7 | Nocardioides pyridinolyticus (U61298) | 98.4 | 9 (0.1) | |
| 8 | Nocardioides pyridinolyticus (U61298) | 98.4 | 156 (4.7) | ||
| Total | 12,723 | 3,313 | |||
Operational taxonomic unit clustering based on a 97% sequence similarity cutoff. Only OTUs with more than two reads are shown.
Under heterotrophic growth conditions with acetate as the electron donor, culture KS was dominated by an OTU with 100% 16S rRNA gene sequence similarity to Bradyrhizobium japonicum (81.0% relative sequence abundance). The relative sequence abundance of 16S rRNA gene sequences related to Gallionella ferruginea dropped from 99.0% to 12.4% under heterotrophic growth conditions. Interestingly, only the OTU with 93.4% sequence similarity to Gallionella ferruginea was detected under heterotrophic conditions and not the Gallionellaceae sp. OTU with 94.2% sequence similarity to Gallionella ferruginea that dominated culture KS under autotrophic conditions. However, the 16S rRNA gene sequence data alone do not provide sufficient evidence to prove the existence of two Gallionellaceae sp. strains in culture KS, considering the relative short length of the pyrosequencing reads, although we also cannot completely rule out this possibility based on the 16S rRNA data alone. In any case, the phylogenetic analysis of the essential single-copy gene data of the KS metagenome did not suggest that multiple Gallionellaceae sp. strains are present in culture KS (2). Other OTUs found under heterotrophic growth conditions were classified as Rhodanobacter denitrificans (1.8% relative sequence abundance) and Nocardioides pyridinolyticus (4.7% relative sequence abundance). An OTU affiliated to Ochrobactrum sp. was not detected under heterotrophic growth conditions (Table 1).
Our results show that culture KS contains two numerically dominating OTUs, Gallionellaceae sp. and Bradyrhizobium sp., which change in relative sequence abundance when culture KS is grown under autotrophic or heterotrophic conditions. Therefore, we decided to focus our attention in this study on these two OTUs by quantifying their population dynamics and distribution of cells by CARD-FISH.
Establishment of specific CARD-FISH probes for community composition analysis.
Hybridization conditions for the newly developed horseradish peroxidase (HRP)-labeled FISH probes KS-Gal466 and KS-Brady1249 were optimized using reference strains with 1.7 and 1.1 weighted mismatches at the respective probe-specific target site on the 16S rRNA, respectively. The highest fluorescence signals and best mismatch discrimination were obtained with 35% formamide for both probes. Probe KS-Gal466 was used together with helper oligonucleotides in order to increase fluorescence signal intensities. FISH and DAPI (4′,6-diamidino-2-phenylindole) images for the two probes are shown in Fig. 1. Like other Sideroxydans or Gallionella cells, Gallionellaceae sp. cells in culture KS were non-stalk-forming short rods, about 1 to 2 μm long and 0.5 μm thick (Fig. 1C). The Bradyrhizobium species cells were rods 1 to 10 μm long and 0.5 to 1 μm thick (Fig. 1F). While Gallionellaceae sp. cells had a very homogenous cell size independent of growth phase and growth condition, the morphology of the Bradyrhizobium species cells was rather diverse, with shorter and longer cells present at each growth phase. Generally, Bradyrhizobium species cells were longer and thicker under heterotrophic growth conditions than under autotrophic growth conditions (data not shown).
FIG 1.
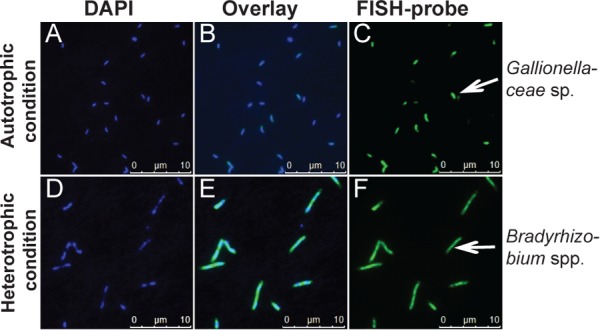
Fluorescence microscopy images of culture KS grown under autotrophic [10 mM Fe(II) and 4 mM nitrate] (A to C) and heterotrophic (5 mM acetate and 4 mM nitrate) (D to F) conditions. Total cell numbers were stained with DAPI (A, D). Gallionellaceae sp. (B and C) and Bradyrhizobium spp. (E and F) cells (green) were stained with the specific CARD-FISH probes KS-Gal466 and KS-Brady1249, respectively. The overlays of DAPI and the specific probes are shown (B and E). Bars, 10 μm.
Nitrate, Fe, and acetate concentrations during autotrophic and heterotrophic growth of culture KS.
Culture KS was cultivated under autotrophic [Fe(II) and nitrate] and heterotrophic (acetate and nitrate) growth conditions. Because of slightly different lag phases among triplicate cultures, only one representative data set is shown in Fig. 2. The data of the other replicate cultures followed the same trend and are provided in Fig. S1 in the supplemental material. Our discussion of the data is based on observations and general trends consistent among all three replicates. In agreement with previously published data on culture KS, no transformation of nitrate and/or Fe(II) was observed in abiotic control experiments (data not shown) (1).
FIG 2.

Substrate consumptions (A, B) and cell growth (C, D) of culture KS during cultivation under autotrophic (left) and heterotrophic (right) conditions. Relative cell abundances for the culture KS strains Gallionellaceae sp. and Bradyrhizobium spp. are shown (E, F). One set of data from experiments performed in duplicates is shown. The corresponding data for the second culture are provided in Fig. S1 in the supplemental material.
Under autotrophic growth conditions, culture KS started Fe(II) oxidation and nitrate reduction after an initial lag phase of 23 h (Fig. 2A). Thereafter, Fe(II) concentrations rapidly dropped from 10.8 mM to 2.9 mM within 95 h. Simultaneously, nitrate concentrations decreased from 4.2 mM to 2.5 mM. After 100 h, Fe(II) and nitrate concentrations remained constant until the end of incubation. Nitrite formation was not observed in any of the triplicate cultures during incubation. At the end of the experiment, culture KS oxidized 7.3 to 8.7 mM Fe(II) (81 to 86%) and reduced 2.1 to 2.7 mM nitrate (38 to 50%) under autotrophic conditions (ranges for triplicates), leading to ratios of Fe(II)oxidized/nitratereduced of 3.2 to 4.7. The consumption rates were 2.7 to 4.0 mM Fe(II) day−1 and 1.0 to 1.3 nitrate day−1 (Table 2).
TABLE 2.
Substrate consumption rates and doubling times of Gallionellaceae sp. and Bradyrhizobium spp. in the enrichment culture KS under autotrophic and heterotrophic growth conditionsa
| Consumption rate or doubling time | Autotrophic conditions | Heterotrophic conditions |
|---|---|---|
| Oxidation or reduction (mM day−1) | ||
| Fe(II) oxidation | 2.7–4.0 (3.3 ± 0.7) | NA |
| Acetate oxidation | NA | 1.4–1.6 (1.5 ± 0.1) |
| Nitrate reduction | 1.0–1.3 (1.1 ± 0.2) | 1.7–1.9 (1.8 ± 0.1) |
| Doubling time (days) | ||
| Gallionellaceae sp. | 6.5–12.4 (9.4 ± 2.9) | 11.9–17.6 (14.7 ± 2.9) |
| Bradyrhizobium spp. | 9.3–13.5 (11.4 ± 2.1) | 9.4–10.2 (9.8 ± 0.4) |
NA, not applicable. Values are ranges (means ± SD).
Under heterotrophic growth conditions, acetate oxidation and nitrate reduction started after an initial lag phase of 95 h (Fig. 2B). Following the lag phase, culture KS reduced 4 mM nitrate completely within 119 h. During the same time, acetate concentrations declined from 5.0 mM to 1.1 mM. Nitrite accumulation was also not detected in any of the heterotrophic triplicate cultures. Under heterotrophic growth conditions, culture KS oxidized 3.8 to 4.6 mM acetate (74 to 85%) and reduced 4.1 to 4.2 mM nitrate (100%). The stoichiometry of acetateoxidized/nitratereduced was 0.9 to 1.1. The acetate oxidation rate was 1.4 to 1.6 mM day−1 and the nitrate reduction rate 1.7 to 1.9 mM day−1 (Table 2).
CARD-FISH cell counts during autotrophic and heterotrophic growth.
We used the newly designed FISH probes KS-Gal466 (for Gallionellaceae sp.) and KS-Brady1249 (for Bradyrhizobium spp.) to monitor changes in the microbial community composition during growth under autotrophic and heterotrophic conditions. Total cell counts were performed for duplicate cultures grown with the labeled substrates under the two growth conditions following DAPI staining and for FISH-stained populations after hybridization with the Gallionellaceae sp. and Bradyrhizobium spp. specific probes. Total cell numbers, FISH counts, and relative cell abundances under autotrophic and heterotrophic growth conditions are shown in Fig. 2C to F.
Under autotrophic growth conditions, DAPI-based cell numbers increased from 1 × 10⁵ cells ml−1 to 2 × 10⁷ cells ml−1 after 71 h before cell numbers decreased slightly to 6 × 10⁶ cells ml−1, with only minor variations until the end of incubation at 240 h (Fig. 2C). The slight decrease in cell number coincided with the decrease of Fe(II) oxidation and approximation of the final Fe(II) concentration of 2.9 mM (Fig. 2A). FISH counts with probe KS-Gal466 showed that the Gallionellaceae sp. cell numbers followed the same trend as the DAPI counts (Fig. 2C). Bradyrhizobium species cell numbers increased by 2 orders of magnitude from 6 × 10³ cells ml−1 to 8 × 10⁵ cells ml−1 after 71 h. Thereafter, Bradyrhizobium species cell numbers remained stable at 5 × 10⁵ cells ml−1 until the end of the incubation (Fig. 2C). Under autotrophic growth conditions with Fe(II) as the electron donor and nitrate as the electron acceptor, Gallionellaceae sp. reached relative abundances of 73% to 98% throughout the experiment (Fig. 2E). The relative abundance of Bradyrhizobium species cells varied from 3% to 20% during the experiment (Fig. 2E).
Under heterotrophic growth conditions, DAPI cell numbers increased constantly from initially 1 × 10⁵ cells ml−1 to 1 × 10⁸ cells ml−1 after about 214 h of incubation (Fig. 2D). Total cell numbers remained constant even after nitrate had been completely reduced (Fig. 2B). Gallionellaceae sp. increased by 2 orders of magnitude from 9 × 10⁴ cells ml−1 to 6 × 10⁶ cells ml−1, and Bradyrhizobium spp. increased by 4 orders of magnitude from 8 × 10³ cells ml−1 to 9 × 10⁷ cells ml−1 during the same period (Fig. 2D). Interestingly, cell numbers of both Gallionellaceae sp. and Bradyrhizobium spp. increased before changes in acetate and nitrate concentrations were detected. In the beginning of the experiment, Gallionellaceae sp. had a relative cell abundance of 76% because cultures were inoculated from a preculture grown under autotrophic conditions. However, during incubation under heterotrophic conditions, the relative abundance of Gallionellaceae sp. decreased to below 10% while the relative abundance of Bradyrhizobium spp. increased from 9% to 93% (Fig. 2F).
Doubling times were calculated for the two taxa under autotrophic (47 to 71 h) and heterotrophic (37 to 87 h) growth conditions (Table 2). Gallionellaceae sp. doubling times were shorter under autotrophic growth conditions (7 to 12 h) than under heterotrophic growth conditions (12 to 18 h). Bradyrhizobium species cells doubled in numbers every 9 to 14 h under autotrophic conditions and every 9 to 10 h under heterotrophic conditions.
Quantification of carbon and nitrogen uptake by NanoSIMS.
Substrate incorporation was quantified under the two different growth conditions for single cells of Gallionellaceae sp. and Bradyrhizobium spp. for one culture incubated with 13C and 15N substrates by combining CARD-FISH cell identification with nanoscale imaging secondary ion mass spectrometry (NanoSIMS). Regions of interest (ROIs) for NanoSIMS analyses were identified based on the FISH probe-conferred fluorescence signals for probes KS-Gal466 and KS-Brady1249 using fluorescence microscopy (FM) and scanning electron microscopy (SEM) (see Fig. S2 in the supplemental material). For all identified ROIs, the secondary ions 12C−, 13C−, 19F−, 12C14N− (referred to here as 14N), 12C15N− (referred to here as 15N), and 56Fe16O− were quantified. Examples of NanoSIMS mass images and CARD-FISH images are shown in Fig. 3. We detected some unspecific, non-cell-associated 19F− signals in some of the NanoSIMS measurements, especially in the samples with high Fe(III) oxyhydroxide mineral contents. Therefore, cell identification and differentiation were based on corresponding FISH and DAPI fluorescence signals (Fig. 3M to P).
FIG 3.

NanoSIMS 12C14N− images of culture KS (A to D), the 13C/12C ratio (E to H), and the 15N/14N ratio (I to L) of Gallionellaceae sp. (A and C, E and G, I and K) and Bradyrhizobium spp. (B and D, F and H, J and L) grown under autotrophic (left two sets of panels) and heterotrophic (right two sets panels) growth conditions. Samples were taken after 183 h (autotrophic conditions) or 239 h (heterotrophic conditions). Cell identification was based on CARD-FISH-conferred probe signal for probes KS-Gal466 (M, O) and KS-Brady1249 (N, P). The red circles in panels C, G, K, and O indicate one cell of Gallionellaceae sp. next to several Bradyrhizobium species cells. Bars, 3 μm (A to L) or 25 μm (M to P). The right axis shows counts/pixel in panels A to D and ratios in panels E to L.
Under heterotrophic growth conditions with acetate and nitrate, only small amounts of Fe were detected (see Fig. S3B in the supplemental material), which probably originated from the preculture that was cultivated under autotrophic conditions with Fe(II) as the electron donor. At higher cell densities, some aggregates of Bradyrhizobium species cells were observed; however, Gallionellaceae sp. cells were always separate from Bradyrhizobium species cells.
The natural abundance ratios of 13C/12C and 15N/14N were calculated for unlabeled cultures (an autotrophic culture for Gallionellaceae sp. and a heterotrophic culture for Bradyrhizobium spp.) on identified cells (see Fig. S4 in the supplemental material). The assimilation of 13C and 15N by individual cells of both populations was quantified for samples collected during the exponential growth phase of “active” Fe(II) and acetate oxidation (after 47 h and 183 h, respectively) and in the stationary growth phase after oxidation of Fe(II) and acetate had ceased (after 183 h and 239 h, respectively) (Table 3).
TABLE 3.
Enrichment of 13C and 15N in Gallionellaceae sp. and Bradyrhizobium spp. of culture KS grown under autotrophic and heterotrophic conditions (one replicate incubated with the labeled substrates), measured by NanoSIMS
| Growth condition and community member | Growth phase (size of cell in μm) | No. of cells | APEa range (mean ± SD) |
|
|---|---|---|---|---|
| 13C | 15N | |||
| Natural enrichment | ||||
| Gallionellaceae sp. | Stationary | 19 | 0.88–1.27 (1.04 ± 0.10) | 0.25–0.43 (0.32 ± 0.04) |
| Bradyrhizobium spp. | Stationary (≤1.8) | 8 | 0.93–1.05 (0.98 ± 0.04) | 0.30–0.37 (0.33 ± 0.04) |
| Stationary (>1.8) | 8 | 0.93–1.07 (0.98 ± 0.05) | 0.24–0.37 (0.3 ± 0.04) | |
| Stationary (all sizes) | 16 | 0.93–1.07 (0.98 ± 0.04) | 0.24–0.37 (0.32 ± 0.04) | |
| Autotrophic growth | ||||
| Gallionellaceae sp. | Exponential | 10 | 0.94–2.38 (1.84 ± 0.68) | 0.21–2.78 (1.40 ± 0.74) |
| Stationary | 21 | 0.78–4.63 (2.35 ± 1.08) | 0.3–5.87 (2.47 ± 1.64) | |
| Bradyrhizobium spp. | Exponential (≤1.8) | 1 | 1.07 | 1.15 |
| Exponential (>1.8) | 3 | 0.94–0.96 (0.95 ± 0.01) | 0.25–0.29 (0.27 ± 0.02) | |
| Exponential (all sizes) | 4 | 0.94–1.07 (0.98 ± 0.06) | 0.25–1.15 (0.49 ± 0.44) | |
| Stationary (≤1.8) | 2 | 0.95–1.12 (0.96 ± 0.04) | 0.29–0.42 (0.65 ± 0.09) | |
| Stationary (>1.8) | 5 | 0.90–0.99 (0.96 ± 0.04) | 0.26–0.34 (0.29 ± 0.03) | |
| Stationary (all sizes) | 7 | 0.90–1.12 (0.98 ± 0.07) | 0.26–0.42 (0.31 ± 0.05) | |
| Heterotrophic growth | ||||
| Gallionellaceae sp. | Exponential | 7 | 3.66–5.40 (4.69 ± 0.68) | 5.16–6.88 (5.84 ± 0.69) |
| Stationary | 5 | 4.38–7.99 (6.45 ± 1.32) | 2.3–6.88 (5.36 ± 1.84) | |
| Bradyrhizobium spp. | Exponential (≤1.8) | 5 | 2.08–5.04 (4.02 ± 1.32) | 1.81–5.77 (3.95 ± 1.76) |
| Exponential (>1.8) | 5 | 0.91–4.87 (2.31 ± 1.94) | 0.21–3.67 (1.59 ± 1.84) | |
| Exponential (all sizes) | 10 | 0.91–5.04 (3.17 ± 1.80) | 0.21–5.77 (2.77 ± 2.11) | |
| Stationary (≤1.8) | 23 | 4.02–6.86 (5.24 ± 0.55) | 3.59–6.75 (5.24 ± 0.95) | |
| Stationary (>1.8) | 44 | 4.08–6.85 (5.74 ± 0.71) | 3.76–6.94 (5.24 ± 0.82) | |
| Stationary (all sizes) | 67 | 4.02–6.86 (5.57 ± 0.70) | 3.59–6.94 (5.24 ± 0.86) | |
APE, atomic percent enrichment.
The individual cell atom percent enrichment (APE) of Gallionellaceae sp. grown with the two labeled substrates ([13C]bicarbonate and [15N]ammonium, autotrophic conditions) increased from 0.88 to 1.27 APE 13C and 0.25 to 0.43 APE 15N (natural background, measured in control culture without labeled substrate after 183 h of incubation, n = 19) to 0.94 to 2.38 APE 13C and 0.21 to 2.78 APE 15N, respectively, during the exponential growth phase (after 47 h, n = 10), and further to 0.78 to 4.63 APE 13C and 0.3 to 5.87 APE 15N in the stationary growth phase (after 183 h, n = 21) (Fig. 3E and I and Table 3; see also Fig. S5 in the supplemental material). The measured natural enrichments of Gallionellaceae sp. coincide with previously published values for 13C (0.96 to 1.16% APE; mean, 1.06% APE) and 15N (0.34 to 0.42% APE; mean, 0.38% APE) (22). The enrichment of Gallionellaceae sp. in 13C and 15N measured in the exponential and stationary growth phases was significantly different from the natural enrichment (t test results for 13C, P = 2.40 × 10⁻³ and P = 9.97 × 10⁻⁶; for 15N, P = 6.21 × 10⁻⁴ and P = 8.92 × 10⁻³, respectively). Bradyrhizobium species cells (n = 4 in the exponential growth phase, and n = 7 in the stationary growth phase) did not show any enrichment in labeled carbon or nitrogen [t test for exponential growth phase, P = 0.46 (13C) and P = 0.81 (15N); for stationary growth phase, P = 0.47 (13C) and P = 0.41 (15N)] under autotrophic conditions (Fig. 3F and J and Table 3; Fig. S5).
The natural background enrichment in 13C and 15N for Bradyrhizobium spp. (n = 16) under heterotrophic conditions without addition of labeled substrates was 0.93 to 1.07 APE 13C and 0.24 to 0.37 APE 15N, respectively (after 239 h) (Fig. S4 and Table 3). During growth with [13C2]acetate as the electron donor and [15N]ammonium, the APE of Bradyrhizobium spp. increased differently in small cells, i.e., ≤1.8 μm (2.08 to 5.04 13C and 1.81 to 5.77 15N), and in large cells, i.e., >1.8 μm (0.91 to 4.87 13C and 0.21 to 3.67 15N), during the exponential growth phase (after 183 h, n = 10). Thereafter, the APE of Bradyrhizobium species cells of all sizes further increased to 4.02 to 6.86 for 13C and 3.59 to 6.94 for 15N in the stationary phase (239 h, n = 67) (Fig. 3H and L and 4; Table 3; see also Fig. S6 in the supplemental material). In the stationary phase, only minor deviations in isotopic enrichment between cells of different sizes were observed. The enrichments of carbon and nitrogen in all Bradyrhizobium species cells were significant different from the natural enrichments (t test for the exponential growth phase, P = 2.00 × 10⁻³ for 13C, and P = 2.52 × 10⁻³ for 15N; for the stationary growth phase, P = 1.48 × 10−54 for 13C and P = 4.46 × 10−53 for 15N) and between the exponential and stationary growth phases (t test, P = 1.21 × 10⁻³ for 13C, and P = 2.64 × 10⁻³ for 15N). Also, the Gallionellaceae sp. cells were enriched in 13C and 15N under heterotrophic growth conditions during incubation. After 183 h (exponential growth phase, n = 7), the enrichments of 13C and 15N were 3.66 to 5.40 APE and 5.16 to 6.88 APE, respectively, and increased even further to 4.38 to 7.99 APE 13C and 2.3 to 6.88 APE 15N after 239 h (stationary growth phase, n = 5) (Fig. 3G and K and 4; Table 3; Fig. S6). The natural 13C and 15N enrichment of Gallionellaceae sp. cells was significantly lower than the carbon and nitrogen isotopic enrichments quantified during exponential growth (t test, P = 3.76 × 10⁻⁶ and P = 3.64 × 10⁻⁷, respectively) and in the stationary growth phase (t test, P = 3.89 × 10⁻⁴ and P = 1.78 × 10⁻³, respectively). The 13C and 15N enrichment of Gallionellaceae sp. cells under heterotrophic growth conditions was higher than the enrichment quantified for Bradyrhizobium species cells and also higher than the enrichment of Gallionellaceae sp. cells under autotrophic conditions.
FIG 4.
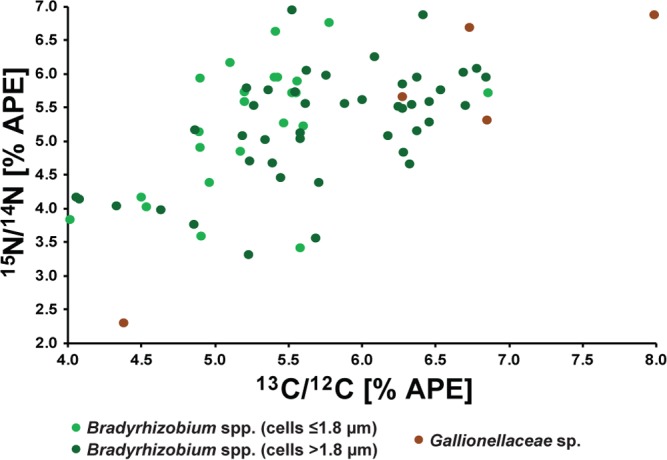
Enrichments of 13C and 15N in Gallionellaceae sp. cells (brown) and Bradyrhizobium species cells (green) in the stationary growth phase of culture KS under heterotrophic conditions (acetate and nitrate). The corresponding growth curve is shown in Fig. 1B, D, and F. The sample was taken at 239 h.
DISCUSSION
Microbial community composition.
Culture KS is an autotrophic, nitrate-reducing Fe(II)-oxidizing culture that was enriched more than 20 years ago. The microbial community of culture KS is comprised of an autotrophic Fe(II) oxidizer belonging to the Gallionellaceae and several heterotrophic strains (1, 2, 11). However, even with comprehensive 16S rRNA gene sequence information and unique single-copy gene information from a metagenomic study, it has so far not been possible to unambiguously determine whether the Gallionellaceae member in culture KS belongs to the genus Sideroxydans or Gallionella or whether it represents a novel genus within the Gallionellaceae (2). Also, the interesting finding of our 16S rRNA gene survey, which revealed the presence of two Gallionellaceae sp. OTUs with either 93.4% or 94.2% sequence similarity to Gallionella ferruginea, will require more-in-depth sequence data to decisively determine if culture KS might contain two Gallionellaceae sp. strains.
Interestingly, whereas the Fe(II) oxidizer has remained in the culture, the heterotrophic flanking community has changed during cultivation in different labs over the last 20 years. Blöthe and Roden (11) used a conventional 16S rRNA gene clone library approach and found a different community composition of culture KS (“Madison culture”) (62 to 72% Gallionellaceae, 14 to 21% Comamonas badia, Rhodanobacter, Parvibaculum) from the one previously described for the original culture at that time, 13 years ago (when the strains Rhodoferax fermentans and Rubivivax gelatinosus had been isolated [1, 23]). However, they also demonstrated that the KS community was stable during three consecutive years of their investigations. Surprisingly, when the same culture was investigated by He et al. (2) 7 years later by sequencing an Illumina shotgun library on MiSeq and HiSeq platforms, the authors found other heterotrophic community members (e.g., Rhizobium/Agrobacterium, Bradyrhizobium, Nocardioides), showing that in particular the heterotrophic microbial community had undergone compositional change. Also, in another independently proliferated culture KS (“Tuebingen culture”), other heterotrophs were found (Rhodanobacter, Ochrobactrum) using 454 pyrosequencing of 16S rRNA gene amplicons. The main heterotrophic community members found in the KS “Madison culture,” Rhizobium/Agrobacterium and Comamonadaceae, were absent in the KS “Tuebingen culture” (2). However, the Fe(II) oxidizer Gallionellaceae sp. dominated both the KS “Madison culture” and the KS “Tuebingen culture”, but with very different relative sequence abundances: 42% in the “Madison culture” and 99% in the “Tuebingen culture” (2). The reason for these variations between the two independently cultivated KS cultures is probably slightly different growth conditions (e.g., water quality, exact medium composition, number of transfers), but in particular the different inoculum volumes used during culture transfers, which were 10% (vol/vol) for the “Madison culture” and 1% (vol/vol) for the “Tuebingen culture.” With a 10% (vol/vol) inoculum, obviously more heterotrophic cells can be transferred, while a 1% (vol/vol) inoculum resulted in a higher enrichment of the Fe(II) oxidizer. In the present study, when we grew culture KS under autotrophic conditions with Fe(II) as the electron donor, we found the same heterotrophs as those described by He et al. (2) (Bradyrhizobium, Nocardioides, and Rhodanobacter). In addition, we determined the community composition of culture KS grown heterotrophically with acetate as the electron donor and observed a significant shift in the relative 16S rRNA gene sequence abundance of different members of the community of culture KS. When grown with acetate and nitrate, culture KS was dominated by Bradyrhizobium sp. Interestingly, the other heterotrophs did not become more abundant than the Gallionellaceae sp. after just one transfer on medium with acetate and no Fe(II). Under both growth conditions [autotrophic with Fe(II) and heterotrophic with acetate], Gallionellaceae sp. and Bradyrhizobium sp. always accounted for >93% of all cells in culture KS. Therefore, we decided to focus only on these two taxa by following their shifts in relative abundance under autotrophic and heterotrophic growth conditions using CARD-FISH in order to get insights into their metabolic response and possible interactions under the two growth conditions.
Substrate turnover and electron balances during autotrophic and heterotrophic growth.
Under autotrophic growth conditions with Fe(II) as the electron donor and nitrate as the electron acceptor, the two substrates were consumed simultaneously, indicating that these two processes were coupled. After Fe(II) oxidation stopped, nitrate also was not further reduced. Overall, culture KS oxidized up to 86% of the Fe(II) provided, which is in agreement with previous published data for culture KS (1, 11, 12). The ratios of nitratereduced/Fe(II)oxidized were 0.24 to 0.36, that is, in the same range as previously reported ratios for culture KS (0.21 to 0.24) (12) as well as a ratio reported for another freshwater nitrate-reducing Fe(II)-oxidizing enrichment culture (0.23) (24). Also, the Fe(II) oxidation rates of culture KS (3.3 ± 0.7 mM day−1) were in the same range as the rates reported previously for culture KS (2.0 ± 0.0 mM day−1) (12) and the mixotrophic NRFO Acidovorax sp. BoFeN1 (up to 3.4 mM day−1) (25). The incomplete consumption of Fe(II) and nitrate could be due to the fact that during medium preparation a fraction of the dissolved Fe(II) precipitated with phosphate (0.6 g liter−1) to form vivianite Fe3(PO4)2·8H2O (26). Culture KS is not able to oxidize vivianite with nitrate as the electron acceptor (12). The incomplete substrate consumption was also reflected in the electron balances for the respiration of Fe(II) under autotrophic conditions. Fe(II) oxidation provides 1 mM electrons for each mM Fe(II) oxidized. This means that when culture KS oxidized 8 mM Fe(II), an equal amount of electrons could have been transferred to nitrate (when we ignore the electrons required for CO2 fixation). Complete reduction of nitrate to N2 requires 5 electrons, resulting in a stoichiometry of 5 mM oxidized Fe(II) per 1 mM reduced nitrate, leading to a ratio of nitratereduced/Fe(II)oxidized of 0.2 (or even lower if we consider that electrons are also needed for CO2 fixation). In our experiments, we observed the reduction of 2 mM nitrate while 8 mM Fe(II) was oxidized (ratio, 0.25). Possible explanations for this imbalance (i.e., nitrate consumption higher than expected) might be the incomplete reduction of nitrate to either NO or N2O and not to N2. According to the KS metagenome, Gallionellaceae sp. is capable of reducing nitrate to NO only because genes for a nitric oxide reductase and nitrous oxide reductase have not been found in the Gallionellaceae sp. genome (2). However, Bradyrhizobium sp. and the other heterotrophic strains of the flanking community in culture KS carry all genes necessary for complete denitrification. They might have been able to reduce nitrate with electrons from intracellular storage compounds, from the oxidation of biomass from dead cells, or from excreted metabolites from the autotrophic Gallionellaceae sp. However, many denitrifiers reduce nitrate incompletely and release N2O (27). Unfortunately, we did not quantify N2O in the headspace of the cultures. On the other hand, if we assume that Gallionellaceae sp. is the primary nitrate reducer under autotrophic conditions, incomplete nitrate reduction to NO requires only 3 mM electrons from Fe(II) oxidation. Under these conditions, culture KS would have oxidized more Fe(II) than it reduced nitrate. This could potentially be explained when we assume that (i) the heterotrophic community can oxidize Fe(II) to some extent with nitrate as an electron acceptor, as it has been previously reported for other Bradyrhizobium and Nocardioides strains (28, 29), (ii) Fe(II) is to some extent chemically oxidized by the nitrate reduction intermediates nitrite and nitric oxide (25, 30–34) (nitrite is highly reactive and could have been further reduced to NO before we were able to quantify it), or, most likely, (iii) some electrons from Fe(II) are required for reverse electron transport to produce reduction equivalents, such as NAD(P)H, to fix CO2 and were not used to reduce nitrate (2, 5).
Under heterotrophic growth conditions with acetate as the sole electron donor and nitrate as the electron acceptor, the two substrates were consumed simultaneously. When the culture reached the stationary phase, it had consumed on average equal amounts of acetate and nitrate (about 4 mM each). Acetate oxidation was incomplete because nitrate availability was limiting. Microorganisms can gain 8 electrons from acetate if they oxidize acetate completely to CO2. Assuming that nitrate is reduced completely to N2, the reduction of 4 mM nitrate requires 20 mM electrons. Since the reduction of 4 mM acetate to CO2 provides 32 mM electrons (8 mM electrons per 1 mM acetate), not all electrons from acetate oxidation could be accounted for by nitrate reduction. However, some of the acetate is also needed for synthesis of new biomass and cell growth. The ratio of how much acetate is used for biomass synthesis versus energy metabolism varies strongly among species and growth conditions. Based on our electron balance, 2.5 mM acetate (62.5%) could have been completely oxidized to CO2 while the remaining 1.5 mM (37.5%) was used for biomass synthesis. A previous study has shown that the phototrophic Fe(II) oxidizer Rhodopseudomonas palustris TIE-1 oxidized only 22% of its available acetate to CO2 while it used the remaining 78% for biomass production (35). However, photoheterotrophic microorganisms can assimilate more carbon because they gain their energy from light. Interestingly, total cell numbers of culture KS increased before changes in acetate and nitrate concentrations could be detected, which might have been due to the sensitivity of our acetate and nitrate quantification methods. Since the preculture was grown under autotrophic conditions with Fe(II) and nitrate, acclimation of culture KS to heterotrophic growth with acetate might be a further explanation for the extended lag phase, since cells will have to induce metabolic pathways for acetate consumption. However, when the mixotrophic NRFO Acidovorax sp. BoFeN1 or strain 2AN was cultivated with acetate and nitrate, acetate oxidation started immediately after inoculation, leading to a maximum acetate consumption rate of 2.5 mM day−1 or 4 mM day−1 (30), respectively. The acetate oxidation rates for culture KS were 1.5 ± 0.1 mM day−1, that is, considerably lower than those of the two Acidovorax strains.
Cell carbon assimilation under autotrophic conditions.
We observed a broad spectrum of individual cell activities with respect to incorporation of 13C- and 15N-labeled substrates (Fig. S5) causing relatively high standard deviations when average atom percent enrichment (APE) values were calculated for any specific number of Gallionellaceae sp. and Bradyrhizobium species cells. We therefore decided to report not the average values with standard deviations but rather the ranges of 13C and 15N enrichment from the lowest to the highest isotope enrichments observed. A high heterogeneity of individual single-cell activities with respect to carbon and nitrogen incorporation has also previously been observed in other NanoSIMS studies (36, 37).
Under autotrophic conditions, Gallionellaceae sp. reached cell numbers of 107 cells ml−1 and a relative cell abundance of 99% at the end of Fe(II) oxidation. The calculated doubling time (9.4 ± 2.9 h) under these conditions was in the same range as those reported for the related microaerophilic Fe(II) oxidizers Sideroxydans and Gallionella (8 to 16 h) (20, 38–40). The KS Gallionellaceae sp. has previously been identified as the chemolithoautotrophic Fe(II) oxidizer in the enrichment culture based on the presence of potential Fe oxidase genes of the MtoAB type and genes of the RubisCO form II enzyme in its genome (2). In the present study, we have demonstrated that the Gallionellaceae sp. in culture KS is capable of [13C]bicarbonate fixation during Fe(II) oxidation, confirming its chemolithoautotroph lifestyle (Fig. 5). Although it has been shown previously for specific Gallionella sp. isolates (e.g., Gallionella ferruginea [21]) that they can fix CO2 under autotrophic conditions, fixation of inorganic carbon had not previously been shown for the Gallionellaceae sp. in culture KS because the organism has not been isolated from the enrichment culture to date. With respect to CO2 fixation, the Gallionellaceae sp. in culture KS behaves as do many known microaerophilic Fe(II) oxidizers, such as Sideroxydans sp. ES-1 and Gallionella sp. ES-2 (20), Mariprofundus sp. PV-1 (41), Ferriphaselus (42), and many other Gallionellaceae isolates from different environments (43, 44), which carry RubisCO form II genes in their genomes.
FIG 5.
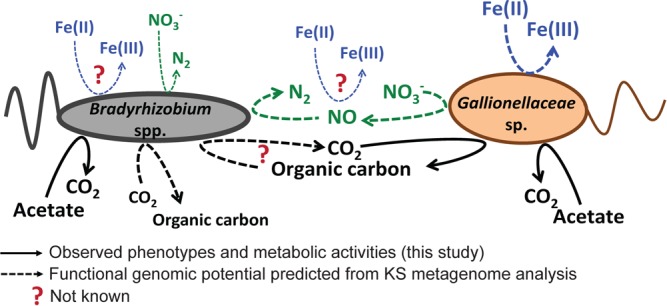
Growth and metabolic interactions of Bradyrhizobium spp. and Gallionellaceae sp. in culture KS grown under autotrophic conditions with Fe(II) as the electron donor and nitrate as the sole electron acceptor. Dashed lines indicate potential cell metabolisms and interactions as inferred from the KS metagenome (2). Solid lines represent actual cell phenotypes observed in the growth experiments and stable-isotope labeling experiments performed in this study.
One of our initial hypotheses was that under autotrophic conditions Gallionellaceae sp. provides fixed organic carbon to the heterotrophic flanking community members to sustain their growth and survival in the absence of externally added organic carbon (Fig. 5) (2, 11). Growth and survival of heterotrophs in an organic-free medium together with autotrophic Fe(II) oxidizers have been shown previously (13, 15). However, here we did not observe an enrichment in 13C in Bradyrhizobium species cells under autotrophic growth conditions despite an increase in cell numbers by about 2 orders of magnitude and the fact that the Bradyrhizobium species strain(s) in culture KS possesses a form IC RubisCO (2). For other Bradyrhizobium strains, autotrophic growth has been shown with H2 or thiosulfate as the electron donor or in the presence of low concentrations of oxygen (45–48). Although we did not observe any 13C enrichment in any Bradyrhizobium species cells under autotrophic growth conditions, we cannot completely rule out that Bradyrhizobium spp. might have incorporated fixed carbon from the Fe(II) oxidizer to some extent but that we were not able to quantify it with our NanoSIMS approach. The overall enrichment of Gallionellaceae sp. in 13C carbon was relatively low, and any cross-feeding would have further diluted the isotope signal. In addition, Bradyrhizobium species cells were much larger (up to 10 μm long) than the Gallionellaceae sp. cells (1 to 2 μm), which could have also contributed to a dilution of the 13C signal upon intercellular carbon transfer. Also, using the 15N signal as a marker for general activity to normalize the 13C enrichment values and further standardizing the 13C/15N ratio to cell size did not help to unequivocally determine if the Bradyrhizobium species cells fixed CO2 under autotrophic conditions, because the heterogeneity of individual cell activities resulted in high standard deviations of the calculated ratios, which made it difficult to determine a clear trend (refer to Table S1 in the supplemental material for these data). Any complete oxidation of labeled metabolites to [13C]CO2 by the heterotrophic community might have further reduced the remaining isotope label in the heterotrophic biomass. Also, the CARD-FISH protocol might have contributed to unspecific loss of isotope signal. As Musat et al. (49) have shown, an unspecific reduction of 13C and 15N signals is possible during each step of the CARD-FISH protocol, which might result in a decrease of the heavy-isotope signal compared to untreated samples of up to 50% following CARD-FISH.
As shown previously in a microscopy-based study, culture KS does also produce extracellular polymeric substances (EPS) during autotrophic growth in the presence of Fe(II) (26). It has been speculated before that the observed EPS might serve as a carbon source to sustain growth and survival of the heterotrophic flanking community under autotrophic conditions (Fig. 5). This hypothesis is also supported by the circumstance that the metagenomic survey of culture KS was not able to clarify if the heterotrophic flanking community is capable of using Fe(II) as an electron donor (Fig. 5). Known genes involved in Fe(II) oxidation were either completely missing or incomplete in the draft genomes of the heterotrophs in culture KS. However, other Bradyrhizobium strains seem to be capable of Fe(II) oxidation, as has previously been shown (28, 29). On the other hand, Bradyrhizobium spp. probably did not use EPS as a carbon source under autotrophic growth conditions in our experiments because cell numbers did not further increase after Fe(II) oxidation eased, although EPS as a carbon and electron source and nitrate as an electron acceptor were still available.
Cell carbon assimilation under heterotrophic conditions.
With acetate as an electron donor and nitrate as an electron acceptor, Bradyrhizobium spp. increased in cell numbers by 4 orders of magnitude and reached a relative abundance of up to 93%. In the presence of [13C]acetate, Bradyrhizobium species cells became enriched in 13C. This observation confirms previous results from genomic analyses that have found acetate uptake and metabolism pathways in the KS culture Bradyrhizobium sp. genome (Fig. 5) (2).
However, annotation of the metagenomic sequence data was not able to unambiguously clarify if the KS-type Gallionellaceae sp. can take up and metabolize acetate, because known acetate transporters and genes of the glyoxylate cycle have not been found or were incomplete (2). Despite these previous findings, we observed enrichment of 13C and 15N in Gallionellaceae sp. cells under heterotrophic growth conditions with acetate. 13C enrichment of Gallionellaceae sp. cells coincided with an increase in cell numbers from 9 × 10⁴ to 6 × 10⁶ cells ml−1 (Fig. 2D). The microaerophilic Fe(II) oxidizers Ferriphaselus (42, 50), Sideroxydans sp. R-1 (40), Sideroxydans sp. ES-1, and Gallionella sp. ES-2 (20) do not grow on acetate. Interestingly, the genomes of Sideroxydans sp. ES-1 and Gallionella sp. ES-2 (20) contain the same pathways for carbon metabolism as does the KS-type Gallionellaceae sp. However, both ES-1 and ES-2 contain additional acetate permeases that are absent on the KS-type Gallionellaceae sp. genome.
The observed 13C incorporation from acetate under heterotrophic conditions by Gallionellaceae sp. cells could be due to the fact that Gallionellaceae sp. fixed [13C]CO2 produced by Bradyrhizobium spp. during complete acetate oxidation. Interestingly, the average APEs in 13C and 15N of the Gallionellaceae sp. were higher under heterotrophic growth conditions than under autotrophic growth conditions and even higher than those calculated for Bradyrhizobium spp. under heterotrophic growth conditions. As described in the discussion of electron balance above, 2.5 mM acetate (which is equivalent to 0.9 mmol because of the two C atoms in acetate) was oxidized to CO2 under heterotrophic growth conditions. If we assume that equal amounts of [12C]acetate and [13C]acetate were oxidized to CO2, although only 10% of the provided acetate was labeled, only 0.09 mmol [13C]CO2 could have been formed. Given the fact that 0.4 mmol [13C]CO2 (from 2.2 mM labeled [13C]bicarbonate) under autotrophic conditions led to a lower overall 13C enrichment of Gallionellaceae sp. cells than the 13C enrichment that we quantified for Gallionellaceae sp. in the presence of [13C]acetate, we assume that the Gallionellaceae sp. in culture KS must have used the labeled acetate as the sole or as an additional carbon source in order to reach the observed high level of 13C enrichment (Fig. 5). Previous growth experiments with culture KS showed that Gallionellaceae sp. did grow and survive for several transfers under heterotrophic conditions with acetate as an electron donor (12), which supports our conclusion.
In the present study, we quantified the uptake of [15N]ammonium only as a general indicator for cellular activity and growth of the different KS community members under the two growth conditions. However, future studies exploring the use of [15N]nitrate or [15N]N2 as the sole nitrogen source and the resulting consequences for species interactions should be performed because only Bradyrhizobium spp. (and not Gallionellaceae sp.) possess the genes to convert nitrate/nitrite to ammonium and Gallionellaceae sp. depends on ammonium uptake as a nitrogen source. An interesting experiment could consist of incubating culture KS in an ammonium-free medium with [15N]nitrate to investigate if dissimilatory nitrate reduction to ammonium by Bradyrhizobium spp. can provide ammonium N to Gallionellaceae sp. Interestingly, no N2 fixation genes were found in the KS metagenome, although Bradyrhizobium spp. are known to be able to fix N2 (45, 51). However, culture KS has been cultivated in an ammonium-containing medium for the last 20 years, which might have resulted in the loss of N2 fixation capabilities in the community.
In conclusion, we have shown growth and CO2 fixation of the KS culture Gallionellaceae sp. during Fe(II) oxidation with nitrate as an electron acceptor. Our findings provide further evidence that the KS-type Gallionellaceae sp. is a chemolithoautotrophic Fe(II) oxidizer. In addition, the observed growth of Gallionellaceae sp. and Bradyrhizobium spp. under autotrophic and heterotrophic growth conditions suggests interactions between the two community members that might be the reason for the decade-long stability of the KS culture community partnership between a chemolithoautotrophic Fe(II) oxidizer and heterotrophic denitrifiers (Fig. 5). Unfortunately, we were not able to identify a carbon cross-feeding as the basis for this community stability with our experiments. Nonetheless, results from this study give further insights into the intricate interplay of different metabolic groups of organisms that sustain nitrate-dependent Fe(II) oxidation in culture KS (Fig. 5). In this study, we identified acetate assimilation of Gallionellaceae sp. under heterotrophic conditions, suggesting that the strain possesses the metabolic flexibility to adapt to different growth conditions by switching to alternative electron donors instead of Fe(II). We also provide evidence that the KS-type Bradyrhizobium spp. seem to be incapable to fix CO2 under the conditions tested in this study, although metagenomic sequence analysis found an IC-type RubisCO gene in the Bradyrhizobium spp. genome. Our results expand our knowledge on the physiological flexibility of culture KS and underline the importance of backing up the annotation and interpretation of metagenomic sequence data with physiological experiments and stable-isotope analyses to reveal metabolic capabilities and interactions in complex microbial communities.
MATERIALS AND METHODS
Sources of microorganisms, microbial growth medium, and growth conditions.
The enrichment culture KS was isolated from a freshwater sediment in Bremen (1) and has been cultivated in our laboratory for several years. Culture KS-Tueb (referred to here as culture KS) was cultivated in serum bottles (250-ml volume, 180 ml medium) in anoxic freshwater medium (pH 6.8 to 7.0), which was buffered with 22 mM bicarbonate and prepared anoxically with an N2-CO2 (90:10 [vol/vol]) headspace as described in detail by Hegler et al. (52). The experiments were performed in triplicates: one culture was incubated without labeled substrates to obtain a reference for natural enrichments of 13C and 15N (control), and duplicates were incubated with 13C and 15N substrates to analyze the activities of the two main community members of culture KS. For autotrophic growth conditions, 10 mM FeCl2 and 4 mM sodium nitrate (triplicates) as well as 2.2 mM [13C]sodium bicarbonate (98 atom % 13C from Aldrich, 8.9 atom % 13C in the medium) and 0.056 mM [15N]ammonium chloride (≥98 atom % 13C from Aldrich, 8.9 to 9.1 atom % in the medium) (duplicates) were added to the medium. For heterotrophic growth conditions, 4 mM sodium nitrate and 5 mM [12C2]acetate (control) or 4.5 mM [12C2]sodium acetate, 0.5 mM [13C2]sodium acetate (99 atom % 13C from Aldrich, 9.9 atom % 13C in the medium), 4 mM sodium nitrate, and 0.056 mM [15N]ammonium chloride (≥98 atom % 13C from Aldrich, 8.9 to 9.1 atom % in the medium) (duplicates) were added to the medium. All cultures were inoculated with 1% (vol/vol) of a preculture grown on 10 mM FeCl2 and 4 mM NaNO3 and incubated at 28°C in the dark until stationary phase was reached and Fe(II) oxidation had ceased (about 7 days). Fe(II), acetate, and nitrate concentrations were measured for the triplicates, cell counts were done on the duplicates (labeled substrate), and NanoSIMS measurements were performed on one culture incubated with the labeled substrates and the control culture (stationary phase only).
Analytical methods.
Fe(II) and Fe(III) were quantified with the revised ferrozine protocol for nitrite-containing samples described by Klueglein and Kappler (25) and Schaedler et al. (53). The ferrozine-Fe(II) complex was quantified at 562 nm using a microtiter plate reader (FlashScan 550; Analytik Jena, Germany). Ferrozine measurements were performed in triplicates. Acetate was quantified by high-performance liquid chromatography (HPLC; class VP with refractive index detector [RID 10A] and SPD-M10A VP photo-diode array detector; Shimadzu, Japan) and nitrate/nitrite using a continuous-flow analyzer with a dialysis membrane for Fe removal to prevent side reactions during analysis (Seal Analytical, Norderstedt, Germany). Additional information on the individual analytical methods is summarized in the companion paper (12). Fe, acetate, nitrate, and nitrite samples were measured from all three cultures.
Sequencing.
Biomass for DNA extraction was collected by filtering 10 ml of an autotrophically and heterotrophically grown culture KS through 0.2-μm-pore-size polyethersulfone (PES) membrane filters (Millipore). DNA was extracted from the PES membrane filters using the UltraClean Microbial DNA isolation kit (MoBIO Laboratories, Carlsbad, CA, USA). 16S rRNA genes were amplified using primers 27F (5′-AGAGTTTGATCMTGGCTCAG-3′) (54) and 534R (5′-ATTACCGCGGCTGCTGGC-3′) (55, 56) targeting the V1 to V3 region of the 16S rRNA gene. The primers 27F and 534R contained Roche's 454 pyrosequencing barcodes and adaptor A (27F) or B (534R). PCRs were performed with the FastStart High Fidelity PCR system (Roche, Mannheim, Germany). The obtained PCR products from three cultures and duplicate DNA extractions were pooled in equimolar amounts. The quality of the amplified DNA was confirmed on an Experion automated electrophoresis system (Bio-Rad, Hercules, CA, USA). Prior to sequencing, the PCR products were quantified using the Quant-iT PicoGreen double-stranded DNA (dsDNA) assay kit (Invitrogen, Eugene, OR, USA) and a QuantiFluor-ST fluorometer (Promega, Madison, WI, USA). 454 pyrosequencing was performed on a Roche GS Junior Sequencer (454 Life Sciences, Branford, CT, USA) according to the manufacturer's instructions for amplicon sequencing. Quality control, alignment, and classification of the sequencing data were performed using the software package mothur, version 1.33.3 (57). Pyrosequencing noise and chimeras were removed with the mothur-implemented algorithms PyroNoise (58) and Uchime (59) as described previously (60). Sequences shorter than 200 bp and sequences with homopolymers longer than 8 bp were removed from the data set. The remaining sequences were aligned against a seed alignment based on the Silva SSU Ref rRNA database (v.119) (61) and preclustered with the single-linkage algorithm, applying a threshold of 2% (62). A distance matrix was created, and sequences were assigned to operational taxonomic units (OTUs) on the species level at 3% genetic distance using the average neighbor algorithm (63). Sequences were classified using the Naive Bayesian Classifier (64) and the Silva reference taxonomy (v. 119). Because 16S rRNA gene copy numbers can vary in genomes of different organisms, we corrected the relative abundance of OTUs using exported OTU tables from mothur based on the lineage-specific gene copy number using the algorithm copyrighter (v. 0.46) (65).
CARD-FISH.
For CARD-FISH counts, samples were fixed with 1% paraformaldehyde (PFA) and incubated at 5°C for 12 to 16 h. Afterwards, the cells were centrifuged, washed twice with 1× phosphate-buffered saline (PBS), resuspended in 1:1 1× PBS-ethanol solution, and stored at −20°C. The cells were filtered onto Isopore polycarbonate membrane filter (GTTP, 0.2 μm; Millipore) and embedded in 0.2% low-melting-point agarose. Cells grown with Fe(II) were treated with an oxalate solution (28 g liter−1 ammonium oxalate and 15 g liter−1 oxalic acid) to dissolve the Fe minerals before filtration.
Two new CARD-FISH probes specific for Gallionellaceae sp. and Bradyrhizobium spp. were designed using the probe design and probe match tools of the ARB software package (66). Probes and helper oligonucleotides were designed to bind to specific regions on the 16S rRNA of Gallionellaceae sp. (KS-Gal466, 5′-CGTCATCCACACGATGTA-3′) and Bradyrhizobium spp. (KS-Brady1249, 5′-GCG TCT TCG CTT CCC ATT-3′). To improve the fluorescent signal of the KS-Beta466 probe, the following helper oligonucleotides were used: KS-Gal431-helper (5′-TTC CGT CTG AAA GAG CTT-3′), KS-Gal449-helper (5′-TTA AAT CGT GCG ATT TCT), and KS-Gal485-helper (5′-TGC TTC TTC TTA CGG TAC). As a positive control, the probe Beta42a for Betaproteobacteria (modified from Manz et al. [67] and targeting the 23S rRNA), and as a negative control, the probe NON338 (modified from Wallner et al. [68]) were used. All probes were ordered as horseradish peroxidase (HRP) conjugates (biomers.net).
Hybridization conditions were optimized using the reference strains Kerstersia gyiorum (for KS-Gal466) and Coprothermobacter platensis (for KS-Brady1249) with 1.7 and 1.1 weighted mismatches at the respective probe-specific target sites, respectively. For the Bradyrhizobium species probe, the cells were permeabilized with lysozyme (10 mg ml−1 in 50 mM EDTA [pH 8] and 100 mM Tris-HCl [pH 8]) at 37°C for 1 h. For the Gallionellaceae sp. probe, the cells were permeabilized with proteinase K (≥0.71 μg ml−1 in 50 mM EDTA (pH 8), 100 mM Tris-HCl (pH 8), and 500 mM NaCl) at RT for 15 min. Afterwards, the cells were incubated with 100 mM HCl for 10 min and washed with double-distilled water (ddH2O) for 5 min. A 300-μl volume of hybridization buffer, consisting of 35% (vol/vol) formamide, 900 mM NaCl, 20 mM Tris-HCl (pH 8), 0.02% (vol/vol) SDS, 1% (wt/vol) blocking reagent (Roche, Germany), and 10% (wt/vol) dextran sulfate, was mixed with 1 μl of the probe (and 1 μl of each helper, 50 ng μl−1). Cells were incubated at 46°C for 3 h and washed in a preheated washing buffer, consisting of 5 mM EDTA (pH 8), 20 mM Tris-HCl (pH 8), 70 mM NaCl, and 0.01% SDS, at 48°C for 5 min. The filters were then washed in 1× PBS at RT for 15 min. Amplification buffer, consisting of 1× PBS, 0.1% (wt/vol) blocking reagent, 2 M NaCl, and 10% (wt/vol) dextran sulfate, was mixed with 0.1% H2O2 and 0.4% Oregon Green 517-X-tyramide-conjugate in N,N-dimethyl formamide. Fluorescence and elemental fluorine (19F) labeling was achieved by using custom-synthesized tyramides. Tyramides were prepared as described by Pernthaler et al. (69). Cells were incubated in the tyramide-amended amplification buffer at 46°C for 10 min and washed with 1× PBS at RT for 15 min. Afterwards, the cells were stained with DAPI (1 μg ml−1) for 10 min, washed with ddH2O for 5 min, rinsed in ethanol, and air dried in the dark at RT. Membrane filters were embedded in Prolong Gold and incubated at RT for 24 h in the dark before the slides were analyzed using fluorescence microscopy (Leica DM 5500 B; Leica Microsystems). Images were taken at a magnification of ×1,000 with a Leica DFC 360 FX camera using Leica Application Suite Advanced Fluorescence software (2.6.0.766). Cell counts were performed on duplicate cultures incubated with the labeled substrates, counting at least 500 cells per sample. The cell numbers were calculated from the filtered culture volume and the counted filter area.
For NanoSIMS measurements, cells of one culture incubated with 13C and 15N were hybridized in solution and centrifuged after each CARD-FISH step. At the end, the hybridized cells were transferred onto Si-wafers (Plano GmbH, Wetzlar, Germany) and air dried in the dark at RT. Regions of interest (ROIs) were defined by fluorescence microscopy, and their coordinates were recorded by scanning electron microscopy (SEM) in order to facilitate identification of ROIs during NanoSIMS measurements. Please note that for cell counts hybridizations were performed on membrane filters.
Scanning electron microscopy.
SEM was performed with a LEO 1450VP (now Zeiss, Oberkochen, Germany). The Si-wafers were mounted on SEM aluminum stubs using a sticky carbon tape (both from Plano GmbH, Germany). The wafers were coated for 90 s at 30 mA with Pt using a Model SCD005 sputter coater according to the manufacturer's instructions (BAL-TEC GmbH, Witten, Germany), which resulted in a 6- to 8-nm Pt layer. The SEM micrographs were taken at 5 kV and at a working distance of 8 mm using secondary-electron contrast.
Secondary ion mass spectrometry at the nanoscale.
The NanoSIMS analyses were performed on a Cameca NanoSIMS 50 L instrument (Cameca, Gennevilliers, France) at the Chair of Soil Science at the Technical University in Munich in Freising, Germany. A Cs+ primary-ion probe was used with 16-keV primary-ion impact energy and 8 kV secondary ion extraction voltage. The primary beam was focused to obtain a lateral resolution of <200 nm and scanned over the sample. The primary ion beam current was kept constant during an experiment to ensure comparability among the analyzed matrixes. Electron multiplier secondary ion collectors were set for 12C−, 13C−, 12C14N−, 12C15N−, 19F−, and 56Fe16O−. A larger field of view was presputtered at a high-beam current to remove the Pt layer and to implant Cs ions. The measurements were done at 30 ms per pixel, scanning an area of 25 by 25 μm with a 256 × 256 pixel resolution. For data analyses, the software package Look@NanoSims was used (70). The outline of individual cells was identified and traced by an interactive tool in the Look@NanoSIMS software package and, if necessary, manually retraced. All measurements were corrected for electron multiplier dead time (44 ns).
Availability of data.
Partial 16S rRNA gene pyrosequencing reads have been deposited in the ENA Sequence Read Archive (SRA) under accession number SRP133308.
Supplementary Material
ACKNOWLEDGMENTS
This work was supported by the German Research Foundation (DFG)-funded research training group RTG 1708 “Molecular principles of bacterial survival strategies” and by an early career research grant from the Technical University of Munich to T. L.-B.
Footnotes
For a companion article on this topic, see https://doi.org/10.1128/AEM.02173-17.
Supplemental material for this article may be found at https://doi.org/10.1128/AEM.02166-17.
REFERENCES
- 1.Straub KL, Benz M, Schink B, Widdel F. 1996. Anaerobic, nitrate-dependent microbial oxidation of ferrous iron. Appl Environ Microbiol 62:1458–1460. [DOI] [PMC free article] [PubMed] [Google Scholar]
- 2.He S, Tominski C, Kappler A, Behrens S, Roden EE. 2016. Metagenomic analyses of the autotrophic Fe (II)-oxidizing, nitrate-reducing enrichment culture KS. Appl Environ Microbiol 82:2656–2668. doi: 10.1128/AEM.03493-15. [DOI] [PMC free article] [PubMed] [Google Scholar]
- 3.Melton ED, Swanner ED, Behrens S, Schmidt C, Kappler A. 2014. The interplay of microbially mediated and abiotic reactions in the biogeochemical Fe cycle. Nat Rev Microbiol 12:797–808. doi: 10.1038/nrmicro3347. [DOI] [PubMed] [Google Scholar]
- 4.Weber KA, Achenbach LA, Coates JD. 2006. Microorganisms pumping iron: anaerobic microbial iron oxidation and reduction. Nat Rev Microbiol 4:752–764. doi: 10.1038/nrmicro1490. [DOI] [PubMed] [Google Scholar]
- 5.Bird LJ, Bonnefoy V, Newman DK. 2011. Bioenergetic challenges of microbial iron metabolisms. Trends Microbiol 19:330–340. doi: 10.1016/j.tim.2011.05.001. [DOI] [PubMed] [Google Scholar]
- 6.Hedrich S, Schlömann M, Johnson DB. 2011. The iron-oxidizing proteobacteria. Microbiology 157:1551–1564. doi: 10.1099/mic.0.045344-0. [DOI] [PubMed] [Google Scholar]
- 7.Laufer K, Nordhoff M, Røy H, Schmidt C, Behrens S, Jørgensen BB, Kappler A. 2016. Coexistence of microaerophilic, nitrate-reducing, and phototrophic Fe(II) oxidizers and Fe(III) reducers in coastal marine sediment. Appl Environ Microbiol 82:1433–1447. doi: 10.1128/AEM.03527-15. [DOI] [PMC free article] [PubMed] [Google Scholar]
- 8.Laufer K, Røy H, Jørgensen BB, Kappler A. 2016. Evidence for the existence of autotrophic nitrate-reducing Fe(II)-oxidizing bacteria in marine coastal sediment. Appl Environ Microbiol 82:6120–6131. doi: 10.1128/AEM.01570-16. [DOI] [PMC free article] [PubMed] [Google Scholar]
- 9.Weber KA, Urrutia MM, Churchill PF, Kukkadapu RK, Roden EE. 2006. Anaerobic redox cycling of iron by freshwater sediment microorganisms. Environ Microbiol 8:100–113. doi: 10.1111/j.1462-2920.2005.00873.x. [DOI] [PubMed] [Google Scholar]
- 10.Melton ED, Schmidt C, Kappler A. 2012. Microbial iron(II) oxidation in littoral freshwater lake sediments: competition between phototrophic vs. nitrate-reducing iron(II)-oxidizers. Front Microbiol 3:197. doi: 10.3389/fmicb.2012.00197. [DOI] [PMC free article] [PubMed] [Google Scholar]
- 11.Blöthe M, Roden EE. 2009. Composition and activity of an autotrophic Fe(II)-oxidizing, nitrate-reducing enrichment culture. Appl Environ Microbiol 75:6937–6940. doi: 10.1128/AEM.01742-09. [DOI] [PMC free article] [PubMed] [Google Scholar]
- 12.Tominski C, Heyer H, Lösekann-Behrens T, Behrens S, Kappler A. 2018. Growth and population dynamics of the anaerobic Fe(II)-oxidizing and nitrate-reducing enrichment culture KS. Appl Environ Microbiol 84:e02173-17. doi: 10.1128/AEM.02173-17. [DOI] [PMC free article] [PubMed] [Google Scholar]
- 13.Liu H, Yin H, Dai Y, Dai Z, Liu Y, Li Q, Jiang H, Liu X. 2011. The co-culture of Acidithiobacillus ferrooxidans and Acidiphilium acidophilum enhances the growth, iron oxidation, and CO2 fixation. Arch Microbiol 193:857–866. doi: 10.1007/s00203-011-0723-8. [DOI] [PubMed] [Google Scholar]
- 14.Okibe N, Johnson DB. 2004. Biooxidation of pyrite by defined mixed cultures of moderately thermophilic acidophiles in pH-controlled bioreactors: significance of microbial interactions. Biotechnol Bioeng 87:574–583. doi: 10.1002/bit.20138. [DOI] [PubMed] [Google Scholar]
- 15.Heising S, Richter L, Ludwig W, Schink B. 1999. Chlorobium ferrooxidans sp. nov., a phototrophic green sulfur bacterium that oxidizes ferrous iron in coculture with a “Geospirillum” sp. strain. Arch Microbiol 172:116–124. doi: 10.1007/s002030050748. [DOI] [PubMed] [Google Scholar]
- 16.Goebel BM, Stackebrandt E. 1994. Cultural and phylogenetic analysis of mixed microbial populations found in natural and commercial bioleaching environments. Appl Environ Microbiol 60:1614–1621. [DOI] [PMC free article] [PubMed] [Google Scholar]
- 17.Johnson D, Kelso W. 1983. Detection of heterotrophic contaminants in cultures of Thiobacillus ferrooxidans and their elimination by subculturing in media containing copper sulphate. J Gen Microbiol 129:2969–2972. [Google Scholar]
- 18.Tischler JS, Jwair RJ, Gelhaar N, Drechsel A, Skirl A-M, Wiacek C, Janneck E, Schlömann M. 2013. New cultivation medium for “Ferrovum” and Gallionella-related strains. J Microbiol Methods 95:138–144. doi: 10.1016/j.mimet.2013.07.027. [DOI] [PubMed] [Google Scholar]
- 19.Kermer R, Hedrich S, Taubert M, Baumann S, Schlömann M, Johnson DB, Seifert J. 2012. Elucidation of carbon transfer in a mixed culture of Acidiphilium cryptum and Acidithiobacillus ferrooxidans using protein-based stable isotope probing. J Integrated OMICS 2:37–45. [Google Scholar]
- 20.Emerson D, Field E, Chertkov O, Davenport K, Goodwin L, Munk C, Nolan M, Woyke T. 2013. Comparative genomics of freshwater Fe-oxidizing bacteria: implications for physiology, ecology, and systematics. Front Microbiol 4:254. doi: 10.3389/fmicb.2013.00254. [DOI] [PMC free article] [PubMed] [Google Scholar]
- 21.Hallbeck L, Pedersen K. 1991. Autotrophic and mixotrophic growth of Gallionella ferruginea. Microbiology 137:2657–2661. [Google Scholar]
- 22.Meija J, Coplen TB, Berglund M, Brand WA, De Bièvre P, Gröning M, Holden NE, Irrgeher J, Loss RD, Walczyk T. 2016. Isotopic compositions of the elements 2013 (IUPAC technical report). Pure Appl Chem 88:293–306. [Google Scholar]
- 23.Buchholz-Cleven BE, Rattunde B, Straub KL. 1997. Screening for genetic diversity of isolates of anaerobic Fe(II)-oxidizing bacteria using DGGE and whole-cell hybridization. Syst Appl Microbiol 20:301–309. doi: 10.1016/S0723-2020(97)80077-X. [DOI] [Google Scholar]
- 24.Kanaparthi D, Pommerenke B, Casper P, Dumont MG. 2013. Chemolithotrophic nitrate-dependent Fe(II)-oxidizing nature of actinobacterial subdivision lineage TM3. ISME J 7:1582–1594. doi: 10.1038/ismej.2013.38. [DOI] [PMC free article] [PubMed] [Google Scholar]
- 25.Klueglein N, Kappler A. 2013. Abiotic oxidation of Fe(II) by reactive nitrogen species in cultures of the nitrate-reducing Fe(II) oxidizer Acidovorax sp. BoFeN1—questioning the existence of enzymatic Fe(II) oxidation. Geobiology 11:180–190. doi: 10.1111/gbi.12019. [DOI] [PubMed] [Google Scholar]
- 26.Nordhoff M, Tominski C, Halama M, Byrne J, Obst M, Kleindienst S, Behrens S, Kappler A. 2017. Insights into nitrate-reducing Fe(II) oxidation mechanisms through analysis of cell-mineral associations, cell encrustation, and mineralogy in the chemolithoautotrophic enrichment culture KS. Appl Environ Microbiol 83:e00752-17. doi: 10.1128/AEM.00752-17. [DOI] [PMC free article] [PubMed] [Google Scholar]
- 27.Schreiber F, Wunderlin P, Udert KM, Wells GF. 2012. Nitric oxide and nitrous oxide turnover in natural and engineered microbial communities: biological pathways, chemical reactions, and novel technologies. Front Microbiol 3:372. doi: 10.3389/fmicb.2012.00372. [DOI] [PMC free article] [PubMed] [Google Scholar]
- 28.Shelobolina E, Konishi H, Xu H, Benzine J, Xiong MY, Wu T, Blöthe M, Roden E. 2012. Isolation of phyllosilicate–iron redox cycling microorganisms from an illite–smectite rich hydromorphic soil. Front Microbiol 3:134. doi: 10.3389/fmicb.2012.00134. [DOI] [PMC free article] [PubMed] [Google Scholar]
- 29.Benzine J, Shelobolina E, Xiong MY, Kennedy DW, McKinley JP, Lin X, Roden E. 2013. Fe-phyllosilicate redox cycling organisms from a redox transition zone in Hanford 300 Area sediments. Front Microbiol 4:388. doi: 10.3389/fmicb.2013.00388. [DOI] [PMC free article] [PubMed] [Google Scholar]
- 30.Klueglein N, Picardal F, Zedda M, Zwiener C, Kappler A. 2015. Oxidation of Fe(II)-EDTA by nitrite and by two nitrate-reducing Fe(II)-oxidizing Acidovorax strains. Geobiology 13:198–207. doi: 10.1111/gbi.12125. [DOI] [PubMed] [Google Scholar]
- 31.Klueglein N, Zeitvogel F, Stierhof Y-D, Floetenmeyer M, Konhauser KO, Kappler A, Obst M. 2014. Potential role of nitrite for abiotic Fe(II) oxidation and cell encrustation during nitrate reduction by denitrifying bacteria. Appl Environ Microbiol 80:1051–1061. doi: 10.1128/AEM.03277-13. [DOI] [PMC free article] [PubMed] [Google Scholar]
- 32.Picardal F. 2012. Abiotic and microbial interactions during anaerobic transformations of Fe(II) and NOx−. Front Microbiol 3:112. doi: 10.3389/fmicb.2012.00112. [DOI] [PMC free article] [PubMed] [Google Scholar]
- 33.Carlson HK, Clark IC, Blazewicz SJ, Iavarone AT, Coates JD. 2013. Fe(II) oxidation is an innate capability of nitrate-reducing bacteria that involves abiotic and biotic reactions. J Bacteriol 195:3260–3268. doi: 10.1128/JB.00058-13. [DOI] [PMC free article] [PubMed] [Google Scholar]
- 34.Kampschreur MJ, Kleerebezem R, de Vet WW, van Loosdrecht MC. 2011. Reduced iron induced nitric oxide and nitrous oxide emission. Water Res 45:5945–5952. doi: 10.1016/j.watres.2011.08.056. [DOI] [PubMed] [Google Scholar]
- 35.Melton E, Schmidt C, Behrens S, Schink B, Kappler A. 2014. Metabolic flexibility and substrate preference by the Fe(II)-oxidizing purple non-sulphur bacterium Rhodopseudomonas palustris strain TIE-1. Geomicrobiol J 31:835–843. doi: 10.1080/01490451.2014.901439. [DOI] [Google Scholar]
- 36.Musat N, Halm H, Winterholler B, Hoppe P, Peduzzi S, Hillion F, Horreard F, Amann R, Jørgensen BB, Kuypers MM. 2008. A single-cell view on the ecophysiology of anaerobic phototrophic bacteria. Proc Natl Acad Sci U S A 105:17861–17866. doi: 10.1073/pnas.0809329105. [DOI] [PMC free article] [PubMed] [Google Scholar]
- 37.Zimmermann M, Escrig S, Hübschmann T, Kirf MK, Brand A, Inglis RF, Musat N, Müller S, Meibom A, Ackermann M. 2015. Phenotypic heterogeneity in metabolic traits among single cells of a rare bacterial species in its natural environment quantified with a combination of flow cell sorting and NanoSIMS. Front Microbiol 6:243. doi: 10.3389/fmicb.2015.00243. [DOI] [PMC free article] [PubMed] [Google Scholar]
- 38.Emerson D, Moyer C. 1997. Isolation and characterization of novel iron-oxidizing bacteria that grow at circumneutral pH. Appl Environ Microbiol 63:4784–4792. [DOI] [PMC free article] [PubMed] [Google Scholar]
- 39.Weiss JV, Rentz JA, Plaia T, Neubauer SC, Merrill-Floyd M, Lilburn T, Bradburne C, Megonigal JP, Emerson D. 2007. Characterization of neutrophilic Fe(II)-oxidizing bacteria isolated from the rhizosphere of wetland plants and description of Ferritrophicum radicicola gen. nov. sp. nov., and Sideroxydans paludicola sp. nov. Geomicrobiol J 24:559–570. doi: 10.1080/01490450701670152. [DOI] [Google Scholar]
- 40.Krepski ST, Hanson TE, Chan CS. 2012. Isolation and characterization of a novel biomineral stalk-forming iron-oxidizing bacterium from a circumneutral groundwater seep. Environ Microbiol 14:1671–1680. doi: 10.1111/j.1462-2920.2011.02652.x. [DOI] [PubMed] [Google Scholar]
- 41.Singer E, Emerson D, Webb EA, Barco RA, Kuenen JG, Nelson WC, Chan CS, Comolli LR, Ferriera S, Johnson J. 2011. Mariprofundus ferrooxydans PV-1 the first genome of a marine Fe(II) oxidizing Zetaproteobacterium. PLoS One 6:e25386. doi: 10.1371/journal.pone.0025386. [DOI] [PMC free article] [PubMed] [Google Scholar]
- 42.Kato S, Chan C, Itoh T, Ohkuma M. 2013. Functional gene analysis of freshwater iron-rich flocs at circumneutral pH and isolation of a stalk-forming microaerophilic iron-oxidizing bacterium. Appl Environ Microbiol 79:5283–5290. doi: 10.1128/AEM.03840-12. [DOI] [PMC free article] [PubMed] [Google Scholar]
- 43.Jewell TN, Karaoz U, Brodie EL, Williams KH, Beller HR. 2016. Metatranscriptomic evidence of pervasive and diverse chemolithoautotrophy relevant to C, S, N and Fe cycling in a shallow alluvial aquifer. ISME J 10:2106–2117. doi: 10.1038/ismej.2016.25. [DOI] [PMC free article] [PubMed] [Google Scholar]
- 44.Emerson JB, Thomas BC, Alvarez W, Banfield JF. 2016. Metagenomic analysis of a high carbon dioxide subsurface microbial community populated by chemolithoautotrophs and bacteria and archaea from candidate phyla. Environ Microbiol 18:1686–1703. doi: 10.1111/1462-2920.12817. [DOI] [PubMed] [Google Scholar]
- 45.Franck WL, Chang W-S, Qiu J, Sugawara M, Sadowsky MJ, Smith SA, Stacey G. 2008. Whole-genome transcriptional profiling of Bradyrhizobium japonicum during chemoautotrophic growth. J Bacteriol 190:6697–6705. doi: 10.1128/JB.00543-08. [DOI] [PMC free article] [PubMed] [Google Scholar]
- 46.Lepo JE, Hanus FJ, Evans HJ. 1980. Chemoautotrophic growth of hydrogen-uptake-positive strains of Rhizobium japonicum. J Bacteriol 141:664–670. [DOI] [PMC free article] [PubMed] [Google Scholar]
- 47.Masuda S, Eda S, Ikeda S, Mitsui H, Minamisawa K. 2010. Thiosulfate-dependent chemolithoautotrophic growth of Bradyrhizobium japonicum. Appl Environ Microbiol 76:2402–2409. doi: 10.1128/AEM.02783-09. [DOI] [PMC free article] [PubMed] [Google Scholar]
- 48.Masuda S, Eda S, Sugawara C, Mitsui H, Minamisawa K. 2010. The cbbL gene is required for thiosulfate-dependent autotrophic growth of Bradyrhizobium japonicum. Microbes Environ 25:220–223. [DOI] [PubMed] [Google Scholar]
- 49.Musat N, Stryhanyuk H, Bombach P, Adrian L, Audinot J-N, Richnow HH. 2014. The effect of FISH and CARD-FISH on the isotopic composition of 13C- and 15N-labeled Pseudomonas putida cells measured by nanoSIMS. Syst Appl Microbiol 37:267–276. doi: 10.1016/j.syapm.2014.02.002. [DOI] [PubMed] [Google Scholar]
- 50.Kato S, Krepski S, Chan C, Itoh T, Ohkuma M. 2014. Ferriphaselus amnicola gen. nov., sp. nov., a neutrophilic, stalk-forming, iron-oxidizing bacterium isolated from an iron-rich groundwater seep. Int J Syst Evol Microbiol 64:921–925. doi: 10.1099/ijs.0.058487-0. [DOI] [PubMed] [Google Scholar]
- 51.Malik K, Schlegel H. 1981. Chemolithoautotrophic growth of bacteria able to grow under N2-fixing conditions. FEMS Microbiol Lett 11:63–67. doi: 10.1111/j.1574-6968.1981.tb06936.x. [DOI] [Google Scholar]
- 52.Hegler F, Posth NR, Jiang J, Kappler A. 2008. Physiology of phototrophic iron(II)-oxidizing bacteria: implications for modern and ancient environments. FEMS Microbiol Ecol 66:250–260. doi: 10.1111/j.1574-6941.2008.00592.x. [DOI] [PubMed] [Google Scholar]
- 53.Schaedler F, Kappler A, Schmidt C. 2018. A revised iron extraction protocol for environmental samples rich in nitrite and carbonate. Geomicrobiol J 35:23–30. doi: 10.1080/01490451.2017.1303554. [DOI] [Google Scholar]
- 54.Lane D. 1991. 16S/23S rRNA sequencing, p 115–175. In Stackebrandt E, Goodfellow M (ed), Nucleic acid techniques in bacterial systematics. John Wiley & Sons, New York, NY. [Google Scholar]
- 55.Liu Z, Lozupone C, Hamady M, Bushman FD, Knight R. 2007. Short pyrosequencing reads suffice for accurate microbial community analysis. Nucleic Acids Res 35:e120. doi: 10.1093/nar/gkm541. [DOI] [PMC free article] [PubMed] [Google Scholar]
- 56.Muyzer G, De Waal EC, Uitterlinden AG. 1993. Profiling of complex microbial populations by denaturing gradient gel electrophoresis analysis of polymerase chain reaction-amplified genes coding for 16S rRNA. Appl Environ Microbiol 59:695–700. [DOI] [PMC free article] [PubMed] [Google Scholar]
- 57.Schloss PD. 2013. Secondary structure improves OTU assignments of 16S rRNA gene sequences. ISME J 7:457–460. doi: 10.1038/ismej.2012.102. [DOI] [PMC free article] [PubMed] [Google Scholar]
- 58.Quince C, Lanzén A, Curtis TP, Davenport RJ, Hall N, Head IM, Read LF, Sloan WT. 2009. Accurate determination of microbial diversity from 454 pyrosequencing data. Nat Methods 6:639–641. doi: 10.1038/nmeth.1361. [DOI] [PubMed] [Google Scholar]
- 59.Edgar RC, Haas BJ, Clemente JC, Quince C, Knight R. 2011. UCHIME improves sensitivity and speed of chimera detection. Bioinformatics 27:2194–2200. doi: 10.1093/bioinformatics/btr381. [DOI] [PMC free article] [PubMed] [Google Scholar]
- 60.Schloss PD, Gevers D, Westcott SL. 2011. Reducing the effects of PCR amplification and sequencing artifacts on 16S rRNA-based studies. PLoS One 6:e27310. doi: 10.1371/journal.pone.0027310. [DOI] [PMC free article] [PubMed] [Google Scholar]
- 61.Pruesse E, Quast C, Knittel K, Fuchs BM, Ludwig W, Peplies J, Glöckner FO. 2007. SILVA: a comprehensive online resource for quality checked and aligned ribosomal RNA sequence data compatible with ARB. Nucleic Acids Res 35:7188–7196. doi: 10.1093/nar/gkm864. [DOI] [PMC free article] [PubMed] [Google Scholar]
- 62.Huse SM, Welch DM, Morrison HG, Sogin ML. 2010. Ironing out the wrinkles in the rare biosphere through improved OTU clustering. Environ Microbiol 12:1889–1898. doi: 10.1111/j.1462-2920.2010.02193.x. [DOI] [PMC free article] [PubMed] [Google Scholar]
- 63.Schloss PD, Westcott SL. 2011. Assessing and improving methods used in operational taxonomic unit-based approaches for 16S rRNA gene sequence analysis. Appl Environ Microbiol 77:3219–3226. doi: 10.1128/AEM.02810-10. [DOI] [PMC free article] [PubMed] [Google Scholar]
- 64.Wang Q, Garrity GM, Tiedje JM, Cole JR. 2007. Naive Bayesian classifier for rapid assignment of rRNA sequences into the new bacterial taxonomy. Appl Environ Microbiol 73:5261–5267. doi: 10.1128/AEM.00062-07. [DOI] [PMC free article] [PubMed] [Google Scholar]
- 65.Angly FE, Dennis PG, Skarshewski A, Vanwonterghem I, Hugenholtz P, Tyson GW. 2014. CopyRighter: a rapid tool for improving the accuracy of microbial community profiles through lineage-specific gene copy number correction. Microbiome 2:1–13. doi: 10.1186/2049-2618-2-11. [DOI] [PMC free article] [PubMed] [Google Scholar]
- 66.Ludwig W, Strunk O, Westram R, Richter L, Meier H, Buchner A, Lai T, Steppi S, Jobb G, Förster W. 2004. ARB: a software environment for sequence data. Nucleic Acids Res 32:1363–1371. doi: 10.1093/nar/gkh293. [DOI] [PMC free article] [PubMed] [Google Scholar]
- 67.Manz W, Amann R, Ludwig W, Wagner M, Schleifer K-H. 1992. Phylogenetic oligodeoxynucleotide probes for the major subclasses of proteobacteria: problems and solutions. Syst Appl Microbiol 15:593–600. doi: 10.1016/S0723-2020(11)80121-9. [DOI] [Google Scholar]
- 68.Wallner G, Amann R, Beisker W. 1993. Optimizing fluorescent in situ hybridization with rRNA-targeted oligonucleotide probes for flow cytometric identification of microorganisms. Cytometry 14:136–143. doi: 10.1002/cyto.990140205. [DOI] [PubMed] [Google Scholar]
- 69.Pernthaler A, Pernthaler J, Amann R. 2004. Sensitive multicolor fluorescence in situ hybridization for the identification of environmental microorganisms, p 711–726. In Kowalchuk GA, de Bruijn FJ, Head IM, Akkermans AD, van Elsas JD (ed), Molecular microbial ecology manual, 2nd ed Kluwer Academic Publishers, Dordrecht, Netherlands. [Google Scholar]
- 70.Polerecky L, Adam B, Milucka J, Musat N, Vagner T, Kuypers MM. 2012. Look@NanoSIMS—a tool for the analysis of nanoSIMS data in environmental microbiology. Environ Microbiol 14:1009–1023. doi: 10.1111/j.1462-2920.2011.02681.x. [DOI] [PubMed] [Google Scholar]
Associated Data
This section collects any data citations, data availability statements, or supplementary materials included in this article.