Abstract
Colon cancer is a complex disease affected by a combination of genetic and epigenetic factors. Here we demonstrate that nardilysin (N-arginine dibasic convertase; NRDC), a metalloendopeptidase of the M16 family, regulates intestinal tumorigenesis via its nuclear functions. NRDC is highly expressed in human colorectal cancers. Deletion of the Nrdc gene in ApcMin mice crucially suppressed intestinal tumor development. In ApcMin mice, epithelial cell–specific deletion of Nrdc recapitulated the tumor suppression observed in Nrdc-null mice. Moreover, epithelial cell–specific overexpression of Nrdc significantly enhanced tumor formation in ApcMin mice. Notably, epithelial NRDC controlled cell apoptosis in a gene dosage–dependent manner. In human colon cancer cells, nuclear NRDC directly associated with HDAC1, and controlled both acetylation and stabilization of p53, with alterations of p53 target apoptotic factors. These findings demonstrate that NRDC is critically involved in intestinal tumorigenesis through its epigenetic regulatory function, and targeting NRDC may lead to a novel prevention or therapeutic strategy against colon cancer.
Keywords: Oncology
Keywords: Colorectal cancer
The metalloendopeptidase nardilysin is critically involved in intestinal tumorigenesis through its epigenetic regulatory function.
Introduction
Colon cancer is one of the most common malignancies worldwide and largely contributes to overall mortality caused by cancer. It is a complex disease affected by a combination of genetic and epigenetic factors (1, 2). Until recently, the progression of colon cancer had been mainly attributed to a sequential accumulation of genetic aberrations (3). However, we now know that colon cancers involve not only genetic changes but also epigenetic alterations including DNA methylation, and histone acetylation or deacetylation (4). Epigenetic aberrations are often caused by genetic alterations that result in the functional deregulation of epigenetic proteins and their atypical recruitment to certain gene promoters. Treatment with epigenetic modifiers has been proposed as a promising therapeutic target against cancer, and histone deacetylase (HDAC) inhibition is one such established strategy (5).
Nardilysin (N-arginine dibasic convertase; NRDC) is a zinc peptidase of the M16 family, and is involved in various aspects of cancer biology. NRDC has widespread expression in various organs (6). Although NRDC is a soluble cytosolic protein with no apparent signal peptide, a portion of NRDC is secreted through an unconventional secretory pathway and distributed on the cell surface (7–9). We originally identified NRDC as a cell-surface receptor for heparin-binding epidermal growth factor–like growth factor (HB-EGF) (8), and our subsequent studies have demonstrated that NRDC enhances ectodomain shedding of multiple membrane proteins including HB-EGF (10–14). For instance, forced expression of NRDC or administration of the NRDC protein enhances ectodomain shedding of TNF-α through the activation of a disintegrin and metalloproteinase 17 (ADAM17) (12). Importantly, the enhancement of TNF-α shedding by NRDC and the subsequent activation of TNF-R signaling are involved in the growth of gastric cancer cell lines (15). While there are no obvious differences in gastric homeostasis in Nrdc+/+ and Nrdc–/– mice under physiological conditions, Nrdc–/– mice do not develop gastric inflammation in the presence of Helicobacter felis, in contrast to Nrdc+/+ littermates (16). When choline-deficient L-amino-acid-defined or high-fat diets are administered, Nrdc–/– mice, unlike the Nrdc+/+ strain, do not develop steatohepatitis (17).
NRDC has recently been identified as a dimethyl-H3K4 binding protein (18). Furthermore, the physical and functional interactions of NRDC with several nuclear proteins such as HDAC3, PGC-1α, and Islet-1 have been demonstrated, suggesting a novel role of NRDC as a transcriptional coregulator (18–20). Moreover, NRDC controls adaptive thermogenesis and glucose metabolism in vivo via the regulation of PGC-1α and Islet-1, respectively (19, 20).
Although previous reports have shown that NRDC is highly expressed in cancer cells in breast, gastric, and esophageal cancer cells and promotes cell growth (15, 21, 22), its function during tumorigenesis has not been completely elucidated. Therefore, in this study, we aimed to elucidate the role of NRDC in intestinal tumorigenesis, and show that NRDC regulates intestinal tumor development through the HDAC1/p53 pathway.
Results
NRDC in epithelial cells regulated intestinal tumorigenesis.
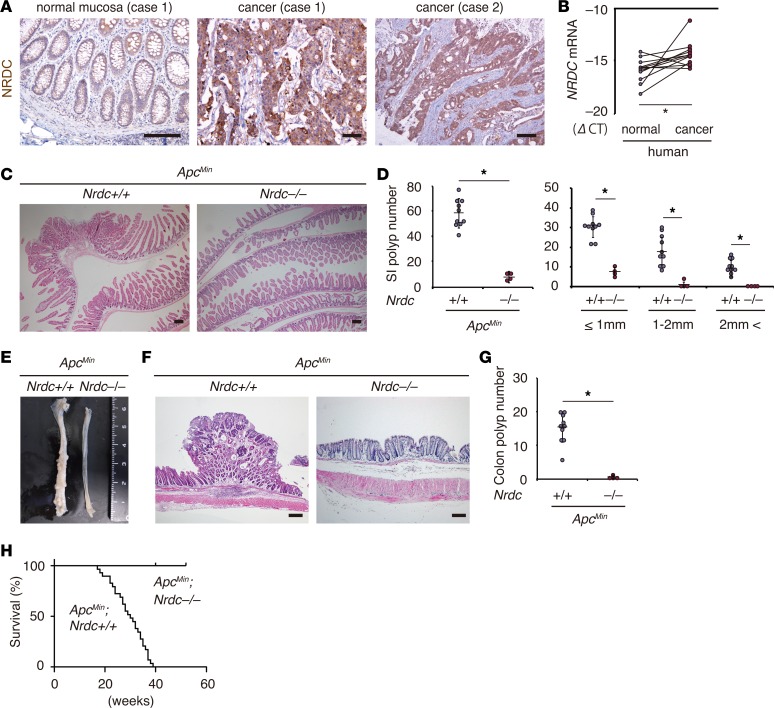
We confirmed the expression of NRDC in human colon cancer. NRDC was strongly immunostained in human colon cancers compared with normal colon mucosae (Figure 1A). Consistently, NRDC mRNA levels in the cancerous regions were significantly higher than those in adjacent normal colonic mucosae (Figure 1B). These findings prompted us to examine the role of NRDC in intestinal tumorigenesis.
Figure 1. NRDC is required in ApcMin mouse intestinal tumors.
(A) Immunostaining for NRDC in human colon cancer specimens. Cancer cells were stained more strongly than the adjacent normal colon epithelium (case 1). (B) qRT-PCR showed that the mRNA level of NRDC (compared with cycle threshold [CT] for GAPDH) was higher in cancer tissues than in adjacent normal colonic tissues (n = 12). *P < 0.05 by paired 2-tailed Student’s t test. (C) Representative H&E staining of the small intestines of ApcMin; Nrdc+/+ and ApcMin; Nrdc–/– mice. (D) The numbers of small intestinal (SI) tumors evaluated in H&E sections of ApcMin; Nrdc+/+ and ApcMin; Nrdc–/– mice (n = 10 and 4, respectively). *P < 0.05 by unpaired 2-tailed Student’s t test. Total number (left) and number in each size fraction (right) are depicted. (E) Macroscopic view of the colon of ApcMin; Nrdc+/+ and ApcMin; Nrdc–/– mice. (F) Representative H&E staining of the rectums of ApcMin; Nrdc+/+ and ApcMin; Nrdc–/– mice. (G) The numbers of colon tumors in ApcMin; Nrdc+/+ and ApcMin; Nrdc–/– mice (n = 10 and 4, respectively). *P < 0.05 by unpaired 2-tailed Student’s t test. (H) Kaplan-Meier analysis demonstrated that ApcMin; Nrdc–/– mice showed a significantly longer survival compared with ApcMin; Nrdc+/+ mice. *P < 0.0001 by log-rank test. All scale bars: 100 μm.
By using the ApcMin mouse as a model, we examined the role of NRDC in intestinal tumorigenesis. Under physiological conditions, there were no significant differences in morphology and cellular components in the normal parts of intestinal mucosae (i.e., proportions of enterocytes, goblet cells, Paneth cells, Ki67-positive cells, and cleaved caspase-3–positive cells in the crypts) in ApcMin; Nrdc+/+ and ApcMin; Nrdc–/– mice (data not shown). However, the numbers of tumors in the small intestine (Figure 1, C and D) and colon (Figure 1, E–G) of ApcMin; Nrdc–/– mice were significantly and remarkably smaller than those of ApcMin; Nrdc+/+ mice. Over a 1-year follow-up period, ApcMin; Nrdc–/– mice showed a significantly longer survival compared with ApcMin; Nrdc+/+ mice (Figure 1H). These results indicated that Nrdc deficiency critically attenuated intestinal tumorigenesis in ApcMin mice.
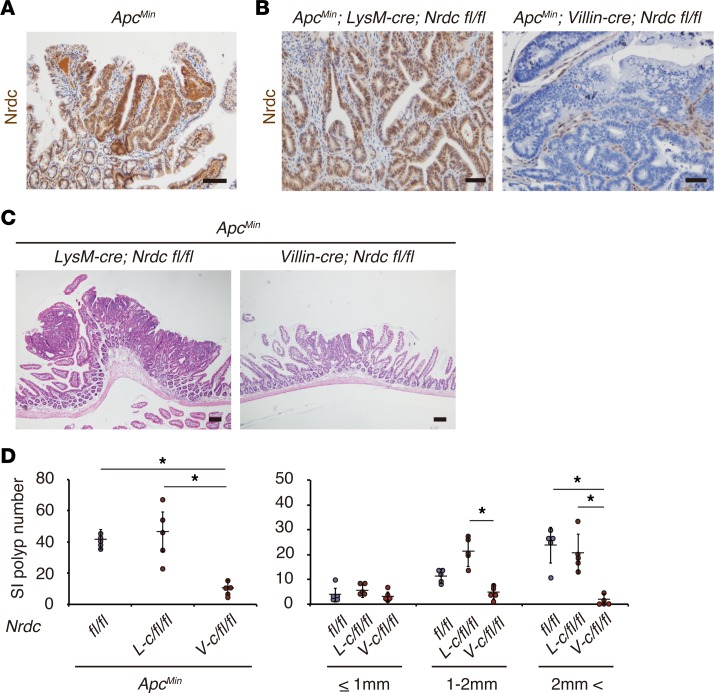
We next questioned where an Nrdc deficiency affects ApcMin mouse intestinal tumorigenesis. Immunohistochemistry revealed that NRDC protein was highly detected in tumor cells in ApcMin mouse intestines (Figure 2A). Therefore, we speculated that NRDC in tumor cells is responsible for the development of intestinal tumors in ApcMin mice. To test this hypothesis, we examined tumor formation in ApcMin; Villin-cre; Nrdcfl/fl mice, which lack NRDC in tumor cells (Figure 2B). ApcMin; Villin-cre; Nrdcfl/fl mice showed a remarkably smaller number of intestinal tumors compared with ApcMin; Nrdcfl/fl mice (Figure 2, C and D). The polyp number in ApcMin; Villin-cre; Nrdcfl/fl mice was comparable to that in ApcMin; Nrdc–/– mice.
Figure 2. Epithelial NRDC is required in ApcMin mouse intestinal tumors.
(A) Immunohistochemistry for NRDC is higher in tumor cells than in the surrounding stromal and epithelial cells in the ApcMin mouse intestine. (B) Immunostaining for NRDC in ApcMin; LysM-cre; Nrdcfl/fl and ApcMin; Villin-cre; Nrdcfl/fl mice. (C) Representative H&E staining of the small intestines of ApcMin; LysM-cre; Nrdcfl/fl and ApcMin; Villin-cre; Nrdcfl/fl mice. (D) The numbers of small intestinal (SI) tumors of ApcMin; Nrdcfl/fl (fl/fl), ApcMin; LysM-cre; Nrdcfl/fl (L-c/fl/fl), and ApcMin; Villin-cre; Nrdcfl/fl (V-c/fl/fl) mice (n = 5). *P < 0.05 by 1-way ANOVA with Tukey’s post hoc test. Total number (left) and number in each size fraction (right) are depicted. All scale bars: 100 μm.
Intestines are unique organs that harbor a vast population of commensal microbes (23), and the development of mouse intestinal tumors is largely affected by such commensal microbiota through Toll-like receptor signaling (24). Therefore, to minimize the contribution of granulocytes and macrophages mediating innate immunity, we also examined ApcMin; LysM-cre; Nrdcfl/fl mice, which lack NRDC in innate immune cell lineages. ApcMin; LysM-cre; Nrdcfl/fl mice did not show a significant decrease in intestinal tumors compared with ApcMin; Nrdcfl/fl mice (Figure 2, B–D). These data indicated that NRDC in epithelial cells plays pivotal roles in intestinal tumorigenesis in ApcMin mice.
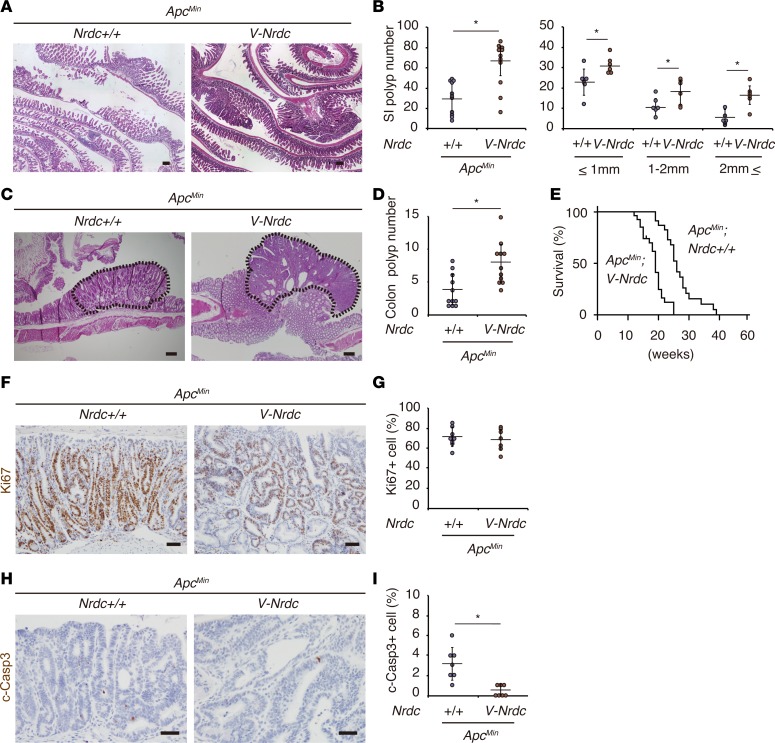
To determine the dose-dependent effects of epithelial NRDC in tumorigenesis, we further generated Villin-Nrdc–transgenic (Villin-Nrdc) mice, in which NRDC was overexpressed in intestinal epithelial cells under the control of the Villin promoter. Indeed, ApcMin; Villin-Nrdc mice showed increased tumor formation in the small intestine (Figure 3, A and B) and colon (Figure 3, C and D), and a significantly shorter survival compared with ApcMin; Nrdc+/+ mice (Figure 3E).
Figure 3. Forced expression of NRDC in epithelial cells enhances ApcMin mouse intestinal tumors.
(A) Representative H&E staining of the small intestines of ApcMin and ApcMin; Villin-Nrdc (V-Nrdc) mice. (B) ApcMin; Villin-Nrdc mice showed a greater increase in tumor formation in the small intestine (SI) than ApcMin mice (n = 6–11). *P < 0.05 by unpaired 2-tailed Student’s t test. Total number (left) and number in each size fraction (right) are depicted. (C) Representative H&E staining of colon tumors (dotted area) in ApcMin and ApcMin; Villin-Nrdc mice. (D) The numbers of colon tumors in ApcMin and ApcMin; Villin-Nrdc mice (n = 11). *P < 0.05 by unpaired 2-tailed Student’s t test. (E) A Kaplan-Meier analysis demonstrated that ApcMin; Villin-Nrdc mice showed a significantly shorter survival compared with ApcMin mice (n = 11). *P < 0.001 by log-rank test. (F) Immunostaining for Ki67 in ApcMin and ApcMin; Villin-Nrdc mice. (G) There was no difference in Ki67-positive cells between ApcMin and ApcMin; Villin-Nrdc mice (n = 7). (H) Immunostaining for cleaved caspase-3 in ApcMin and ApcMin; Villin-Nrdc mice. (I) The percentage of cleaved caspase-3–positive apoptotic cells was decreased in ApcMin; Villin-Nrdc mice (n = 7). *P < 0.05 by unpaired 2-tailed Student’s t test. All scale bars: 100 μm.
To elucidate the mechanisms underlying these dose-dependent effects of epithelial NRDC during intestinal tumorigenesis, we examined the alterations in the expression of target genes in several crucial pathways involved in colorectal carcinogenesis. However, mRNA expression levels of c-Myc, Ccnd1, and Pten were not significantly altered in ApcMin and ApcMin; Villin-Nrdc mice (data not shown). Furthermore, those of inflammatory cytokines, such as Tnfa, Il6, Cxcl1, and Ccl2 were not significantly changed (data not shown). When cell numbers were counted in 10 randomly selected high-power-field sections, the percentages of Ki67-positive proliferating cells in intestinal tumors were comparable in ApcMin; Nrdc+/+ and ApcMin; Villin-Nrdc mice (Figure 3, F and G); however, those of cleaved caspase-3–positive apoptotic cells were inversely and significantly associated with the gene dosage of Nrdc (Figure 3, H and I). These data suggested the possibility that NRDC in tumor cells regulates intestinal tumor development, at least in part, by regulating apoptosis.
NRDC regulated apoptosis and chemosensitivity of human colon cancer cells.
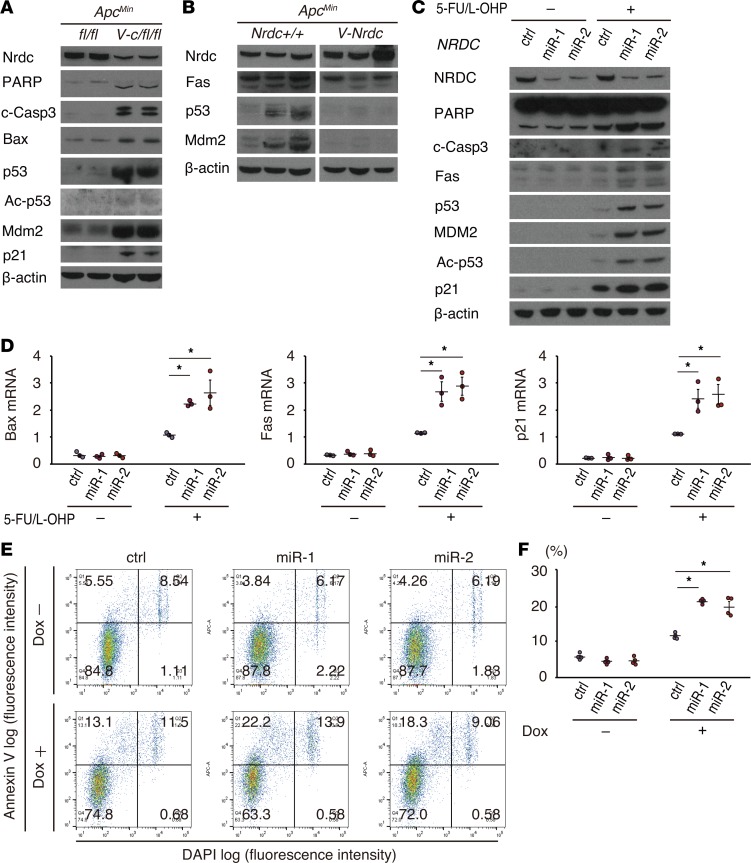
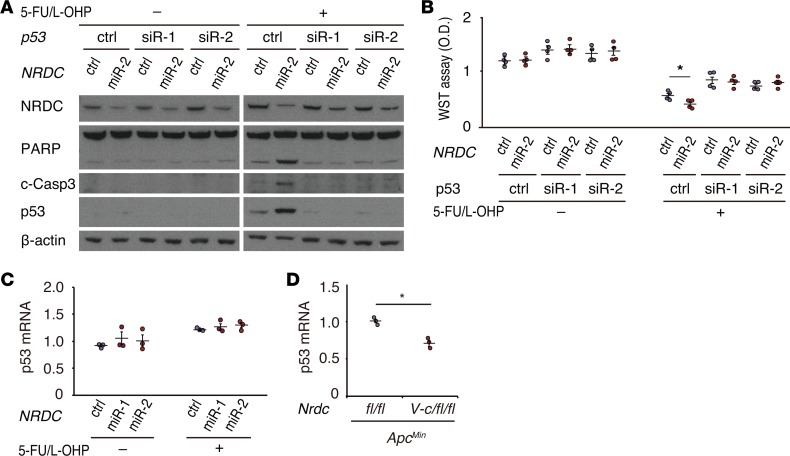
The lower apoptotic rate observed in the intestinal tumors in ApcMin; Villin-Nrdc mice compared with ApcMin mice prompted us to examine the protein levels of representative markers and major contributors of cell apoptosis in intestinal extracts of ApcMin, ApcMin; Villin-cre; Nrdcfl/fl, and ApcMin; Villin-Nrdc mice. The levels of 2 apoptosis markers, cleaved PARP and cleaved caspase-3, were both increased in the intestines of ApcMin; Villin-cre; Nrdcfl/fl mice compared with those in ApcMin mice (Figure 4A). Notably, the levels of major contributors of cell apoptosis, such as Bax, p53, and p21, were also increased in ApcMin; Villin-cre; Nrdcfl/fl mice (Figure 4A). Consistent with these data, the expression of Fas, p53, and MDM2 was downregulated in the intestines of ApcMin; Villin-Nrdc mice (Figure 4B). To further investigate the cell-autonomous effect of NRDC on apoptosis, we next assessed the levels of these markers in the human colon cancer cell line HCT116, which contains wild-type p53. Gene knockdown of NRDC in HCT116 cells enhanced the expression of the apoptotic markers, p53 and p21, which were induced by treatment with 5-fluorouracil (5-FU) and oxaliplatin (L-OHP), representing the FOLFOX (folinic acid, fluorouracil [5-FU], and oxaliplatin) regimen for colon cancers (Figure 4C). Transcriptional levels of p53 target genes, such as Bax, Fas, and p21, were also upregulated by NRDC knockdown in the presence of 5-FU and L-OHP (Figure 4D). The effect of NRDC knockdown on apoptosis was also confirmed by annexin V staining in HCT116 cells (Figure 4, E and F). To confirm whether p53 mediates these effects of NRDC, we performed a concomitant knockdown of p53 and NRDC in HCT116 cells. The enhancement of chemotherapy-induced apoptosis and reduced cell viability observed following NRDC knockdown was abrogated by concurrent p53 knockdown (Figure 5, A and B, respectively). Therefore, these results indicated that NRDC negatively regulates apoptosis and chemosensitivity at least partly through the inhibition of p53 expression.
Figure 4. NRDC regulates apoptosis and chemosensitivity of HCT116 cells.
(A) Western blotting of small intestine lysates from ApcMin and ApcMin; Villin-Nrdc mice was performed with the indicated antibodies. (B) Western blotting of small intestine lysates from ApcMin; Nrdcfl/fl and ApcMin; Villin-cre; Nrdcfl/fl mice. Fas, p53, and Mdm2 were decreased in ApcMin; Villin-Nrdc mice. (C) HCT116 cells, in which NRDC was knocked down (control, miR-1, miR-2), were treated with or without 5-fluorouracil (5-FU, 5 μM) and oxaliplatin (L-OHP, 1 μM) for 48 hours and harvested for Western blotting with the indicated antibodies. (D) qRT-PCR analysis showed that Bax, Fas, and p21 mRNA levels were increased by NRDC knockdown. All data represent means ± standard error (SE) of 3 independent experiments with duplicate samples. (E) Representative images of flow cytometric analysis by annexin V and DAPI staining in HCT116 cells. Cells with or without NRDC knockdown were analyzed after the treatment with doxorubicin (Dox) for 24 hours. (F) Quantification of apoptotic cells (annexin V-positive and DAPI-negative) (Q1). All data represent means ± SE of 4 independent experiments with duplicate samples. *P < 0.05 by 1-way ANOVA with Tukey-Kramer post hoc test.
Figure 5. NRDC regulates apoptosis and chemosensitivity though p53.
(A) HCT116 cells, in which NRDC and p53 were concomitantly knocked down, were treated with or without 5-fluorouracil (5-FU, 5 μM) and oxaliplatin (L-OHP, 1 μM) for 48 hours and harvested for Western blotting. The effects of NRDC knockdown were cancelled by concomitant p53 knockdown. (B) The number of viable HCT116 cells was quantified using the WST-8 assay. All data represent means ± SE of 4 independent experiments with duodecuplicate samples. (C) qRT-PCR analysis showed that the mRNA levels of p53 were not affected by the NRDC status. All data represent means ± SE of 3 independent experiments with duplicate samples. (D) qRT-PCR analysis showed that p53 mRNA was slightly but significantly downregulated in ApcMin; Villin-cre; Nrdcfl/fl mice. All data represent means ± SE of 4 independent experiments. *P < 0.05 by unpaired 2-tailed Student’s t test.
NRDC interacted with HDAC1 to regulate cell apoptosis.
To further determine how NRDC regulates apoptosis, we focused on the regulatory mechanism of p53 expression. Although protein levels of p53 were elevated by gene deletion or knockdown of NRDC (Figure 4, A and C), p53 mRNA levels were not altered by NRDC knockdown in HCT116 cells (Figure 5C) or rather were decreased by Nrdc deletion in ApcMin mice (Figure 5D). Furthermore, MDM2, which degrades p53 protein in a ubiquitin-dependent pathway, was inversely associated with NRDC dose both in vivo and in vitro (Figure 4, A–C). These results indicated that the p53 protein level is regulated posttranslationally by NRDC.
We next examined acetylation of p53, because acetylation on lysine residues prevents MDM2-mediated ubiquitination of p53 (25). The knockdown of NRDC in HCT116 cells enhanced acetylation of p53, which was accompanied by an increased amount in the total levels of p53 protein (Figure 4C).
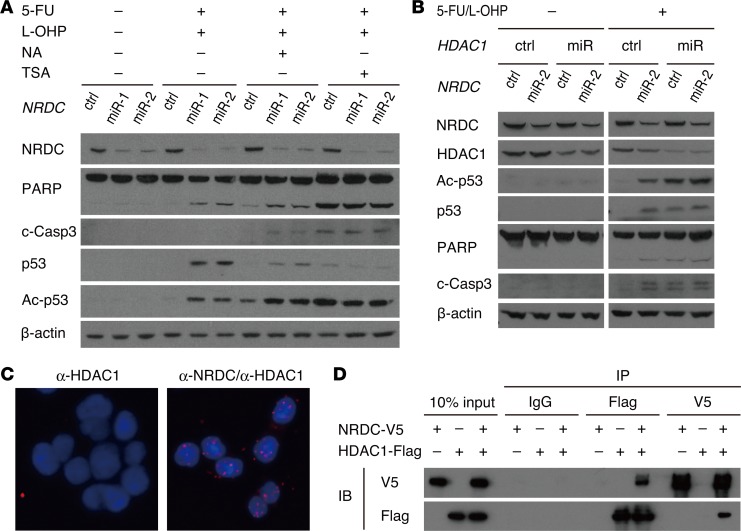
Because p53 is deacetylated mainly by HDAC1 or SIRT1 (26, 27), we assessed the effect of inhibitors of these deacetylases on the enhanced p53 acetylation following NRDC knockdown. Administration of trichostatin A (HDAC inhibitor), but not of nicotinic acid (SIRT1 inhibitor), abrogated the enhancement of p53 acetylation and increased levels of apoptotic proteins (Figure 6A), indicating that NRDC regulates p53 acetylation and apoptosis through HDAC activity. Specific gene knockdown of HDAC1 also abrogated the enhancement of p53 acetylation and cell apoptosis by NRDC gene knockdown (Figure 6B). We next examined the direct interaction of NRDC and HDAC1 by in situ proximity ligation assay (PLA) and coprecipitation assays (Figure 6, C and D, respectively). Both assays clearly indicated that NRDC directly associated with HDAC1.
Figure 6. NRDC interacts with HDAC1.
(A) HCT116 cells, in which NRDC was knocked down (control, miR-1, miR-2), were treated with or without 5-fluorouracil (5-FU, 5 μM) and oxaliplatin (L-OHP, 1 μM) in combination either with nicotinic acid (NA, 500 μM) or tricostatin A (TSA, 250 nM) for 48 hours and harvested for Western blotting. TSA cancelled the enhancement of p53 acetylation and increased apoptotic proteins. (B) HCT116 cells, in which NRDC and HDAC1 were concomitantly knocked down, were treated with or without 5-FU (5 μM) and L-OHP (1 μM) for 48 hours and harvested for Western blotting with the indicated antibodies. (C) Representative images from an in situ proximity ligation assay to show the interaction between NRDC and HDAC1 in HCT116 cells. Nuclei were defined by DAPI staining. (D) The 293T cells were transfected with the indicated expression vectors, followed by immunoprecipitation (IP) of the cotransfected cell lysates with control IgG, anti-FLAG, or anti-V5 antibodies. Western blotting indicated that NRDC directly associates with HDAC1. IB indicates antibodies used for immunoblotting.
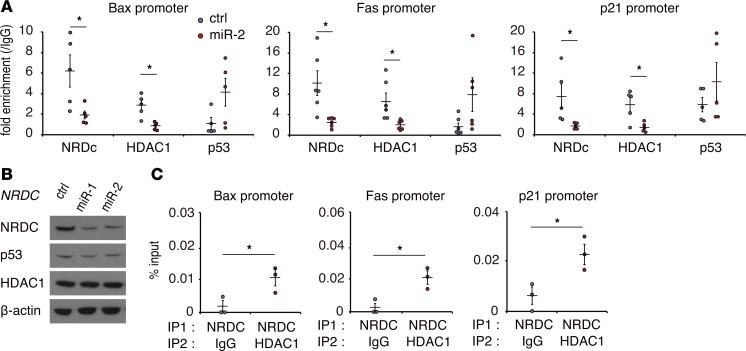
To further confirm the functional association between NRDC and HDAC1, we took particular note of the behavior of NRDC and HDAC1 in the promoter regions of p53 target genes. Acetylation of p53 augments its binding to target gene promoters, which is attenuated by HDAC1-mediated deacetylation (28). Chromatin immunoprecipitation (ChIP)-PCR assay was performed in HCT116 cells targeting the p53 binding sites of Bax, Fas, and p21. We confirmed the binding of NRDC to the promoters; this binding was clearly diminished by the knockdown of NRDC (Figure 7A). While the total HDAC1 protein levels were not altered by NRDC knockdown (Figure 7B), the association of HDAC1 with the promoter regions was significantly decreased by NRDC knockdown (Figure 7A). On the other hand, the association of p53 with the promoters tended to be increased by NRDC knockdown (Figure 7A). To further confirm the coexistence of NRDC and HDAC1 in the promoter of the p53 target genes, we performed a sequential ChIP–re-ChIP assay, which indicated that these proteins colocalized in the promoter regions of Bax, Fas, and p21 (Figure 7C). Thus, NRDC modulates HDAC1 activity by controlling its recruitment to the promoter, which in turn regulates p53 acetylation.
Figure 7. NRDC controls HDAC1 recruitment to the promoter.
(A) ChIP was performed with control IgG, anti-NRDC, anti-HDAC1, or anti-p53 antibodies in HCT116 cells, in which NRDC was knocked down (control, miR-2), followed by qPCR amplifying the p53 binding element of its target genes. All data represent means ± SE of at least 5 independent experiments with duplicate samples. (B) Total protein levels of HDAC1 were not altered by NRDC knockdown in HCT116 cells. (C) A ChIP–re-ChIP assay was performed with an anti-NRDC antibody in combination with either control IgG or anti-HDAC1 antibody. All data represent means ± SE of 3 independent experiments with duplicate samples. *P < 0.05 by unpaired 2-tailed Student’s t test.
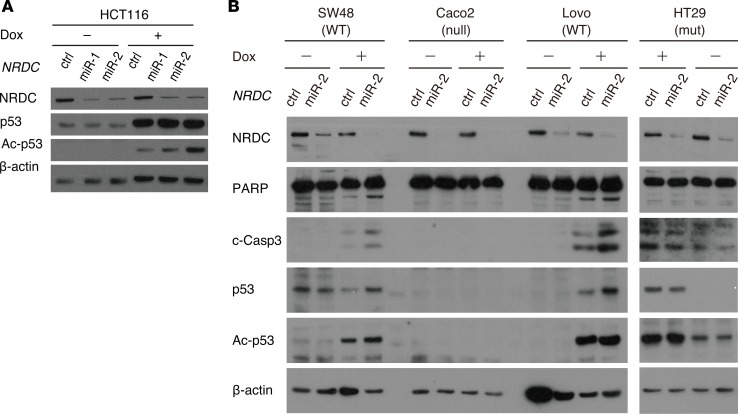
In addition to HCT116 cells treated with 5-FU and L-OHP, NRDC-dependent regulation of p53 acetylation was also observed with doxorubicin, a different anticancer agent (Figure 8A). Moreover, we examined 4 additional colon cancer cell lines with wild-type p53 (SW48 and Lovo), mutant p53 (HT29), or null mutant of p53 (Caco2). As in HCT116, NRDC knockdown in SW48 and Lovo enhanced the levels of apoptotic markers and p53 acetylation (Figure 8B). In HT29 and Caco2 cells, however, NRDC knockdown did not affect apoptosis and p53 acetylation (Figure 8B). These data suggested that nuclear NRDC controls the progression of colon cancer by regulating apoptosis through the HDAC1/p53 pathway.
Figure 8. NRDC-dependent regulation of p53 acetylation in various colon cancer cells.
(A) HCT116 cells, in which NRDC was knocked down (control, miR-1, miR-2), were treated with or without doxorubicin (0.5 μM) for 24 hours and harvested for Western blotting. (B) Colon cancer cell lines with wild-type p53 (SW48 and Lovo: WT), mutant p53 (HT29: mut) or null mutant of p53 (Caco2: null), in which NRD1 was knocked down, were treated with or without doxorubicin (0.5 μM) for 24 hours and harvested for Western blotting with the indicated antibodies.
NRDC regulated viability of mouse intestinal tumor cells in an HDAC-dependent manner.
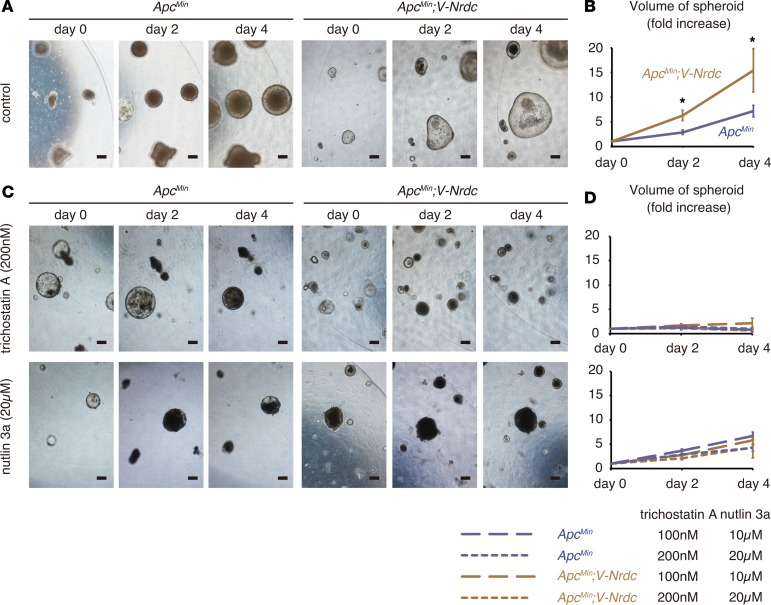
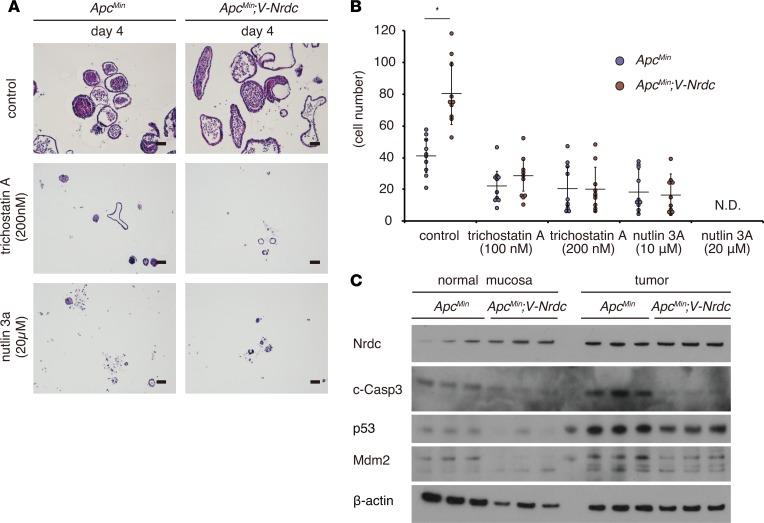
To further confirm the epithelial cell–intrinsic role of NRDC while excluding the influence by stromal cells, we used spheroid models consisting of tumor cells only. We developed tumor spheroids from intestinal tumors of ApcMin and ApcMin; Villin-Nrdc mice according to established methods (29, 30). Consistent with the in vivo results, the size and number of cells in each tumor spheroid were greater in spheroids from ApcMin; Villin-Nrdc mice compared with that in spheroids from ApcMin mice (Figure 9, A and B, and Figure 10, A and B). To determine the role of HDAC in ApcMin mouse tumor cells, we administered trichostatin A and found that the elevated growth of tumor spheroids from ApcMin; Villin-Nrdc mice was reduced to a level comparable to that of spheroids from ApcMin mice (Figure 9, C and D, and Figure 10, A and B). Similarly, the administration of nutlin-3a, an MDM2 inhibitor that increases p53 protein levels, abrogated the NRDC-mediated growth elevation of tumor spheroids from ApcMin; Villin-Nrdc mice (Figure 9, C and D, and Figure 10, A and B). We also examined protein expression in tumor spheroids, and found that the levels of cleaved caspase-3, p53, and MDM2 were clearly reduced in tumor spheroids derived from ApcMin; Villin-Nrdc mice (Figure 10C). We further prepared spheroids from normal mucosa of ApcMin and ApcMin; Villin-Nrdc mice. There were small, if any, differences in the levels of cleaved caspase-3, p53, and MDM2 in ApcMin and ApcMin; Villin-Nrdc samples, indicating that NRDC in tumor cells mainly regulates apoptosis (Figure 10C). Together, these results suggested that the cell-autonomous effect of NRDC on intestinal tumor progression is mediated by HDAC and p53.
Figure 9. NRDC regulates viability of tumor spheroids.
(A) Tumor spheroids were generated from intestinal tumors of ApcMin and ApcMin; Villin-Nrdc mice, and serially observed. (B) Growth curves of tumor spheroids. Data represent means ± standard error (SE) of 20 independent experiments (fold increase). (C) Tumor spheroids treated with trichostatin A (upper; 0, 100, and 200 nM final concentration) and nutlin 3a (lower; 0, 10, and 20 μM final concentration). (D) Growth curves of tumor spheroids treated with trichostatin A and nutlin 3a. Data represent means ± standard error (SE) of 20 independent experiments (fold increase). Scale bars: 200 μm. *P < 0.05 by unpaired 2-tailed Student’s t test.
Figure 10. NRDC regulates viability of tumor cells via HDAC and p53.
(A) Representative H&E staining of tumor spheroids treated with trichostatin A (200 nM final concentration) and nutlin 3a (20 μM final concentration). (B) Cell numbers (fold increase) of tumor spheroids treated with trichostatin A and nutlin 3a (n = 7). *P < 0.05 by unpaired 2-tailed Student’s t test. N.D., not detected. (C) Lysates of organoids derived from normal mucosa (left) or tumor (right) regions of ApcMin and ApcMin; Villin-Nrdc mice were used for Western blotting with the indicated antibodies.
Discussion
In the present study, we demonstrated that NRDC plays a pivotal role in intestinal tumor progression through HDAC/p53–dependent transcriptional regulation in both ApcMin mice and human colorectal cancer cells.
A remarkable inhibition of tumor formation in ApcMin; Nrdc–/– mice was reproduced in ApcMin; Villin-cre; Nrdcfl/fl mice. Moreover, overexpression of NRDC in epithelial cells enhanced the growth of intestinal tumors. On the other hand, there was no significant difference in the tumor formation between ApcMin; Nrdcfl/fl mice and ApcMin; LysM-cre; Nrdcfl/fl mice. Taken together with the fact that NRDC was strongly immunostained in cancer epithelial cells in human colorectal cancer tissues, these results indicated a critical role of epithelial NRDC in colon cancer. Indeed, there are several Jun/Fos–binding sites in the promoter region of the NRDC gene (http://www.genecards.org), and it is reasonable to speculate that activated oncogenic cascades upregulate the transcription and protein expression of NRDC.
Our findings in ApcMin mice and human colorectal cancer cells underscored a nuclear function of NRDC as a transcriptional coregulator in cancer development. We present here, for the first time to our knowledge, data indicating that NRDC controls tumor formation via regulation of the HDAC1/p53 pathway. The p53 tumor suppressor is a non-histone substrate of HDACs (31), and its acetylation is indispensable for p53-dependent growth arrest and apoptosis (32). Inhibition of HDACs leads to a marked acetylation of p53, and these posttranslational modifications boost p53 stability and its transcriptional activity (33). Gene knockdown of NRDC in HCT116 cells resulted in the enhancement of 5-FU/L-OHP–induced p53 acetylation, which was accompanied by an increased stability of p53, upregulation of genes downstream of p53, and cell apoptosis. The simultaneous gene knockdown experiments revealed that the effect of NRDC on cell apoptosis was mediated by p53 and HDAC1. Mechanistically, NRDC modulates the recruitment of HDAC1 to the promoter region of p53 target genes, which in turn regulates p53 acetylation and its transcriptional activity. Consistently, in ApcMin mice, deletion or forced expression of NRDC in epithelial cells in vivo determined the expression level of p53 and its downstream proapoptotic genes. Moreover, growth promotion of tumor spheroids from ApcMin; Villin-Nrdc mice was abrogated either by an inhibitor of HDACs or by an MDM2 inhibitor, which blocks p53 degradation. These results indicated that NRDC is an important upstream regulator for HDAC1 and p53.
HDAC inhibitors have been used in clinical trials for the treatment of human cancers (4), and class I HDAC inhibitors appear to be the most potent candidates among them (34). Silencing of HDAC expression induces a G2/M growth arrest and stimulates p21 promoter activity in colon cancer cells (35). Although the cell cycle–dependent kinase inhibitor p21 is known to be transcriptionally regulated by p53, induction of p21 by HDAC inhibitors does not always require the presence of wild-type p53 (36). Both p53-dependent and p53-independent anticancer effects have also been demonstrated for HDAC inhibitors (37). Clonal evolution models suggest that a p53 mutation frequently occurs in the transition from adenoma to cancer (2), and genome studies clearly show that mutation of p53 is one of the most frequent genetic aberrations in human colorectal cancer (1). The physical and functional interaction of NRDC and HDAC1 that we have demonstrated suggested that NRDC might control tumor development through p53-independent mechanisms. We would like to further identify downstream targets of the NRDC/HDAC axis that affect tumor development other than those involved in apoptosis in future studies. Furthermore, in addition to elucidating the role of NRDC in regulating epigenetic regulation, further investigation of other NRDC targets might provide novel prevention and therapeutic strategies against colon cancer.
Methods
Clinical samples and immunohistochemical analysis.
Surgically resected specimens were obtained from colon cancer patients who had been admitted to Kyoto University Hospital. Sixty-two patients were enrolled in this study with the following clinicopathological parameters: 32 males and 30 females ranging from 19–86 years old comprising 10 stage I, 19 stage II, 22 stage III, and 11 stage IV patients. Surgically resected specimens were routinely processed and immunostained in addition to mouse samples. In brief, the primary antibodies were incubated at 4°C overnight, and then secondary antibodies were added. All immunohistochemical analyses were performed with IgG isotype controls or blocking peptides for antibodies.
Animal models.
The generation of Nrdc–/– mice with a C57BL/6 background was as previously described (13). To generate mice overexpressing murine Nrdc under the control of the Villin promoter, the Nrdc transgene consisting of the murine Nrdc cDNA downstream of the mouse Villin promoter was microinjected into fertilized C57BL/6 mouse eggs, and 2 lines were established from 4 founders. The transgenic offspring were validated with tail DNA by PCR using a set of 2 primers (GGAAGATTTTTAACCTGAATCCTGA and TGAGTTTGGACAAACCACAACTAGA). The expression level of NRDC was examined by quantitative reverse transcription PCR (qRT-PCR) and Western blotting. Mice with 2–3 times higher levels of NRDC expression compared with wild-type C57BL/6 mice were used in this study. Nrdcfl/fl mice (accession number CDB1019K, http://www.clst.riken.jp/arg/mutant%20mice%20list.html) were generated using gene targeting in TT2 embryonic stem (ES) cells (http://www2.clst.riken.jp/arg/methods.html) (38). The targeting vector was designed to insert loxP sites upstream and downstream of the exon1 of Nrdc. Successful homologous recombination in TT2-ES cells was confirmed using PCR (GTACTCGGATGGAAGCCGGTCTTGTC and TCATTCAGGCAGGGTTTGAGTCACC) and Southern blotting. The resulting mutant mice were genotyped with tail DNA using PCR (GCGATCCCAAGCAGTACCGGTG and AAATTGCCCTGGCCGCCTCAC), crossed with CAG-FLPe–transgenic mice for the removal of the neomycin selection cassette surrounded by FRT sites, and then backcrossed to the C57BL/6J background over 8 generations. ApcMin mice were obtained from the Jackson Laboratory. Animals were housed under specific pathogen–free conditions at the Animal Facilities of Kyoto University.
qRT-PCR.
Total RNA was extracted using TRIzol (Invitrogen). Single-strand cDNA was synthesized using a Transcriptor First Strand cDNA Synthesis Kit (Roche Applied Science). qRT-PCR was performed using SYBR Green I Master (Roche Applied Science) and Light Cycler 480 (Roche Applied Science). The results were standardized for comparison by measuring levels of 36B4 mRNA for cells and GAPDH mRNA for tissues in each sample. The primers used in these studies were as follows: mouse Nrdc, GACTTGCTGGTGAATGCTGA and TTCGATGATTCTTCGCACAG; mouse p53, CACGTACTCTCCTCCCCTCAAT and AACTGCACAGGGCACGTCTT; mouse Gapdh, TGGATGCAGGGATGATGTTCT and TGCACCACCAACTGCTTAGCC; human GAPDH, ATGGGGAAGGTGAAGGTCG and GGGGTCATTGATGGCAACAATA; human p53, CCCAAGCAATGGATGATTTGA and GGCATTCTGGGAGCTTCATCT; human Bax, GGATGATTGCCGCCGT and CCCAGTTGAAGTTGCCGT; human Fas, TTCTGCCATAAGCCCTGTC and ACTTGGTATTCTGGGTCCG; human p21, GGCAGACCAGCATGACAGATT and GCGGATTAGGGCTTCCTCT; and human 36B4, GCGACCTGGAAGTCCAACTAC and ATCTGCTGCATCTGCTTGG.
Antibodies.
A mouse anti–human NRDC monoclonal antibody (clone 102) was raised against recombinant human NRDC (aa 50–129) fused with glutathione S-transferase (GST) in our laboratory. Human NRDC (aa 50–129) fused with GST was prepared in a BL21 strain and synthesized according to the manufacturer’s instructions (Amersham Biosciences). A rat anti–mouse NRDC monoclonal antibody (clone 135) was raised against recombinant mouse NRDC in our laboratory. Recombinant mouse full-length NRDC was synthesized using a silkworm protein expression system (Sysmex). A mouse anti–mouse NRDC monoclonal antibody (clone 2E6) was raised against recombinant mouse NRDC (348-1161) in our laboratory. Recombinant mouse NRDC was synthesized using the silkworm protein expression system (Sysmex). Other antibodies were purchased from the following sources: p53 (sc-6243 and sc-6243-G), HDAC1 (sc-81598 and sc-7872), Bax (sc-7480), Fas (sc-7886), p21 (sc-397), MDM2 (sc-965), β-actin (sc-47778), control IgG (sc-2025) (all from Santa Cruz Biotechnology); p53 (catalog 2524), acetyl-p53 (Lys382) (catalog 2525), acetyl-p53 (Lys379) (catalog 2570), PARP (catalog 9542), cleaved caspase-3 (catalog 9661) (all from Cell Signaling Technology); and Ki67 (Abcam, ab15580).
Cell culture and viral infection.
Human colorectal cancer cell lines (HCT116, SW48, Caco2, Lovo, and HT29) were purchased from ATCC, and grown in RPMI medium supplemented with 10% fetal bovine serum (FBS) and antibiotics (Thermo Fisher Scientific). To knock down Nrdc and p53, cells were infected with a lentivirus expressing miR targeting Nrdc and p53 (BLOCK-iT miR RNAi Select; Thermo Fisher Scientific). 293T cells were obtained from RIKEN BRC (BioResource Research Center), and grown in DMEM medium supplemented with 10% FBS and antibiotics. The transfection of plasmids into 293T cells was carried out using HilyMax (DOJINDO) according to the manufacturer’s instructions.
Cell survival analysis.
The number of living cells was estimated using the Cell Counting Kit-8 (WST-8; Dojindo). In brief, 5.0 × 10³ cells were seeded in 96-well plates and cultured in growth medium containing 10% FBS for 24 hours, followed by 5-FU and L-OHP treatments for an additional 48 hours. After the treatment, 10 μl of WST-8 reagent was added to each well. After the plate was incubated at 37°C for 1 hour in a 5% CO2 atmosphere, absorbance at 450 nm was measured using a plate reader.
Apoptosis analysis.
Apoptosis was detected by annexin V staining. In brief, 5 × 10⁵ cells (HCT116) were plated and cultured in the growth medium containing 10% FBS for 24 hours, followed by treatment with doxorubicin (2.5 μM) for another 24 hours. After the treatment, cells were trypsinized, washed in PBS, resuspended in annexin V binding buffer (Nacalai, 153433-54), and then stained with annexin V-APC (BioLegend, 640920) plus DAPI (BioLegend, 422801). Percentage of annexin V–positive and DAPI-negative apoptotic cells was counted by FACSAria III (BD Biosciences).
Western blot analysis.
Total tissue and cell extract preparation and Western blot analysis were carried out as described previously (10). In brief, tissues and cells were lysed in lysis buffer containing 10 mM Tris-HCl at pH 7.4, 150 mM NaCl, 1% NP-40, a protease inhibitor cocktail (Complete Mini; Roche Applied Science), and a phosphatase inhibitor cocktail (Sigma-Aldrich). Tissue and cell lysates were separated by SDS-polyacrylamide gel electrophoresis and transferred to nitrocellulose membranes. After blocking, membranes were incubated with primary antibodies followed by horseradish peroxidase–conjugated secondary antibodies. The immobilized peroxidase activity was detected with an enhanced chemiluminescence system (Pierce Western Blotting Substrates, Thermo Fisher Scientific).
In situ PLA.
HCT116 cells were seeded on chamber slides and fixed by acetone/methanol for 15 minutes. After blocking with 5% FBS in PBS-T (0.1% Tween 20) for 1 hour, the slides were incubated for 2 hours with primary antibodies. The following antibody pairs were used in combination or alone as negative controls: mouse anti-NRDC (clone 102) and rabbit anti-HDAC1 (Santa Cruz Biotechnology, sc-7872). After washing, the slides were treated with the Duolink Detection Kit with PLA PLUS and MINUS Probes for mouse and rabbit (Duolink In Situ, Sigma-Aldrich), according to the manufacturer’s protocol. Fluorescent images were acquired using a KEYENCE BZ-9000 microscope.
ChIP and re-ChIP assay.
HCT116 cells were treated with 1% formaldehyde in culture medium for 10 minutes in order to cross-link DNA and associated proteins. Cells were collected and resuspended in a hypotonic solution, followed by the isolation of nuclei, which were lysed in a nuclear lysis buffer (50 mM Tris-Cl, pH 7.5, 150 mM NaCl, 0.1% SDS, 1% Triton X-100, 1 mM EDTA, 0.1% sodium deoxycholate, and protease inhibitors). The lysates were sonicated by a Bioruptor (12 cycles; work 60 seconds and rest 60 seconds). ChIP was performed using a ChIP-IT Express Chromatin Immunoprecipitation Kit (Active Motif). In brief, chromatin-bound proteins were immunoprecipitated with antibodies against NRDC (clone 2E6), p53 (2524, Cell Signaling Technology), HDAC1 (sc-81598, Santa Cruz Biotechnology), or control IgG (sc-2025, Santa Cruz Biotechnology). One-twentieth of the purified DNA after ChIP was analyzed by qPCR. Re-ChIP was performed using a Re-ChIP-IT Magnetic Chromatin Re-immunoprecipitation Kit (Active Motif). Immunoprecipitates were eluted after the first ChIP and the eluate was diluted and subjected to the second ChIP. The primers used were as follows: Bax, TAATCCCAGCGCTTTGGAA and TGCAGAGACCTGGATCTAGCAA; Fas, ACAGGAATTGAAGCGGAAGTCT and GCCGGAGCGGACCTTT; and p21, GTGGCTCTGATTGGCTTTCTG and CCAGCCCTGTCGCAAGGATC.
Culture of tumor spheroids.
Spheroid cultures were established as previously described (29, 30). In short, tumor cell aggregates were isolated and embedded in Matrigel (BD Biosciences). For spheroid culture of intestinal tumors, advanced DMEM/F-12 (Invitrogen) supplemented with 50 ng/ml mouse EGF, 100 ng/ml Noggin (all from PeproTech), penicillin/streptomycin, 10 mM HEPES, GlutaMAX, and 1× B-27 (all from Invitrogen) was added to each well. Tumor spheroids were cultured for 5 days before the analysis. Serial changes in spheroid sizes were determined based on a comparison with the spheroid size on day 0 of the analyses. Trichostatin A (0, 100, and 200 nM final concentration; Sigma-Aldrich) and nutlin-3a (0, 10, and 20 μM final concentration; Sigma-Aldrich) were added to the cultures, and the medium was changed every other day. To examine the enlargement of tumor spheroids, we randomly selected 10 tumor spheroids established from ApcMin and ApcMin; Villin-Nrdc mice, and determined the sections with greatest diameters from serial sections. Subsequently, the number of cells in each tumor spheroid was counted.
Statistics.
Results are presented as the mean values ± standard deviation (SD) or standard error (SE) unless otherwise stated. Differences between treatments, groups, and strains were analyzed using paired or unpaired 2-tailed Student’s t test for 2 groups or 1-way ANOVA (post hoc Tukey or Tukey-Kramer test) for multiple groups. Survival rates were estimated by the Kaplan-Meier method and compared using the log-rank test. A P value less than 0.05 was considered statistically significant.
Study approval.
In this study, written informed consent was obtained from all patients with the protocol approved by the Ethics Committee of Kyoto University. All animal experiments were performed in accordance with institutional guidelines, and the Review Board of Kyoto University granted an ethical permission for this study.
Author contributions
K. Kanda, JS, EN, and HS designed the studies and wrote the manuscript. Y. Matsumoto, K. Ikuta, NG, Y. Morita, MO, KN, YK, YN, K. Ikegami, TY, AF, and AI performed experiments and were involved in data analysis. K. Kawada and YS were involved in analyses using human subjects. KE generated fetal liver chimeric mice. MY, TK, and TC supervised all studies.
Acknowledgments
This work was supported in part by Grants-in-Aid KAKENHI (25112707, 26293068, 26293173, 26116715, 16J09377, 16K09394, 16K15216, 16K15427, 17H04048, 17K09575, 17K16147, and 17H04157) and Project for Cancer Research and Therapeutic Evolution (P-CREATE) from the Japan Agency for Medical Research and Development. It was also supported by Health Labour Sciences Research Grants from the Ministry of Health, Labour and Welfare (The development of innovative therapeutic drug for the intractable inflammatory bowel disease/Comprehensive Research on Lifestyle-Related Diseases including Cardiovascular Diseases and Diabetes Mellitus); the Kobayashi Foundation for Cancer Research; the Naito Foundation; Princess Takamatsu Cancer Research Fund 13-24514; the Takeda Science Foundation; the Uehara Memorial Foundation; and the Ono Medical Research Foundation.
Version 1. 04/19/2018
Electronic publication
Footnotes
Conflict of interest: The authors have declared that no conflict of interest exists.
Reference information: JCI Insight. 2018;3(8):e91316. https://doi.org/10.1172/jci.insight.91316.
Contributor Information
Keitaro Kanda, Email: kssrkan@kuhp.kyoto-u.ac.jp.
Jiro Sakamoto, Email: jirosaka@kuhp.kyoto-u.ac.jp.
Yoshihide Matsumoto, Email: matkyoto@kuhp.kyoto-u.ac.jp.
Kozo Ikuta, Email: kikuta@kuhp.kyoto-u.ac.jp.
Norihiro Goto, Email: norihiro@kuhp.kyoto-u.ac.jp.
Yusuke Morita, Email: ysmorita@kuhp.kyoto-u.ac.jp.
Mikiko Ohno, Email: moono@kuhp.kyoto-u.ac.jp.
Kiyoto Nishi, Email: knishi@kuhp.kyoto-u.ac.jp.
Koji Eto, Email: kojieto@cira.kyoto-u.ac.jp.
Yuto Kimura, Email: yuto@kuhp.kyoto-u.ac.jp.
Yuki Nakanishi, Email: yuki@kuhp.kyoto-u.ac.jp.
Kanako Ikegami, Email: kanako_ikegami@yahoo.co.jp.
Takaaki Yoshikawa, Email: tk_yoshi@kuhp.kyoto-u.ac.jp.
Akihisa Fukuda, Email: fukuda26@kuhp.kyoto-u.ac.jp.
Kenji Kawada, Email: kkawada@kuhp.kyoto-u.ac.jp.
Yoshiharu Sakai, Email: ysakai@kuhp.kyoto-u.ac.jp.
Akihiro Ito, Email: akihiro-i@riken.jp.
Minoru Yoshida, Email: yoshidam@riken.jp.
Takeshi Kimura, Email: taketaka@kuhp.kyoto-u.ac.jp.
Tsutomu Chiba, Email: chiba@kuhp.kyoto-u.ac.jp.
Eiichiro Nishi, Email: nishi@kuhp.kyoto-u.ac.jp.
Hiroshi Seno, Email: seno@kuhp.kyoto-u.ac.jp.
References
- 1.Cancer Genome Atlas Network Comprehensive molecular characterization of human colon and rectal cancer. Nature. 2012;487(7407):330–337. doi: 10.1038/nature11252. [DOI] [PMC free article] [PubMed] [Google Scholar]
- 2.Fearon ER. Molecular genetics of colorectal cancer. Annu Rev Pathol. 2011;6:479–507. doi: 10.1146/annurev-pathol-011110-130235. [DOI] [PubMed] [Google Scholar]
- 3.Vogelstein B, Papadopoulos N, Velculescu VE, Zhou S, Diaz LA, Kinzler KW. Cancer genome landscapes. Science. 2013;339(6127):1546–1558. doi: 10.1126/science.1235122. [DOI] [PMC free article] [PubMed] [Google Scholar]
- 4.Hagelkruys A, Sawicka A, Rennmayr M, Seiser C. The biology of HDAC in cancer: the nuclear and epigenetic components. Handb Exp Pharmacol. 2011;206:13–37. doi: 10.1007/978-3-642-21631-2_2. [DOI] [PubMed] [Google Scholar]
- 5.Falkenberg KJ, Johnstone RW. Histone deacetylases and their inhibitors in cancer, neurological diseases and immune disorders. Nat Rev Drug Discov. 2014;13(9):673–691. doi: 10.1038/nrd4360. [DOI] [PubMed] [Google Scholar]
- 6. Nishi E. Nardilysin. In: Rawlings ND, Salvesen G, eds. Handbook of Proteolytic Enzymes. Cambridge, MA: Academic Press; 2013:1421–1426. [Google Scholar]
- 7.Hospital V, et al. N-arginine dibasic convertase (nardilysin) isoforms are soluble dibasic-specific metalloendopeptidases that localize in the cytoplasm and at the cell surface. Biochem J. 2000;349(Pt 2):587–597. doi: 10.1042/0264-6021:3490587. [DOI] [PMC free article] [PubMed] [Google Scholar]
- 8.Nishi E, Prat A, Hospital V, Elenius K, Klagsbrun M. N-arginine dibasic convertase is a specific receptor for heparin-binding EGF-like growth factor that mediates cell migration. EMBO J. 2001;20(13):3342–3350. doi: 10.1093/emboj/20.13.3342. [DOI] [PMC free article] [PubMed] [Google Scholar]
- 9.Hospital V, Nishi E, Klagsbrun M, Cohen P, Seidah NG, Prat A. The metalloendopeptidase nardilysin (NRDc) is potently inhibited by heparin-binding epidermal growth factor-like growth factor (HB-EGF) Biochem J. 2002;367(Pt 1):229–238. doi: 10.1042/BJ20020822. [DOI] [PMC free article] [PubMed] [Google Scholar]
- 10.Nishi E, Hiraoka Y, Yoshida K, Okawa K, Kita T. Nardilysin enhances ectodomain shedding of heparin-binding epidermal growth factor-like growth factor through activation of tumor necrosis factor-alpha-converting enzyme. J Biol Chem. 2006;281(41):31164–31172. doi: 10.1074/jbc.M601316200. [DOI] [PubMed] [Google Scholar]
- 11.Hiraoka Y, et al. Enhancement of alpha-secretase cleavage of amyloid precursor protein by a metalloendopeptidase nardilysin. J Neurochem. 2007;102(5):1595–1605. doi: 10.1111/j.1471-4159.2007.04685.x. [DOI] [PubMed] [Google Scholar]
- 12.Hiraoka Y, Yoshida K, Ohno M, Matsuoka T, Kita T, Nishi E. Ectodomain shedding of TNF-alpha is enhanced by nardilysin via activation of ADAM proteases. Biochem Biophys Res Commun. 2008;370(1):154–158. doi: 10.1016/j.bbrc.2008.03.050. [DOI] [PubMed] [Google Scholar]
- 13.Ohno M, et al. Nardilysin regulates axonal maturation and myelination in the central and peripheral nervous system. Nat Neurosci. 2009;12(12):1506–1513. doi: 10.1038/nn.2438. [DOI] [PubMed] [Google Scholar]
- 14.Ohno M, et al. Nardilysin prevents amyloid plaque formation by enhancing α-secretase activity in an Alzheimer’s disease mouse model. Neurobiol Aging. 2014;35(1):213–222. doi: 10.1016/j.neurobiolaging.2013.07.014. [DOI] [PubMed] [Google Scholar]
- 15.Kanda K, et al. Nardilysin and ADAM proteases promote gastric cancer cell growth by activating intrinsic cytokine signalling via enhanced ectodomain shedding of TNF-α. EMBO Mol Med. 2012;4(5):396–411. doi: 10.1002/emmm.201200216. [DOI] [PMC free article] [PubMed] [Google Scholar]
- 16.Kimura Y, et al. Nardilysin regulates inflammation, metaplasia, and tumors in murine stomach. Sci Rep. 2017;7:43052. doi: 10.1038/srep43052. [DOI] [PMC free article] [PubMed] [Google Scholar]
- 17.Ishizu-Higashi S, et al. Deletion of nardilysin prevents the development of steatohepatitis and liver fibrotic changes. PLoS One. 2014;9(5):e98017. doi: 10.1371/journal.pone.0098017. [DOI] [PMC free article] [PubMed] [Google Scholar]
- 18.Li J, et al. Identification and characterization of nardilysin as a novel dimethyl H3K4-binding protein involved in transcriptional regulation. J Biol Chem. 2012;287(13):10089–10098. doi: 10.1074/jbc.M111.313965. [DOI] [PMC free article] [PubMed] [Google Scholar]
- 19.Hiraoka Y, et al. Critical roles of nardilysin in the maintenance of body temperature homoeostasis. Nat Commun. 2014;5:3224. doi: 10.1038/ncomms4224. [DOI] [PMC free article] [PubMed] [Google Scholar]
- 20.Nishi K, et al. Nardilysin is required for maintaining pancreatic β-cell function. Diabetes. 2016;65(10):3015–3027. doi: 10.2337/db16-0178. [DOI] [PubMed] [Google Scholar]
- 21.Choong LY, et al. Elevated NRD1 metalloprotease expression plays a role in breast cancer growth and proliferation. Genes Chromosomes Cancer. 2011;50(10):837–847. doi: 10.1002/gcc.20905. [DOI] [PubMed] [Google Scholar]
- 22.Uraoka N, et al. NRD1, which encodes nardilysin protein, promotes esophageal cancer cell invasion through induction of MMP2 and MMP3 expression. Cancer Sci. 2014;105(1):134–140. doi: 10.1111/cas.12316. [DOI] [PMC free article] [PubMed] [Google Scholar]
- 23.Ley RE, Peterson DA, Gordon JI. Ecological and evolutionary forces shaping microbial diversity in the human intestine. Cell. 2006;124(4):837–848. doi: 10.1016/j.cell.2006.02.017. [DOI] [PubMed] [Google Scholar]
- 24.Rakoff-Nahoum S, Medzhitov R. Toll-like receptors and cancer. Nat Rev Cancer. 2009;9(1):57–63. doi: 10.1038/nrc2541. [DOI] [PubMed] [Google Scholar]
- 25.Ito A, et al. MDM2-HDAC1-mediated deacetylation of p53 is required for its degradation. EMBO J. 2002;21(22):6236–6245. doi: 10.1093/emboj/cdf616. [DOI] [PMC free article] [PubMed] [Google Scholar]
- 26.Brooks CL, Gu W. The impact of acetylation and deacetylation on the p53 pathway. Protein Cell. 2011;2(6):456–462. doi: 10.1007/s13238-011-1063-9. [DOI] [PMC free article] [PubMed] [Google Scholar]
- 27.Kruse JP, Gu W. Modes of p53 regulation. Cell. 2009;137(4):609–622. doi: 10.1016/j.cell.2009.04.050. [DOI] [PMC free article] [PubMed] [Google Scholar]
- 28.Luo J, Li M, Tang Y, Laszkowska M, Roeder RG, Gu W. Acetylation of p53 augments its site-specific DNA binding both in vitro and in vivo. Proc Natl Acad Sci USA. 2004;101(8):2259–2264. doi: 10.1073/pnas.0308762101. [DOI] [PMC free article] [PubMed] [Google Scholar]
- 29.Sato T, et al. Single Lgr5 stem cells build crypt-villus structures in vitro without a mesenchymal niche. Nature. 2009;459(7244):262–265. doi: 10.1038/nature07935. [DOI] [PubMed] [Google Scholar]
- 30.Miyoshi H, Stappenbeck TS. In vitro expansion and genetic modification of gastrointestinal stem cells in spheroid culture. Nat Protoc. 2013;8(12):2471–2482. doi: 10.1038/nprot.2013.153. [DOI] [PMC free article] [PubMed] [Google Scholar]
- 31.Luo J, Su F, Chen D, Shiloh A, Gu W. Deacetylation of p53 modulates its effect on cell growth and apoptosis. Nature. 2000;408(6810):377–381. doi: 10.1038/35042612. [DOI] [PubMed] [Google Scholar]
- 32.Tang Y, Zhao W, Chen Y, Zhao Y, Gu W. Acetylation is indispensable for p53 activation. Cell. 2008;133(4):612–626. doi: 10.1016/j.cell.2008.03.025. [DOI] [PMC free article] [PubMed] [Google Scholar]
- 33.Chen S, Yao X, Li Y, Saifudeen Z, Bachvarov D, El-Dahr SS. Histone deacetylase 1 and 2 regulate Wnt and p53 pathways in the ureteric bud epithelium. Development. 2015;142(6):1180–1192. doi: 10.1242/dev.113506. [DOI] [PMC free article] [PubMed] [Google Scholar]
- 34.Li X, Xu W. HDAC1/3 dual selective inhibitors - new therapeutic agents for the potential treatment of cancer. Drug Discov Ther. 2014;8(5):225–228. doi: 10.5582/ddt.2014.01034. [DOI] [PubMed] [Google Scholar]
- 35.Wilson AJ, et al. Histone deacetylase 3 (HDAC3) and other class I HDACs regulate colon cell maturation and p21 expression and are deregulated in human colon cancer. J Biol Chem. 2006;281(19):13548–13558. doi: 10.1074/jbc.M510023200. [DOI] [PubMed] [Google Scholar]
- 36.Zhao J, Lammers P, Torrance CJ, Bader AG. TP53-independent function of miR-34a via HDAC1 and p21(CIP1/WAF1.) Mol Ther. 2013;21(9):1678–1686. doi: 10.1038/mt.2013.148. [DOI] [PMC free article] [PubMed] [Google Scholar]
- 37.Sonnemann J, et al. p53-dependent and p53-independent anticancer effects of different histone deacetylase inhibitors. Br J Cancer. 2014;110(3):656–667. doi: 10.1038/bjc.2013.742. [DOI] [PMC free article] [PubMed] [Google Scholar]
- 38.Yagi T, et al. A novel ES cell line, TT2, with high germline-differentiating potency. Anal Biochem. 1993;214(1):70–76. doi: 10.1006/abio.1993.1458. [DOI] [PubMed] [Google Scholar]


