Abstract
Relapsed acute lymphoblastic leukemia (ALL) is associated with chemotherapy resistance and poor prognosis1. Gain-of-function mutations in the 5′-nucleotidase, cytosolic II (NT5C2) gene induce resistance to 6-mercaptopurine (6-MP) and are selectively present in relapsed ALL2,3. Yet, the mechanisms involved in NT5C2 mutation-driven clonal evolution during leukemia initiation, disease progression and relapse remain unknown. Using a conditional inducible leukemia model, we demonstrate that expression of Nt5c2 p.R367Q, a highly prevalent relapsed-ALL NT5C2 mutation, induces resistance to chemotherapy with 6-MP at the cost of impaired leukemia cell growth and leukemia-initiating cell activity. The loss of fitness phenotype of Nt5c2+/R367Q mutant cells is associated with excess export of purines to the extracellular space and depletion of the intracellular purine nucleotide pool. Consequently, blocking guanosine synthesis via inosine-5′-monophosphate dehydrogenase (IMPDH) inhibition induced increased cytotoxicity against NT5C2-mutant leukemia lymphoblasts. These results identify NT5C2 mutation-associated fitness cost and resistance to chemotherapy as key evolutionary drivers shaping clonal evolution in relapsed ALL and support a role for IMPDH inhibition in the treatment of ALL.
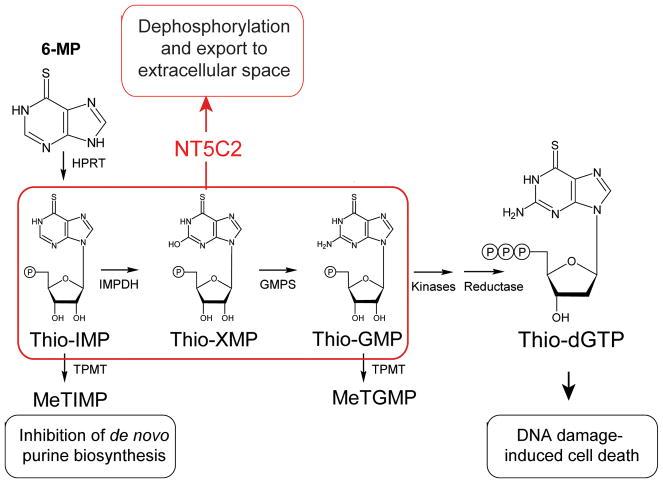
Improved support and intensified chemotherapy regimens have increased the overall survival rates of newly diagnosed pediatric ALL to over 80%1. However the outcomes of patients with relapsed or refractory ALL remain poor, with cure rates of about only 40%1. Leukemia-initiating cells capable of self-renewal4,5, protective microenvironment safe-haven niches6,7 and clonal evolution8–10 with acquisition of secondary genetic alterations driving chemotherapy resistance2,3,9–13 have all been implicated as drivers of ALL disease progression and relapse. In this context, heterozygous activating mutations in the NT5C2 nucleotidase gene are present in about 20% of relapsed pediatric T-cell ALL (T-ALL) cases2 and 3–10% of relapsed B-precursor ALLs2,3. NT5C2 (EC3.1.3.5) is a highly conserved and ubiquitously expressed enzyme responsible for catalyzing the 5′-dephosphorylation of the purine nucleotides inosine monophosphate, xanthine monophosphate and guanosine monophosphate14. This activity controls the intracellular levels of 6-hydroxypurine monophosphate nucleotides via their dephosphorylation to nucleosides, which are subsequently exported out of the cell14,15. In addition, NT5C2 metabolizes and inactivates the active metabolites that mediate the cytotoxic activity of 6-MP, a purine analog chemotherapy drug broadly used in the treatment of ALL16 (Extended Data Fig. 1). Consistently, expression of gain of function relapse-associated mutant forms of NT5C2 can induce resistance to 6-MP in vitro2,3.
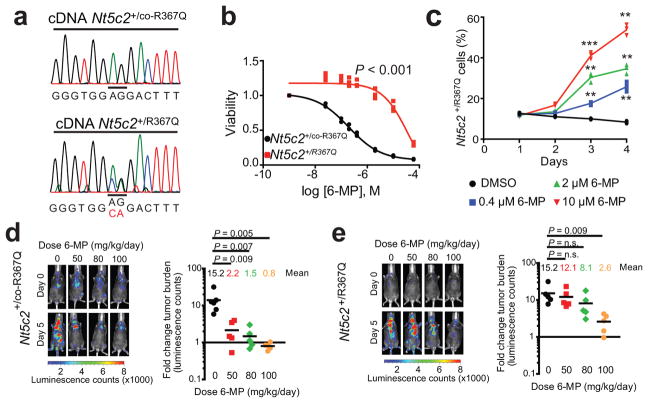
Genomic profiling of matched diagnosis and relapsed ALL samples support that cellular competition and chemotherapy resistance work as dynamic evolutionary forces shaping the clonal architecture of ALL8–10. To formally test this model we generated a knock-in mouse model (Nt5c2+/co-R367Q) for conditional expression of Nt5c2R367Q (Extended Data Fig. 2), the most common NT5C2 mutation found in relapsed ALL2,3, and generated primary NOTCH1-induced Rosa26+/CreERT2 Nt5c2+/co-R367Q T-ALL tumors17,18 (Extended Data Fig. 2) with conditional tamoxifen-inducible expression of the Nt5c2R367Q allele (Fig. 1a and Extended Data Fig. 2). Treatment of isogenic Nt5c2 wild type (Nt5c2+/co-R367Q, vehicle-treated) and Nt5c2R367Q mutant (Nt5c2+/R367Q, 4-hydroxy-tamoxifen-treated) leukemia cells with increasing concentrations of 6-MP showed overt resistance to thiopurine chemotherapy specifically in Nt5c2+/R367Q mutant cells (Fig. 1b). Moreover, Nt5c2+/R367Q mutant cells were positively selected in a dose-dependent manner over isogenic Nt5c2+/co-R367Q wild type tumor cells under 6-MP treatment in vitro (Fig. 1c). Consistently, in vivo treatment of mice harboring isogenic Nt5c2+/co-R367Q (vehicle treated, wild type group) or Nt5c2+/R367Q (tamoxifen treated, mutant group) leukemias with 6-MP documented dose dependent response to 6-MP of Nt5c2+/co-R367Q wild type tumors and overt resistance with progression under therapy over a broad range of 6-MP doses in Nt5c2+/R367Q mutant leukemias (Fig. 1d,e and Extended Data Fig. 2). Moreover, treatment with 6-MP of mixed tumor populations of isogenic wildtype Nt5c2+/co-R367Q and mutant Nt5c2+/R367Q lymphoblasts demonstrated positive selection in vivo of cells harboring the Nt5c2R367Q mutant allele (Extended Data Fig. 2). These results support a direct role for NT5C2 R367Q as a driver of 6-MP resistance in vivo and are concordant with the strong association of NT5C2 mutations with early relapse and progression during 6-MP maintenance therapy in the clinic2,3.
Figure 1. Expression of Nt5c2R367Q in NOTCH1-induced mouse ALL induces resistance to 6-MP.
a, cDNA sequencing chromatograms of Nt5c2+/co-R367Q wild type and Nt5c2+/R367Q R367Q-expressing isogenic T-ALL cells. b, Cell viability of isogenic Nt5c2+/co-R367Q and Nt5c2+/R367Q T-ALLs treated with 6-MP (n=3 biological replicates). c, Percentage of Nt5c2+/R367Q T-ALL cells in a mixed culture with isogenic Nt5c2+/co-R367Q cells treated with 6-MP (n=3 biological replicates). d, Tumor burden in mice allografted with Nt5c2+/co-R367Q leukemia cells treated with 6-MP (n = 6 mice in the vehicle group and 5 per treatment group). e, Analysis of mice allografted with isogenic Nt5c2+/R367Q tumor cells treated as in d (n=5 mice per group). P values were calculated using two-tailed Student’s t-test. ** P ≤0.01, *** P ≤0.001. Data in a, b show representative results from >2 experiments.
Recent genomic studies of matched diagnostic and relapsed ALL samples support the notion that relapsed leukemia emerges from the expansion of pre-existing resistant populations present as minor subclones at the time of diagnosis19. To further evaluate the role of NT5C2 as a driver of clonal progression and relapse in ALL, we used ultra-deep sequencing with unique molecular identifier barcoding (4,100x) to analyze the presence of NT5C2 mutations in 14 diagnostic DNA samples from cases showing acquired NT5C2 mutations at relapse. Notably, these analyses (1:1,000 sensitivity) failed to detect the corresponding relapse-associated NT5C2 mutant allele at diagnosis (Extended Data Table 1). Competitive allele-specific quantitative PCR (n=9) (1:1,000 sensitivity) yielded similar negative results (Extended Data Table 1). Moreover, in one case bearing the NT5C2 R39Q mutation at the time of relapse, droplet PCR analysis (1:20,000 sensitivity) detected the presence of this mutation during complete remission 37 days prior the emergence of clinical relapse (Extended Data Table 1). Before then and at diagnosis, the signal for this mutation (0.00064%) was below the established sensitivity of the assay (0.005%). In a separate case we detected a NT5C2 P414A mutation in first relapse and a second NT5C2 R39Q variant in second relapse. In this patient, the NT5C2 P414A mutation was not detectable by droplet PCR analysis at time of diagnosis, while the NT5C2 R39Q allele was detected below the 0.005% detection threshold at 0.0024–0.0031% frequency. However, analysis of bone marrow at the time of first relapse detected a NT5C2 R39Q subclonal population (0.0058%) in addition to the NT5C2 P414A clone. These NT5C2 R39Q mutant cells expanded (0.0224%) in a serial sample obtained in second complete remission 60 days later, as the NT5C2 P414A mutant clone decreased, becoming clonal 50 days later at the time of second relapse (Extended Data Table 1). These results suggest that NT5C2 mutations can be detected in complete remission samples prior to relapse, yet, if present in the clonal repertoire at diagnosis, they represent quantitatively minor populations below the sensitivity of molecular assays.
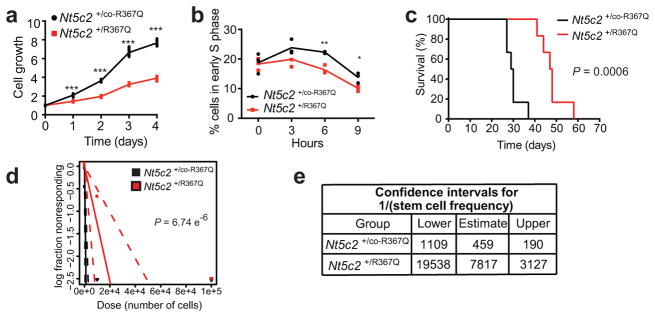
Resistance-driving mutations have been linked to enhanced leukemia growth and proliferation, clonal expansion at early stages of tumor development and increased leukemia stem cell activity20–22. However, studies of resistance to bacterial antibiotics have uncovered frequent examples of evolutionary trade-offs in which the acquisition of drug resistance is coupled with a reduced fitness phenotype23. In this context, we noted that in the absence of chemotherapy, Nt5c2+/R367Q tumor cells showed decreased proliferation in vitro, a delayed entry into the S phase of the cell cycle (Fig. 2a and b) and delayed tumor progression in vivo compared with Nt5c2+/co-R367Q wild type isogenic controls (Fig. 2c). Moreover, limiting dilution transplantation assays demonstrated a 17-fold reduction of leukemia-initiating cell activity in Nt5c2+/R367Q tumor cells (Fig. 2d–e and Extended Data Table 2). Of note, allele expression analysis of tumors recovered from mice transplanted with Nt5c2+/R367Q leukemia lymphoblasts showed decreased expression of the mutant Nt5c2 transcripts, suggesting downregulation of the Nt5c2R367Q mutant allele during tumor progression in the absence of 6-MP (Extended Data Fig. 3). These results support that Nt5c2R367Q imposes a significant fitness cost to leukemia lymphoblasts.
Figure 2. Nt5c2R367Q expression impairs proliferation and leukemia initiating cell activity in ALL.
a, In vitro cell growth of isogenic Nt5c2+/co-R367Q wild type and Nt5c2+/R367Q mutant mouse T-ALLs (n=3 biological replicates). b, Cell cycle progression of Nt5c2+/co-R367Q and Nt5c2+/R367Q mouse T-ALLs (n=3 biological replicates). c, Kaplan-Meier survival curve of mice harboring Nt5c2+/co-R367Q and Nt5c2+/R367Q isogenic leukemias (n=6 per group). d, Leukemia initiating cell analysis in mice bearing Nt5c2+/co-R367Q or isogenic Nt5c2+/R367Q leukemia cells (n=6 mice per group). e, Confidence intervals showing 1/(stem cell frequency) (n=6 mice per group) based on d. P values in a and b were calculated using two-tailed Student’s t-test. * P ≤0.05, ** P ≤0.005, *** P ≤0.001. P value in c was calculated with a two-sided Log-rank test. Data in a, b show representative results from >2 experiments.
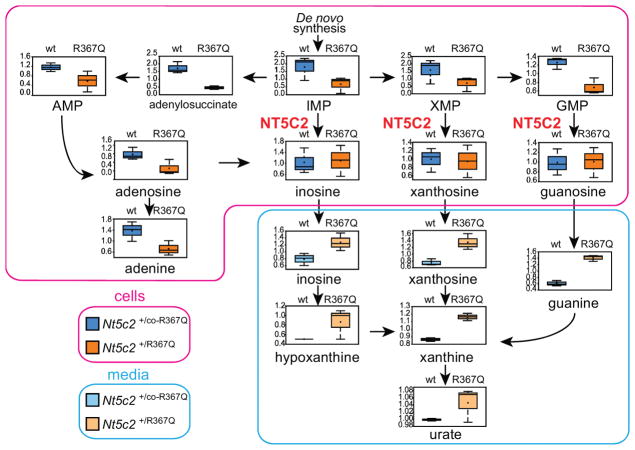
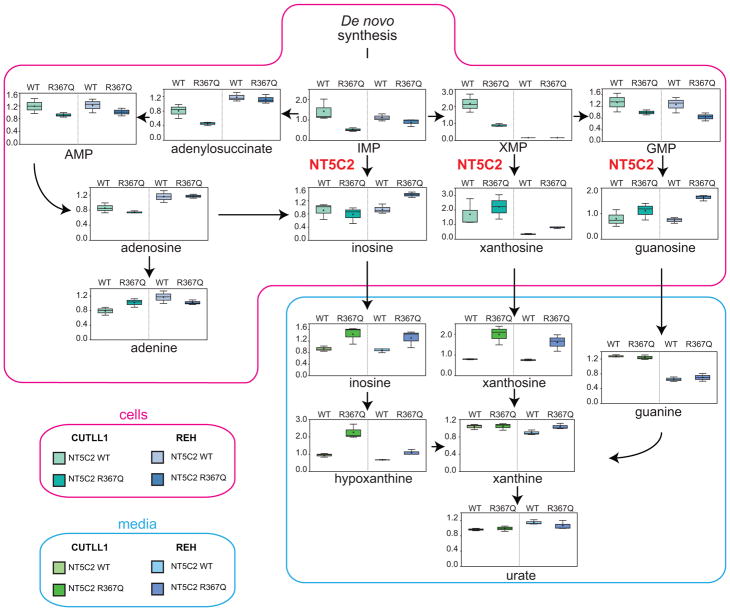
Given the role of NT5C2 in the degradation and export of purine nucleotides15 we examined whether imbalances in the intracellular purine nucleotide pool could mediate the loss-of-fitness phenotype observed in Nt5c2+/R367Q mutant leukemia cells. Broad-based metabolomic analysis showed that NT5C2 activation in Nt5c2+/R367Q ALL lymphoblasts leads to decreased intracellular levels of NT5C2 substrates (IMP, XMP and GMP) and accumulation in the conditioned media of downstream nucleotide products and their metabolites (inosine, hypoxanthine, xanthosine, xanthine, guanine and uric acid) (Fig. 3 and Supplementary Tables 1 and 2). Similarly, expression of NT5C2 p.R367Q in human T-ALL (CUTLL1) and B precursor ALL (REH) cell lines resulted in depletion of intracellular purine nucleotides and increased levels of purine metabolites in the culture media (Extended Data Fig. 4 and Supplementary Tables 3 and 4). Increased extracellular purine metabolites are consistent with the described activity of NT5C2 in promoting export of purine nucleotides15, which might result in potential non-cell autonomous satellite effects modulating nucleotide metabolism and 6-MP response in by-standing NT5C2 wild type cells.
Figure 3. Nt5c2R367Q decreases the intracellular purine nucleoside pool and increases secretion of purines in ALL cells.
Diagram of the purine de novo biosynthesis and salvage pathways, showing GC/MS and LC/MS/MS metabolic profiles (mass spectrometry scaled intensity, arbitrary units) of Nt5c2+/co-R367Q wild type and Nt5c2+/R367Q mutant isogenic primary murine T-ALL cells and their corresponding conditioned media (n=3 biological replicates). Box plots represent the upper quartile to lower quartile distribution. + Sign indicates mean value and horizontal line the median value. Whiskers indicate the maximum and minimum values.
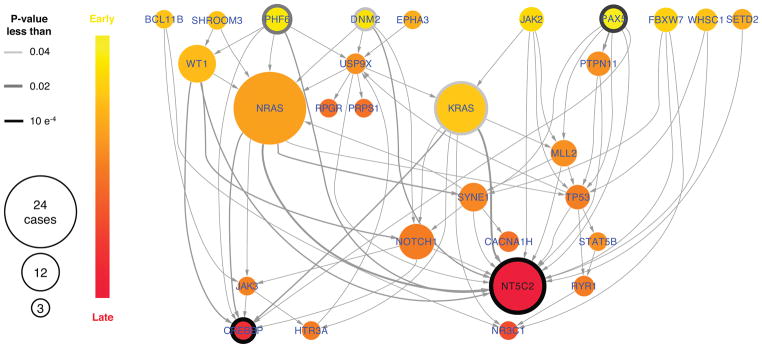
A corollary of these findings is that because of this metabolic imbalance, gain-of-function Nt5c2 mutations could be negatively selected during ALL tumor initiation and early disease progression, a time when clonal evolution is driven primarily by competition for microenvironment resources with normal hematopoietic stem and progenitor cells first, and then between different leukemia clones24. Consistent with this model, Integrated Sequential Network (ISN)25 analysis of mutation dynamics from diagnostic and relapse mutation data identified NT5C2 mutations as late events in the clonal evolution of ALL (Extended Data Fig. 5).
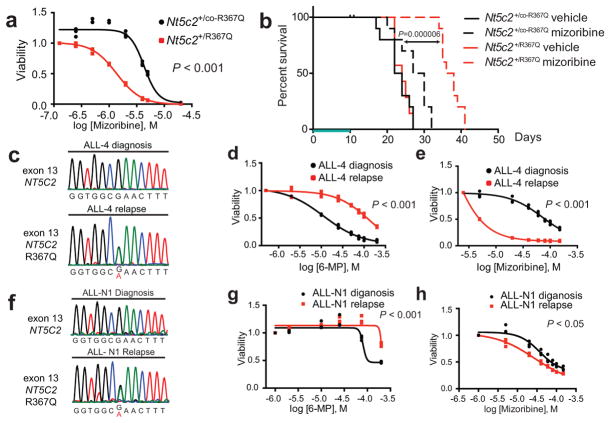
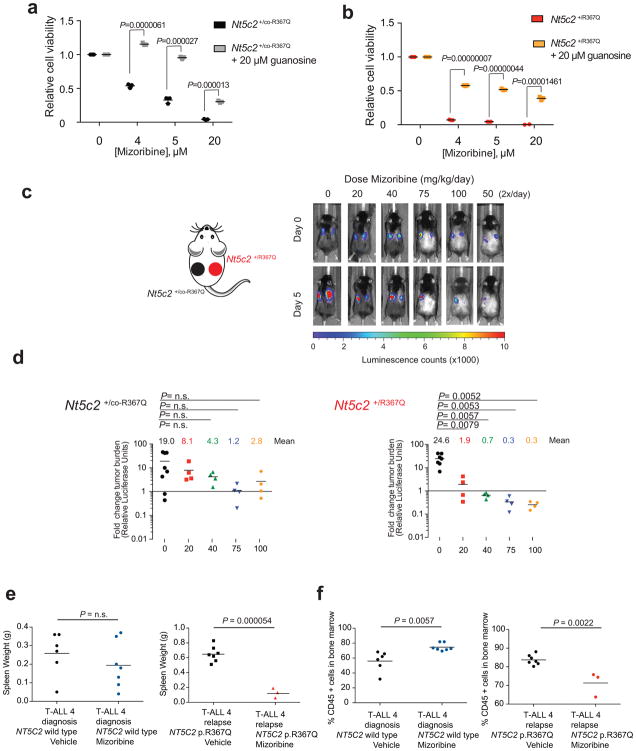
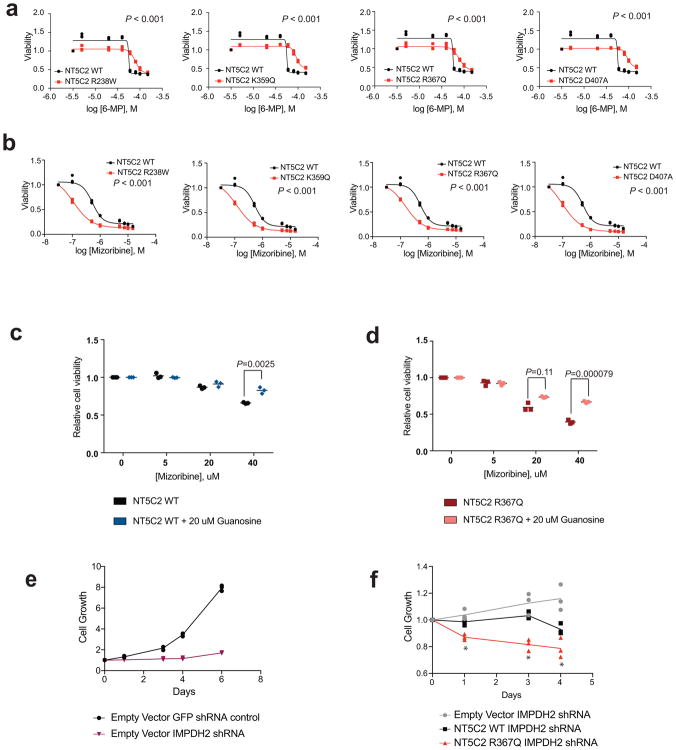
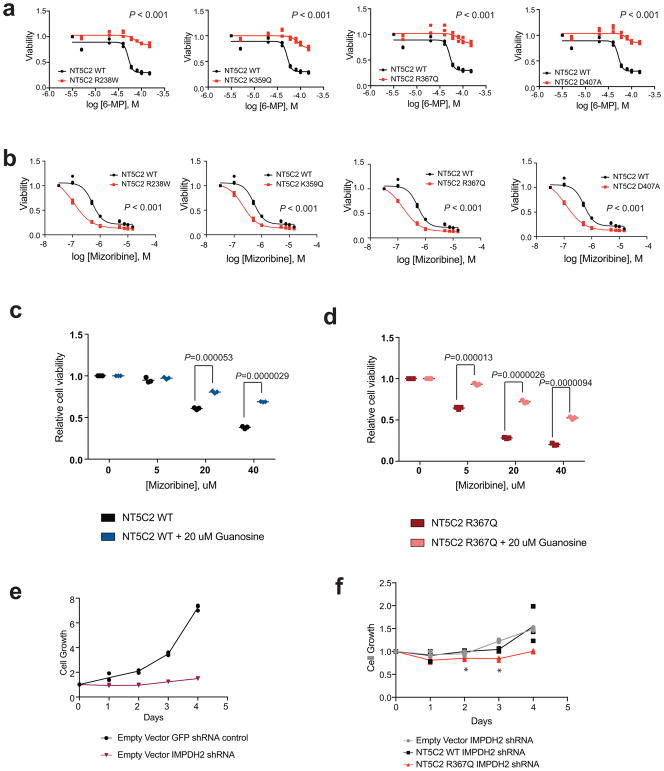
We hypothesized that gain-of-function relapse-associated NT5C2 mutations could result in increased leukemia dependence on purine synthesis rendering leukemia lymphoblasts more sensitive to drugs targeting this pathway. Indeed, acquired drug resistance in bacteria can be accompanied by collateral sensitivity to an alternative antibiotic agent23. To test this possibility, we analyzed the response of Nt5c2+/co-R367Q wild type and isogenic Nt5c2+/R367Q mutant ALL lymphoblasts to mizoribine, an inhibitor of IMPDH, a rate-limiting enzyme required for the synthesis of guanine nucleotides26. Notably, these experiments demonstrated significantly increased sensitivity to mizoribine in Nt5c2+/R367Q mutant leukemia cells in vitro compared to Nt5c2+/co-R367Q wild type isogenic controls (Fig. 4a and Extended Data Fig. 6). Of note, guanosine supplementation in the media rescued the effects of mizoribine in Nt5c2+/co-R367Q wild type and Nt5c2+/R367Q mutant lymphoblasts, supporting a mechanistic role for nucleotide depletion on the activity of this drug and its synthetic lethal interaction with the Nt5c2R367Q allele (Extended Data Fig. 6). Similar differential responses to mizoribine in Nt5c2+/co-R367Q wild type and in Nt5c2+/R367Q mutant cells were observed in vivo in a subcutaneous lymphoma model (Extended Data Fig. 6). Consistently, treatment of Nt5c2+/R367Q leukemia bearing mice with mizoribine induced a marked in vivo anti-leukemic response, with significantly improved survival compared with isogenic Nt5c2+/co-R367Q wild type controls (P<0.0001) (Fig. 4b). Similarly, expression of gain-of-function relapsed-associated NT5C2 mutations (NT5C2 p.R238W, p.K359Q, p.R367Q and p.D407A) in CUTLL1 and REH ALL cells induced resistance to 6-MP and increased their sensitivity to mizoribine (Extended Data Figs. 7 and 8). As before, guanosine supplementation ameliorated the antileukemic effects of mizoribine in this experiment in support of a nucleotide depletion mechanism of action for this drug (Extended Data Figs. 7 and 8). Additionally, knockdown of IMPDH2, the main IMPDH isoform expressed in proliferating tissues and tumor cells, showed decreased cell growth in REH and CUTLL1 ALL NT5C2 p.R367Q-expressing cells compared to wild type NT5C2 expressing lymphoblasts (Extended Data Figs. 7 and 8). Consistently, we also observed resistance to 6-MP but increased sensitivity to mizoribine in two human primary xenograft NT5C2 p.R367Q mutant leukemia cells compared with the corresponding NT5C2-wild type diagnosis-derived ALL blasts (Fig. 4c–h). Moreover, immunodeficient mice transplanted with a NT5C2 p.R367Q relapse-patient derived xenograft showed decreased tumor burden and tumor infiltration following mizoribine treatment compared to mice transplanted with matched NT5C2 wild type diagnosis derived xenograft cells (Extended Data Fig. 6). These results document fitness cost and acquired resistance to 6-MP as evolutionary forces that drive the clonal evolution dynamics and selection of relapse-associated NT5C2 mutations in ALL, highlight the relevance of nucleotide export in control of nucleotide homeostasis27 and in the context of antimetabolite therapy28 and identify collateral sensitivity to IMPDH inhibition as a potentially relevant vulnerability in NT5C2 mutant leukemia.
Figure 4. Collateral sensitivity to IMPDH inhibition in NT5C2 R367Q mutant tumor cells.
a, Cell viability of isogenic Nt5c2+/co-R367Q wild type and Nt5c2+/R367Q mutant T-ALLs treated with mizoribine (n=3 biological replicates). b, Kaplan-Meier survival curve of mice harboring Nt5c2+/co-R367Q and Nt5c2+/R367Q isogenic leukemias (n=10 mice per group) treated with mizoribine or vehicle (green bar). c,f, DNA sequencing chromatograms corresponding to matched primary human diagnosis (NT5C2 wild type) and relapsed (NT5C2 p.R367Q) T-ALL xenografts. d,g, Cell viability in samples evaluated in c,f showing resistance to 6-MP in relapsed (NT5C2 p.R367Q) T-ALL xenograft cells (n=3 biological replicates). e,g, Cell viability in samples analyzed in c,f and d,g showing collateral sensitivity to mizoribine in relapsed (NT5C2 p.R367Q) T-ALL xenograft cells (n=3 biological replicates). P values in a, d, e, g and h were calculated using two-tailed Student’s t-test. P value in b was calculated with a two-sided Log-rank test. Data in a, d, e, g, and h show representative results from >2 experiments.
METHODS
Patient samples
DNAs from leukemic ALL blasts at diagnosis and relapse and matched remission lymphocytes were provided by the Hemato-Oncology Laboratory at University of Padua, Italy; the Children’s Oncology Group, the Department of Hematology/Oncology, Saitama Children’s Medical Center, Saitama, Japan and St. Jude Children’s Research Hospital. Informed consent was obtained at study entry and samples were collected under the supervision of local Institutional Review Boards for participating institutions and analyzed under the supervision of the Columbia University Medical Center Institutional Review Board (Protocol Number: IRB-AAAB3250). Research was conducted in compliance with ethical regulations.
Cell lines and cell culture procedures
We performed cell culture in a humidified atmosphere at 37°C under 5% CO2. We harvested primary mouse tumor cells from the spleens of leukemic mice by processing spleens through a 70 μm mesh to obtain single cell suspensions and incubated cells with red blood cell lysis buffer. Tumor cells were then placed in culture in OptiMEM media supplemented with 10% fetal bovine serum (FBS), 100 U ml−1 penicillin G, 100 μg ml−1 streptomycin, 55 μM β-mercaptoethanol, 10 ng ml−1 mouse IL7 and 10 ng ml−1 human IL2. Subsequent passages of tumor cells did not include IL2. We passaged and harvested primary human xenograft T-ALL cells from the spleens of NRG mice and cultured them in RPMI media supplemented with 20% FBS, 100 U ml−1 penicillin G, 100 μg ml−1 streptomycin and 10 ng ml−1 human IL7. We purchased 293T cells for viral production and REH cells from American Type Culture Collection. The CUTLL1 cell line, which was generated by continuous culture of a T-cell lymphoblastic pleural effusion cells from a patient at relapse, has been characterized and reported before29. We grew 293T cells in DMEM media supplemented with 10% FBS, 100 U ml−1 penicillin G and 100 μg ml−1 streptomycin for up to two weeks. We cultured CUTLL1 and REH cells in RPMI-1640 media supplemented with 10% FBS, 100 U ml−1 penicillin G and 100 μg ml−1 streptomycin. Cell lines were regularly authenticated and tested for mycoplasma contamination.
Drugs
We purchased tamoxifen, guanosine, 4-hydroxytamoxifen, 6-mercaptopurine (6-MP) and mizoribine from Sigma-Aldrich. For in vitro assays we dissolved 4-hydroxytamoxifen in 100% ethanol, guanosine in DMSO, 6-MP in DMSO and mizoribine in phosphate buffer solution (PBS). For in vivo studies we resuspended 100 mg tamoxifen in 100 μL of ethanol and added corn oil to reach a final concentration of 3 mg/100 μl. We then rotated the tamoxifen suspension for 1 hour at 55°C and froze in aliquots at −20°C. We administered tamoxifen as a single 100 μl intraperitoneal injection per mouse. For intraperitoneal injections of 6-MP we prepared frozen aliquots of 5 mg ml−1 6-MP in 0.1 N NaOH and immediately prior to each round of treatment we prepared fresh final solutions of 6-MP by buffering the stock solution down to pH 8 with 0.2 M NaH2PO4. This resulted in a 6-MP concentration of 3.48 mg ml−1, which we diluted to various final concentrations using a solution made from 0.05 N NaOH and 0.2 M NaH2PO4 adjusted to pH 8. We administered 6-MP as 25 mg kg−1 b.i.d, 40 mg kg−1 b.i.d and 50 mg kg−1 b.i.d. We prepared vehicle by dissolving 0.254 g NaCl in 50 ml 0.05 N NaOH and adjusting the pH to 8 with 0.2 M NaH2PO4. For intraperitoneal injections we dissolved mizoribine (TCI America and Toronto Research Chemicals) in PBS at 10 mg ml−1 or 15 mg ml−1 and froze aliquots to be thawed prior to treatment. We adjusted injection volume to correct for any differences in weight between individual mice.
Plasmid and vectors
We obtained MigR1_Δ-E NOTCH1_GFP from R. Kopan (Cincinnati Children’s Hospital Medical Center, University of Cincinnati), sh-TURBOGFP and pLKO.1_IMPDH2_shRNA (clone ID: NM_000884.1-360s1c1) from Sigma Aldrich’s Mission shRNA library, and FUW-mCherry-Puro-Luc from30. We generated the NT5C2 p.R238W, p.K359Q, p.R367Q and p.D407A mutations in the pLOC-NT5C2 plasmid2 by site directed mutagenesis using the QuikChange II XL Site-Directed Mutagenesis kit (Stratagene) according to the manufacturer’s instructions.
Retroviral and lentiviral infections
We transfected retroviral or lentiviral plasmids together with gag-pol (pCMV ΔR8.91) and V-SVG (pMD.G VSVG) expressing vectors into 293T cells using JetPEI transfection reagent (Polyplus). We collected viral supernatants after 48 h and used them to infect mouse bone marrow progenitors, human cell lines, or primary tumor cells by spinoculation with 4 μg mL−1 Polybrene Infection/Transfection Reagent (Fisher Scientific). We selected infected primary mouse tumor cells or human cell lines with 1 mg ml−1 blasticidin (InvivoGen) for 14 days.
Mice and animal procedures
We maintained all animals in specific pathogen-free facilities at the Irving Cancer Research Center at Columbia University Medical Campus. The Columbia University Institutional Animal Care and Use Committee (IACUC) approved all animal procedures. Animal experiments were conducted in compliance with all relevant ethical regulations. Animals were euthanized upon showing symptoms of clinically overt disease (do not feed, lack of activity, abnormal grooming behavior, hunch back posture) or excessive weight loss (10–15% body weight loss over a week) and prior to reaching the maximum permitted tumor burden of 90% blasts in the bone marrow. To generate conditional Nt5c2 p.R367Q knock-in mice we used homologous recombination in C57BL/6 embryonic stem cells to introduce the R367Q point mutation (AG→CA) in exon 14 [two nucleotide changes were introduced to replace the mouse R367 codon (AGA) with a glutamine coding codon (CAA)] as well as a LoxP-flanked wild type mini-gene cassette (1958 bp) inserted 233 bp upstream of exon 14, composed of the fusion of exons 14–18 and flanking genomic sequences upstream of exon 14 and downstream of exon 18. Immediately downstream of the mini-gene we introduced a FRT-flanked neomycin selection cassette. We generated chimeras in C57BL/6 albino blastocysts using three independent targeted embryonic stem cell clones identified by PCR analysis and verified by Southern blot. We verified germline transmission in the offspring of highly chimeric male mice crossed with C57BL/6 females. To remove the neomycin selection cassette we crossed mice harboring the targeting construct with a Flp germline deleter line (B6;SJL-Tg(ACTFLPe)9205Dym/J, the Jackson Laboratory) and crossed the resulting mice with wild type C57BL/6 to breed out the Flp allele. To generate inducible knock-in mice we bred animals harboring the Nt5c2co-R367Q allele with Rosa26+/CreERT2 mice, which express a tamoxifen-inducible form of the Cre recombinase from the ubiquitous Rosa26 locus 31.
To generate NOTCH1-induced T-ALL tumors in mice, we performed retroviral transduction of bone marrow cells (from Rosa26+/CreERT2 Nt5c2+/co-R367Q mice) enriched in Lineage negative cells isolated using magnetic beads (Lineage Cell Depletion Kit, Miltenyi Biotec) with retroviruses expressing an activated form of the NOTCH1 oncogene (ΔE-NOTCH1)17 and the green fluorescent protein (GFP) and transplanted them via intravenous injection into lethally irradiated isogenic recipients (6–8 week old C57BL/6 females, Taconic Farms) as previously described18,32.
We assessed T-ALL tumor development by monitoring CD4+ CD8+ GFP+ cells in peripheral blood by flow cytometry. Briefly, we incubated blood samples with red blood cell lysis buffer (155 mM NH4Cl; 10 mM KHCO3; 0.1 mM EDTA) for 3 × 5 min at room temperature before staining with APC-Cy7-conjugated antibodies against mouse CD4 (BD Pharmingen-552051) and PE-Cy7-conjugated antibodies against mouse CD8a (eBioscience-25-0081-82). Flow cytometry analyses were performed in a FACSCanto flow cytometer (BD Biosciences) and analyzed with Flowjo software (FlowJo LLC).
For all subsequent in vivo studies, we harvested fresh Rosa26+/CreERT2 Nt5c2+/co-R367Q T-ALL tumor cells from the spleens of donor mice and transplanted them into sublethally irradiated (4 Gy) secondary recipients (C57BL/6 females, 6–8 weeks old, Taconic Farms). Animals were randomly assigned to different treatment groups and no blinding was done. For survival and leukemia initiating cell experiments, two days following transplantation we treated mice with tamoxifen (3 mg via intraperitoneal injection) to induce mini-gene deletion and expression of Nt5c2R367Q in the leukemic cells, or with corn oil vehicle in the control group (n=6 mice per group). Mice were then observed for incidence and time of onset of leukemia.
To detect tamoxifen-inducible mini-gene deletion, we purified DNA from primary Rosa26+/CreERT2 Nt5c2+/co-R367Q mouse tumor cells treated with 1 μM 4-hydroxytamoxifen or ethanol vehicle (in vitro) and tamoxifen or corn oil vehicle (in vivo) and PCR-amplified in a three-primer reaction: (i) the minigene cassette (primer immediately upstream of proximal LoxP site and reverse primer in exon 17) and (ii) the deleted mini-gene and wild type alleles (primer immediately upstream of proximal LoxP site and reverse primer in intron 14). The deleted and wild type alleles differ by the size of the remaining LoxP site (49 bp). We visualized PCR products resolved by electrophoresis in a 1.5% agarose gel with ethidium bromide.
To detect tamoxifen-inducible expression of Nt5c2 p.R367Q mRNA, we purified total RNA from mouse tumor cells with the RNeasy kit (Qiagen), prepared complementary DNA (cDNA) by reverse transcription using the SuperScript First-Strand Synthesis System for RT-PCR (Invitrogen) and PCR amplified the Nt5c2 exon 14 cDNA region using primers spanning neighboring exons following standard procedures. We analyzed the resulting PCR products by dideoxy DNA sequencing to verify the expression of the engineered Nt5c2 p.R367Q nucleotide substitutions.
For experimental therapeutics treatment studies, we used Rosa26+/CreERT2 Nt5c2+/co-R367Q T-ALL tumor cells infected with lentiviral particles expressing the red cherry fluorescent protein and luciferase (FUW-mCherry-Luc-puro). We transplanted luciferased Rosa26+/CreERT2 Nt5c2+/co-R367Q T-ALL tumor cells into C57BL/6 recipients by intravenous injection and monitored tumor development by in vivo luminescence bioimaging with the In Vivo Imaging System (IVIS, Xenogen) and by flow cytometry via analysis of GFP+ cells in peripheral blood. Once mice had 50% GFP positive cells in the peripheral blood and a detectable baseline tumor burden by bioluminescence, we treated them with tamoxifen (3 mg, intraperitoneal injection) or corn oil vehicle as described above. Two days later we initiated treatment with a range of doses of 6-MP (0, 50, 80, 100 mg kg−1 per day) via intraperitoneal injection for 5 consecutive days (n=5 mice per group). We monitored disease progression and response to chemotherapy by bioluminescence imaging on days 0, 3 and 6 after start of 6-MP treatment. We sacrificed mice on day 6 and analyzed GFP+ tumor infiltration in the spleen by flow cytometry. To assess mizoribine response in vivo we treated Rosa26+/CreERT2 Nt5c2+/co-R367Q leukemia bearing mice 48 hours following tamoxifen or corn oil vehicle treatment (as described above) with 40 mg kg−1 mizoribine or PBS vehicle (n=10/group) via intraperitoneal injection for 10 consecutive days. Mice were then observed for incidence and time of onset of leukemia.
For experimental therapeutic treatment studies in a subcutaneous setting, Rosa26+/CreERT2 Nt5c2+/co-R367Q T-ALL tumor cells infected with lentiviral particles expressing the red cherry fluorescent protein and luciferase (FUW-mCherry-Luc-puro) were treated with 1 μM 4-hydroxytamoxifen or ethanol vehicle in vitro, mixed with equal volume of Corning Matrigel Membrane Matrix (Fisher Scientific) and injected (106 cells) into the flanks of female C57BL/6 mice. Upon detectable baseline tumor burden by bioluminescence, mice were treated intraperitoneally with PBS vehicle or mizoribine (20, 40, 75 or 100 mg kg−1 per day, n=4 per dose) for 5 consecutive days. We monitored tumor progression and response to mizoribine by bioluminescence imaging on days 0 and 6 after start of mizoribine treatment. Subcutaneous tumors were not allowed to exceed 20 mm in diameter.
To evaluate the competitive selection of Nt5c2+/R367Q cells in vivo we mixed Nt5c2+/co-R367Q wild type and Nt5c2+/R367Q mutant murine tumor cells at a 1:10, 1:100 and 1:1000 Nt5c2+/R367Q:Nt5c2+/co-R367Q ratio and transplanted into C57BL/6 recipients by intravenous injection. Ten days after transplant, mice were treated with vehicle or 50 mg kg−1 6-MP per day for 5 days, then allowed to recover for ten days and given a second round of treatment for 1–3 days. Following this second cycle of treatment, mice were euthanized and lymphoblasts were recovered from spleen samples for quantitative evaluation of Nt5c2+/R367Q mutant cells.
We generated primary human leukemia xenografts by intravenous injection of cryopreserved leukemia lymphoblasts from diagnostic and relapsed acute lymphoblastic leukemia patient samples into immunodeficient NRG (NOD.Cg-Rag1<tm1Mom> Il2rg<tm1Wjl>/SzJ, the Jackson Laboratory) mice. We infected primary leukemia xenograft cells with lentiviral particles expressing the red cherry fluorescent protein and luciferase (FUW-mCherry-Luc-puro) and transplanted matched luciferased ALL-4 diagnosis and ALL-4 relapse tumor cells into NRG immunodeficient recipients by intravenous injection and monitored tumor development by in vivo luminescence bioimaging with the In Vivo Imaging System (IVIS, Xenogen) and via analysis of human CD45+ cells in peripheral blood by flow cytometry with an APC conjugated antibody (eBioscience 17-0459-42). Upon tumor establishment, mice were treated intraperitoneally with PBS vehicle or mizoribine (100 mg kg−1 b.i.d.) for 3 consecutive days. Four animals in the relapse xenograft mizoribine treatment group did not tolerate the full course of therapy presumably because of tumor lysis syndrome and were not included in the analysis. We sacrificed mice on day 4 and analyzed spleen weight and CD45+ tumor infiltration in the bone marrow by flow cytometry.
In vitro cell viability and chemotherapy response assays
We measured cell growth and chemotherapy responses of primary mouse tumors, patient-derived xenografts, and human ALL cell lines in vitro by measurement of the metabolic reduction of the tetrazolium salt MTT using the Cell Proliferation Kit I (Roche) following the manufacturer’s instructions. We analyzed chemotherapy responses following 72-hour incubation with increasing concentrations of 6-mercaptopurine or mizoribine.
For the mixed culture experiment of isogenic Nt5c2+/co-R367Q wild type and Nt5c2+/R367Q murine tumor cells, we treated uninfected tumor cells (expressing GFP) with vehicle and treated the same tumor cells previously infected with a mCherry-expressing vector (FUW-mCherry-Luc-puro) with 4-hydroxytamoxifen and quantified proportions of the two cell populations by FACS analysis using a Fortessa flow cytometer (BD Biosciences) and analyzed data with Flowjo software (FlowJo LLC). All experiments were performed in triplicate.
Cell synchronization and cell cycle analysis
We synchronized isogenic Nt5c2+/co-R367Q wild type and Nt5c2+/R367Q murine tumor cells using a double thymidine block procedure. Briefly we incubated cells with 2 mM thymidine (Sigma Aldrich) for 16 hours, allowed to recover for 14 hours in regular media, and again incubated with 2 mM thymidine for 16 hours. We harvested cells at 0, 3, 6 and 9 hour time-points and stained them with propidium iodide (Sigma Aldrich) for cell cycle progression analysis. FACS analysis was performed using a FACSCanto flow cytometer (BD Biosciences) and we analyzed data with Flowjo software (FlowJo LLC).
Quantitative NT5C2 p.R367Q allele-specific qPCR assay
We quantitatively assessed the presence of NT5C2 R367Q in matching diagnostic and remission DNA specimens using a custom Mutation Detection Competitive Allele-Specific TaqMan PCR (castPCR) Assay (Life Technologies) using 30 ng of DNA in a reaction volume of 20 μl in a 7500 real-time PCR system (Applied Biosystems) following the manufacturer’s instructions and recommended cycling conditions. We determined a detection ΔCT cutoff value for the assay by running the NT5C2 wild type and NT5C2 R367Q assays on genomic DNA samples from three wild type cell lines and calibrated both assays by spiking in increasing concentrations of NT5C2 wild type or NT5C2 R367Q mutant plasmids respectively. We determined the NT5C2 R367Q assay sensitivity analyzing NT5C2 wild type genomic DNA samples spiked with decreasing concentrations of NT5C2 R367Q plasmid. We analyzed experimental data using the Mutation Detector Software (Life Technologies) to calculate the ΔCT value between the NT5C2 wild type and NT5C2 R367Q assay reads for each sample, and comparing these to the predetermined ΔCT cutoff value.
To quantitatively assess the presence of Nt5c2+/R367Q mutant cells in mixed tumor populations of Nt5c2+/co-R367Q wild type and Nt5c2+/R367Q lymphoblasts, we performed a quantitative analyses of Nt5c2R367Q mutant transcripts normalizing tumor content by quantitative RT-PCR analysis of GFP. In this experiment we isolated RNA from lymphoblasts with the RNeasy kit (Qiagen) and prepared complementary DNA (cDNA) by reverse transcription using the SuperScript First-Strand Synthesis System for RT-PCR (Invitrogen). Nt5c2 exon 14 was amplified using TaqMan Gene Expression Master Mix (TaqMan) and the Nt5c2R367Q allele was detected using a mutant-specific taqman probe (5′_FAM-AGGGTGGCAGACTTT-MGBNFQ_3′, ThermoFisher). β-actin and GFP were amplified using FastStart Universal SYBR Green Master (ROX) (Roche) following standard protocols. Quantitative PCR reactions were run in a 7500 Real Time PCR System (Applied Biosystems). CT values of Nt5c2R367Q and GFP were normalized to β-actin CT values and a ratio was taken of Nt5c2R367Q expression over GFP expression to represent the percent of Nt5c2R367Q mutant cells present in mixed tumor populations.
Digital Droplet PCR
Targeted ultra-deep mutation screening was performed using the digital droplet PCR technique (RainDance Technologies, Lexington, MA, USA) as described previously33. Briefly, TaqMan assay primers and probes were custom designed for NT5C2 p.P414A PrimerExpress 3.0 (Thermo Fisher Scientific, Waltham, MA, USA). Primers and probes for NT5C2 p.R39Q were designed through the Custom TaqMan® Assay Design Tool (CADT) (Life Technologies) with the support of RainDance Technologies. Probes matching the wild type allele were labeled with VIC fluorescent reporter dye and probes matching the mutant allele were labeled with FAM dye. Amplicon sizes ranged from 75bp to 120bp. Genomic DNA was sheared to 3kb using the M220 instrument (Covaris, Woburn, MA, USA) and a total of 500–1,000ng of fragmented DNA was used in each 50μl ddPCR reaction. The ddPCR reaction further contained 1X TaqMan Genotyping Master Mix (Applied Biosystems, Foster City, CA, USA), 1X dPCR droplet stabilizer (RainDance Techonologies), and 1X TaqMan primers and probes mix (Integrated DNA Technologies, Coralville, IA, USA). In line with the manufacturer’s instructions, an average of 7 million droplets were generated by the RainDrop Source instrument and emulsion PCR was performed using the C1000 Thermal Cycler (BioRad, Hercules, CA, USA). Droplet fluorescence of the amplified product was detected by the RainDrop Sense instrument and data analysis was carried out using the RainDrop Analyst II Software (RainDance Techonolgies).
To determine the detection limit of the assays, we constructed dilution curves of patient tumor cells and cells from the REH cell line. The REH cell line was confirmed wild type after Sanger sequencing for the locations targeted in the ddPCR. We collected pure populations of tumor cells by flow cytometric sorting of the relapse samples of patients SJBALL192 (containing heterozygous NT5C2 p.R39Q). We made serial dilutions of tumor cells with wild type cells (REH cell line) to generate final mutant allele frequency (MAF) levels of 50%, 5%, 0.5%, 0.05%, 0.005%, and 0.0005% and isolated DNA using phenol-chloroform. With an input of 500ng DNA in the ddPCR assay the MAFs correspond to 70,000, 7,000, 700, 70, 7, and 0.7 copies, respectively. A frequency of >0.005% (>7 copies) could be consistently detected.
Duplex Sequencing of diagnostic patient samples
Duplex Sequencing was carried out by TwinStrand Biosciences (Seattle, WA) under fully blinded conditions using methods previously described34,35. Briefly, 400 ng of extracted genomic DNA was ultrasonically sheared, A-tailed and ligated to degenerate tag-containing Duplex Adapters. The library was amplified and subjected to two successive rounds of hybrid capture with 120 BP biotinylated oligonucleotide probes tiled across exons 9, 11, 13, 15, 16 and 17 of the human NT5C2 gene and flanking sequences. Indexed libraries were pooled and sequenced on an Illumina NextSeq 500. Duplex Consensus Sequences were generated after alignment to hg38 using the requirement that error-corrected bases be supported by at least three independent reads from each original strand. The variant calls for each sample were filtered against known single nucleotide polymorphisms in the Phase 3 build of the 1000 genomes database and tabulated versus all reference base calls at the 8 codons of interest. Variant allele frequency was calculated as the number of variants per total number of error-corrected bases at each nucleotide position. The average error-corrected molecular depth at codons of interest was ~4100x (1840–8530x), yielding an average power for detecting variants at a level of 1/1000 of ~98%.
Metabolomic analyses
To analyze metabolic differences between Nt5c2+/co-R367Q and Nt5c2+/R367Q primary mouse tumors we treated tumor cells in triplicate with 1 μM 4-hydroxytamoxifen for 48 h in vitro to induce expression of the Nt5c2 p.R367Q allele or with vehicle for wild type controls, after which we diluted out the 4-hydroxytamoxifen or vehicle with media. After 72 h we harvested cells into packed 50–100 μl size pellets and collected conditioned media for analyses (n=3, cell pellets and media). We flash froze cell pellet and media samples, which were then extracted using standard solvent extraction methods and analyzed on the GC/MS and LC/MS/MS platforms by Metabolon (Morrisville, NC). Analyzed metabolites comprised a total of 459 named biochemicals in cells and 252 named biochemicals in media. We first normalized results to protein concentration, log transformed and imputed any missing values with the minimum observed value for each compound. We then used Welch’s two-sample t-test to identify biochemicals that differed significantly between experimental groups. To account for the multiple comparisons that occur in metabolomics studies we also calculated an estimate of the false discovery rate (q-value), which indicates the fraction of biochemicals that would meet a given p-value cut-off by random chance. Similar processing and analyses was performed on CUTLL1 and REH ALL cell lines expressing NT5C2 wild type or NT5C2 p.R367Q. Analyzed metabolites in these cell lines comprised a total of 596 named biochemical in cells and 347 in media.
Integrated Sequential Network (ISN) of relapsed ALL
We illustrated the sequential order of somatic mutations in relapsed ALL using the Integrated Sequential Network (ISN)25 which pools evolutionary paths across all patients. We selected recurrently mutated genes that were previously defined as drivers of pediatric ALL36–38 and relapse-genes10,39. Only nonsynonymous single nucleotide variants were used in analysis. For each patient, we generated a sequential network that defined early events as mutations observed in both primary tumor and relapsed tumor, while late events were mutations only observed in the relapsed tumor. Each node represented a gene, and each arrow pointed from a gene with an early event to a gene with a late event. The ISN then pooled sequential networks across all patients. To test whether a gene within the ISN was significantly early or late, we used the binomial test based on in-degree and out-degree of each node.
Statistical analyses
We performed statistical analysis by Student’s t-test. We considered results with P < 0.05 as statistically significant. Survival in mouse experiments was represented with Kaplan-Meier curves and significance was estimated with the log-rank test (GraphPad Prism). We analyzed serial limited dilution leukemia-initiating cell data using the ELDA software40. No outlier datapoints were excluded in the analyses.
Data availability
All data generated or analyzed during this study are included in this published article and its supplementary information files and are available from the authors on reasonable request. Somatic mutation data used to generate ISN were aggregated from the following previously published studies: Dataset S3 of Oshima et al. [doi:10.1073/pnas.1608420113], Supplementary Table 2 of Li et al. [doi:10.1038/nm.3840], and Supplementary Data 2 of Ma et al. [doi:10.1038/ncomms7604].
Extended Data
Extended Data Figure 1. Schematic representation of 6-MP activation and mechanism of action.
The hypoxanthine-guanine phosphoribosyl transferase enzyme (HPRT) processes 6-MP to thio-IMP, which is then converted to thio-XMP and thio-GMP. Subsequent metabolism of thio-GMP by kinases and reductases yields thio-dGTP which is incorporated into replicating DNA strands and triggers the DNA mismatch-repair machinery, leading to cell cycle arrest and apoptosis. The anti-leukemic effects of 6-MP are in part also attributed to a second metabolic pathway whereby thiopurine S-methyl transferase (TPMT) methylates thio-IMP to form methylthio-IMP (MeTIMP), which is a potent inhibitor of amidophosphoribosyltransferase (ATase), an enzyme catalyzing the committed step of de novo purine biosynthesis.
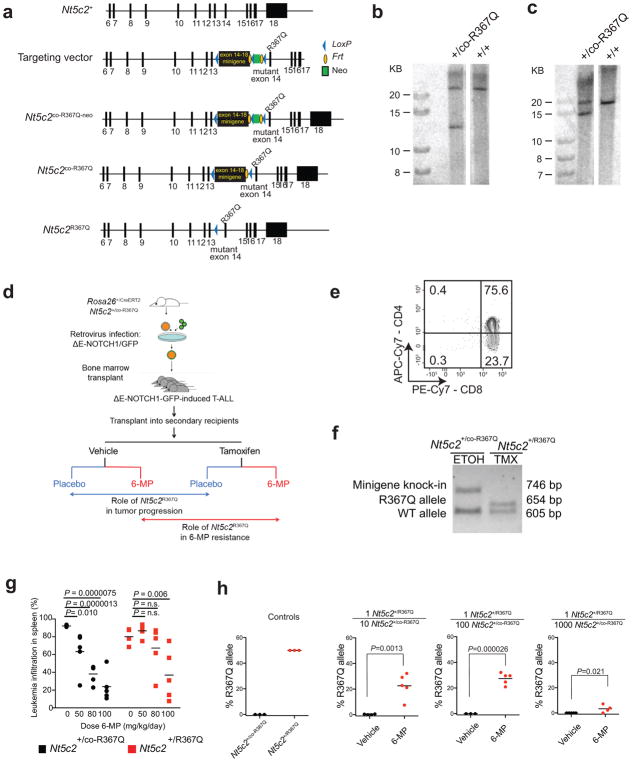
Extended Data Figure 2. Conditional knock-in targeting of Nt5c2, generation and analysis of a Nt5c2R367Q conditional inducible T-ALL model.
a, Schematic representation of the targeting strategy for generation of Nt5c2+/co-R367Q conditional knock-in mice. b, Southern blot analysis of Nt5c2+/+ and targeted Nt5c2+/co-R367Q embryonic stem cells in DNA digestions with BamHI restriction enzyme hybridized with a DNA probe external to the long arm. c, Southern blot analysis of Nt5c2+/+ and targeted Nt5c2+/co-R367Q embryonic stem cells in DNA digestions with ApaI restriction enzyme hybridized with a DNA probe in the short arm. d, Schematic depiction of the strategy for developing conditional inducible Nt5c2+/co-R367Q primary murine T-ALL tumors and for assessing the role of Nt5c2+/R367Q on leukemia progression and response to chemotherapy. e, Representative FACS plot of a Rosa26+/CreERT2 Nt5c2+/co-R367Q ΔE-NOTCH1-induced primary T-ALL tumor with a CD4+, CD8+ immunophenotype. f, Representative genotyping PCR results from genomic DNA of a Rosa26+/CreERT2 Nt5c2+/co-R367Q ΔE-NOTCH1-induced primary T-ALL tumor treated with 4-hydroxytamoxifen (TMX) or vehicle only (ethanol, ETOH) in vitro showing Cre-mediated deletion of the exon 14–18 Nt5c2 wild type mini-gene. g, Tumor burden assessed in the spleen (% GFP+ cells) in mice allografted with NOTCH1-induced Nt5c2+/co-R367Q and isogenic Nt5c2+/R367Q primary leukemia cells treated with a range of 6-MP doses (n = 5 per group). h, Analysis of Nt5c2R367Q allele assessed by qPCR in mice allografted with Nt5c2+/co-R367Q and Nt5c2+/R367Q primary mouse T-ALL cells at a 1:10, 1:100 and 1:1000 Nt5c2+/R367Q:Nt5c2+/co-R367Q dilution treated with vehicle or 6-MP (n = 5 mice per group and n=3 technical replicates for the controls). The horizontal bar represents mean values. P values were calculated using two-tailed Student’s t-test in g and a one-tailed Student’s t-test in h. Data in e and f show representative results from >2 experiments.
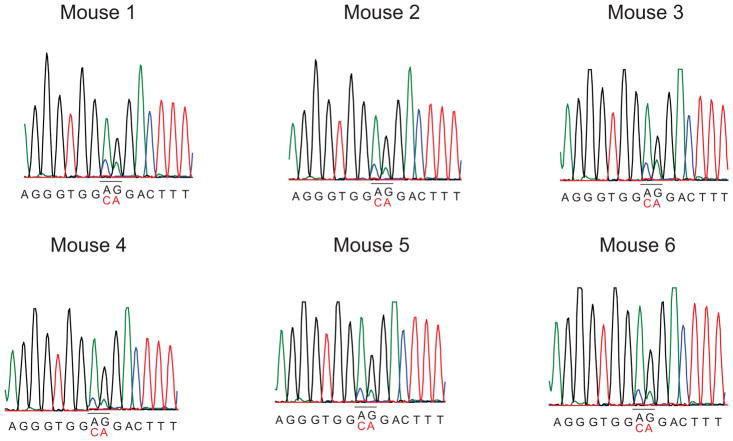
Extended Data Figure 3. Decreased expression of the Nt5c2R367Q allele upon leukemia progression in vivo.
Sanger sequencing chromatograms of cDNA from tumors in Fig. 2c show decreased levels of Nt5c2R367Q expression over the Nt5c2+ wild type allele compared with freshly 4-hydroxytamoxifen treated deleted Rosa26+/CreERT2 Nt5c2+/co-R367Q cells (Fig. 1a). Mutant allele deoxynucleotides are indicated in red.
Extended Data Figure 4. NT5C2 R367Q expression displays fitness loss in T-ALL and B-ALL cell lines.
Diagram of the purine de novo biosynthesis and salvage pathways, showing GC/MS and LC/MS/MS metabolic profiles (mass spectrometry scaled intensity, arbitrary units) of CUTLL1 and REH cell lines expressing wild type (WT) NT5C2 or NT5C2 p.R367Q and their corresponding conditioned media (n=3 biological replicates per sample). Box plots represent the upper quartile to lower quartile distribution. + Sign indicates mean value and horizontal line the median value. Whiskers indicate the maximum and minimum values of the distribution.
Extended Data Figure 5. NT5C2 mutations are late events ALL.
Integrated Sequential Network (ISN) illustrating the sequential order of somatic mutations in relapsed ALL by pooling evolutionary paths across patients. Each node represents a gene, and each arrow points from a gene with an early event to a gene with a late event. To test whether a gene within the ISN was significantly early or late, we used a one-sided binomial test based on in-degree and out-degree of each node.
Extended Data Figure 6. Guanosine rescue of mizoribine sensitivity in vitro and mizoribine activity against NT5C2 p.R367Q mutant cells in vivo.
a, Cell viability assay showing drug responses of Nt5c2+/co-R367Q wild type primary mouse T-ALL cells to increasing doses of mizoribine in the presence of 20 μM guanosine (n=3 biological replicates). b, Cell viability assay results as in c documenting the effects of 20 μM guanosine in the response of isogenic Nt5c2+/R367Q mutant mouse T-ALL lymphoblasts to mizoribine (n=3 biological replicates). c, Analysis of tumor burden assessed by bioimaging in mice transplanted with Nt5c2+/co-R367Q wild type leukemia cells (left) or Nt5c2+/R367Q mutant leukemia cells (right) treated with a range of mizoribine doses (n = 8 mice for the vehicle group and n=4 mice per treated group). d, Quantification of data in c. e, Analysis of tumor burden assessed by spleen weight in mice allografted with NT5C2 wild type ALL-4 diagnosis or NT5C2 p. R367Q ALL-4 relapse patient derived leukemia cells treated with 100 mg kg−1 mizoribine b.i.d. (n=6 for diagnosis vehicle group, n=3 for relapse treated group and n=7 for diagnosis treated and relapse vehicle groups) f, Analysis of tumor burden assessed by % CD45+ cells in the bone marrow of mice allografted with NT5C2 wild type ALL-4 diagnosis or NT5C2 p.R367Q ALL-4 relapse patient derived leukemia cells treated with 100 mg kg−1 mizoribine b.i.d. (n=3–7 per group). Horizontal bar in a, b, d, e, and f indicates mean values. P values were calculated using two-tailed Student’s t-test.
Extended Data Figure 7. 6-MP and IMPDH inhibition response in CUTLL1 cells.
a, Cell viability assay showing drug responses of the CUTLL1 cell line infected with wild type or mutant NT5C2-expressing lentiviruses to increasing doses of 6-MP. b, Cell viability assays as in a documenting the response of CUTLL1 cells expressing NT5C2 mutations to mizoribine. c, Cell viability assay showing drug responses of CUTLL1 wild type T-ALL cells to increasing doses of mizoribine in the presence of 20 μM guanosine. d, Cell viability assay results as in c documenting the effects of 20 μM guanosine in the response of NT5C2 p.R367Q expressing CUTLL1 cells to mizoribine. e, Growth curve showing growth of CUTLL1 cells infected with a GFP shRNA control or IMPDH2 targeting shRNA. f, Growth curve showing growth of CUTLL1 cells expressing NT5C2 wild type (WT) or NT5C2 p.R367Q and infected with an IMPDH2 targeting shRNA. n=3 biological replicates for a – f. Horizontal bar in c, and d indicates mean values. P values were calculated using two-tailed Student’s t-test. * P ≤0.05.
Extended Data Figure 8. 6-MP and IMPDH inhibition response in REH B-ALL cells.
a, Cell viability assay showing drug responses of the REH cell line infected with wild type or mutant NT5C2-expressing lentiviruses to increasing doses of 6-MP. b, Cell viability assays as in a documenting the response of REH cells expressing NT5C2 mutations to mizoribine. c, Cell viability assay showing drug responses of REH wild type T-ALL cells to increasing doses of mizoribine in the presence of 20 μM guanosine. d, Cell viability assay results as in c documenting the effects of 20 μM guanosine in the response of NT5C2 p.R367Q expressing REH cells to mizoribine. e, Growth curve showing growth of REH cells infected with a GFP shRNA control or IMPDH2 targeting shRNA. f, Growth curve showing growth of REH cells expressing NT5C2 wild type (WT) or NT5C2 p.R367Q and infected with an IMPDH2 targeting shRNA. n=3 biological replicates for a – f. Horizontal bar in c, and d indicates mean values. P values were calculated using two-tailed Student’s t-test. * P ≤0.05.
Extended Data Table 1.
Deep sequencing, allele specific PCR and droplet PCR analyses of matched diagnostic and remission DNA from patients with NT5C2 mutations at relapse.
| Duplex Sequencing | |||||
|---|---|---|---|---|---|
|
| |||||
| Sample | Relapse Mutation | Average duplex depth | Allele load at diagnosis | ||
| T-ALL 11 | K359Q | 5009 | Not detected | ||
| T-ALL 22 | R238W | 6519 | Not detected | ||
| T-ALL 29 | R391 | 3728 | Not detected | ||
| T-ALL 30 | Q523* | 3512 | Not detected | ||
| T-ALL C4 | R367Q | 5863 | Not detected | ||
| T-ALL C5 | R238W | 3341 | Not detected | ||
| T-ALL C7 | R367Q | 5134 | Not detected | ||
| T-ALL C10 | R238W | 4299 | Not detected | ||
| T-ALL C11 | R367Q | 3086 | Not detected | ||
| T-ALL C14 | D407E | 3755 | Not detected | ||
| T-ALL C17 | R367Q | 3497 | Not detected | ||
| T-ALL C18 | R367Q | 3660 | Not detected | ||
| T-ALL C20 | R367Q | 3693 | Not detected | ||
| T-ALL N1 | R367Q | 3507 | Not detected | ||
| Allele Specific PCR | |||||
|
| |||||
| Sample | Detection threshold | Allele load at diagnosis | Allele load at remission | ||
|
| |||||
| T-ALL 4 | 1/1000 | Not detected | - | ||
| T-ALL 17 | 1/1000 | Not detected | Not detected | ||
| T-ALL 35 | 1/1000 | Not detected | - | ||
| T-ALL C4 | 1/1000 | Not detected | Not detected | ||
| T-ALL C7 | 1/1000 | Not detected | Not detected | ||
| T-ALL C11 | 1/1000 | Not detected | Not detected | ||
| T-ALL C17 | 1/1000 | Not detected | Not detected | ||
| T-ALL C18 | 1/1000 | Not detected | Not detected | ||
| T-ALL C20 | 1/1000 | Not detected | Not detected | ||
| Serial Patient Sample Droplet PCR | |||||
|
| |||||
| Sample | Sample Type | Days since diagnosis | Detection threshold (%) | Mutation | Mutant Allele Frequency (%) |
|
| |||||
| SJBALL192 | D | 0 | 0.005 | P414A | 0.00000 |
| SJBALL192 | R1 | 170 | 0.005 | P414A | 37.73843 |
| SJBALL192 | CR | 204 | 0.005 | P414A | 0.20425 |
| SJBALL192 | CR | 230 | 0.005 | P414A | 0.15196 |
| SJBALL192 | R2 | 280 | 0.005 | P414A | 0.00064 |
| SJBALL192 | D | 0 | 0.005 | R39Q | 0.00256 |
| SJBALL192 | R1 | 170 | 0.005 | R39Q | 0.00584 |
| SJBALL192 | CR | 230 | 0.005 | R39Q | 0.02241 |
| SJBALL192 | R2 | 280 | 0.005 | R39Q | 48.57407 |
| SJTALL001 | D | 0 | 0.005 | R39Q | 0.00238 |
| SJTALL001 | D | 0 | 0.005 | R39Q | 0.00307 |
| SJTALL001 | CR | 53 | 0.005 | R39Q | 0.00576 |
| SJTALL001 | CR | 53 | 0.005 | R39Q | 0.00762 |
| SJTALL001 | CR | 218 | 0.005 | R39Q | 0.00333 |
| SJTALL001 | CR | 218 | 0.005 | R39Q | 0.00579 |
| SJTALL001 | CR | 362 | 0.005 | R39Q | 0.01952 |
| SJTALL001 | R1 | 399 | 0.005 | R39Q | 3.70027 |
| SJTALL001 | R1 | 412 | 0.005 | R39Q | 3.57648 |
| SJTALL001 | CR | 434 | 0.005 | R39Q | 0.00931 |
| SJTALL001 | R2 | 751 | 0.005 | R39Q | 37.58709 |
| SJTALL001 | R2 | 751 | 0.005 | R39Q | 39.23768 |
Extended Data Table 2.
Leukemia initiating cell activity of isogenic Nt5c2+/co-R367Q wild type and Nt5c2+/R367Q primary murine T-ALL tumors.
| Rosa26+/CreERT2 Nt5c2 R367Q +/co-R367Q – Vehicle treated | ||
|---|---|---|
|
| ||
| Number of cells injected / mouse | Number of mice injected | Number of leukemia-developing mice |
| 100000 | 6 | 6 |
| 10000 | 6 | 6 |
| 1000 | 6 | 5 |
| 100 | 6 | 2 |
| 10 | 6 | 0 |
| Rosa26+/CreERT2Nt5c2 R367Q +/R367Q – Tamoxifen treated | ||
|
| ||
| Number of cells injected / mouse | Number of mice injected | Number of leukemia-developing mice |
|
| ||
| 100000 | 6 | 6 |
| 10000 | 6 | 3 |
| 1000 | 6 | 3 |
| 100 | 5 | 0 |
| 10 | 5 | 0 |
Supplementary Material
Acknowledgments
This work was supported by a Leukemia & Lymphoma Society Quest for Cures (R0749-14) and Translational Research (6455-15; 6531-18) Awards (AAF), an Innovative Research Award from the Alex Lemonade Stand Foundation (AAF), the Chemotherapy Foundation (AAF), NIH grants R35 CA210065 (AAF), R01 CA206501 (AAF), U54 CA193313 (RR), R01 CA185486 (RR), U54 CA209997 (RR), U10 CA98543 (JMG, MLL), P30 CA013696, the Human Specimen Banking Grant U24 CA114766 (JMG), the Stewart Foundation (RR) and by the American Lebanese Syrian Associated Charities of St. Jude Children’s Research Hospital. GT was supported by a HHMI International Student Research Fellowship. MSM was supported by a Rally Foundation fellowship. CLD was supported by NIH/NCI T32-CA09503. JY was supported by the China Scholarship Council (CSC 201304910347) and the Ter Meulen Grant of the Royal Netherlands Academy of Arts and Sciences. EW was supported by the Dutch Cancer Society (KUN2012-5366). We are grateful to R. Kopan (Cincinnati Children’s Hospital Medical Center, University of Cincinnati) for the Δ-ENOTCH1 construct and T. Ludwig (The Ohio State University Comprehensive Cancer Center) for the ROSA26Cre-ERT2/+ mouse.
Footnotes
Author Contributions
G.T., and C.L.D. performed biochemical, cellular and animal studies, M.S.M. and K.O. helped in experimental therapeutic experiments, A.A.-I. a H.K. analyzed deep sequencing data, C.J.M. performed ISN analysis, M.L.S., M.K., K.K., M.P., G.P., J.M.G-F. and M.L.O. provided clinical specimens, J.Y., E.W. and I.I. performed and analyzed droplet PCR analyses, R.K-S. provided clinical samples and correlative analyses of clinical data, C.G.M. supervised droplet PCR analyses, R.R. supervised deep sequencing and ISN analyses, and A.A.F designed the study, supervised research and wrote the manuscript with G.T and C.L.D.
The authors declare no competing financial interests.
Readers are welcome to comment on the online version of the paper.
References
- 1.Hunger SP, Mullighan CG. Acute Lymphoblastic Leukemia in Children. The New England journal of medicine. 2015;373:1541–1552. doi: 10.1056/NEJMra1400972. [DOI] [PubMed] [Google Scholar]
- 2.Tzoneva G, et al. Activating mutations in the NT5C2 nucleotidase gene drive chemotherapy resistance in relapsed ALL. Nature medicine. 2013;19:368–371. doi: 10.1038/nm.3078. [DOI] [PMC free article] [PubMed] [Google Scholar]
- 3.Meyer JA, et al. Relapse-specific mutations in NT5C2 in childhood acute lymphoblastic leukemia. Nature genetics. 2013;45:290–294. doi: 10.1038/ng.2558. [DOI] [PMC free article] [PubMed] [Google Scholar]
- 4.Gerby B, et al. Expression of CD34 and CD7 on human T-cell acute lymphoblastic leukemia discriminates functionally heterogeneous cell populations. Leukemia. 2011;25:1249–1258. doi: 10.1038/leu.2011.93. [DOI] [PubMed] [Google Scholar]
- 5.Cox CV, Diamanti P, Evely RS, Kearns PR, Blair A. Expression of CD133 on leukemia-initiating cells in childhood ALL. Blood. 2009;113:3287–3296. doi: 10.1182/blood-2008-04-154187. [DOI] [PubMed] [Google Scholar]
- 6.Konopleva M, et al. Stromal cells prevent apoptosis of AML cells by up-regulation of anti-apoptotic proteins. Leukemia. 2002;16:1713–1724. doi: 10.1038/sj.leu.2402608. [DOI] [PubMed] [Google Scholar]
- 7.Hawkins ED, et al. T-cell acute leukaemia exhibits dynamic interactions with bone marrow microenvironments. Nature. 2016;538:518–522. doi: 10.1038/nature19801. [DOI] [PMC free article] [PubMed] [Google Scholar]
- 8.Mullighan CG, et al. Genomic analysis of the clonal origins of relapsed acute lymphoblastic leukemia. Science (New York, NY) 2008;322:1377–1380. doi: 10.1126/science.1164266. [DOI] [PMC free article] [PubMed] [Google Scholar]
- 9.Ma X, et al. Rise and fall of subclones from diagnosis to relapse in pediatric B-acute lymphoblastic leukaemia. Nature communications. 2015;6:6604. doi: 10.1038/ncomms7604. [DOI] [PMC free article] [PubMed] [Google Scholar]
- 10.Oshima K, et al. Mutational landscape, clonal evolution patterns, and role of RAS mutations in relapsed acute lymphoblastic leukemia. Proceedings of the National Academy of Sciences of the United States of America. 2016;113:11306–11311. doi: 10.1073/pnas.1608420113. [DOI] [PMC free article] [PubMed] [Google Scholar]
- 11.Li B, et al. Negative feedback-defective PRPS1 mutants drive thiopurine resistance in relapsed childhood ALL. Nature medicine. 2015;21:563–571. doi: 10.1038/nm.3840. [DOI] [PMC free article] [PubMed] [Google Scholar]
- 12.Mullighan CG, et al. CREBBP mutations in relapsed acute lymphoblastic leukaemia. Nature. 2011;471:235–239. doi: 10.1038/nature09727. [DOI] [PMC free article] [PubMed] [Google Scholar]
- 13.Malinowska-Ozdowy K, et al. KRAS and CREBBP mutations: a relapse-linked malicious liaison in childhood high hyperdiploid acute lymphoblastic leukemia. Leukemia. 2015;29:1656–1667. doi: 10.1038/leu.2015.107. [DOI] [PMC free article] [PubMed] [Google Scholar]
- 14.Spychala J, Madrid-Marina V, Fox IH. High Km soluble 5′-nucleotidase from human placenta. Properties and allosteric regulation by IMP and ATP. The Journal of biological chemistry. 1988;263:18759–18765. [PubMed] [Google Scholar]
- 15.Gazziola C, Ferraro P, Moras M, Reichard P, Bianchi V. Cytosolic high K(m) 5′-nucleotidase and 5′ (3′)-deoxyribonucleotidase in substrate cycles involved in nucleotide metabolism. The Journal of biological chemistry. 2001;276:6185–6190. doi: 10.1074/jbc.M007623200. [DOI] [PubMed] [Google Scholar]
- 16.Brouwer C, et al. Role of 5′-nucleotidase in thiopurine metabolism: enzyme kinetic profile and association with thio-GMP levels in patients with acute lymphoblastic leukemia during 6-mercaptopurine treatment. Clinica chimica acta; international journal of clinical chemistry. 2005;361:95–103. doi: 10.1016/j.cccn.2005.05.006. [DOI] [PubMed] [Google Scholar]
- 17.Schroeter EH, Kisslinger JA, Kopan R. Notch-1 signalling requires ligand-induced proteolytic release of intracellular domain. Nature. 1998;393:382–386. doi: 10.1038/30756. [DOI] [PubMed] [Google Scholar]
- 18.Herranz D, et al. A NOTCH1-driven MYC enhancer promotes T cell development, transformation and acute lymphoblastic leukemia. Nature medicine. 2014;20:1130–1137. doi: 10.1038/nm.3665. [DOI] [PMC free article] [PubMed] [Google Scholar]
- 19.Ferrando AA, Lopez-Otin C. Clonal evolution in leukemia. Nature medicine. 2017;23:1135–1145. doi: 10.1038/nm.4410. [DOI] [PubMed] [Google Scholar]
- 20.Clappier E, et al. Clonal selection in xenografted human T cell acute lymphoblastic leukemia recapitulates gain of malignancy at relapse. The Journal of experimental medicine. 2011;208:653–661. doi: 10.1084/jem.20110105. [DOI] [PMC free article] [PubMed] [Google Scholar]
- 21.Wong TN, et al. Rapid expansion of preexisting nonleukemic hematopoietic clones frequently follows induction therapy for de novo AML. Blood. 2016;127:893–897. doi: 10.1182/blood-2015-10-677021. [DOI] [PMC free article] [PubMed] [Google Scholar]
- 22.Shlush LI, et al. Tracing the origins of relapse in acute myeloid leukaemia to stem cells. Nature. 2017;547:104–108. doi: 10.1038/nature22993. [DOI] [PubMed] [Google Scholar]
- 23.Andersson DI, Hughes D. Antibiotic resistance and its cost: is it possible to reverse resistance? Nature reviews. Microbiology. 2010;8:260–271. doi: 10.1038/nrmicro2319. [DOI] [PubMed] [Google Scholar]
- 24.Greaves M, Maley CC. Clonal evolution in cancer. Nature. 2012;481:306–313. doi: 10.1038/nature10762. [DOI] [PMC free article] [PubMed] [Google Scholar]
- 25.Wang J, et al. Tumor evolutionary directed graphs and the history of chronic lymphocytic leukemia. eLife. 2014;3 doi: 10.7554/eLife.02869. [DOI] [PMC free article] [PubMed] [Google Scholar]
- 26.Gan L, et al. The immunosuppressive agent mizoribine monophosphate forms a transition state analogue complex with inosine monophosphate dehydrogenase. Biochemistry. 2003;42:857–863. doi: 10.1021/bi0271401. [DOI] [PubMed] [Google Scholar]
- 27.Reaves ML, Young BD, Hosios AM, Xu YF, Rabinowitz JD. Pyrimidine homeostasis is accomplished by directed overflow metabolism. Nature. 2013;500:237–241. doi: 10.1038/nature12445. [DOI] [PMC free article] [PubMed] [Google Scholar]
- 28.Ser Z, et al. Targeting One Carbon Metabolism with an Antimetabolite Disrupts Pyrimidine Homeostasis and Induces Nucleotide Overflow. Cell reports. 2016;15:2367–2376. doi: 10.1016/j.celrep.2016.05.035. [DOI] [PMC free article] [PubMed] [Google Scholar]
- 29.Palomero T, et al. CUTLL1, a novel human T-cell lymphoma cell line with t(7;9) rearrangement, aberrant NOTCH1 activation and high sensitivity to gamma-secretase inhibitors. Leukemia. 2006;20:1279–1287. doi: 10.1038/sj.leu.2404258. [DOI] [PubMed] [Google Scholar]
- 30.Kimbrel EA, et al. Systematic in vivo structure-function analysis of p300 in hematopoiesis. Blood. 2009;114:4804–4812. doi: 10.1182/blood-2009-04-217794. [DOI] [PubMed] [Google Scholar]
- 31.Guo K, et al. Disruption of peripheral leptin signaling in mice results in hyperleptinemia without associated metabolic abnormalities. Endocrinology. 2007;148:3987–3997. doi: 10.1210/en.2007-0261. [DOI] [PubMed] [Google Scholar]
- 32.Herranz D, et al. Metabolic reprogramming induces resistance to anti-NOTCH1 therapies in T cell acute lymphoblastic leukemia. Nature medicine. 2015;21:1182–1189. doi: 10.1038/nm.3955. [DOI] [PMC free article] [PubMed] [Google Scholar]
- 33.Iacobucci I, et al. Truncating Erythropoietin Receptor Rearrangements in Acute Lymphoblastic Leukemia. Cancer Cell. 2016;29:186–200. doi: 10.1016/j.ccell.2015.12.013. [DOI] [PMC free article] [PubMed] [Google Scholar]
- 34.Schmitt MW, et al. Detection of ultra-rare mutations by next-generation sequencing. Proceedings of the National Academy of Sciences of the United States of America. 2012;109:14508–14513. doi: 10.1073/pnas.1208715109. [DOI] [PMC free article] [PubMed] [Google Scholar]
- 35.Kennedy SR, et al. Detecting ultralow-frequency mutations by Duplex Sequencing. Nature protocols. 2014;9:2586–2606. doi: 10.1038/nprot.2014.170. [DOI] [PMC free article] [PubMed] [Google Scholar]
- 36.Futreal PA, et al. A census of human cancer genes. Nat Rev Cancer. 2004;4:177–183. doi: 10.1038/nrc1299. [DOI] [PMC free article] [PubMed] [Google Scholar]
- 37.Van Vlierberghe P, Ferrando A. The molecular basis of T cell acute lymphoblastic leukemia. Journal of Clinical Investigation. 2012;122:3398–3406. doi: 10.1172/JCI61269. [DOI] [PMC free article] [PubMed] [Google Scholar]
- 38.Zhang J, et al. Key pathways are frequently mutated in high-risk childhood acute lymphoblastic leukemia: a report from the Children’s Oncology Group. Blood. 2011;118:3080–3087. doi: 10.1182/blood-2011-03-341412. [DOI] [PMC free article] [PubMed] [Google Scholar]
- 39.Li B, et al. Negative feedback-defective PRPS1 mutants drive thiopurine resistance in relapsed childhood ALL. Nat Med. 2015;21:563–571. doi: 10.1038/nm.3840. [DOI] [PMC free article] [PubMed] [Google Scholar]
- 40.Hu Y, Smyth GK. ELDA: extreme limiting dilution analysis for comparing depleted and enriched populations in stem cell and other assays. Journal of immunological methods. 2009;347:70–78. doi: 10.1016/j.jim.2009.06.008. [DOI] [PubMed] [Google Scholar]
Associated Data
This section collects any data citations, data availability statements, or supplementary materials included in this article.
Supplementary Materials
Data Availability Statement
All data generated or analyzed during this study are included in this published article and its supplementary information files and are available from the authors on reasonable request. Somatic mutation data used to generate ISN were aggregated from the following previously published studies: Dataset S3 of Oshima et al. [doi:10.1073/pnas.1608420113], Supplementary Table 2 of Li et al. [doi:10.1038/nm.3840], and Supplementary Data 2 of Ma et al. [doi:10.1038/ncomms7604].


