

Abstract
Purpose of review
A number of studies over the past two decades have suggested that Type 2 diabetes mellitus (T2DM) patients are at an increased risk of Alzheimer’s disease (AD). Several common molecular pathways to cellular and metabolic dysfunction have been implicated in the etiology of both diseases. Here, we review the emerging evidence from observational studies that investigate the relationship between T2DM and AD, and of shared environmental risk factors, specifically air pollution and pesticides, associated with both chronic disorders.
Recent findings
Particulate matter and traffic-related air pollution have been widely associated with T2DM, and multiple studies have associated exposures with AD or cognitive function. Organochlorine (OC) and organophosphate (OP) pesticides have been associated with T2DM in multiple independent populations. Two populations have observed increased risks for OC and OP exposure and AD. Other studies, limited in exposure assessment, have reported increased risk of AD with any pesticide exposure assessments.
Summary
This may suggest shared pathogenic pathways between environmental risk factors, T2DM, and AD. Research focusing on exposures related to both T2DM and AD could provide new disease insights on shared mechanisms and help shape innovative preventative measures and policy decisions.
Keywords: Type 2 Diabetes Mellitus, Alzheimer’s disease, Environment, Air pollution, Pesticides
Introduction
Type 2 diabetes mellitus (T2DM) and Alzheimer’s disease (AD) are both age-related disorders. A number of studies over the past two decades have suggested that T2DM patients are at an increased risk of AD. This has profound health implications, as virtually all countries will face the challenges of increasingly aging populations in the coming decades1. With the expected growth in elderly populations, by 2030, the prevalence of AD is estimated to double to nearly 65.7 million people worldwide2 and T2DM, among the fastest growing chronic disease epidemics currently, is expected to affect 552 million people3.
Several common molecular pathways to cellular and metabolic dysfunction have been implicated in the etiology of both diseases. Observational studies are also increasingly linking exposure to overlapping environmental factors in both diseases, including lifestyle factors, smoking, diet, and physical activity, and environmental/occupational toxicants, air pollution, pesticides, and heavy metals. This may suggest shared pathogenic pathways between T2DM and AD, with T2DM, which occurs on average earlier in life than AD, exacerbating neuronal and metabolic dysfunction, further increasing the risk of developing AD. In this article, we review the emerging evidence from observational studies that investigate the relationship between T2DM and AD, and of shared environmental risk factors, specifically air pollution and pesticides, associated with both chronic disorders.
Type 2 Diabetes Mellitus and Alzheimer’s Disease
Overlapping Pathways of Dysfunction
The relationship between T2DM and AD is complex. Over the past twenty years, many researchers have investigated underlying links between T2DM and AD, especially with respect to disease mechanisms4.
AD can only be diagnosed definitively by the presence of neurofibrillary tangles and neuritic plaques consisting of protein accumulations of β-amyloid peptide and tau in the postmortem brain. AD symptoms, primarily memory loss, difficulty with familiar tasks or planning, and confusion, are thought to result from impaired synaptic function, though how β-amyloid and tau contribute to synaptic dysfunction and loss is not fully understood5. T2DM is caused by insulin deficiency. This deficiency may be attributed to several pathologies, including insufficient insulin supply due to flawed insulin secretion, reduced insulin-secreting β-cell mass, and impaired insulin sensitivity in peripheral metabolic organs (e.g. liver or muscle)4.
Insulin and leptin are hormones involved in T2DM. Both not only have major peripheral functions in maintaining blood sugar homeostasis, influencing food intake, and energy expenditure, but they also influence brain function considerably4. Insulin and leptin have been shown to regulate neuronal and synaptic function in different regions of the brain, protect neurons against neurodegeneration and cell death, and affect cognition and behavior6–9.
Moreover, these hormones have also been shown to regulate β-amyloid levels by modulating β-amyloid production, through action on the β-site of amyloid precursor protein cleaving enzyme (BACE), and β-amyloid degradation, through β-amyloid degrading enzymes such as insulin-degrading enzyme10–13. These findings support the idea that brain insulin resistance and insulin deficiency may contribute to AD. A recent APP23 transgenic mouse model14 was the first to integrate spontaneous diabetes, insulin, and leptin resistance with AD, and has provided strong experimental evidence that T2DM and AD share common cellular and molecular mechanisms (for a discussion of the rodent model see Takeda et al14; Han and Li4).
There are other pathways to pathogenesis than insulin resistance and deficiency which link T2DM and AD, including inflammation, mitochondrial dysfunction, chronic oxidative stress, and increased advanced glycation end products (AGEs) to name a few15. For example, pollutants can cause oxidative stress in the lungs, which may lead to systemic pro-inflammatory and autonomic responses. This is linked to not only insulin resistance, but numerous adverse health effects16,17. Reciprocal action between these pathways may also potentially escalate events that lead to pathogenesis. See Figure 1 as an overview of proposed mechanistic pathways linking T2DM and AD.
Figure 1.
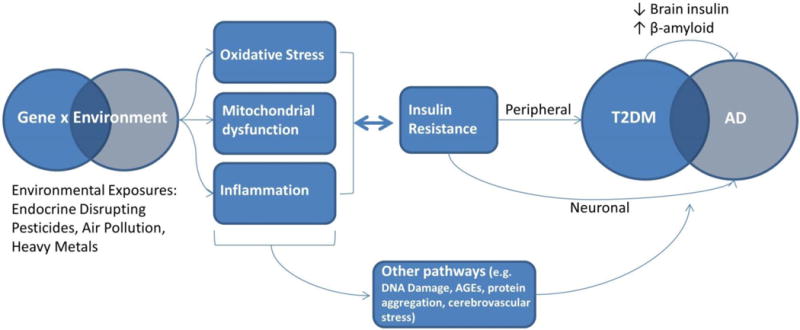
Proposed underlying link between T2DM and AD, and mechanisms through which environmental toxicants induce pathogenesis.
Epidemiologic Evidence
The first study to report that T2DM increases the risk of developing AD was the Rotterdam cohort of over 6,000 subjects in the Netherlands (1999)18. Since, epidemiologic evidence has been accumulating in support of a link, though not all results are unequivocal.
Focusing on longitudinal studies only, 17 studies have investigated the influence of T2DM on the incidence of AD (Table 1). The largest was conducted by Katon et al19 using data linkage in the Danish National Patient Register, one of the world’s oldest nationwide health registries, representing both clinical in- and out-patients and 90% of the Danish population20. Among nearly 2.5 million people ≥50 years of age without dementia (2007-2013), including 223,174 T2DM patients, 59,663 individuals (2.4%) developed dementia over a 5-year follow-up period. This reflected a small T2DM-related increase in the risk of AD (HR = 1.06, 95%CI = 1.01, 1.11), while comorbid T2DM/depression was associated with a larger HR for AD (HR = 1.46, 95% CI = 1.37, 1.55)19. In Taiwan, researchers used a random sample of the National Health Insurance Research Database Registry, which includes nearly all citizens of Taiwan since 1995 (99.99%). More than 1.2 million people, including 615,532 T2DM patients, were included in the study. The authors identified 8,488 (0.69%) incident AD patients (2000-2008), corresponding to a HR of 1.45 (95% CI =1.38, 1.52)21. National insurance data from nearly 500,000 men in South Korea further corroborated both findings (1993-2006). In this study, T2DM was associated with a 60% increase in AD risk (HR = 1.60, 95% CI = 1.29, 1.98)22.
Table 1.
Recent longitudinal studies investigating the association between T2DM (exposure) and AD (outcome).
| Study | Cohort | Country | n | T2DM Ascertainment | n | AD Ascertainment | Total | Main Results |
|---|---|---|---|---|---|---|---|---|
| Ott, 1999 18 | Rotterdam Study | The Netherlands | 692 | Medication use or blood glucose | 89 | Clinical examination | 6,370 | RR=1.90 (1.18, 3.05) |
| MacKnight, 2002 27 | CSHA | Canada | 503 | Medication use or blood glucose | 267 | Clinical examination | 5,574 | RR=1.30 (0.83, 2.03) |
| Hassing, 2002 84 | OCTO-Twin Study | Sweden | 108 | Medical records | 92 | Clinical examination | 702 | RR=0.83 (0.46, 1.48) |
| Peila, 2002 23 | HAAS | United States | 900 | Self-report or blood glucose | 76 | Clinical examination | 2,592 | RR=1.80 (1.10, 2.92) |
| Arvanitakis, 2004 85 | Religious Order Study | United States | 127 | Medication use or self-report | 151 | Clinical examination | 824 | HR=1.65 (1.10, 2.47) |
| Xu, 2004 86 | Kungsholmen Study | Sweden | 114 | Medical records or blood glucose | 260 | Clinical examination | 1,301 | HR=1.30 (0.90, 2.10) |
| Luchsinger, 2005 87 | Medicare recipients, NYC | United States | 230 | Self-report | 246 | Clinical examination | 1,381 | HR=2.40 (1.80, 3.20) |
| Akomolafe, 2006 26 | Framingham Study | United States | 202 | Medication use or self-report | 237 | Clinical examination | 2,210 | RR=1.15 (0.65, 2.05) |
| Raffaitin, 2009 88 | Three-City Study | France | 538 | Medication use or blood glucose | 134 | Clinical examination | 7,087 | HR=1.15 (0.64, 2.05) |
| Al-Emam, 2010 89 | University hospital referrals | Egypt | 106 | Medication use or self-report | 137 | Clinical examination | 764 | HR=1.53 (0.96, 2.45) |
| Ahtiluoto, 2010 24 | Vantaa 85+ Study | Finland | 131 | Medical records or self-report | 155 | Clinical examination | 553 | HR=2.45 (1.33, 4.52) |
| Kimm, 2011 22 | Male NHIC Enrollees | South Korea | 33,350 | Medical records | 821 | Medical records | 490,445 | HR=1.60 (1.29, 1.98) |
| Kimm, 2011 22 | Female NHIC Enrollees | South Korea | 18,261 | Medical records | 1,030 | Medical records | 358,060 | HR=1.40 (1.15, 1.70) |
| Ohara, 2011 25 | Hisayama Study | Japan | 150 | Oral glucose tolerance test | 105 | Clinical examination | 1,017 | HR=2.05 (1.18, 3.57) |
| Wang, 2012 21 | BHNI Database | Taiwan | 615,532 | Medical records | 8,488 | Medical records | 1,230,403 | HR=1.45 (1.38, 1.52) |
| Huang, 2014 90 | NHIRD | Taiwan | 71,433 | Medical records | 612 | Medical records | 142,744 | HR=1.76 (1.50, 2.07) |
| Katon, 2015 19 | Danish National Register | Denmark | 223,174 | Medical records | 59,663a | Medical records | 2,454,532 | HR=1.06 (1.01, 1.11); T2DM/depression: HR=1.46 (1.37, 1.55) |
Abbreviations: AD=Alzheimer’s disease; T2DM=Type 2 Diabetes Mellitus; RR=Risk Ratio; HR=Hazards Ratio; N/A=Not Available
Study Abbreviations: BHNI=Bureau of National Health Insurance;CSHA=Canadian Study of Health and Aging; HAAS=Honolulu-Asia Aging Study; NHIC=National Health Insurance Corporation; NHIRD=National Health Insurance Research Database
Includes all forms of dementia, AD sample size alone was not provided; main results are for AD only – not all forms of dementia
Although National Hospital or Insurance Registry data provide many benefits, most notably the large, representative, and nationwide samples, they are often limited in some key aspects. For example, disease status is often based on hospital discharge records and ICD codes designated for insurance purposes. Also, measurement of crucial confounders beyond age, sex, and some medical factors are generally unavailable, including education, smoking, BMI, and physical activity.
Several smaller cohorts with more detailed confounder and outcome information have also reported T2DM to be associated with an increased AD risk, including the Honolulu-Asia Aging Study (Risk Ratio (RR) = 1.80, 95% CI=1.10, 2.92)23, the Vantaa Study in Finland (RR = 2.45, 95% CI=1.33, 4.52)24 and the Hisayama Study in Japan (RR = 2.05, 95% CI=1.18, 3.57)25 (Table 1).
Some cohorts, including the Framingham (RR=1.15, 95% CI=0.65, 2.05)26 and Canadian Study of Health and Aging (RR=1.30, 95% CI=0.83, 2.03)27, have reported no association between T2DM and AD (Table 1). Although both did estimate small positive risks, the 95% CIs included the null value. In fact, out of the 17 longitudinal studies, only one did not report a positive point estimate, the OCTO-Twin Study, which had a relatively small sample size (n=702; RR=0.83, 95% CI=0.46, 1.48). A meta-analysis from 2013 summarizing the data from 15 longitudinal studies, reported a pooled adjusted risk ratio of 1.57 (95% CI=1.41, 1.75) between T2DM and AD, and a population-attributable risk of 8%28.
While both biologic mechanisms and epidemiologic evidence strongly support a link between T2DM and AD, the studies mentioned do not assess how ubiquitous environmental exposures may influence this relationship, either as confounders, should T2DM mediate the relationship between exposure and AD, or effect modifiers, assessed with statistical interactions.
Environmental Risk Factors, Type 2 Diabetes Mellitus, and Alzheimer’s Disease
Awareness is growing that many age-related diseases share common environmental risk factors. For example, smoking and physical inactivity are established risk factors for many chronic diseases, including T2DM and AD. Environmental toxicant exposures are increasingly recognized as falling in this category, i.e. they affect many health endpoints. Air pollution, for example, has been widely associated with cardiovascular events, T2DM, cancers, and more recently with neurodegenerative diseases29–32. Similarly, the organochlorine DDT is linked to cancer, T2DM, and cognitive deficits/AD33,34. Some exposures are more or less ubiquitous in certain communities, such as traffic-related air pollution (TRAP) in urban communities and pesticides from agricultural applications in rural environments.
One explanation may be that exposures induce shared pathophysiologic mechanisms, including those mentioned above, inflammation, oxidative stress, and insulin deficiencies. Air pollution and pesticide exposures in particular have been widely associated with such pathways. Table 2 briefly outlines findings from a sample of the vast literature linking these exposures with shared pathways for T2DM and AD. Given the ubiquity of air pollution and pesticide use and the strong experimental evidence linking exposures with shared pathophysiologic mechanisms, this review will focus on air pollution and pesticides and both disorders.
Table 2.
Examples of shared T2DM/AD pathophysiologic pathways associated with environmental exposures
| Exposure | Shared Pathway | Outcomes |
|---|---|---|
| Air Pollution | Pulmonary inflammation resulting in systemic spread (elevated pro-inflammatory biomarkers including CRP, IL-6, TNF-α, and fibrogen) | ↑ Systemic Inflammation; ↑ Oxidative Stress; ↑ Insulin Resistance |
| Spread of ultrafine particles into the bloodstream | ↑ Systemic Inflammation; ↑ Oxidative Stress; ↑ Vascular Dysfunction | |
| Alterations in endothelial function | ↑ Insulin Resistance; ↑ Inflammation | |
| Endoplasmic reticulum stress/alterations in insulin transduction | ↑ Protein Misfolding; ↑ Insulin Resistance | |
| Brown adipose tissue (BAT)-mediated thermogenesis | ↑ Mitochondrial dysfunction; ↑ Oxidative Stress | |
| Pesticides | Induction of inflammatory processes in the central system nervous, cardiac and pancreatic tissues; increase the secretion of pro-inflammatory cytokines (TNF-α, IL-6, etc.) | ↑ Systemic Inflammation; ↑ Oxidative Stress; ↑ Insulin Resistance |
| Induction of free radicals, lipid peroxidation, and impaired antioxidant status | ↑ Systemic Inflammation; ↑ Oxidative Stress; ↑ Insulin Resistance | |
| Glucose metabolism disruptions/Hyperglycemia | ↑ Insulin Resistance | |
| Dysfunction of insulin-secreting cells | ↑ Insulin Resistance |
Abbreviations: AD=Alzheimer’s disease; T2DM=Type 2 Diabetes Mellitus;
Understanding how shared T2DM/AD risk factors contribute to comorbid disease patterns could provide insight into underlying etiologic pathways and ultimately environmental policy and prevention targets. In the following section, we will review the observational studies that have investigated the relationship between air pollutants and pesticides and both T2DM and AD.
Particulate Matter and Traffic-related Air Pollution
Air pollution is a complex mixture of compounds from different sources, including combustion, industrial, or agricultural, such as particulate matter (PM), ozone, carbon monoxide, sulfur and nitrogen oxides, methane, volatile organic compounds (e.g., benzene, toluene, and xylene), and metals (e.g., lead, manganese, vanadium, iron)32. In recent years, several major epidemiologic studies have reported positive associations between air pollutants and T2DM and AD or cognitive decline. In this review, we will however focus on the associations for exposures most commonly studied, that is particulate matter (PM, <2.5 μm (PM2.5) or <10 μm (PM10)) and TRAP, often assessed via a surrogate, nitrogen dioxide (NO2) or black carbon.
Type 2 Diabetes
An association between air pollution and T2DM was first reported in 2008 in a Canadian population of 4,182 women, assembled from the Ontario Health Insurance database35. Using field measurements and a land use regression (LUR) model, a positive relationship between NO2 and T2DM was estimated (OR=1.04 per 1 ppb increase in NO2, 95% CI=1.00, 1.08). Since this initial study, 10 longitudinal cohort studies have investigated the link with T2DM, using different measures for air pollution: NO235–41, PM2.536,41–45 and/or PM1038,40,44,45 (we did not review cross-sectional or case-control studies). Table 3 outlines the findings of these studies.
Table 3.
Recent epidemiologic studies investigating the association between air pollution and T2DM, AD, or cognition among adults/elderly
| Outcome (Ascertainment) |
Study, Cohort | Exposure Assessment |
Exposure Location, Timing |
Country | Study Type, Follow-up |
Sample size | Main Results (per 1 IQR unless noted) |
|
|---|---|---|---|---|---|---|---|---|
| Outcome | Total | |||||||
| PM2.5 | ||||||||
| T2DM (Medication use or blood glucose) |
Puett, 2011, NHS44 | EPA monitors/LUR | Residence, final two years of follow-up | United States | Longitudinal, 1989–2002 | 3,784 | 74,412 | HR=1.21 (1.00, 1.46) |
| T2DM (Medication use or blood glucose) |
Puett, 2011, HPFS44 | EPA monitors/LUR | Residence, final two years of follow-up | United States | Longitudinal, 1989–2002 | 688 | 15,048 | HR=1.52 (0.93, 2.47) |
| T2DM (Self-report) |
Coogan, 2012, BWHS36 | EPA monitors/Kriging model | Residence, 2000 | United States | Longitudinal, 1995–2005 | 183 | 3,992 | IRR=1.63 per 10 ug/m3 (0.78, 3.44) |
| Mortality from T2DM (Death Certificate) |
Brook, 2013, 1991 Canadian Census Mortality42 | Satellite sensing/Atmospheric model | Residence, 2001–2006 | Canada | Longitudinal, 1991–2001 | 5,200 | 2,145,400 | HR=1.49 per 10 ug/m3 (1.37, 1.62) a |
| T2DM (Registry) |
Chen, 2013, NPHS Respondents43 | Satellite sensing/Atmospheric model | Residence, 2001–2006 | Canada | Longitudinal, 1996–2010 | 6,310 | 62,012 | HR=1.11 per 10 ug/m3 (1.02, 1.21) |
| T2DM (Medication use or blood glucose) |
Park, 2015, MESA41 | EPA monitors/Spatio-temporal model | Residence, Baseline year | United States | Longitudinal, 2000–2002 | 622 | 5,135 | HR=1.05 (0.87, 1.26) |
| T2DM (Medication use or blood glucose) |
Weinmayr, 2015, Heinz Nixdorf Recall Study45 | Chemistry transport model (EURAD) | Residence, 2001–2002 | Germany | Longitudinal, 2000–2008 | 331 | 3,607 | IRR=1.36 per 1-ug/m3 (0.98, 1.89) |
| AD (Medical records) |
Jung, 2015, NHRID48 | Taiwan EPA monitors | Residence, 2001–2010 | Taiwan | Longitudinal, 2001–2010 | 1,399 | 95,690 | HR=2.38 (2.21, 2.56) |
| Hospitalizations due to AD (Medical records) |
Kioumourtzoglou, 2015, Medicare Enrollees49 | EPA monitors, city averages | City averages, Yearly (time-varying) | United States | Longitudinal, 1999–2010 | 266,725 | 9.8 million | HR=1.15 per 1 μg/m3 (1.11, 1.19) |
| Cognitive Decline (Cognitive tests-Telephone) |
Weuve, 2012, NHS Cognitive Cohort50 | EPA monitors/Spatio-temporal model | Residence, 7–14 years | United States | Longitudinal, 1995–2008 | N/A | 19,409 women | Global Cognitive Score: Quintile 5 vs 1 β=−0.018 (−0.034, −0.002) |
| Cognitive Impairment (Cognitive test-Telephone) |
Loop, 2013, REGARDS51 | Satellite sensing & EPA monitors/Spatio-temporal model | Residence, Baseline year | United States | Longitudinal, 2003–2007 | 1,633 | 20,150 | OR=1.26 (0.97, 1.64) |
| Cognitive Decline (Cognitive tests – In-person) |
Tonne, 2014, Whitehall II52 | London Monitors/KCLurban dispersion model | Residence, 4-yrs prior | United Kingdom | Longitudinal, 2002–2009 | N/A | 10,308 | Standardized Memory Test: β =−0.04 (−0.07, −0.01) |
| Cognitive Decline (Cognitive tests-In-person) |
Schikowski, 2015, SALIA53 | Monitors/LUR | Residence, 2008–2009 | Germany | Longitudinal, 1985–2009 | N/A | 789 women | CERAD-Plus test: β=−0.19 (−0.36, −0.02) |
| PM10 | ||||||||
| T2DM (Self-report) |
Kramer, 2010 SALIA38 | Monitoring stations, nearest to residence | Residence, 1986–1990 | Germany | Longitudinal, 1990–2006 | 87 | 1,775 | HR=1.16 (0.81, 1.65) |
| T2DM (Medication use or blood glucose) |
Puett, 2011, NHS 44 | EPA monitors/Spatio-temporal model | Residence, final two years of follow-up | United States | Longitudinal, 1989–2002 | 3,784 | 74,412 | HR=1.13 (0.98, 1.29) |
| T2DM (Medication use or blood glucose) |
Puett, 2011, HPFS44 | EPA monitors/Spatio-temporal model | Residence, final two years of follow-up | United States | Longitudinal, 1989–2002 | 688 | 15,048 | HR=1.27 (0.91, 1.77) |
| T2DM (Medication use or blood glucose) |
Eze, 2014, SAPALDIA40 | Dispersion model | Residence, 1 to 10-yr prior to follow-up | Switzerland | Longitudinal, 1991–2002 | 315 | 6392 | OR=1.40 per 10 ug/m3 (1.17, 1.67) |
| T2DM (Medication use or blood glucose) |
Weinmayr, 2015, Heinz Nixdorf Recall Study45 | Chemistry transport model (EURAD) | Residence, 2001–2002 | Germany | Longitudinal, 2000–2008 | 331 | 3,607 | IRR=1.36 per 1-ug/m3 (0.97, 1.89) |
| AD (Clinical examination) |
Wu, 2015, Neurology Clinic patients54 | Taiwan EPA monitors/Spatio-temporal model | Residence, 1993–2006 | Taiwan | Case-Control, 2007–2010 | 249 | 497 | Tertile 3 vs 1 OR=4.17 (2.31, 7.54) |
| Cognitive Decline (Cognitive tests-Telephone) |
Weuve, 2012, NHS Cognitive Cohort50 | EPA monitors/Spatio-temporal model | Residence, 7–14 years | United States | Longitudinal, 1995–2008 | N/A | 19,409 women | Global Cognitive Score: Quintile 5 vs 1 β=−0.024 (−0.040, −0.008) |
| Cognitive Decline (Cognitive tests – In-person) |
Tonne, 2014, Whitehall II 52 | London Monitors/KCLurban dispersion model | Residence, 4-yrs prior | United Kingdom | Longitudinal, 2002–2009 | N/A | 10,308 | Reasoning Test: β=−0.01 (−0.03, 0.01) |
| Cognitive Decline (Cognitive tests – In-person) |
Schikowski, 2015, SALIA53 | Monitors/LUR | Residence, 2008–2009 | Germany | Longitudinal, 1985–2009 | N/A | 789 women | CERAD-Plus test: β=−0.14 (−0.26, −0.02) |
| NO2 | ||||||||
| T2DM (Medical records) |
Brook, 2008, Respiratory clinic patients35 | Field measurements/LUR | Residence, 2002 & 2004 | Canada | Longitudinal, 1992–1999 | 630 | 4,182 women | OR=1.04 per 1 ppb (1.00, 1.08) |
| T2DM (Self-report) |
Kramer, 2010, SALIA38 | Monitors/LUR | Residence, 2002 | Germany | Longitudinal, 1990–2006 | 87 | 1775 | HR=1.42 (1.16, 1.73) |
| T2DM (Self-report) |
Coogan, 2012, BWHS36 | Monitors/LUR | Residence, 2006 | United States | Longitudinal, 1995–2005 | 183 | 3992 | IRR=1.25 (1.07, 1.46) |
| T2DM (Medical records) |
Andersen, 2012, Danish Diet, Cancer, and Health cohort37 | Danish AirGIS human exposure modeling system | Residence, Yearly (time-varying) | Denmark | Longitudinal, 1993–2006 | 2,877 | 51,818 | HR=1.04 (1.00, 1.08) |
| T2DM (Medication use or blood glucose) |
Weinmayr, 2012, Heinz Nixdorf Recall Study 39 | Chemistry transport model (EURAD) | Residence, 1-yr prior to dx | Germany | Longitudinal, 2000–2008 | 309 | 3,424 | IRR= 1.11 (1.00, 1.22) |
| T2DM (Medication use or blood glucose) |
Eze, 2014, SAPALDIA40 | Monitors/Hybrid dispersion model plus LUR | Residence, 1 to 10-yrs prior to follow-up survey | Switzerland | Longitudinal, 1991–2002 | 315b | 6392 | OR=1.19 per 10 ug/m3 (1.03, 1.38) |
| T2DM (Medication use or blood glucose) |
Park, 2015, MESA41 | EPA monitors/Spatio-temporal model | Residence Baseline year | United States | Longitudinal, 2000–2002 | 622 | 5,135 | HR=1.04 (0.77, 1.40) |
| AD (Clinical examination) |
Oudin, 2016, Betula Study55 | Monitors/LUR | Residence, Baseline year | Sweden | Longitudinal, 1993–2014 | 191 | 1,806 | Quartile 4 vs 1 HR=1.38 (0.87, 2.19); All cause dementia: HR=1.43 (1.00, 2.05) |
| Dementia (Medical records) |
Chang, 2014, NHIRD56 | Taiwan EPA monitors, nearest to clinic | Clinic, 1998–2010 | Taiwan | Longitudinal, 2000–2007 | 1,720 | 29,547 | Quartile 4 vs 1 HR=1.54 (1.34, 1.77) |
| Cognitive Decline (Cognitive tests-In-person) |
Schikowski, 2015, SALIA53 | Monitors/LUR | Residence, 2008–2009 | Germany | Longitudinal, 1985–2009 | N/A | 789 women | CERAD-Plus test: β=−0.28 (−0.44, −0.12) |
Modeling mortality among subjects with T2DM code as an underlying cause
Prevalent diabetes
N/A=Not Applicable, outcome is a continuous measure of cognitive decline; EPA=Environmental Protection Agency; EURAD= European Air Pollution Dispersion model; LUR= Land Use Regression
Studies: NHS= Nurses’ Health Study; HPFS=Health Professionals Follow-Up Study; NPHS=National Population Health Survey; SALIA= Study on the Influence of air pollution on Lung function, Inflammation and Aging; SAPALDIA= Swiss Cohort Study on Air Pollution and Lung and Heart Diseases in Adults; REGARDS= Reasons for Geographic And Racial Differences in Stroke; MESA= Multi-Ethnic Study of Atherosclerosis; BWHS= Black Women’s Health Study; NHRID= National Health Insurance Research Database
While not every study investigating PM2.5 reported statistically significant associations, the 7 longitudinal studies all reported positive point estimates for the influence of PM2.5 on T2DM. For example, the Nurses’ Health Study, with 74,412 female participants and 3,784 incident T2DM cases, reported an HR of 1.21 per IQR (95% CI=1.00, 1.46), while the all-male Health Professionals Follow-up Study (HPFS) estimated an HR of 1.52 per IQR (95% CI=0.93, 2.47)44. It should be noted that for a large number of participants in the HPFS, residential geocode information was missing, and instead the workplace address was used. Consequently exposure misclassification is possible and non-differential misclassification would have biased associations toward the null44. Other studies, with arguably less selective study populations and thus greater generalizability, also found increases in T2DM risk with PM2.5 exposures. These include two large Canadian studies, the 1991 Canadian Census Mortality Follow-Up Study with a sample size of over 2.1 million, which modeled T2DM mortality (HR=1.49 per 10-ug/m3 (1.37, 1.62))42, and the National Population Health and Canadian Community Health Survey with 62,012 respondents (HR=1.11 per 10-ug/m3 (1.02, 1.21))43.
Similar results were found in studies investigating PM10. All 5 longitudinal studies reported positive point estimates (Table 3); but only in the Swiss Cohort Study on Air Pollution and Lung and Heart Diseases in Adults did the findings reach statistical significance. In the Swiss sample, with 6,392 participants and 315 incident T2DM cases, the authors report a 40% increased risk of T2DM per IQR of PM10 (OR=1.40; 95% CI=1.17, 1.69)40.
NO2 was the initial pollutant investigated by Brook et al35. Since this report, 6 additional longitudinal investigations have been published. Of these studies (Table 3), only the Multi-Ethnic Study of Atherosclerosis did not find an association between NO2 and T2DM incidence (HR=1.04 per IQR; 95% CI=0.77, 1.40). Though the same study found an increased risk between NO2 and prevalent T2DM (OR = 1.18 per IQR; 95% CI: 1.01, 1.38)41. The effect sizes estimated by the other 5 studies ranged from 1.04 (1.00, 1.08) to 1.42 (1.16, 1.73) (Table 3).
A pooled meta-analysis of the studies published before 2014 reported elevated risks for T2DM from long-term exposures to higher levels of NO2 (meta-analysis RR=1.11 per 10 μg/m3 increment, 95% CI 1.07–1.16), PM2.5 (meta-analysis RR=1.39 per 10 μg/m3 increment, 95% CI 1.14–1.68), and PM10 (meta-analysis RR=1.34 per 10 μg/m3 increment, 95% CI 1.22–1.47)30. A more recent meta-analysis (2015), which included case-control and cross-sectional studies as well as longitudinal studies, also reported a positive association for PM2.5 (meta-analysis RR=1.10 per 10 μg/m3 increment, 95% CI 1.02–1.18) and NO2 (meta-analysis RR=1.08 per 10 μg/m3 increment, 95% CI 1.00–1.17). Furthermore, they found that associations were stronger in females46. Interestingly, AD disproportionately affects women47.
Alzheimer’s disease
Research targeting environmental risk factors for AD has largely focused on lifestyle. To date only a handful of longitudinal studies have investigated the role of air pollutants in AD. Therefore we opted to also review case-control studies of AD and longitudinal studies of cognitive decline among the elderly. Table 3 outlines the findings from these studies.
Some studies have linked air pollution and AD. Notably, two large prospective studies with PM2.5 exposure measures48,49. A Taiwanese study utilized the National Health Insurance Research Database, and routine air monitoring from the Taiwan Environmental Protection Agency (2000–2010)48. Among 95,690 study subjects, 1,399 were diagnosed with incident AD (2001–2010), and the authors found that those with higher PM2.5 exposures over follow-up were at more than twice the risk of developing AD (HR=2.38 per 4.43 ug/m3 increase; 95% CI=2.21, 2.56)48. Among 9.8 million Medicare enrollees from the Northeastern United States, PM2.5 exposure at baseline was associated with an increased risk of hospitalizations due to AD (HR=1.15 per 1 μg/m3; 95% CI=1.11, 1.19)49. Four additional longitudinal studies have reported a higher risk of incident cognitive decline with PM2.5 exposures in the United States, United Kingdom, and Germany50–53 (see Table 3).
While none of the longitudinal studies reported on PM10 exposure and AD, a recent case-control study reported positive results. Among 249 AD patients and 497 controls in Taiwan, those in the highest tertile of PM10 exposure (based on a 12-year prior to onset exposure period) were found to be at over 4 times the risk of AD relative to those in the lowest tertile (OR=4.17; 95%=2.31, 7.54)54. Of interest is also that 30% of the AD cases in this study reported a history of T2DM compared and only 13% of controls54. Longitudinal studies of cognitive decline have reported conflicting findings. The Whitehall II cohort (n=10,308) in London reported no association between cognitive decline and PM1052. While investigators using both the Nurses’ Health Study Cognitive Cohort (highest vs lowest quintile β= −0.24, 95% CI: −0.040, −0.008)50 and a smaller German cohort of elderly woman (β= −0.14 per IQR PM10; 95% CI: −0.26, −0.02)53 reported faster cognitive decline with higher PM10 exposure.
The Betula cohort in Sweden investigated the influence of nitric oxides (NOx) on AD. This cohort (n=1,806) reported 191 incident AD cases, and that NOx was positively associated with the risk of AD (highest quartile of exposure vs lowest: HR=1.38, 95% CI=0.87, 2.19), but the 95% CI included the null value55. When the authors considered all causes of dementia (n=302), the estimated effects gained formal statistical significance (HR=1.43, 95% CI=1.00, 2.05)55. Another report, that relied on the large, population-wide National Health Insurance Research Database in Taiwan, similarly found that the highest quartile of NO2 exposure relative to the lowest was associated with all cause dementia (HR=1.54, 95% CI=1.34, 1.77)56. And the German cohort of elderly woman mentioned above also linked NO2 exposures with cognitive decline (β= −0.28 per 1 IQR NO2; 95% C=−0.44, −0.12)53.
While evidence implicating air pollution in T2DM or AD alone is somewhat strong and growing, few studies have investigated whether or how T2DM may modify the relationship between air pollution and cognition. This was explored in the Department of Veterans Affairs Normative Aging Study (n=680 men)57 that evaluated the influence of black carbon (BC) exposure on cognitive function measured by the Mini-Mental State Examination (MMSE). When modeling MMSE ≤ 25, the authors observed a 30% increase in risk with each doubling of BC (OR=1.3, 95% CI=1.1, 1.6)57. Interestingly, they also suggested that the adverse effects of BC were concentrated in overweight and obese individuals (p-value for interaction=0.10); although, they did not find evidence for effect modification by T2DM specifically (p-value for interaction >0.10)57. While, these results are only suggestive of metabolic dysfunction modifying the effects of air pollution exposure on AD risk, the study was likely limited by its small number of participants with T2DM and MMSE ≤ 25.
Metabolic dysfunction modifying the influence of air pollution however has been shown for other outcomes, such as cardiovascular events. For example, a study using the Women’s Health Initiative cohort to investigate the effects of PM2.5 on cardiovascular events reported that the risk for cardiovascular events associated with PM2.5 increased with increasing BMI (p for trend=0.003) and waist-to-hip ratio (p for trend=0.008)58. Moreover, several of the cohorts we have discussed above have implicated air pollutants in both T2DM and cognitive function, for example the Nurses’ Health Study.
Pesticides
Pesticides represent a broad range of chemicals used for crop protection and agricultural food production, in homes and gardens, for roadway or building maintenance, and protection against insect-borne diseases in many countries. Pesticides are designed to impact living systems. Many have known acute health effects, and long-term health problems are increasingly recognized, even at low levels of exposure.
Certain pesticides relevant for this review are considered persistent organic pollutants (POPs), compounds with environmental persistence that are known to bio-accumulate. POPs have been studied since the 1970s, and many have since been banned due to their persistent properties impacting eco-systems, their documented bioaccumulation in the food chain and in turn human breast milk, and subsequently the many health concerns that have been raised59. The most prominent POP linked to T2DM is dioxin, a contaminant of the herbicide and war time chemical Agent Orange60. As a result, T2DM is listed by the U.S. Department of Veterans Affairs as a presumptive disease in Vietnam Veterans who handled these chemicals60. A workshop conducted by NIEHS (2013) reviewed 72 epidemiological studies that investigated associations of POPs with diabetes61. While studies were too heterogeneous to conduct a meta-analysis, the workshop members concluded that the overall evidence was sufficient for a positive association of some organochlorine POPs with T2DM, including trans-nonachlor, DDE (the metabolite of DDT), and dioxins and dioxin-like chemicals. But they also recommended to further evaluate causality in experimental models which might help shed new light on the pathogenesis of T2DM. Cognitive deficits due to organochlorine (OC) and organophosphate (OP) exposures have also been observed. While researchers are still trying to elucidate the mechanisms through which pesticides may cause T2DM and AD, especially in populations with low-level exposures, some compelling epidemiologic evidence exists for both T2DM and AD with OC and OP pesticide exposure. In the following section, we will discuss major studies investigating these agents.
Type 2 Diabetes
Studies linking low-level OC exposure to T2DM began in 1980, with an occupational study of 2,620 pesticide production workers. The study found a suggestive association between higher serum OC levels (specifically DDT, DDE, and dieldrin) and incident T2DM62. Since then a number of studies have replicated this finding (Table 4). Throughout the 2000s, a series of cross-sectional studies reported higher levels of different OC chemicals measured in human serum to be associated with risk of developing T2DM among multiple diverse populations, including population-based and occupational studies; for a review, see Evangelou et al33. These reports notably include the population-wide National Health and Examination Survey (NHANES) study in which higher plasma levels of 6 different POPs were associated with T2DM, including three OCs: Oxychlordane, trans-nonachlor, and mirex (summary measure of 6 POPs: ≥90th percentile vs < level of detection OR=37.7 (7.8, 182.0), p for trend <0.001)63. Subsequently, a number of cohort studies reported similar findings for OCs and also investigated OPs.
Table 4.
Recent epidemiologic studies investigating the association between selective pesticides and T2DM or AD
| Outcome (Ascertainment) |
Study, Cohort | Exposure Assessment |
Exposure Location, Timing |
Country | Study Type | Sample size | Main Results | |
|---|---|---|---|---|---|---|---|---|
| Outcome | Total | |||||||
| T2DM (Medication use or blood glucose) |
Lee, 2006, NHANES63 | 6 OCs/POPs, Measured | Serum, Baseline | United States | Cross-Sectional, 1999–2002 | 217 | 2,016 | 6 POPs Summary: ≥90th vs < LOD OR=37.7 (7.8, 182.0), p for trend <0.001 |
| T2DM (Self-report) |
Montgomery, 2008, AHS64 | OCs, Self-report | Occupational, Lifetime | United States | Longitudinal, 1993–2003 | 1,176 | 31,787 | Ever vs Never: Chlordane: OR=1.16 (1.01, 1.34); Heptachlor: OR=1.20 (1.01, 1.43) |
| T2DM (Self-report) |
Montgomery, 2008, AHS64 | OPs, Self-report | Occupational, Lifetime | United States | Longitudinal, 1993–2003 | 1,176 | 31,787 | Ever vs Never: Coumaphos: OR=1.26 (1.03, 1.55); Phorate OR=1.22 (1.06, 1.42); Terbufos OR=1.17 (1.02, 1.35); Trichlorfon OR=1.85 (1.03, 3.33) |
| T2DM (Self-report) |
Turyk, 2009, Great Lakes Consortium66 | DDE, Measured | Serum, Change over follow-up | United States | Longitudinal, 1994–2005 | 36 | 435 | Tertile 2 vs 1: OR=5.5 (1.2, 25.1); Tertile 3 vs 1: OR=7.1 (1.6, 31.9); p for trend=0.008 |
| T2DM (Medication use or blood glucose) |
Lee, 2010, CARDIA68 | 8 OCs, Measured | Serum, Year 2 | United States | Nested Case-control, 1987–2006 | 90 | 90 | Quartile 4 vs 1: Oxychordane: OR=2.6 (1.0, 7.0); trans-Nonachlor: OR=3.7 (1.2, 11.0) |
| T2DM (Medication use or blood glucose) |
Lee, 2011, PIVUS67 | 3 OCs, Measured | Plasma, Baseline | Sweden | Longitudinal, 2001–2009 | 36 | 725 | 3 OCs Summary: Quintile 5 vs 1 OR=3.4 (1.0, 11.7) |
| T2DM (Self-report) |
Wu, 2013, NHS69 | 3 OCs, Measured | Plasma, Baseline | United States | Nested Case-control, 1989–2008 | 48 | 1,095 | Tertile 3 vs 1: HCBs: OR=3.59 (1.49, 8.64); DDE: OR=1.58 (0.69, 3.59); DDT: OR=1.06 (0.49, 2.28) |
| T2DM (Self-report) |
Starling, 2014, AHS Spouses65 | OPs, Self-report | Occupational, Lifetime | United States | Longitudinal, 1993–2007 | 688 | 13,637 women | Ever vs never: Fonofos HR=1.56 (1.11, 2.19); Phorate HR=1.57 (1.14, 2.16); Parathion HR=1.61 (1.05, 2.46) |
| T2DM (Self-report) |
Starling, 2014, AHS Spouses65 | OCs, Self-report | Occupational, Lifetime | United States | Longitudinal, 1993–2007 | 688 | 13,637 women | Ever vs never: Dieldrin HR=1.99 (1.12, 3.54) |
| AD (Clinical examination) |
McDowell, 1994, CSHA73 | All pesticides, Self-report | Occupational, Lifetime | Canada | Case-Control, 1991 | 258 | 535 | OR=2.17 (1.18, 3.99) |
| AD (Clinical examination) |
Tyas, 2001, MSHA74 | All pesticides/fertilizers, Self-report | Occupational, Lifetime | Canada | Longitudinal, 1991–1997 | 36 | 694 | RR = 1.45 (95% CI 0.57–3.68) |
| AD (Clinical examination) |
Gauthier, 2001, SLSJ76 | All pesticides, Record based | Residence, 1971–1991 | Canada | Case-Control | 67 | 134 | Herbicides: OR=1.07 (0.39, 2.54); Insecticides: OR=1.62 (0.64, 4.11); Pesticides: OR=0.97 (0.38, 2.41) |
| AD (Clinical examination) |
Baldi, 2003, PAQUID75 | All pesticide, JEM | Occupational, Lifetime | France | Longitudinal, 1992–1998 | 96 | 1,507 men | RR=2.4 (1.0, 5.6) |
| AD (Clinical examination) |
Hayden, 2010, CCMS71 | OPs, Self-report | Occupational, Lifetime | United States | Longitudinal, 1995–2005 | 344 | 3,084 | HR=1.53 (1.05, 2.23) |
| AD (Clinical examination) |
Hayden, 2010, CCMS71 | OCs, Self-report | Occupational, Lifetime | United States | Longitudinal, 1995–2005 | 344 | 3,084 | HR=1.49 (0.99, 2.24) |
| AD Prevalence (Medical records) |
Parron, 2011, Andalusian Districts91 | All pesticides, Record based | District wide, 2001 | Spain | Ecologic, 1985–2005 | 3529 | 17,429 | High exposure vs low: OR=2.10 (1.96, 2.25) |
| AD (Clinical examination) |
Richardson, 2014, AD Research Centers Patients70 | DDE, Measured | Serum, Baseline | United States | Case-Control, 2002–2008 | 86 | 165 | OR=4.18 (2.54, 5.82) |
| AD-related Mortality (Medical records) |
Koeman, 2015, NLCS77 | All pesticides, JEM | Occupational, Lifetime | Netherlands | Longitudinal, 1986–2003 | 113 | 2,098 men | Herbicides: OR=0.70 (0.24, 2.02); Insecticides: OR=0.87 (0.40, 1.90); Pesticides: OR=0.86 (0.40, 1.88) |
| Dementia (Medical Records) |
Lin, 2015, NHIRD72 | Acute OP poisoning, Medical records | N/A | Taiwan | Longitudinal, 2000–2011 | 507 | 48,126 | HR=1.98 (95% CI, 1.59–2.47) |
JEM=Job Exposure Matrix; LOD=Limit of Detection; N/A=Not applicable, exposure is acute OP poisoning based on hospital records.
Studies: NHANES= National Health and Examination Survey; AHS= Agricultural Health Study; CARDIA=Coronary Artery Risk Development in Young Adults cohort; PIVUS=The Prospective Investigation of the Vasculature in Uppsala Seniors study; NHS= Nurses’ Health Cohort; PAQUID=Personnes Agées Quid; CHSA= The Canadian Study of Health and Aging; MSHA= Manitoba Study of Health and Aging; SLSJ= Saguenay–Lac Saint-Jean region study; CCME= Cache County Memory Study; NLCS= The Netherlands Cohort Study; NHIRD=National Health Insurance Research Database
Most prominently, the Agricultural Health Study, which identified 1,176 incident T2DM cases among 31,787 licensed agriculture pesticide applicators, found that self-reported occupational exposure to two different OCs and four OPs was associated with T2DM risk (Table 4)64. Intriguingly, a study of the spouses of these applicators reported that, among farmers’ wives who also personally mixed or applied pesticides, exposure to 3 OP pesticides and 1 OC pesticide was associated with a higher risk of T2DM65. The Great Lakes Consortium for the Health Assessment longitudinal cohort (n=435), measured serum DDE (an OC) at baseline, and found increasing levels to be associated with incident T2DM over the following 10 years (p for trend=0.008; tertile 3 vs 1: OR=7.1; 95% CI=1.6, 31.9)66. Likewise, the PIVUS cohort in Sweden, with 725 participants and 36 T2DM cases, linked higher levels of three OCs, HCB, DDE, and trans-nonachlor, with T2DM incidence after 5 years of follow-up (summary measure of the 3 OCs, quintile 5 vs 1: OR=3.4; 95% CI=1.0, 11.7)67. Additionally, two nested case-control studies, one within the Nurses’ Health Cohort, measured multiple OCs, including HCB and trans-nonachlor, and found a number of difference OCs to be associated with T2DM68,69 (see Table 4).
A systematic review of pesticides and T2DM included 22 studies and reported the top tertile of exposure to any type of pesticide (vs. bottom) to increase T2DM risk by nearly 60% (OR=1.58; 95% CI=1.32–1.90), and the OC pesticide specific summary OR was 1.68 (95% CI= 1.37–2.07)33. This meta-analysis found T2DM to be also associated with HCB, DDE, and trans-nonachlor individually. OPs were not specifically identified in this meta-analysis, but both studies that investigated OPs to date have found this exposure to be related to T2DM (Table 4).
Alzheimer’s Disease
Table 4 outlines studies that investigated pesticides and AD or dementia. Few have relied on measured levels of pesticide metabolites in serum or plasma as has been common in T2DM studies. Instead, studies used occupational exposure questionnaires and self-report, which limited the ability to assess specific chemicals or chemical classes. Nevertheless, a small case-control study, which relied on 86 patients from the Alzheimer’s Disease Research Center in Texas and 79 controls, measured serum DDE and found that higher serum levels were associated with 4 times the risk of AD (OR=4.18; 95%=2.54, 5.82)70. Furthermore, a large longitudinal cohort, consisting of 3,084 members of the agricultural community of Cache County, Utah, used occupational history questionnaires to assess OC and OP exposures71. In this cohort, 344 participants developed AD, and both OP (HR=1.53, 95% CI 1.05–2.23) and OC exposure (HR=1.49, 95% CI 0.99–2.24) was associated with an increased risk of AD. More recently, a Taiwanese group found that hospitalizations for acute OP poisoning were associated with an increased risk of all-cause dementia (HR=1.98; 95% CI, 1.59–2.47) when using the Nation Health Insurance Research Database72.
Other studies of AD have relied on a measure of ‘all’ pesticides combined. Since 1994, when the Canadian Study of Health and Aging first reported higher occupational exposure to pesticides was associated with an increased risk of AD (OR=2.17; 95% CI=1.18, 3.99)73, multiple other studies have followed. Another Canadian study, the Manitoba Study of Health and Aging (n=694) found no association with all pesticides (OR=1.45, 95% CI=0.57, 3.68) but an increased AD risk from fumigants/defoliants (OR=4.53, 95% CI=1.05, 17.09)74. A French study, PAQUID, reports exposure doubles the risk of AD (n=1507; RR=2.4; 95% CI=1.0, 5.6)75. Both conducted 5 year follow-ups and reported higher risk estimates for AD with occupational exposure. On the other hand, a small Canadian case-control study (n=67 pairs) that assessed residential proximity to pesticide use (record based) found no association with AD (OR=0.97; 95% CI=0.38, 2.41)76. A large cohort from the Netherlands also found no association between pesticides and AD-related mortality77. However, this study relied on death certificates to assess the outcome. AD is generally not considered a cause of death, and therefore often not listed on death certificates. Additionally, despite the large study size, there were only a handful of death certificates with AD listed among those with occupational exposure (n=16)77.
Interestingly, the nationwide study in Taiwan analyzing acute OP poisoning and AD hospitalizations also investigated whether or not T2DM modified this relationship and found that T2DM enhanced the risk of dementia in those with acute pesticide poisoning (HR= 2.95; 95%=2.02–4.31; p for interaction=0.03)72.
Conclusions
Both biologic mechanisms and epidemiologic evidence strongly support a link between T2DM and AD. Collectively, environmental and occupational studies provide strong evidence that air pollution and pesticides are associated with an increased risk of T2DM, and there is suggestive evidence for a link with AD. We hypothesize that these shared environmental risk factors may initiate pathogenic events involved in both disorders, with T2DM exacerbating neuronal and metabolic dysfunction, further increasing the risk of developing AD. This is supported by the few studies reporting that metabolic dysfunction may modify the influence environmental exposures on health outcomes, including cognitive function.
The etiology of T2DM and AD is complex and heterogeneous. Researchers relying on both medical record data and aging cohorts have previously linked air pollutants and pesticides to both T2DM and cognition, sometimes in the same studies. In future research, T2DM should also be investigated as both a mediator and modifier between exposure and cognition. Furthermore, it is important to not only consider environmental factors generally, but also consider relevant features of exposures. This includes types of exposures, such as those discussed in this review, as well as mixtures of toxicants, and the timing of exposures.
Methods of ambient air pollution exposure assessment have been reviewed previously and have been steadily improving over the past decades78,79. For pesticides, a research challenge is to address a multitude of sources (e.g. occupational, home and gardening, diet, and proximity to agriculture), as well as a large number of different chemical compounds and classes that are changing over time. For some compounds, such as the POPs, biomarkers may be the best option. For other pesticides that do not bio-accumulate, such as OPs and permethrins, methods based on agricultural application records or job exposure matrices may be the best approach for assessing longer term exposure 80,81, but these need validation.
Additionally, with chronic diseases such as these, long term low-level exposures are likely important. Ambient monitoring for air pollution has become widespread in the United States since the 1990s, enabling future research of long-term exposures based on address histories. While publicly accessible databases of commercial pesticide use exist, such as the California Pesticide Use Reports, few countries record such information. However, researchers are developing methods to estimate historic environmental pesticide exposure based on land-use records to identify agriculture fields and residential address histories82. This may represent a good alternative approach for pesticide exposure assessment without requiring participant recall in countries that do not collect pesticide use records. A recent proposal to require pesticide producers to conduct some post marketing ‘pesticidovigilance’ similar to pharmacovigilance employed in post approval marketing, use and monitoring of pharmaceuticals might also be an effective approach to assessing human health consequences from widespread pesticide exposures83.
Ultimately, research thoughtfully considering environmental factors and the complexities of exposure assessment and focusing on exposures related to both T2DM and AD could be key to new disease insights on shared mechanisms and help shape innovative preventative measures and policy decisions. Such studies will ideally elaborate on the role of shared environmental risk factors contributing to these disorders, including but not limited to air pollution and pesticides, and consider how metabolic dysfunction may modify the impact of these exposures on cognitive decline.
Acknowledgments
This work was supported by National Institute of Environmental Health Sciences (F32-ES028087 (KP), 2R01-ES010544 (BR), R01-ES023451 (BR, MJ)).
Abbreviations
- DDT
dichlorodiphenyltrichloroethane
- DDE
dichlorodiphenyldichloroethylene
- HCB
hexachlorobenzene
- ppb
parts per billion
Footnotes
Compliance with Ethical Standards
Conflict of Interest
Kimberly C. Paul, Michael Jerrett, and Beate Ritz declare that they have no conflict of interest.
Human and Animal Rights and Informed Consent
This article does not contain any studies with human or animal subjects performed by any of the authors.
References
- 1.United Nations. Report of the Second World Assembly on Ageing: Madrid, 8-12 April 2002. United Nations Publications; 2002. http://www.un.org/en/ga/search/view_doc.asp?symbol=A/CONF.197/9. [Google Scholar]
- 2.Prince M, Bryce R, Albanese E, Wimo A, Ribeiro W, Ferri CP. The global prevalence of dementia: A systematic review and metaanalysis. Alzheimer’s Dement. 2013;9(1):63–75. doi: 10.1016/j.jalz.2012.11.007. [DOI] [PubMed] [Google Scholar]
- 3.Whiting DR, Guariguata L, Weil C, Shaw J. IDF Diabetes Atlas: Global estimates of the prevalence of diabetes for 2011 and 2030. Diabetes Res Clin Pract. 2011;94(3):311–321. doi: 10.1016/j.diabres.2011.10.029. [DOI] [PubMed] [Google Scholar]
- 4.Han W, Li C. Linking type 2 diabetes and Alzheimer’s disease. Proc Natl Acad Sci. 2010;107(15):6557–6558. doi: 10.1073/pnas.1002555107. [DOI] [PMC free article] [PubMed] [Google Scholar]
- 5.Forner S, Baglietto-Vargas D, Martini AC, Trujillo-Estrada L, LaFerla FM. Synaptic Impairment in Alzheimer’s Disease: A Dysregulated Symphony. Trends Neurosci. 2017;40(6):347–357. doi: 10.1016/j.tins.2017.04.002. [DOI] [PubMed] [Google Scholar]
- 6.Morrison CD. Leptin signaling in brain: A link between nutrition and cognition? Biochim Biophys Acta - Mol Basis Dis. 2009;1792(5):401–408. doi: 10.1016/j.bbadis.2008.12.004. [DOI] [PMC free article] [PubMed] [Google Scholar]
- 7.Zhao WQ, Alkon DL. Role of insulin and insulin receptor in learning and memory. Mol Cell Endocrinol. 2001;177(1–2):125–134. doi: 10.1016/S0303-7207(01)00455-5. [DOI] [PubMed] [Google Scholar]
- 8.Chiu SL, Chen CM, Cline HT. Insulin Receptor Signaling Regulates Synapse Number, Dendritic Plasticity, and Circuit Function In Vivo. Neuron. 2008;58(5):708–719. doi: 10.1016/j.neuron.2008.04.014. [DOI] [PMC free article] [PubMed] [Google Scholar]
- 9.Harvey J. Leptin regulation of neuronal excitability and cognitive function. Curr Opin Pharmacol. 2007;7(6):643–647. doi: 10.1016/j.coph.2007.10.006. [DOI] [PMC free article] [PubMed] [Google Scholar]
- 10.Eckman EA, Eckman CB. Abeta-degrading enzymes: modulators of Alzheimer’s disease pathogenesis and targets for therapeutic intervention. Biochem Soc Trans. 2005;33(Pt 5):1101–1105. doi: 10.1042/BST20051101. [DOI] [PubMed] [Google Scholar]
- 11.Farris W, Mansourian S, Chang Y, et al. Insulin-degrading enzyme regulates the levels of insulin, amyloid beta-protein, and the beta-amyloid precursor protein intracellular domain in vivo. Proc Natl Acad Sci U S A. 2003;100(7):4162–4167. doi: 10.1073/pnas.0230450100. [DOI] [PMC free article] [PubMed] [Google Scholar]
- 12.FEWLASS DC. Obesity-related leptin regulates Alzheimer’s A. FASEB J. 2004;18(15):1870–1878. doi: 10.1096/fj.04-2572com. [DOI] [PubMed] [Google Scholar]
- 13.Phiel CJ, Wilson Ca, Lee VM-Y, Klein PS. GSK-3alpha regulates production of Alzheimer’s disease amyloid-beta peptides. Nature. 2003;423:435–439. doi: 10.1038/nature01640. (lane 2) [DOI] [PubMed] [Google Scholar]
- 14.Takeda S, Sato N, Uchio-Yamada K, et al. Diabetes-accelerated memory dysfunction via cerebrovascular inflammation and A deposition in an Alzheimer mouse model with diabetes. Proc Natl Acad Sci. 2010;107(15):7036–7041. doi: 10.1073/pnas.1000645107. [DOI] [PMC free article] [PubMed] [Google Scholar]
- 15.de la Monte SM, Wands JR. Alzheimer’s Disease is Type 3 Diabetes—Evidence Reviewed. J Diabetes Sci Technol. 2008;2(6):1101–1113. doi: 10.1177/193229680800200619. [DOI] [PMC free article] [PubMed] [Google Scholar]
- 16.Vella RE, Pillon NJ, Zarrouki B, et al. Ozone exposure triggers insulin resistance through muscle c-Jun N-terminal kinase activation. Diabetes. 2015;64(3):1011–1024. doi: 10.2337/db13-1181. [DOI] [PubMed] [Google Scholar]
- 17.Bass V, Gordon CJ, Jarema KA, et al. Ozone induces glucose intolerance and systemic metabolic effects in young and aged brown Norway rats. Toxicol Appl Pharmacol. 2013;273(3):551–560. doi: 10.1016/j.taap.2013.09.029. [DOI] [PMC free article] [PubMed] [Google Scholar]
- 18.Ott A, Stolk RP, van Harskamp F, Pols HA, Hofman A, Breteler MM. Diabetes mellitus and the risk of dementia: The Rotterdam Study. Neurology. 1999;53(9):1937–1942. doi: 10.1212/WNL.53.9.1937. [DOI] [PubMed] [Google Scholar]
- 19.Katon W, Pedersen HS, Ribe AR, et al. Effect of Depression and Diabetes Mellitus on the Risk for Dementia: A National Population-Based Cohort Study. JAMA psychiatry. 2015;98195:1–8. doi: 10.1001/jamapsychiatry.2015.0082. [DOI] [PMC free article] [PubMed] [Google Scholar]
- 20.Schmidt M, Schmidt SAJ, Sandegaard JL, Ehrenstein V, Pedersen L, Sørensen HT. The Danish National patient registry: A review of content, data quality, and research potential. Clin Epidemiol. 2015;7:449–490. doi: 10.2147/CLEP.S91125. [DOI] [PMC free article] [PubMed] [Google Scholar]
- 21.Wang K-C, Woung L-C, Tsai M-T, Liu C-C, Su Y-H, Li C-Y. Risk of Alzheimer’s Disease in Relation to Diabetes: A Population-Based Cohort Study. Neuroepidemiology. 2012;38(4):237–244. doi: 10.1159/000337428. http://www.karger.com/DOI/10.1159/000337428. [DOI] [PubMed] [Google Scholar]
- 22.Kimm H, Lee PH, Shin YJ, et al. Mid-life and late-life vascular risk factors and dementia in Korean men and women. Arch Gerontol Geriatr. 2011;52(3) doi: 10.1016/j.archger.2010.09.004. [DOI] [PubMed] [Google Scholar]
- 23.Peila R, Rodriguez BL, Launer LJ. Type 2 Diabetes, APOE Gene, and the Risk for Dementia and Related Pathologies. Diabetes. 2002 Apr;51:1256–1262. doi: 10.2337/diabetes.51.4.1256. [DOI] [PubMed] [Google Scholar]
- 24.Ahtiluoto S, Polvikoski T, Peltonen M, et al. Diabetes, Alzheimer disease, and vascular dementia: A population-based neuropathologic study. Neurology. 2010;75(13):1195–1202. doi: 10.1212/WNL.0b013e3181f4d7f8. [DOI] [PubMed] [Google Scholar]
- 25.Ohara T, Doi Y, Ninomiya T, et al. Glucose tolerance status and risk of dementia in the community: The Hisayama Study. Neurology. 2011;77(12):1126–1134. doi: 10.1212/WNL.0b013e31822f0435. [DOI] [PubMed] [Google Scholar]
- 26.Akomolafe A, Beiser A, Meigs JB, et al. Diabetes mellitus and risk of developing Alzheimer disease: results from the Framingham Study. Arch Neurol. 2006;63(11):1551–1555. doi: 10.1001/archneur.63.11.1551. [DOI] [PubMed] [Google Scholar]
- 27.MacKnight C, Rockwood K, Awalt E, McDowell I. Diabetes mellitus and the risk of dementia, Alzheimer’s disease and vascular cognitive impairment in the Canadian Study of Health and Aging. Dement Geriatr Cogn Disord. 2002;14(2):77–83. doi: 10.1159/000064928. doi:64928 [pii] [DOI] [PubMed] [Google Scholar]
- 28.Vagelatos NT, Eslick GD. Type 2 diabetes as a risk factor for Alzheimer’s disease: The confounders, interactions, and neuropathology associated with this relationship. Epidemiol Rev. 2013;35(1):152–160. doi: 10.1093/epirev/mxs012. [DOI] [PubMed] [Google Scholar]
- 29.Brook RD, Rajagopalan S, Pope CA, et al. Particulate Matter Air Pollution and Cardiovascular Disease. Circulation. 2010;121(21):2331–2378. doi: 10.1161/CIR.0b013e3181dbece1. [DOI] [PubMed] [Google Scholar]
- 30.Wang B, Xu D, Jing Z, Liu D, Yan S, Wang Y. Effect of long-term exposure to air pollution on type 2 diabetes mellitus risk: a systemic review and meta-analysis of cohort studies. Eur J Endocrinol. 2014;171(5):R173–82. doi: 10.1530/EJE-14-0365. [DOI] [PubMed] [Google Scholar]
- 31.Raaschou-Nielsen O, Andersen ZJ, Beelen R, et al. Air pollution and lung cancer incidence in 17 European cohorts: Prospective analyses from the European Study of Cohorts for Air Pollution Effects (ESCAPE) Lancet Oncol. 2013;14(9):813–822. doi: 10.1016/S1470-2045(13)70279-1. [DOI] [PubMed] [Google Scholar]
- 32.Block ML, Elder A, Auten RL, et al. The outdoor air pollution and brain health workshop. Neurotoxicology. 2012;33(5):972–984. doi: 10.1016/j.neuro.2012.08.014. [DOI] [PMC free article] [PubMed] [Google Scholar]
- 33.Evangelou E, Ntritsos G, Chondrogiorgi M, et al. Exposure to pesticides and diabetes: A systematic review and meta-analysis. Environ Int. 2016;91:60–68. doi: 10.1016/j.envint.2016.02.013. [DOI] [PubMed] [Google Scholar]
- 34.Zaganas I, Kapetanaki S, Mastorodemos V, et al. Linking pesticide exposure and dementia: What is the evidence? Toxicology. 2013;307:3–11. doi: 10.1016/j.tox.2013.02.002. [DOI] [PubMed] [Google Scholar]
- 35.Brook RD, Jerrett M, Brook JR, Bard RL, Finkelstein MM. The relationship between diabetes mellitus and traffic-related air pollution. J Occup Environ Med. 2008;50(1):32–38. doi: 10.1097/JOM.0b013e31815dba70. [DOI] [PubMed] [Google Scholar]
- 36.Coogan PF, White LF, Jerrett M, et al. Air Pollution and Incidence of Hypertension and Diabetes in African American Women Living in Los Angeles. Circulation. 2012 doi: 10.1161/CIRCULATIONAHA.111.052753. doi:CIRCULATIONAHA.111.052753 [pii] [DOI] [PMC free article] [PubMed] [Google Scholar]
- 37.Andersen ZJ, Raaschou-Nielsen O, Ketzel M, et al. Diabetes incidence and long-term exposure to air pollution: a cohort study. Diabetes Care. 2012;35(1):92–98. doi: 10.2337/dc11-1155. [DOI] [PMC free article] [PubMed] [Google Scholar]
- 38.Krämer U, Herder C, Sugiri D, et al. Traffic-related air pollution and incident type 2 diabetes: Results from the SALIA cohort study. Environ Health Perspect. 2010;118(9):1273–1279. doi: 10.1289/ehp.0901689. [DOI] [PMC free article] [PubMed] [Google Scholar]
- 39.G W, K F, F H, et al. Industry and traffic related air pollution and diabetes type two incidence: Results from a German cohort study. Eur J Epidemiol. 2012;27(1 SUPPL. 1):S12. http://ovidsp.ovid.com/ovidweb.cgi?T=JS&PAGE=reference&D=emed14&NEWS=N&AN=71302821. [Google Scholar]
- 40.Eze IC, Schaffner E, Fischer E, et al. Long-term air pollution exposure and diabetes in a population-based Swiss cohort. Environ Int. 2014;70:95–105. doi: 10.1016/j.envint.2014.05.014. [DOI] [PubMed] [Google Scholar]
- 41.Park SK, Adar SD, O’Neill MS, et al. Long-term exposure to air pollution and type 2 diabetes mellitus in a multiethnic cohort. Am J Epidemiol. 2015;181(5):327–336. doi: 10.1093/aje/kwu280. [DOI] [PMC free article] [PubMed] [Google Scholar]
- 42.Brook RD, Cakmak S, Turner MC, et al. Long-term fine particulate matter exposure and mortality from diabetes in Canada. Diabetes Care. 2013;36(10):3313–3320. doi: 10.2337/dc12-2189. [DOI] [PMC free article] [PubMed] [Google Scholar]
- 43.Chen H, Burnett RT, Kwong JC, et al. Risk of incident diabetes in relation to long-term exposure to fine particulate matter in Ontario, Canada. Environ Health Perspect. 2013;121(7):804–810. doi: 10.1289/ehp.1205958. [DOI] [PMC free article] [PubMed] [Google Scholar]
- 44.Puett RC, Hart JE, Schwartz J, Hu FB, Liese AD, Laden F. Are particulate matter exposures associated with risk of type 2 diabetes? Environ Health Perspect. 2011;119(3):384–389. doi: 10.1289/ehp.1002344. [DOI] [PMC free article] [PubMed] [Google Scholar]
- 45.Weinmayr G, Hennig F, Fuks K, et al. Long-term exposure to fine particulate matter and incidence of type 2 diabetes mellitus in a cohort study: effects of total and traffic-specific air pollution. Environ Heal. 2015;14(1):53. doi: 10.1186/s12940-015-0031-x. [DOI] [PMC free article] [PubMed] [Google Scholar]
- 46.Eze IC, Hemkens LG, Bucher HC, et al. Association between ambient air pollution and diabetes mellitus in Europe and North America: systematic review and meta-analysis. Env Heal Perspect. 2015;123(5):381–389. doi: 10.1289/ehp.1307823. [DOI] [PMC free article] [PubMed] [Google Scholar]
- 47.Mazure CM, Swendsen J. Sex differences in Alzheimer’s disease and other dementias. Lancet Neurol. 2016;15(5):451–452. doi: 10.1016/S1474-4422(16)00067-3. [DOI] [PMC free article] [PubMed] [Google Scholar]
- 48.Jung C-R, Lin Y-T, Hwang B-F. Ozone, particulate matter, and newly diagnosed Alzheimer’s disease: a population-based cohort study in Taiwan. J Alzheimers Dis. 2015;44(2):573–584. doi: 10.3233/JAD-140855. [DOI] [PubMed] [Google Scholar]
- 49.Kioumourtzoglou MA, Schwartz JD, Weisskopf MG, et al. Long-term PM Exposure and Neurological Hospital Admissions in the Northeastern United States. Environ Health Perspect. 2015;124(1):23–29. doi: 10.1289/ehp.1408973. [DOI] [PMC free article] [PubMed] [Google Scholar]
- 50.Weuve J, Puett RC, Schwartz J, Yanosky JD, Laden F, Grodstein F. Exposure to particulate air pollution and cognitive decline in older women. Arch Intern Med. 2012;172(3):219–227. doi: 10.1001/archinternmed.2011.683. [DOI] [PMC free article] [PubMed] [Google Scholar]
- 51.Loop MS, Kent ST, Al-Hamdan MZ, et al. Fine Particulate Matter and Incident Cognitive Impairment in the REasons for Geographic and Racial Differences in Stroke (REGARDS) Cohort. PLoS One. 2013;8(9) doi: 10.1371/journal.pone.0075001. [DOI] [PMC free article] [PubMed] [Google Scholar]
- 52.Tonne C, Elbaz A, Beevers S, Singh-Manoux A. Traffic-related air pollution in relation to cognitive function in older adults. Epidemiology. 2014;25(5):674–681. doi: 10.1097/EDE.0000000000000144. [DOI] [PMC free article] [PubMed] [Google Scholar]
- 53.Schikowski T, Vossoughi M, Vierkötter A, et al. Association of air pollution with cognitive functions and its modification by APOE gene variants in elderly women. Environ Res. 2015;142:10–16. doi: 10.1016/j.envres.2015.06.009. [DOI] [PubMed] [Google Scholar]
- 54.Wu Y-C, Lin Y-C, Yu H-L, et al. Association between air pollutants and dementia risk in the elderly. Alzheimer’s Dement Diagnosis, Assess Dis Monit. 2015;1(2):220–228. doi: 10.1016/j.dadm.2014.11.015. [DOI] [PMC free article] [PubMed] [Google Scholar]
- 55.Oudin A, Forsberg B, Adolfsson AN, et al. Traffic-related air pollution and dementia incidence in Northern Sweden: A longitudinal study. Environ Health Perspect. 2016;124(3):306–312. doi: 10.1289/ehp.1408322. [DOI] [PMC free article] [PubMed] [Google Scholar]
- 56.Chang K-H, Chang M-Y, Muo C-H, Wu T-N, Chen C-Y, Kao C-H. Increased Risk of Dementia in Patients Exposed to Nitrogen Dioxide and Carbon Monoxide: A Population-Based Retrospective Cohort Study. PLoS One. 2014;9(8):e103078. doi: 10.1371/journal.pone.0103078. [DOI] [PMC free article] [PubMed] [Google Scholar]
- 57.Power MC, Weisskopf MG, Alexeeff SE, Coull BA, Avron S, Schwartz J. Traffic-related air pollution and cognitive function in a cohort of older men. Environ Health Perspect. 2011;119(5):682–687. doi: 10.1289/ehp.1002767. [DOI] [PMC free article] [PubMed] [Google Scholar]
- 58.Miller KA, Siscovick DS, Sheppard L, et al. Long-term exposure to air pollution and incidence of cardiovascular events in women. N Engl J Med. 2007;356(5):447–458. doi: 10.1056/NEJMoa054409. [DOI] [PubMed] [Google Scholar]
- 59.Bro-Rasmussen F. Contamination by persistent chemicals in food chain and human health. Science of the Total Environment. 1996;188 doi: 10.1016/0048-9697(96)05276-X. [DOI] [PubMed] [Google Scholar]
- 60.To Review the Health Effects in Vietnam Veterans of Exposure to Herbicides (Tenth Biennial Update) C, on the Health of Select Populations B, of Medicine I, of Sciences Engineering, Medicine. Veterans and Agent Orange: Update 2014. 2016 doi: 10.17226/21845. [DOI] [Google Scholar]
- 61.Taylor KW, Novak RF, Anderson HA, et al. Evaluation of the association between persistent organic pollutants (POPs) and diabetes in epidemiological studies: A national toxicology program workshop review. Environ Health Perspect. 2013;121(7):774–783. doi: 10.1289/ehp.1205502. [DOI] [PMC free article] [PubMed] [Google Scholar]
- 62.Morgan DP, Lin LI, Saikaly HH. Morbidity and mortality in workers occupationally exposed to pesticides. Arch Environ Contam Toxicol. 1980;9(3):349–382. doi: 10.1007/BF01057414. http://www.ncbi.nlm.nih.gov/pubmed/7396557. [DOI] [PubMed] [Google Scholar]
- 63.Lee D-H, Lee I-K, Song K, et al. A strong dose-response relation between serum concentrations of persistent organic pollutants and diabetes: results from the National Health and Examination Survey 1999-2002. Diabetes Care. 2006;29(7):1638–1644. doi: 10.2337/dc06-0543. [DOI] [PubMed] [Google Scholar]
- 64.Montgomery MP, Kamel F, Saldana TM, Alavanja MCR, Sandler DP. Incident diabetes and pesticide exposure among licensed pesticide applicators: Agricultural Health Study, 1993-2003. Am J Epidemiol. 2008;167(10):1235–1246. doi: 10.1093/aje/kwn028. [DOI] [PMC free article] [PubMed] [Google Scholar]
- 65.Starling AP, Umbach DM, Kamel F, Long S, Sandler DP, Hoppin JA. Pesticide use and incident diabetes among wives of farmers in the Agricultural Health Study. Occup Environ Med. 2014;71(9):629–635. doi: 10.1136/oemed-2013-101659. [DOI] [PMC free article] [PubMed] [Google Scholar]
- 66.Turyk M, Anderson H, Knobeloch L, Imm P, Persky V. Organochlorine exposure and incidence of diabetes in a cohort of great lakes sport fish consumers. Environ Health Perspect. 2009;117(7):1076–1082. doi: 10.1289/ehp.0800281. [DOI] [PMC free article] [PubMed] [Google Scholar]
- 67.Lee DH, Lind PM, Jacobs DR, Salihovic S, Van Bavel B, Lind L. Polychlorinated biphenyls and organochlorine pesticides in plasma predict development of type 2 diabetes in the elderly: The Prospective Investigation of the Vasculature in Uppsala Seniors (PIVUS) study. Diabetes Care. 2011;34(8):1778–1784. doi: 10.2337/dc10-2116. [DOI] [PMC free article] [PubMed] [Google Scholar]
- 68.Lee D-H, Steffes MW, Sjödin A, Jones RS, Needham LL, Jacobs DR. Low Dose of Some Persistent Organic Pollutants Predicts Type 2 Diabetes: A Nested Case–Control Study. Environ Health Perspect. 2010;118(9):1235–1242. doi: 10.1289/ehp.0901480. [DOI] [PMC free article] [PubMed] [Google Scholar]
- 69.Wu H, Bertrand KA, Choi AL, et al. Persistent organic pollutants and type 2 diabetes: A prospective analysis in the nurses’ health study and meta-analysis. Environ Health Perspect. 2013;121(2):153–161. doi: 10.1289/ehp.1205248. [DOI] [PMC free article] [PubMed] [Google Scholar]
- 70.Richardson JR, Roy A, Shalat SL, et al. Elevated Serum Pesticide Levels and Risk for Alzheimer Disease. JAMA Neurol. 2014;71(3):284. doi: 10.1001/jamaneurol.2013.6030. [DOI] [PMC free article] [PubMed] [Google Scholar]
- 71.Hayden KM, Norton MC, Darcey D, et al. Occupational exposure to pesticides increases the risk of incident AD: the Cache County study. Neurology. 2010;74(19):1524–1530. doi: 10.1212/WNL.0b013e3181dd4423. [DOI] [PMC free article] [PubMed] [Google Scholar]
- 72.Lin J-N, Lin C-L, Lin M-C, et al. Increased Risk of Dementia in Patients With Acute Organophosphate and Carbamate Poisoning: A Nationwide Population-Based Cohort Study. Medicine (Baltimore) 2015;94(29):e1187. doi: 10.1097/MD.0000000000001187. [DOI] [PMC free article] [PubMed] [Google Scholar]
- 73.McDowell I, Hill G, Lindsay J, et al. The Canadian study of health and aging: risk-factors for Alzheimers disease in Canada. Neurology. 1994;44(11):2073–2080. doi: 10.1212/wnl.44.11.2073. [DOI] [PubMed] [Google Scholar]
- 74.Tyas SL, Manfreda J, Strain A, Montgomery PR. Risk factors for Alzheimer ’ s disease : a population-based, longitudinal study in Manitoba, Canada. Int J Epidemiol. 2001;30:590–597. doi: 10.1093/ije/30.3.590. [DOI] [PubMed] [Google Scholar]
- 75.Baldi I, Lebailly P, Mohammed-Brahim B, Letenneur L, Dartigues JF, Brochard P. Neurodegenerative diseases and exposure to pesticides in the elderly. Am J Epidemiol. 2003;157(5):409–414. doi: 10.1093/aje/kwf216. [DOI] [PubMed] [Google Scholar]
- 76.Gauthier E, Fortier I, Courchesne F, Pepin P, Mortimer J, Gauvreau D. Environmental pesticide exposure as a risk factor for Alzheimer’s disease: a case-control study. Environ Res. 2001;86(1):37–45. doi: 10.1006/enrs.2001.4254. [DOI] [PubMed] [Google Scholar]
- 77.Koeman T, Schouten LJ, van den Brandt PA, et al. Occupational exposures and risk of dementia-related mortality in the prospective Netherlands Cohort Study. Am J Ind Med. 2015;58(6):625–635. doi: 10.1002/ajim.22462. [DOI] [PubMed] [Google Scholar]
- 78.Jerrett M, Arain A, Kanaroglou P, et al. A review and evaluation of intraurban air pollution exposure models. J Expo Anal Environ Epidemiol. 2005;15(2):185–204. doi: 10.1038/sj.jea.7500388. [DOI] [PubMed] [Google Scholar]
- 79.de Hoogh K, Korek M, Vienneau D, et al. Comparing land use regression and dispersion modelling to assess residential exposure to ambient air pollution for epidemiological studies. Environ Int. 2014;73:382–392. doi: 10.1016/j.envint.2014.08.011. [DOI] [PubMed] [Google Scholar]
- 80.Teschke K, Olshan AF, Daniels JL, et al. Occupational exposure assessment in case-control studies: opportunities for improvement. Occup Environ Med. 2002;59(9):575–593. doi: 10.1136/oem.59.9.575. discussion 594. [DOI] [PMC free article] [PubMed] [Google Scholar]
- 81.McGuire V, Nelson LM, Koepsell TD, Checkoway H, Longstreth WT. Assessment of occupational exposures in community-based case-control studies. Annu Rev Public Health. 1998;19(19):35–53. doi: 10.1146/annurev.publhealth.19.1.35. [DOI] [PubMed] [Google Scholar]
- 82.Brouwer M, Kromhout H, Vermeulen R, et al. Assessment of residential environmental exposure to pesticides from agricultural fields in the Netherlands. Journal of Exposure Science and Environmental Epidemiology. 2017 doi: 10.1038/jes.2017.3. [DOI] [PubMed] [Google Scholar]
- 83.Milner AM, Boyd IL. Toward pesticidovigilance. Science (80-) 2017;357(6357):1232–1234. doi: 10.1126/science.aan2683. [DOI] [PubMed] [Google Scholar]
- 84.Hassing LB, Johansson B, Nilsson SE, et al. Diabetes mellitus is a risk factor for vascular dementia, but not for Alzheimer’s disease: a population-based study of the oldest old. Int Psychogeriatrics. 2002;14(3):239–248. doi: 10.1017/s104161020200844x. doi: http://dx.doi.org/10.1017/S104161020200844X. [DOI] [PubMed] [Google Scholar]
- 85.Arvanitakis Z, Wilson RS, Bienias JL, Evans Da, Bennett Da. Diabetes mellitus and risk of Alzheimer disease and decline in cognitive function. Arch Neurol. 2004;61(5):661–666. doi: 10.1001/archneur.61.5.661. [DOI] [PubMed] [Google Scholar]
- 86.Xu WL, Qiu CX, Wahlin A, Winblad B, Fratiglioni L. Diabetes mellitus and risk of dementia in the Kungsholmen project: a 6-year follow-up study. Neurology. 2004;63(7):1181–1186. doi: 10.1212/01.WNL.0000140291.86406.D1. [DOI] [PubMed] [Google Scholar]
- 87.Luchsinger JA, Reitz C, Honig LS, Tang MX, Shea S, Mayeux R. Aggregation of vascular risk factors and risk of incident Alzheimer disease. Neurology. 2005;65(4):545–551. doi: 10.1212/01.wnl.0000172914.08967.dc. [DOI] [PMC free article] [PubMed] [Google Scholar]
- 88.Raffaitin C, Gin H, Empana J-P, et al. Metabolic syndrome and risk for incident Alzheimer’s disease or vascular dementia: the Three-City Study. Diabetes Care. 2009;32(1):169–174. doi: 10.2337/dc08-0272. [DOI] [PMC free article] [PubMed] [Google Scholar]
- 89.Al-Emam A, Elhaddad AA, Ramadan E. The risk of clinically diagnosed alzheimer disease in patients with non insulin dependent diabetes mellitus. Egypt J Neurol Psychiatry Neurosurg. 2010;47(3):419–424. [Google Scholar]
- 90.Huang C-C, Chung C-M, Leu H-B, et al. Diabetes Mellitus and the Risk of Alzheimer’s Disease: A Nationwide Population-Based Study. PLoS One. 2014;9(1):e87095. doi: 10.1371/journal.pone.0087095. [DOI] [PMC free article] [PubMed] [Google Scholar]
- 91.Parrón T, Requena M, Hernández AF, Alarcón R. Association between environmental exposure to pesticides and neurodegenerative diseases. Toxicol Appl Pharmacol. 2011;256(3):379–385. doi: 10.1016/j.taap.2011.05.006. [DOI] [PubMed] [Google Scholar]