Abstract
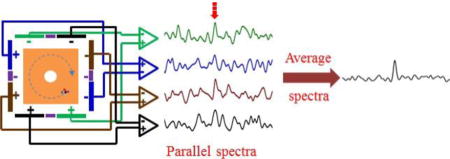
Fourier transform ion cyclotron resonance mass spectrometry (FTICR-MS) is well-renowned for its ultrahigh resolving power and mass measurement accuracy. As with other types of analytical instrumentation, achievable signal-to-noise ratio (S/N) is an important analytical figure of merit with FTICR-MS. S/N can be improved with higher magnetic fields and longer time-domain signal acquisition periods. However, serial signal averaging of spectra or time-domain signals acquired with multiple ion populations is most commonly used to improve S/N. On the other hand, serial acquisition and averaging of multiple scans significantly increases required data acquisition time and is often incompatible with on-line chromatographic separations. In this study, we investigated the potential for increased S/N by averaging 4 spectra that were acquired in parallel with a single ICR cell with 4 pairs of dipole detection electrodes, each with an independent pre-amplifier. This spectral averaging was achieved with no need for multiple ion accumulation events nor multiple, serial excitation and detection events. These efforts demonstrated that parallel signal acquisition with 4 detector electrode pairs produces S/N 1.76-fold higher than that from a single detection electrode pair. With parallel detection, improved S/N was achieved with no observable loss in resolving power (100,000) as compared with that from a single detection electrode pair. These results demonstrate that parallel detection of multiple induced image current signals with multiple preamplifiers exists as a viable option for future instrumentation to increase achievable S/N and sensitivity. This approach may have general utility especially where conventional serial signal averaging is impractical.
Graphical abstract
Introduction
Commonly discussed analytical figures of merit in mass spectrometry include resolving power, mass measurement accuracy, achieved signal-to-noise ratio (S/N), dynamic range and sensitivity. Fourier transform ion cyclotron resonance mass spectrometry (FTICR-MS) is well-renowned for its ultrahigh resolving power and mass measurement accuracy that is derived from the detection of ion cyclotron image current over many millions or billions of periods of cyclotron motion.[1–3] Detection of increasingly higher numbers of periods can increase the ability to distinguish ions with very nearly the same mass and to define observed masses with increasingly tighter tolerance. However, detection of longer time-domain signals also limits acquisition scan rates and therefore, adversely affects how these instruments can be coupled with on-line chromatography. To improve on high resolution scan rates, higher magnetic fields,[4–7] detection of higher frequency harmonic signals [6, 8–11] and the use of parallel analyzer arrays are being investigated [12, 13].
Signal-to-noise, sensitivity and dynamic range can also be improved with higher magnetic fields.[6, 7] However, serial signal averaging of spectra or time-domain signals acquired with multiple ion populations is most commonly used to improve S/N and dynamic range.[14–16] On the other hand, this further inflates required acquisition times since each time-domain signal is acquired serially and each additional ion accumulation and transfer event can further decrease achieved spectral acquisition rates. Remeasurement of trapped ion populations has also been investigated as a means to improve the achievable S/N.[17, 18] In this case, after initial excitation and detection, subsequent acquisition events were implemented to improve the S/N acquired from the same ions. However, diminishing signals are typically observed in subsequent remeasurement events due to ion loss or non-optimal ion positions during each subsequent excitation event. Moreover, remeasurement circumvents neither the additional time requirement imposed by multiple serial time-domain signal acquisition events nor the imposed limitations for FTICR-MS signal averaging during on-line chromatographic separations.
Recent efforts in our lab have focused on development of FTICR-mass spectrometer array technologies where parallel detection of several independent ion populations in multiple ICR cells can be achieved. This has been accomplished both with linear arrays [12] with ICR cells position along the central magnetic field axis and cells position orthogonal to this axis using crossed-magnetic field drift [13]. As a component of required system development, multiple pre-amplifier array technologies were established to enable simultaneous acquisition of parallel ICR signals from each array element cell. Here, we investigate the use of pre-amplifier arrays with single ICR cells designed to incorporate multiple detector electrode pairs. Thus, the detector electrode pairs configured within a given ICR cell geometry could conceivably be used to improve S/N through averaging multiple signals acquired in parallel. The efforts presented here demonstrate that achieved S/N scales with the number of ICR cell detector electrode pairs and pre-amplifiers used. Importantly, this spectral averaging is achieved without need for multiple ion accumulation events nor multiple, serial excitation and detection events. Thus, the use of preamplifier arrays even with single ICR cells can be helpful to improve S/N through spectral averaging and improve sensitivity without increasing acquisition time.
Experimental Section
LTQ FT-ICR MS
All experiments were performed using a modified hybrid linear ion trap Fourier transform ion cyclotron resonance mass spectrometer (LTQ FT-ICR MS; Thermo Scientific, Bremen, Germany) originally equipped with a cylindrical Ultra ICR cell and 7 T actively shielded superconducting magnet (Japan Superconductor Technology, Tokyo, Japan). After the removal of the Ultra cell and the installation of a custom ICR cell with 4 pairs of dipole detection electrodes, a preamplifier array, a custom multi-pin feedthrough flange on the source side of the vacuum system and wiring, the system was pumped and baked out overnight. Electrospray ionization (ESI) was used to generate ions with a syringe pump and infusion of samples at a rate of 3.0 μL/min. An ESI spray voltage of 4.5 kV was applied to a sample solution through a metal union for ionization. The ions were accumulated in the LTQ and were then transferred to the ICR cell through the original equipment octapole ion guide. Ion populations inside the LTQ were accumulated with automatic gain control (AGC) on and set to 1.0 × 10⁵. The pressure in the cell region during all experiments was approximately 0.4×10⁻¹⁰ Torr as indicated by the ion gauge on this chamber.
Design of ICR cell with 4 pairs of dipole detection electrodes
An ICR cell with 4 pairs of dipole detection electrodes was constructed with 6 printed circuit boards (PCBs) plates, top/bottom, two side and entrance/exit lens plates. On the PCB plates, all electrodes including excitation electrodes, detection electrodes, and front/back lens electrodes were constructed using gold-coated copper. Four identical plates were used for top, bottom and side plates. Figure 1 shows images and a schematic diagram of the ICR cell components used for this study. In this ICR cell, the top/bottom and side plates with 1.0″ in width were segmented into three sections as shown in Figure 1A. The middle electrodes with 0.18″ in width were used for excitation electrodes. One of the electrodes with 0.4″ in width was used as a detection electrode pair designated as “Detector pair 1” and the other was used for “Detector pair 2”. The 0.1 inch wide segments at the ends of the detection and excitation electrodes were used as trapping electrodes. The segments next to the trapping electrodes were 0.3″ in width and were held at a ground potential in all experiments.[13] The length (along the magnetic field axis) of all electrodes was 3.4″. Detector Pairs 3 and 4 were located in the side plates as shown. The entrance and exit lens plates are shown in Figure 1B. These electrodes had a 0.2 inch diameter hole at the center of the electrode through which the ions were transferred from the LTQ.
Figure 1.
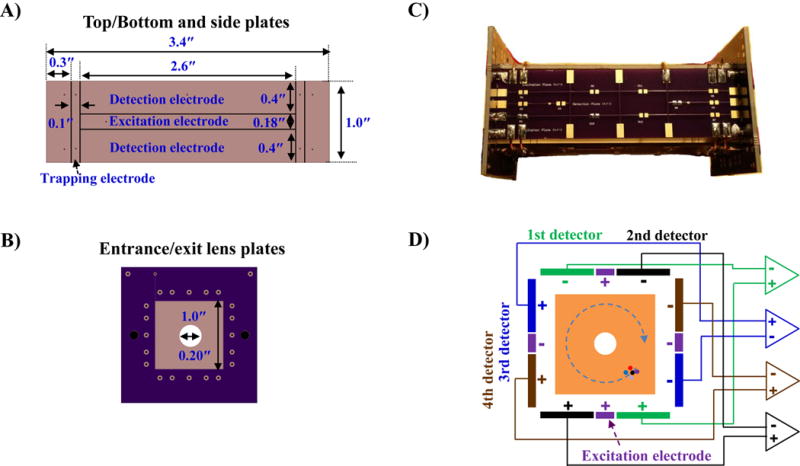
Individual PCB components and an ICR cell with 4 pairs of dipole detection electrodes. Top/bottom and side (A) plates showing excitation, detection and trapping electrodes printed on board. Entrance/exit lens plates (B). The assembled ICR cell with 4 pairs of dipole detection electrodes (C) and the transverse cross section (magnetic field axis projects into the plane of this figure) with a wiring diagram (D).
To form the ICR cell with 4 pairs of dipole detection electrodes, the top/bottom and side plates were soldered to the entrance and exit lens plates. After that, the trapping electrode segments were electrically coupled together by soldering 22 AWG copper wires on the pads on the cell outer surface to connect all trapping electrodes. Figure 1C shows the assembled ICR cell with 4 pairs of dipole detection electrodes.
The assembled ICR cell was placed at the end of the octapole ion guide in the place of the ThermoFisher Ultra ICR cell. Each dipole detection electrode pair was connected to a custom vacuum-compatible preamplifier array (GAA Custom Engineering) using Kapton-coated wires (22 AWG, Accu-Glass Products, Inc. Valencia, CA) to allow parallel ICR signal amplification.[12, 13] The preamplifier was mounted at 0.6ʺ away from the back lens plate of the ICR cell to reduce detection capacitance and noise and increase sensitivity. Figure 1E shows a schematic diagram and electric wiring for the ICR cell with 4 pairs of dipole detection electrodes.
All individual PCB components for preparing the ICR cell were designed using a circuit board layout program EAGLE ver. 7.3.0 (CadSoft Computer, Pembroke Pines, FL) and manufactured by OSH Park (Advanced Circuits, Aurora, CO). The solder used for the ICR cell was 99.3/0.7 Sn-Cu lead-free solder alloy.[13]
To transfer ions to the ICR cell, the voltages applied to each electrode for trapping ions were independently controlled with a multi-channel programmable DC power supply (Modular Intelligent Power Source (MIPS), GAA Custom Engineering, Benton City, WA, USA) to allow formation of trapping wells.[12, 13] After filling the cell, excitation of ion cyclotron motion was achieved using ThermoFisher excitation waveforms as normally used for ICR excitation with the Ultra Cell. After ion excitation, the parallel ICR signal from each dipole detection electrode pair was simultaneously amplified using the independent preamplifier array. Each amplifier output signal was connected with kapton-coated wire to a single vacuum feedthrough pin and then transferred to a Saleae digitizer (Logic 8, Saleae. South San Francisco, CA, USA).[13] The number of samples and sample rate were set to 1310720 and 781250, respectively. DC power (±2.5V) to operate the in-vacuum preamplifier was supplied by an external power supply. The digitized time-domain signals were transferred to a computer through a USB interface by the Saleae digitizer. The obtained parallel time-domain signals were transferred to frequency-domain spectra with ICR-2LS (http://omics.pnl.gov/software/icr-2ls) without zero-filling or apodization. The parallel frequency-domain spectra were summed together and then averaged to prepare a new frequency-domain spectrum.
Sample Preparation
Insulin and Ultramark 1621 (a mixture of fluorinated phosphazenes) were purchased from Sigma (St. Louis, MO, USA). HPLC grade methanol, acetic acid and dimethyl sulfoxide were obtained from Fisher Scientific (Pittsburgh, PA, USA). A 10 μM insulin standard solution was prepared by dissolving insulin in a 1:1 (v/v) water/methanol solvent mixture containing 0.1% (v/v) of acetic acid. An Ultramark 1621 stock solution was prepared by dissolving 10 μL of Ultramark 1621 in 10 mL of acetonitrile. A 10 μM solution of Ultramark 1621 was prepared by dissolving 100 μL of the stock solution of Ultramark 1621 in a solution of 1% acetic acid in 50:50 methanol:water.
Results and discussion
Effect of detector electrode size on S/N
As an initial step, we investigated the effects of detector electrode size on S/N using an ICR cell with 3 pairs of dipole detection electrodes. In this cell, the 1st detection electrode pair was 2.6″ × 1.0″ (length × width), respectively, similar to detection electrode pairs used in conventional ICR cell designs. The 2nd and 3rd detection electrode pair electrodes had the same length as that of the 1st detection electrode pair, but width of 0.4″ and were identical in size and geometry as electrode pairs 3 and 4 shown in figure 1. This configuration is shown in detail in Figure S1 and enabled direct comparison of S/N achieved with conventional full side plate detection (pair 1) with multiple, smaller detection electrodes (pairs 2 and 3) on signals derived from the same ions under identical conditions. Figure S2 shows parallel mass spectra, maximum signal intensity and S/N obtained from each dipole detection electrode pair in the ICR cell, as well as that produced by averaging the spectra from pairs 2 and 3. The 1st detection electrode pair produced maximum signal intensity two times higher than that measured with either detection electrode pair 2 or pair 3. However, because electrode pairs 2 and 3 also produced two times lower noise levels, no significant difference in the S/N was observed among all 3 detection electrode pairs. The lower noise levels of electrode pairs 2 and 3 are likely resultant from decreased capacitance due to smaller electrode size. Moreover, because the noise detected with each electrode pair is random while the signal is non-stochastic, averaging the spectra from pairs 2 and 3 produces similar signal intensity comparable to that observed with detection electrode pair 2 and 3, but yields lower noise and therefore, increased S/N. Figure S3 shows another example of the effects of detector electrode size on S/N. For this experiment, the ICR ell shown in figure S1 was modified; the 2nd and 3rd detection electrodes shown in figure S1 was connected together and used as excitation electrodes. The excitation electrodes shown in figure S1 were used as a 2nd detector. The 1st detector shown in figure S1 was used as a conventional detector. Therefore, the electrode size of the 2nd detector in figure S3 was about 4 times smaller than 1st detectors or 2 times smaller than 2nd and 3rd detector shown in figure S1. As compared the mass spectra shown in figure S3 and figure S2, similar peak intensity and S/N were observed from 1st detectors in each cell. The peak intensity of the 2nd detector (blue peaks in figure S3) was about 2 times lower than that from the 2nd (and 3rd) detector (black or blue peaks in figure S2) or about 4 times lower than that from the 1st detectors, but no significant difference in the S/N was observed from the detection electrodes.
To compare the effect on excitation electrode size, the ICR cell shown in figure S1 was modified to get a single conventional detection electrode pair and a single conventional excitation electrode pair; the detection electrode and excitation electrodes on top/bottom shown in figure S1 were electrically coupled together by soldiering on the pads on the cell outer surface to use whole area of the top/bottom plates as a conventional excitation electrode pair. Using this ICR cell, the achieved optimized signal intensity and S/N (Figure S4) appeared approximately the same (3.0 × 10³ vs. 2.8 × 10³, and 37.6 vs. 39.1, respectively) as those achieved with the same detector electrodes but smaller excitation electrodes (green trace, Figure S2). Thus, even though smaller excitation electrodes required a higher optimal applied voltage as expected, S/N or signal intensity appeared to be independent of excitation electrode size over the ranges used with this cell geometry. These results suggest that parallel detection with multiple pairs of increasingly smaller electrodes may yield increasingly higher S/N as was observed in going from 1, to 2 to 3 and 4 pairs of detectors. Configurations beyond four pairs may still yield improvement, but this remains to be tested.
Parallel acquisition of four signals from a single ion population
The four observed ICR signals were first characterized with variation of excitation amplitude using a 10 μM solution of Ultramark 1621. For this experiment, optimized trapping potentials of −6V and +3V were applied to front and back trapping electrodes, respectively, during injection of ions. After ion injection, the applied voltages were switched to +3 V on the front trapping electrode to trap ions. At 8 ms after trapping ions, cyclotron motion of the trapped ions was excited, and then the ICR signals were simultaneously obtained using 4 pairs of dipole detection electrodes with a decreased trapping voltage (+ 2V). The AGC for ion populations inside the ICR cell was set to set to 6.0 × 10⁶. For characterization of excitation amplitude for 4 dipole detection electrode pairs, S/N for the base peak (m/z = 1522, f = 71083 Hz) observed in parallel frequency-domain spectra simultaneously obtained from each dipole detection electrode pair was calculated as a function of excitation amplitude. To obtain ICR signals from each dipole detection electrode pair, a RF voltage applied to excitation electrodes for 10 ms was varied over the range from 20 – 56 Vpp at optimum trapping conditions (3 and 2V during excitation and detection events, respectively). The obtained parallel ICR signals from 4 dipole detection electrode pairs were transformed to frequency-domain spectra and with these, S/N and standard deviation of S/N were calculated. The S/N calculation with the formula, (signal-baseline) /5×noise, was performed as shown in Figure S5. Where the baseline was a mean of noise and the noise was standard deviations of noise. The noise band for this S/N calculation was approximately 7 times wider than the peak width.
Figure 2 and Figure 3 show parallel frequency-domain spectra and corresponding time-domain signals from 4 detection electrode pairs from acquired with excitation at 28Vpp. Identical peak distributions were observed in all four detected signals and there were no differences among channels in the observed rates of signal decay. Figure S6 shows the S/N as a function of excitation amplitude for an ICR cell with 4 pairs of dipole detection electrodes. In all detection electrode pairs, S/N increases until excitation of 28Vpp was applied. Further increase of excitation amplitude resulted in decreased S/N. As with most ICR cells, decreased S/N at higher excitation amplitude could be due to the reduced trapping electric potential harmonicity and excitation electric field homogeneity and loss of ions and/or phase coherence at larger radius.[19] No significant difference in the S/N was observed among the 4 detection electrode pairs.
Figure 2.
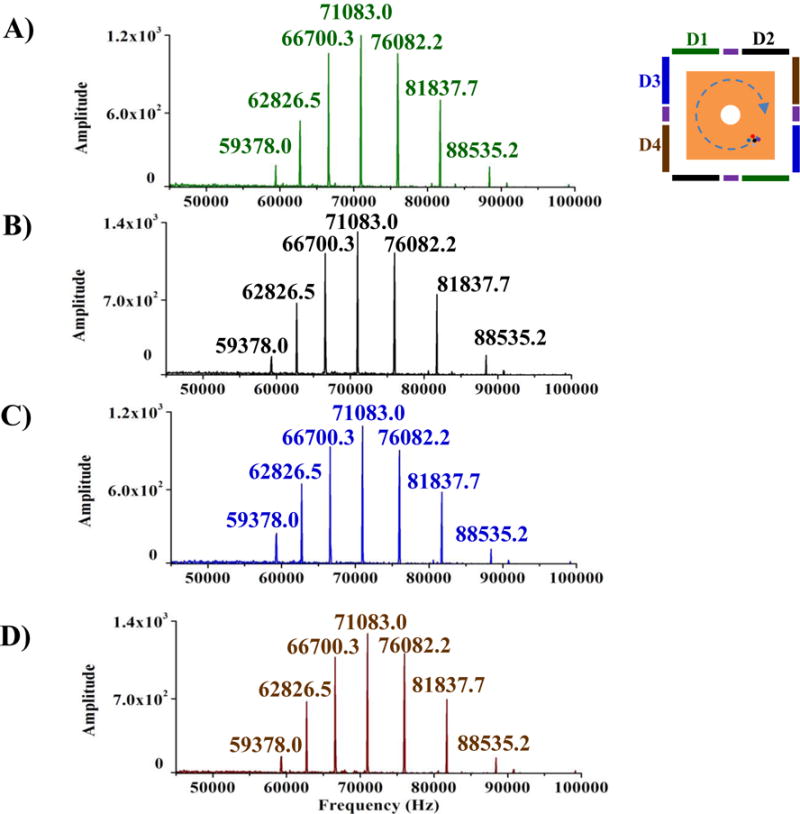
Parallel frequency-domain spectra obtained from detector pair 1 (A), detector pair 2 (B), detector pair 3 (C) and detector pair 4 (D) in a single ICR cell at the same time using Ultramark 1621.
Figure 3.
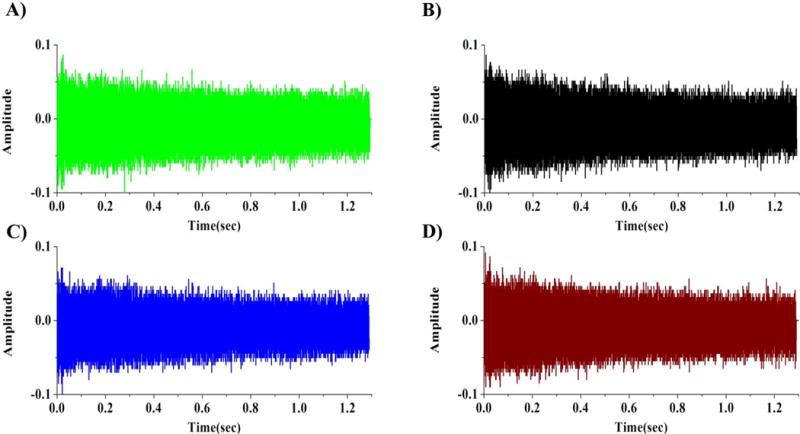
Parallel time domain signals (transients) from detector pair 1 (A), detector pair 2 (B), detector pair 3 (C) and detector pair 4 (D) in a single ICR cell at the same time using Ultramark 1621.
Spectral averaging from 4 detection electrode pairs
To further investigate the effect on S/N produced by averaging parallel frequency-domain spectra, parallel spectra were obtained from each dipole detection electrode pair with conditions as described above. The obtained parallel ICR signals were transformed to frequency-domain spectra and were averaged to create a new frequency-domain spectrum. With the new frequency-domain spectrum, S/N and the standard deviation of the S/N were calculated. Figure S7 shows the frequency-domain spectra and S/N for one selected peak (m/z = 1322, f = 81838 Hz) from detector pair 1 (Figure S7A), averaging spectra from detector pairs 1 and 2 (Figure S7B), averaging spectra from detector pairs 1, 2 and 3 (Figure S7C) and averaging spectra from detector pairs 1, 2, 3 and 4 (Figure S7D). Figure S8 shows the frequency-domain spectrum and S/N resultant from averaging the same spectrum twice from detector pair 1 (i.e., averaging two copies of the same spectrum) for comparison with the frequency-domain spectrum from averaging parallel spectra from detector pairs 1 and 2 (Figure S7B). As expected, averaging two copies of the same spectrum does not increase S/N, while averaging spectra from detector pairs 1 and 2 yielded a 28% gain in S/N. Figure 4 shows the S/N for each peak observed in the parallel frequency-domain spectra from the detector pairs 1, 2, 3 and 4 as compared to the corresponding S/N resultant from averaging the parallel frequency-domain spectra. The averaging frequency-domain spectrum shows higher S/N for all peaks as compared with those from each individual detection electrode pair. Figure 5 shows the gain in S/N as a function of the number of averaged frequency-domain spectra. To determine this gain, the S/N for each peak observed in each frequency-domain spectrum was divided by the S/N for corresponding peak observed in a single frequency-domain spectrum. The obtained S/N gains for all peaks were averaged and the results are shown in Figure 5. As the number of averaged parallel spectra was increased, the observed S/N increased from 1.28 times for two signals to 1.76 times higher S/N for a total of four dipolar signals, as compared to S/N from a single dipolar signal. Thus, Figures S2 and 5 together show that averaging with smaller electrodes and greater number of pairs yields increased achievable S/N as compared to conventional single dipolar detection on the same ions. Figure 6 shows the effect on S/N produced by averaging parallel spectra with AGC setting of 5×10⁵ for ion populations inside the ICR cell. In each single spectrum as shown in Figure 6A, it was hard to identify the peaks at m/z 1222 and 1822 from the noise. However, the peaks in averaged spectra were clearly identified from the noise as shown in Figure 6B. Further reduction in electrode size and increase in dipolar electrode pair number will yield even greater improvements in S/N with ICR and suggest that future cell designs would benefit from incorporation multiple dipolar detection pairs.
Figure 4.
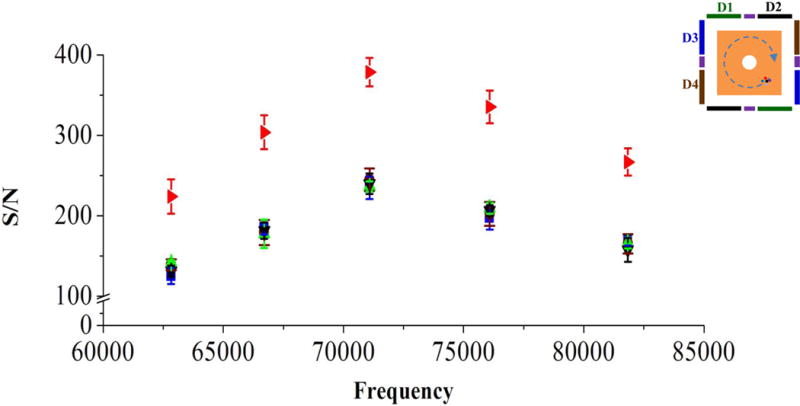
S/N for all peaks observed in the parallel frequency-domain spectra from the detector pairs 1(▲), 2(▼), 3(■) and 4 (●), and all peaks observed in the frequency spectrum (►) from summing the parallel frequency spectra.
Figure 5.
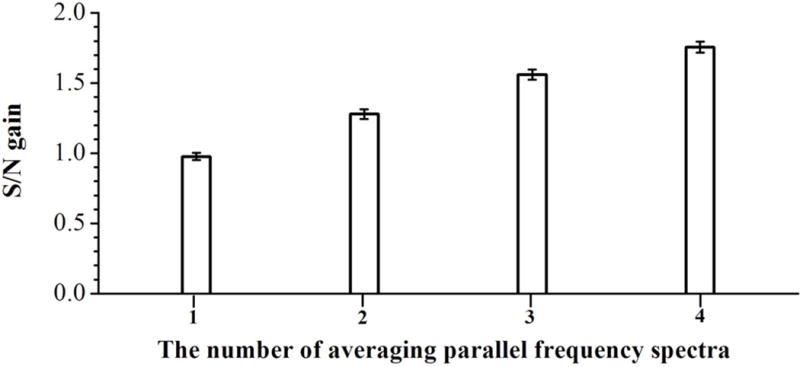
Averaged S/N gains as a function of the number of dipole detection electrodes. The averaged S/N gains were obtained from averaging S/N for all peaks.
Figure 6.
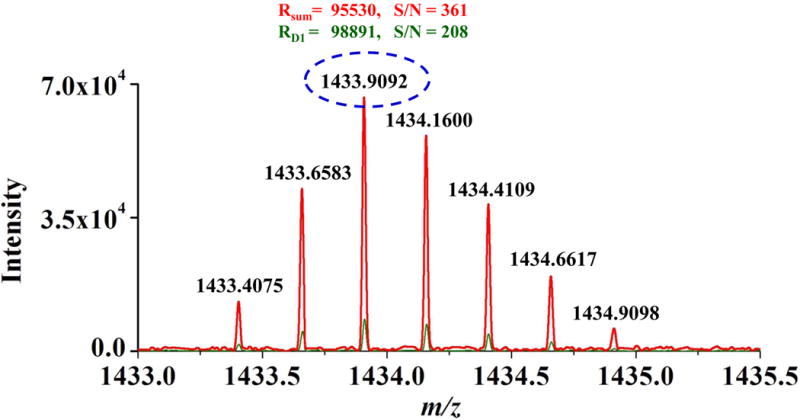
(A) Parallel mass spectra obtained from detector pair 1st (green), 2nd (black), 3rd (blue) and 4th (brown), and (B) averaged mass spectrum at AGC of 5×10⁵.
Revolving power
It is most desirable to increase S/N without degrading achievable mass analyzer resolving power. To investigate the effects on resolving power created by averaging parallel frequency-domain spectra, the achieved resolving power from individual and averaged spectra were evaluated with insulin (Mw = 5733). The mass spectra with resolving power from 1st dipole detection electrode pair and from averaging 4 parallel spectra are compared in Figure 7 (individual spectra from each detector pair are shown in Figure S8). In this case, the acquisition period lasted for 3.0s and parallel acquisition of high resolving power spectra (FWHM = 100,000) was observed with all dipole detection electrode pairs with (M+3H)3+ charge state insulin ions. Moreover, we observed similar resolving power (100,000) from the averaged mass spectrum illustrating that parallel detection and signal averaging can improve S/N without sacrificing resolving power or requiring any additional detection time.
Figure 7.
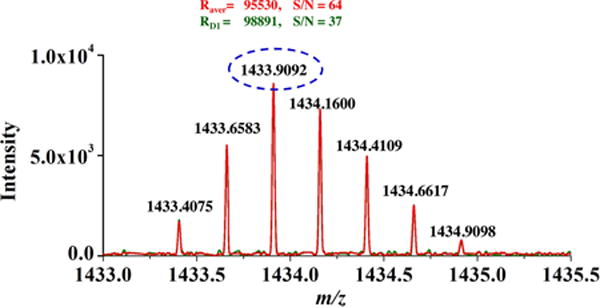
Mass spectra of +3 charged insulin ion showing resolving power R (fwhm) of nearly 100,000. RD1 and Rsum are resolving power for the peaks observed in the mass spectrum from detector pair 1 and the new mass spectrum from summing the 4 parallel spectra.
CONCLUSIONS
FT-MS is a powerful instrument for the study of complex biological samples due to its ability to acquire high resolution and mass measurement accuracy, but requires longer signal acquisition times to achieve high resolution. Like other mass spectrometers, mass spectra with better S/N can be obtained by averaging several scans.[14–16] However, the increasing scan repetition rate can increase analysis time. In this study, we demonstrated a new ICR cell with 4 pairs of dipole detection electrodes. In this technique, four spectra can be simultaneously obtained from the 4 dipole detection electrode pairs in a single ICR cell without need for multiple ion accumulation, serial excitation and detection events. We observed an increasing S/N and no degradation in resolving power from mass spectra obtained by averaging parallel mass spectra as compared with those from individual dipole detection electrode pairs. 1.76 times higher S/N than those from single frequency-domain spectra was observed from averaging 4 parallel frequency-domain spectra. Greater numbers of pairs and larger preamplifier arrays may yield even larger gains in S/N, but this remains to be tested These advances can be beneficial where greater S/N high resolution spectra are needed, but signal acquisition time is limited.
Supplementary Material
Highlights.
Parallel detection of multiple dipolar ICR signals from the same ions
Signal averaging is possible within the same acquisition period of a single scan
S/N improves with the number of implemented signal detectors
Acknowledgments
This work was supported by the National Institutes of Health through grant 5R01GM097112.
Footnotes
Publisher's Disclaimer: This is a PDF file of an unedited manuscript that has been accepted for publication. As a service to our customers we are providing this early version of the manuscript. The manuscript will undergo copyediting, typesetting, and review of the resulting proof before it is published in its final citable form. Please note that during the production process errors may be discovered which could affect the content, and all legal disclaimers that apply to the journal pertain.
Supporting Information
Supporting Information materials available include: Supplemental Text describing methods and Supplemental Figures 1–9.
References
- 1.Yates JR, Ruse CI, Nakorchevsky A. Proteomics by Mass Spectrometry: Approaches Advances and Applications. Annu Rev Biomed Eng. 2009;11:49–79. doi: 10.1146/annurev-bioeng-061008-124934. [DOI] [PubMed] [Google Scholar]
- 2.Griffiths WJ, Wang Y. Mass spectrometry: from proteomics to metabolomics lipidomics. Chem Soc Rev. 2009;38:1882–1896. doi: 10.1039/b618553n. [DOI] [PubMed] [Google Scholar]
- 3.Marshall AG, Hendrickson CL, Jackson GS. Fourier transform ion cyclotron resonance mass spectrometry: A primer. Mass Spectrom Rev. 1998;17:1–35. doi: 10.1002/(SICI)1098-2787(1998)17:1<1::AID-MAS1>3.0.CO;2-K. [DOI] [PubMed] [Google Scholar]
- 4.Hendrickson CL, Quinn JP, Kaiser NK, Smith DF, Blakney GT, Chen T, Marshall AG, Weisbrod CR, Beu SC. 21 Tesla Fourier Transform Ion Cyclotron Resonance Mass Spectrometer: A National Resource for Ultrahigh Resolution Mass Analysis. J Am Soc Mass Spectrom. 2015;26:1626–1632. doi: 10.1007/s13361-015-1182-2. [DOI] [PubMed] [Google Scholar]
- 5.Shaw JB, Lin TY, Leach FE, Tolmachev AV, Tolić N, Robinson EW, Koppenaal DW, Paša-Tolić L. 21 Tesla Fourier Transform Ion Cyclotron Resonance Mass Spectrometer Greatly Expands Mass Spectrometry Toolbox. J Am Soc Mass Spectrom. 2016:1–8. doi: 10.1007/s13361-016-1507-9. [DOI] [PubMed] [Google Scholar]
- 6.Nagornov KO, Gorshkov MV, Kozhinov AN, Tsybin YO. High-Resolution Fourier Transform Ion Cyclotron Resonance Mass Spectrometry with Increased Throughput for Biomolecular Analysis. Anal Chem. 2014;86:9020–9028. doi: 10.1021/ac501579h. [DOI] [PubMed] [Google Scholar]
- 7.Scigelova M, Hornshaw M, Giannakopulos A, Makarov A. Fourier Transform Mass Spectrometry. Mol Cell Proteomics. 2011;10 doi: 10.1074/mcp.M111.009431. [DOI] [PMC free article] [PubMed] [Google Scholar]
- 8.Misharin AS, Zubarev RA. Coaxial multi-electrode cell (‘O-trap’) for high-sensitivity detection at a multiple frequency in Fourier transform ion cyclotron resonance mass spectrometry: main designmodeling results. Rapid Commun Mass Spectrom. 2006;20:3223–3228. doi: 10.1002/rcm.2724. [DOI] [PubMed] [Google Scholar]
- 9.Misharin AS, Zubarev RA, Doroshenko VM. Fourier transform ion cyclotron resonance mass spectrometer with coaxial multi-electrode cell (‘O-trap’): first experimental demonstration. Rapid Commun. Mass Spectrom. 2010;24:1931–1940. doi: 10.1002/rcm.4593. [DOI] [PubMed] [Google Scholar]
- 10.Nikolaev EN, Rakov VS, Futrell JH. Analysis of harmonics for an elongated FTMS cell with multiple electrode detection. J Mass Spectrom Ion Processes. 1996;157–158:215–232. [Google Scholar]
- 11.Vorobyev A, Gorshkov MV, Tsybin YO. Towards data acquisition throughput increase in Fourier transform mass spectrometry of proteins using double frequency measurements. Int J Mass spectrom. 2011;306:227–231. [Google Scholar]
- 12.Park SG, Anderson GA, Navare AT, Bruce JE. Parallel Spectral Acquisition with an Ion Cyclotron Resonance Cell Array. Anal Chem. 2016;88:1162–1168. doi: 10.1021/acs.analchem.5b02987. [DOI] [PMC free article] [PubMed] [Google Scholar]
- 13.Park SG, Anderson GA, Bruce JE. Parallel Spectral Acquisition with Orthogonal ICR Cells. J Am Soc Mass Spectrom. 2017;28:515–524. doi: 10.1007/s13361-016-1573-z. [DOI] [PMC free article] [PubMed] [Google Scholar]
- 14.Payne TG, Southam AD, Arvanitis TN, Viant MR. A Signal Filtering Method for Improved Quantification Noise Discrimination in Fourier Transform Ion Cyclotron Resonance Mass Spectrometry-Based Metabolomics Data. J Am Soc Mass Spectrom. 2009;20:1087–1095. doi: 10.1016/j.jasms.2009.02.001. [DOI] [PubMed] [Google Scholar]
- 15.Dunn WB, Overy S, Quick WP. Evaluation of automated electrospray-TOF mass spectrometryfor metabolic fingerprinting of the plant metabolome. Metabolomics. 2005;1:137–148. [Google Scholar]
- 16.Marshall AG. Theoretical signal-to-noise ratio mass resolution in Fourier transform ion cyclotron resonance mass spectrometry. Anal Chem. 1979;51:1710–1714. [Google Scholar]
- 17.Campbell VL, Guan Z, Laude DA. Remeasurement at high resolving power in fourier transform ion cyclotron resonance mass spectrometry. J Am Soc Mass Spectrom. 1995;6:564–570. doi: 10.1016/1044-0305(95)00230-B. [DOI] [PubMed] [Google Scholar]
- 18.Speir JP, Gorman GS, Pitsenberger CC, Turner CA, Wang PP, Amster IJ. Remeasurement of ions using quadrupolar excitation Fourier transform ion cyclotron resonance spectrometry. Anal Chem. 1993;65:1746–1752. doi: 10.1021/ac00061a018. [DOI] [PubMed] [Google Scholar]
- 19.Nagornov KO, Kozhinov AN, Tsybin OY, Tsybin YO. Ion Trap with Narrow Aperture Detection Electrodes for Fourier Transform Ion Cyclotron Resonance Mass Spectrometry. J Am Soc Mass Spectrom. 2015;26:741–751. doi: 10.1007/s13361-015-1089-y. [DOI] [PubMed] [Google Scholar]
Associated Data
This section collects any data citations, data availability statements, or supplementary materials included in this article.


