Abstract
Although previous studies have indicated importance of taste receptors in food habits formation in mammals, little is known about those in fish. Grass carp is an excellent model for studying vegetarian adaptation, as it shows food habit transition from carnivore to herbivore. In the present study, pseudogenization or frameshift mutations of the umami receptors that hypothesized related to dietary switch in vertebrates, were not found in grass carp, suggesting other mechanisms for vegetarian adaptation in grass carp. T1R1 and T1R3 strongly responded to L-Arg and L-Lys, differing from those of zebrafish and medaka, contributing to high species specificity in amino acid preferences and diet selection of grass carp. After food habit transition of grass carp, DNA methylation levels were higher in CPG1 and CPG3 islands of upstream control region of T1R1 gene. Luciferase activity assay of upstream regulatory region of T1R1 (−2500-0 bp) without CPG1 or CPG3 indicated that CPG1 and CPG3 might be involved in transcriptional regulation of T1R1 gene. Subsequently, high DNA methylation decreased expression of T1R1 in intestinal tract. It could be a new mechanism to explain, at least partially, the vegetarian adaptation of grass carp by regulation of expression of umami receptor via epigenetic modification.
Introduction
Taste receptors belong to G-protein coupled receptors, which were firstly cloned and characterized in topographically distinct subpopulations of taste receptor cells and taste buds1. Then they were identified in non-gustatory tissue including the gut, pancreas, and even the brain, suggesting their functional roles in other tissue2. T1R1/T1R3 and T1R2/T1R3 heteromers are activated by amino acids and sugars, respectively, which are preferable tastants. T1R1 is pseudogenized or absent in western clawed frogs3; fructivorous, insectivorous and vampiric bats4; giant pandas5,6 and marine carnivorous pinnipeds7,8. The pseudogenization of T1Rs in giant panda has been hypothesized to be related to its dietary switch from carnivore to herbivore, which is confirmed by the approximate match in inferred time between T1R1 pseudogenization and dietary switch of panda6. The pseudogenization of T1R1 in pinnipeds might be consistent with its feeding behavior of swallowing food whole without mastication and its carnivorous food habit8. The absence or presence of intact T1R1 are concordant with food habit formation, suggesting the adaption of T1R1 evolution to food habit transition and environmental changes. Previous studies on closely related species with high dietary diversity could provide a better understanding of the relationship between food habits and the evolution of umami taste9. However, little is known about the relationship between the presence/absence of intact T1Rs and food habits in fish.
The food habits of fish, which have higher sensitivity to water-soluble chemicals than mammals10, are highly species-specific and associated with chemosensory-mediated locomotion, especially taste sense11. The T1R1 gene has been reported to be lost in herbivorous blunt snout bream (Megalobrama amblycephala) by whole-genome analysis12. However, little information is known about the function and evolution of umami taste receptor gene nor the relationship with food habits13. The grass carp (Ctenopharyngodon idella) is an ecologically appealing model of vertebrate herbivores and goes through a transition from carnivore to herbivore during its life cycle. When its total length is shorter than 3 cm, the grass carp is carnivorous and feeds on zooplankton or benthos; fish 3–5.5 cm in length undergo food transition stages from zooplankton or benthos to aquatic macrophytes; when the fish grow to larger than 5.5 cm, they are entirely herbivorous14–16.
In addition to pseudogenization, the sensitivity of T1R1/T1R3 to umami compounds, which could be affected by genetic factors such as SNP variation and epigenetic modifications, might also be related to the food habits. In humans, some nonsynonymous single polymorphisms (nsSNP) in the coding region of T1R1 and T1R3 were demonstrated to be associated with the inability to taste monosodium glutamate in non-tasters and hypotasters17,18. In mice, saccharin preference is associated with nsSNPs in T1R3 gene19. However, little has been reported about the function of DNA methylation in the gene regulatory region of T1R1 and T1R3. DNA methylation modification plays crucial roles in the regulation of gene expression, such as modulating the initiation of gene transcription by the methylation of CpG islands in the gene control region20,21.
In the present study, the evolution of umami receptor T1R1/T1R3 in fish with different food habits was analyzed. We detected the responses of T1R1 and T1R3 to amino acids in grass carp. In addition, we investigated the DNA methylation profiles and mRNA expression of T1R1 and T1R3 genes in grass carp before and after the transition from carnivore to herbivore. These results might provide new insight into the function and evolution of umami taste receptors during food habit formation in fish.
Results
Sequence analysis of T1R1 and T1R3 genes in grass carp
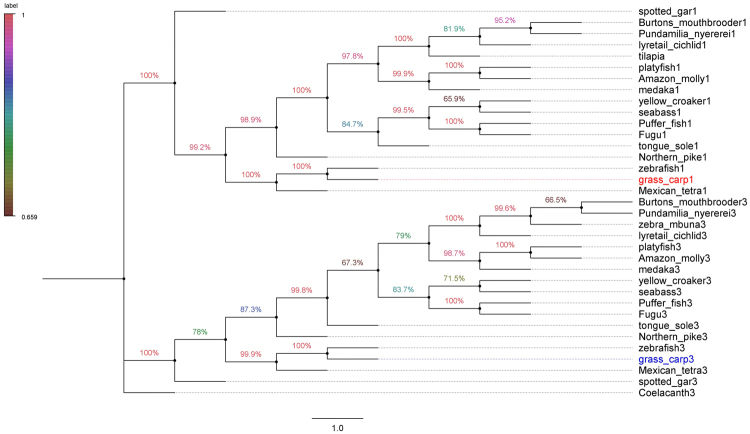
The complete CDS of grass carp T1R1 and T1R3 genes was 2466 bp and 2538 bp in length, encoding a 822-aa protein and a 845-aa protein, respectively (Gene Bank: KU976428, KU976429). As shown in Tables 1 and 2, the multiple alignments revealed the high conservation of amino acid sequences of T1R1 and T1R3 genes. The predicted structure of T1R1 and T1R3 in grass carp exhibited the characteristics of G protein coupled receptors, including a ligand-binding domain, a cysteine-rich domain at the extracellular N-terminal, and seven transmembrane regions (Fig. 1 and 2). No pseudogenization or frameshift mutations of T1R1 and T1R3 were found in fish with different food habits (Table 3). Phylogenetic analysis suggested that T1R1 and T1R3 of grass carp were most evolutionarily related to zebrafish, rather than a product of independent evolution for its herbivorous food habits (Fig. 3).
Table 1.
Amino acid sequence identities of T1R1 compared with other fish and mammals.
| grass carp1 | zebrafish1 | Mexican tetra1 | spotted gar1 | tongue sole1 | seabass1 | puffer fish1 | fugu1 | platyfish1 | medaka1 | human1 | mouse1 | |
|---|---|---|---|---|---|---|---|---|---|---|---|---|
| grass carp1 | 100.00 | |||||||||||
| zebrafish1 | 85.21 | 100.00 | ||||||||||
| Mexican tetra1 | 67.32 | 66.02 | 100.00 | |||||||||
| spotted gar1 | 58.56 | 57.09 | 56.45 | 100.00 | ||||||||
| tongue sole1 | 60.86 | 58.36 | 60.82 | 55.95 | 100.00 | |||||||
| seabass1 | 59.26 | 56.77 | 59.44 | 54.76 | 72.19 | 100.00 | ||||||
| puffer fish1 | 57.60 | 56.00 | 58.41 | 52.50 | 70.07 | 70.34 | 100.00 | |||||
| fugu1 | 60.29 | 58.21 | 58.17 | 53.93 | 69.95 | 72.28 | 85.09 | 100.00 | ||||
| platyfish1 | 59.90 | 57.91 | 60.20 | 56.90 | 71.43 | 71.53 | 69.31 | 71.24 | 100.00 | |||
| medaka1 | 59.54 | 57.67 | 61.05 | 56.02 | 70.45 | 70.81 | 65.59 | 67.86 | 79.11 | 100.00 | ||
| human1 | 41.31 | 40.10 | 43.35 | 43.42 | 41.58 | 40.56 | 41.38 | 41.25 | 40.92 | 42.26 | 100.00 | |
| mouse1 | 41.18 | 40.67 | 44.03 | 43.13 | 41.09 | 39.83 | 40.12 | 39.76 | 40.80 | 41.54 | 73.37 | 100.00 |
Amino acid sequences available in the EMBL/GenBank databases and food habit information of fish are shown in Table 3.
Table 2.
Amino acid sequence identities of T1R3 compared with other fish and mammals.
| grass carp3 | zebrafish3 | Mexican tetra3 | spotted gar3 | tongue sole3 | seabass3 | puffer fish3 | Fugu3 | platyfish3 | medaka3 | human3 | mouse3 | |
|---|---|---|---|---|---|---|---|---|---|---|---|---|
| grass_carp3 | 100.00 | |||||||||||
| zebrafish3 | 83.91 | 100.00 | ||||||||||
| Mexican_tetra3 | 66.63 | 64.73 | 100.00 | |||||||||
| spotted_gar3 | 55.87 | 54.69 | 57.85 | 100.00 | ||||||||
| tongue_sole3 | 54.69 | 53.73 | 53.82 | 52.63 | 100.00 | |||||||
| seabass3 | 57.81 | 55.66 | 58.11 | 54.92 | 67.74 | 100.00 | ||||||
| puffer_fish3 | 54.18 | 52.00 | 55.68 | 54.59 | 63.74 | 70.82 | 100.00 | |||||
| Fugu3 | 53.33 | 51.55 | 55.44 | 53.67 | 63.50 | 70.82 | 81.79 | 100.00 | ||||
| platyfish3 | 52.91 | 51.78 | 52.54 | 51.72 | 61.76 | 67.49 | 59.78 | 61.41 | 100.00 | |||
| medaka3 | 52.33 | 51.14 | 53.69 | 51.43 | 59.64 | 65.12 | 59.20 | 58.72 | 65.85 | 100.00 | ||
| human3 | 37.61 | 36.88 | 37.94 | 39.95 | 34.99 | 37.13 | 38.56 | 37.08 | 35.09 | 36.31 | 100.00 | |
| mouse3 | 36.03 | 35.07 | 36.01 | 38.04 | 34.34 | 36.08 | 36.60 | 35.60 | 34.93 | 35.42 | 73.38 | 100.00 |
Amino acid sequences available in the EMBL/GenBank databases and food habit information of fish are shown in Table 3.
Figure 1.
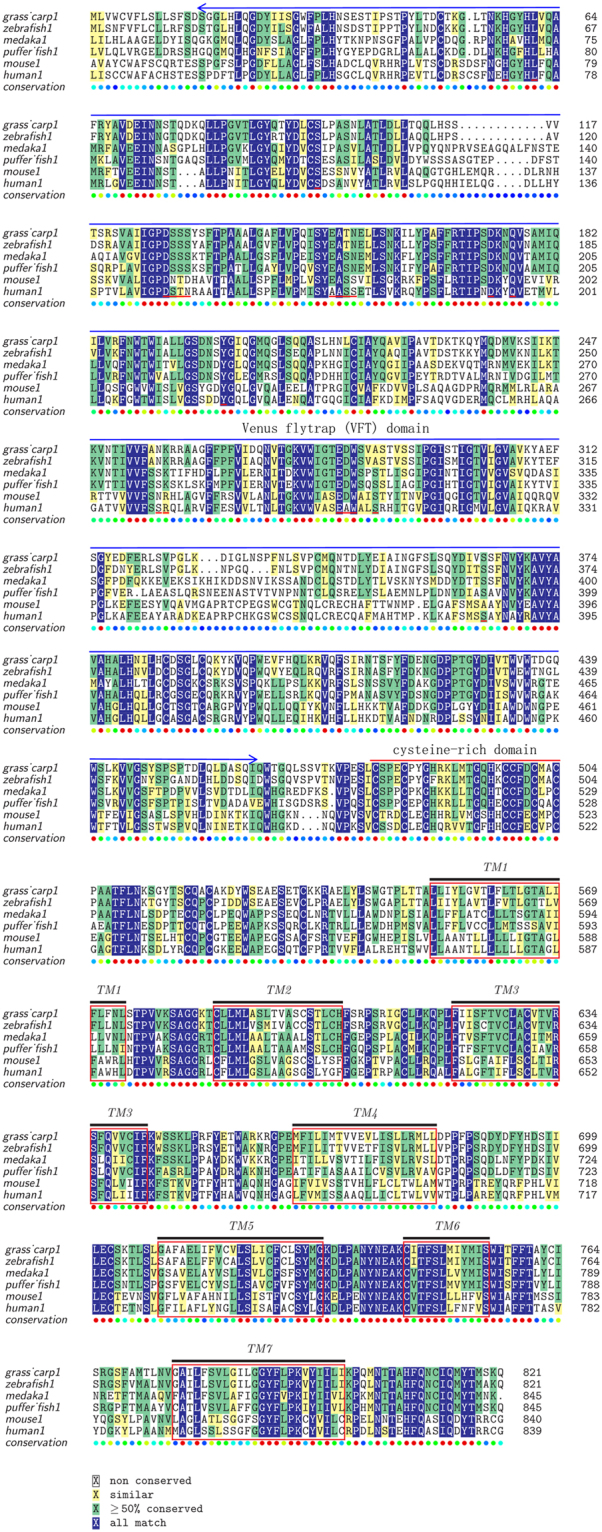
Multiple amino acid sequence alignment of T1R1. The colors indicate that the amino acids in that column were identical across all species. A long extracellular amino-terminal domain called a Venus flytrap module (VFTM) containing the ligand binding pocket was marked with blue line. A cysteine-rich domain (CRD), which links the VFT and 7TM domains was marked with red line. Transmembrane domains (TMD) of grass carp T1R1 were marked with red boxes. Amino acid sequences are available from the DDBJ/EMBL/GenBank databases shown in Table 3.
Figure 2.
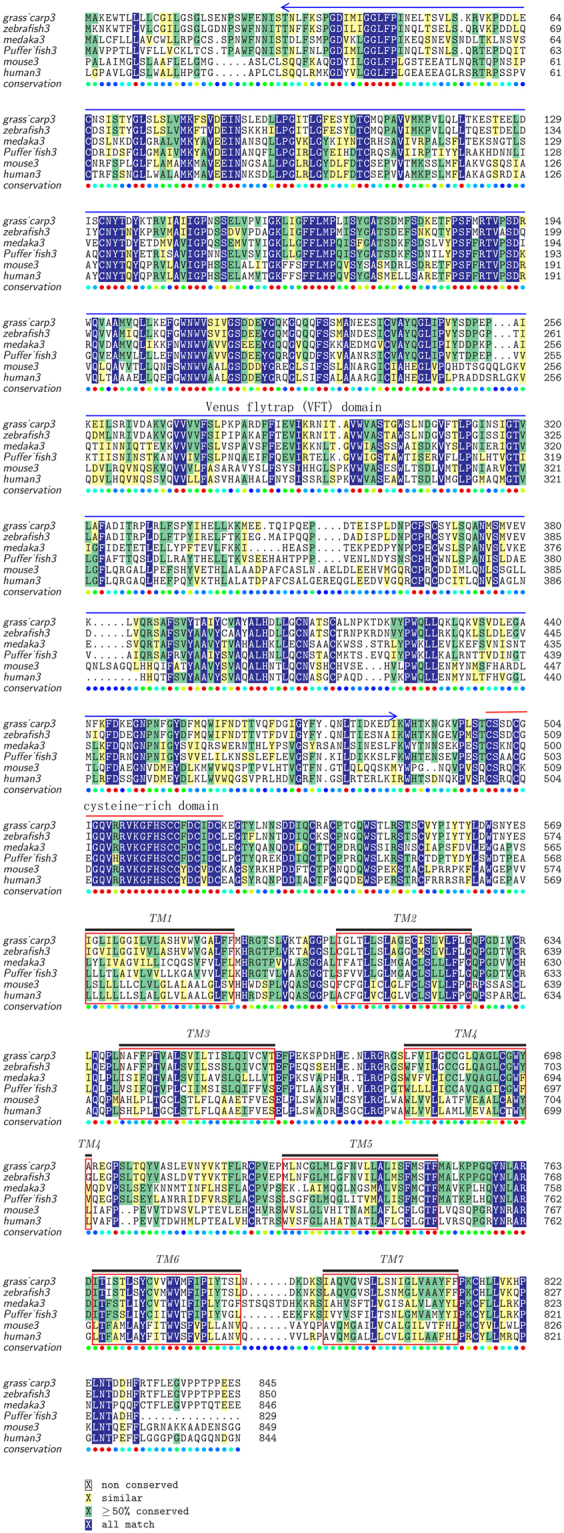
Multiple amino acid sequence alignment of T1R3. The colors indicate that the amino acids in that column were identical across all species. Extracellular amino-terminal domain Venus flytrap module (VFTM) containing the ligand binding pocket was marked with blue line. A cysteine-rich domain (CRD), which links the VFT and 7TM domains was marked with red line. Transmembrane domains (TMD) of grass carp T1R3 were marked with red box. Amino acid sequences are available from the DDBJ/EMBL/GenBank databases shown in Table 3.
Table 3.
Food habit information for the fish studied.
| Species | Dietary habits | EMBL/GenBank databases |
|---|---|---|
| coelacanth (Latimeria chalumnae) | Carnivore | T1R3: XP005986165.1 |
| spotted gar (Lepisosteus oculatus) | Carnivore | T1R1: XP006642104.1 T1R3: XP006642093.1 |
| tongue sole (Cynoglossus semilaevis) | Carnivore | T1R1: XP008316256.1 T1R3: XP008317882.1 |
| northern pike (Esox lucius) | Carnivore | T1R1: XP010874113.1 T1R3: XP010893894.1 |
| Burton’s mouthbrooder (Haplochromis burtoni) | Carnivore | T1R1: XP005941260.1 T1R3: XP005943730.1 |
| lyretail cichlid (Neolamprologus brichardi) | Carnivore | T1R1: XP006785823.1 T1R3: XP006783296.1 |
| Pundamilia nyererei (Pundamilia nyererei) | Carnivore | T1R1:XP005733129.1 T1R3: XP005724813.1 |
| puffer fish (Tetraodon nigroviridis) | Omnivore | T1R1: CAG03219.1 |
| fugu (Takifugu rubripes) | Omnivore | T1R1: BAE78486.1 T1R3: BAE78489.1 |
| zebrafish (Danio rerio) | Omnivore | T1R1: NP001034614.2T1R3: NP001034717.1 |
| grass carp (Ctenopharyngodon idella) | Herbivore | T1R1: KU976428 T1R3: KU976429 |
| Mexican tetra (Astyanax mexicanus) | Carnivore | T1R1: XP007246390.1 T1R3: XP007251586.1 |
| Amazon molly (Poecilia formosa) | Omnivore | T1R1: XP007553500.1 T1R3: XP007549797.1 |
| medaka (Oryzias latipes) | Omnivore | T1R1: BAE78481.2 T1R3: AB200909.1 |
| platyfish (Xiphophorus maculatus) | Omnivore | T1R1: XP005800206.1 T1R3: XP005816500.1 |
| tilapia (Oreochromis niloticus) | Omnivore | T1R1: XP013126540.1 |
| yellow croaker (Larimichthys crocea) | Carnivore | T1R1: KKF08786.1 T1R3: XP010729654.1 |
| European seabass (Dicentrarchus labrax) | Carnivore | T1R1: DLAgn00132940,T1R3: DLAgn00094770 |
Sources of information: http://animaldiversity.ummz.umich.edu/.
Figure 3.
Phylogenetic analysis of fish T1R1 and T1R3. A phylogenetic tree was generated by the Maximum Likelihood method of MEGA7.0 (http://www.megasoftware.net/). The numbers at branch points represent bootstrap values (1000 repetitions). The scale bar indicates the relative measure of evolutionary distance. Amino acid sequences available in the EMBL/GenBank databases and food habit information of fish are shown in Table 3.
Gene structure of T1R1 and T1R3 genes in grass carp
The total size of T1R1 gene we obtained from grass carp was 8150 bp in length, and contained 7 exons and 6 introns. The T1R3 gene of grass carp was 7425 bp in length, and contained 8 exons and 7 introns (Fig. 4).
Figure 4.
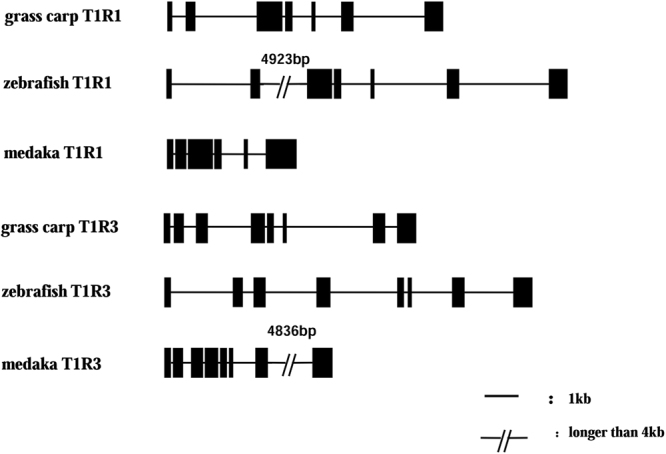
The gene structures of T1R1 and T1R3 genes in grass carp, zebrafish and medaka. The black lines indicate introns and the black boxes indicate exons. Grass carp and zebrafish T1R1 genes contain 7 exons and 6 introns. However, medaka T1R1 has only 6 exons and 5 introns, and the last intron is lost compared with grass carp and zebrafish. Grass carp, zebrafish and medaka T1R3 genes all contain 8 exons and 7 introns.
Synteny analysis of T1R1 and T1R3 genes in fish
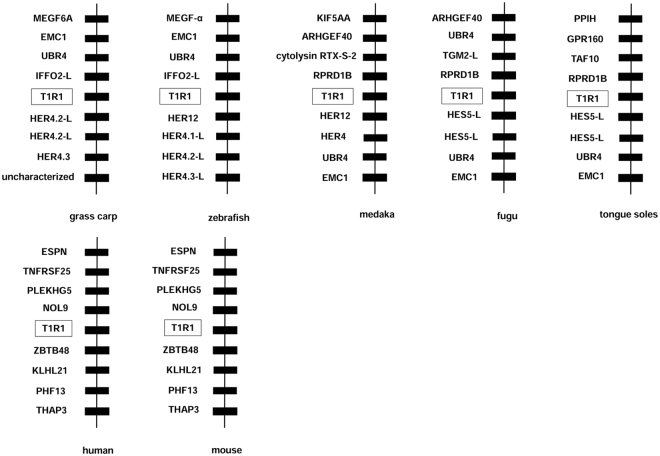
Synteny analysis showed that the genes adjacent to T1R1 and T1R3 genes were strictly conserved in humans and mice. In fish (Fig. 5), transcription factor genes (hairy-related genes: HER4.1, HER4.2, HER4.3, HER12, hes family bHLH transcription factor 5: HES5) were nearby T1R1. ER membrane protein complex subunit 1 (EMC1) and ubiquitin protein ligase E3 component n-recognin 4 (UBR4) appeared on the downstream of T1R1 in medaka, fugu and tongue sole; however, it was located on the upstream of T1R1 in zebrafish and grass carp. The upstream genes of T1R1 in grass carp were similar to those in zebrafish. Regulation of nuclear pre-mRNA domain containing 1B (RPRD1B) gene was present on the upstream of T1R1 in medaka, fugu and tongue sole, but not in zebrafish and grass carp.
Figure 5.
Synteny analyses of T1R1 genes. Adjacent genes of human and mouse T1R1 were strictly conserved. In fish transcription factor genes (hairy-related genes: HER4.1, HER4.2, HER4.3, HER12, hes family bHLH transcription factor 5: HES5) were near T1R1. ER membrane protein complex subunit 1 (EMC1), ubiquitin protein ligase E3 component n-recognin 4 (UBR4) appeared in downstream of T1R1 in medaka, fugu and tongue sole; however, it was located upstream of T1R1 in zebrafish and grass carp. Upstream genes of T1R1 in grass carp were similar as in zebrafish. The regulation of nuclear pre-mRNA domain containing 1B (RPRD1B) was present upstream of T1R1 in medaka, fugu and tongue sole but not in zebrafish and grass carp.
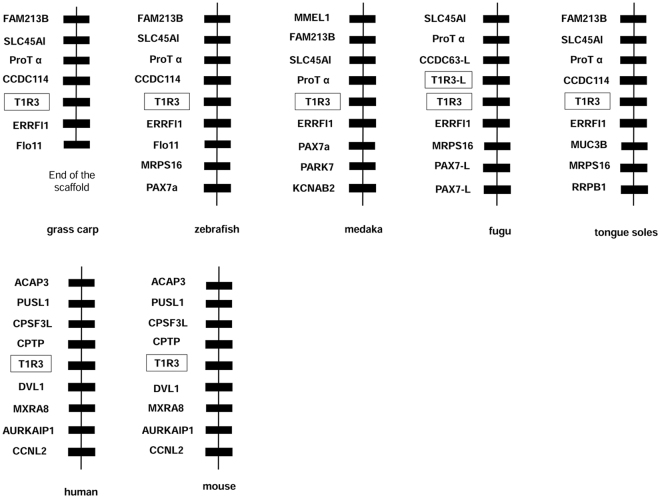
In the fish we analyzed, the adjacent genes of T1R3 were partially conserved. The solute carrier family 45 member 1 (SLC45A1), prothymosin alpha-like (ProT α), and coiled-coil domain containing 114 (CCDC114) genes were located on the upstream of T1R3 in most fishes. The ERBB receptor feedback inhibitor 1 (ERRFI1) gene was always next to T1R3 gene in fish, and the mitochondrial ribosomal protein S16 (MRPS16) and paired box 7a (PAX7a) genes were frequently on the downstream of T1R3 in fish (Fig. 6).
Figure 6.
Synteny analyses of T1R3 genes. The adjacent genes of T1R3 were partially conserved. The solute carrier family 45 member 1 (SLC45A1), prothymosin alpha-like (ProT α), coiled-coil domain containing 114 (CCDC114) genes located upstream of T1R3 in most fishes. The ERBB receptor feedback inhibitor 1 (ERRFI1) was always next to the T1R3 gene in fish. Mitochondrial ribosomal protein S16 (MRPS16) and paired box 7a (PAX7a) genes are frequently downstream of fish T1R3.
Response of grass carp T1R1 and T1R3 to L-amino acids
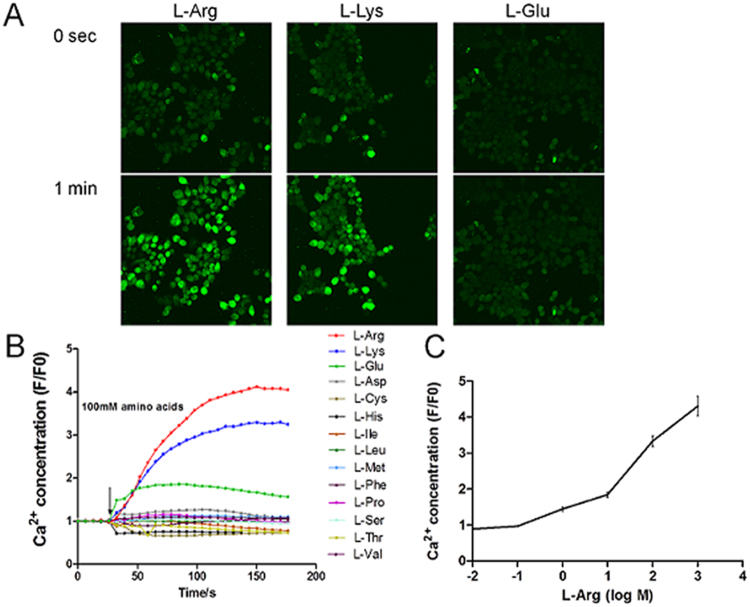
The cells with co-expression of grass carp T1R1 and T1R3, strongly responded to L-Arg and L-Lys, moderately to L-Glu and weakly to the other amino acids (Fig. 7A,B). The cell response to L-Arg were dose-dependent in the range of 0.01 mM to 1000 mM (Fig. 7C).
Figure 7.
Responses of HEK293T cells co-expressing grass carp T1R1 and T1R3 to tastant stimuli. (A) Representative radiometric images of fluo-4AM-loaded HEK293T cells during the application of 100 mM L-Arg, L-Lys and L-glu. Top and bottom panels show the cell images that were obtained 0 s and 1 min after stimulation, respectively. (B) The quantification of responses of grass carp T1R1- and T1R3-transfected cells. Amino acids were used at 100 mM. (C) Dose-dependent responses of grass carp T1R1 and T1R3 to L-Arg. Responses were normalized to the mean response before tastant stimuli.
mRNA expression of T1R1 and T1R3 in grass carp before and after food habit transition
As shown in Fig. 8, compared with fish before food habit transition, the gene expression of T1R1 and T1R3 were significantly reduced in the intestinal tract of grass carp after the food habit transition from carnivore to herbivore.
Figure 8.
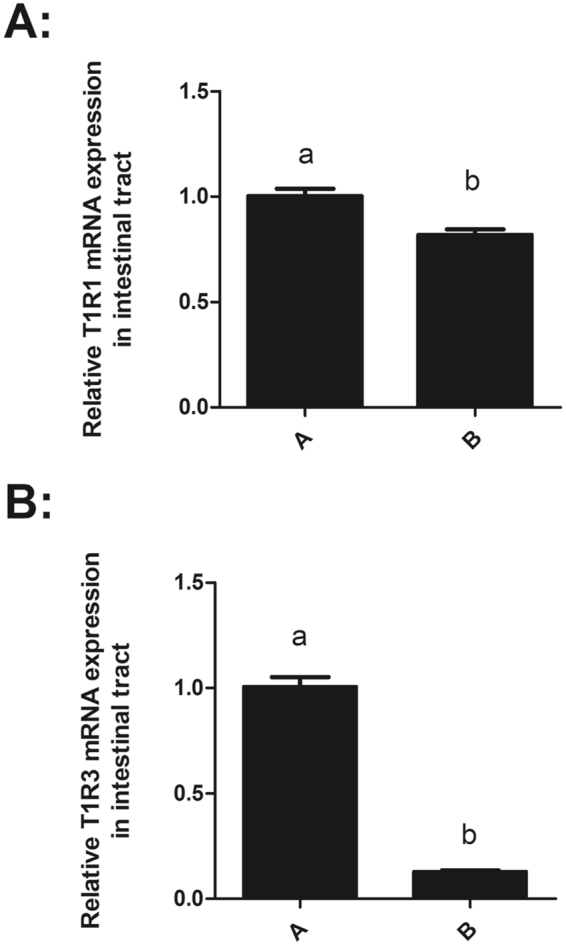
The T1R1 and T1R3 mRNA expression levels of the intestinal tract in the grass carp transition from carnivory to herbivory. (A) mRNA expression levels of T1R1 gene in the intestinal tract of grass carp transition from carnivory to herbivory. (B) mRNA expression levels of T1R1 gene in the intestinal tract of grass carp transition from carnivory to herbivory. The T1R1 and T1R3 gene expression levels were both significantly reduced in the grass carp brain and intestinal tract after the food habit transition to herbivory. All values represented the mean ± S.E.M. (n = 6).
Methylation of T1R1 and T1R3 in grass carp before and after the food habit transition
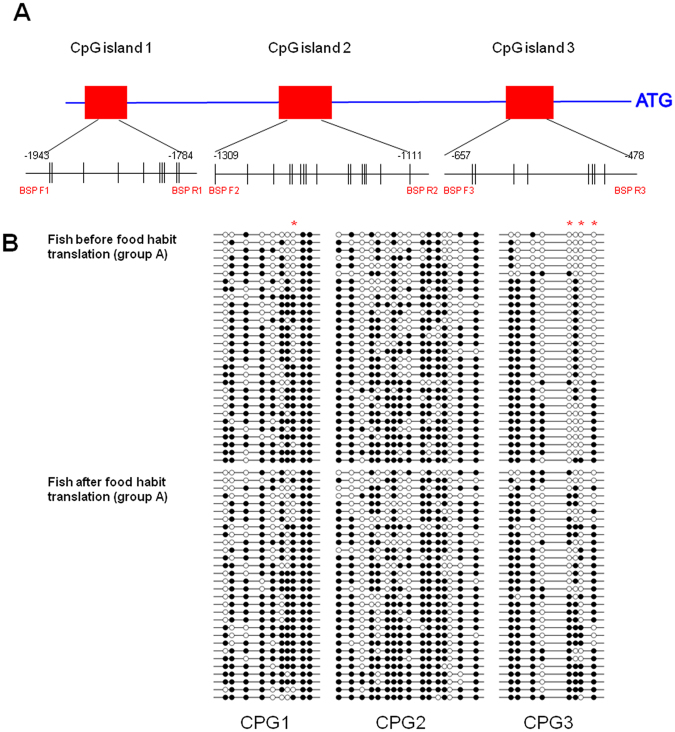
We analyzed the CpG islands at −2000 bp upstream from the transcription initiation site (designated as 0) of T1R1 and T1R3 by methylation analysis software. As shown in Fig. 9, three CpG islands existed in this region of grass carp T1R1 gene. The first was −1943 to −1784 bp, the second was −1309 to −1111 bp and the last was −657 to −478 bp of T1R1 gene. The first CpG island contained 10 CpG sites, and the DNA methylation levels at the −1827 site was significantly higher in the intestine of grass carp after the food habit transition than those before the transition (Table 4). The second CpG island contained 16 CpG sites, and no difference in the DNA methylation levels was found in the intestine of grass carp before and after the food habit transition (Table 5). The last CpG island contained 8 CpG sites, and DNA methylation levels at the sites of −529, −522 and −500 CpGs were significantly higher in intestine of the grass carp after food habit transition (Table 6). However, no CpG island in this region was predicted in T1R3 of grass carp (not shown).
Figure 9.
Differentially expressed CpG islands and DNA methylation patterns of T1R1 CpG islands in the grass carp intestinal tract. (A) Illustration of the region of CpG islands and BSP primers. The BSP detection region contained 3 CpG islands, which included 10 CpG sites, 16 CpG sites and 8 CpG sites, respectively. (B) DNA methylation patterns of the intestinal tract in grass carp before or after the food habit transition to herbivores as analyzed by BSP. Each line represents one individual bacterial clone, and each circle represents one single CpG dinucleotide. Open circles show unmethylated CpGs and black circles show methylated CpGs. A red asterisk suggests that the DNA methylation of the CpGs was significantly different after the food habit transition from carnivore to herbivore in grass carp.
Table 4.
Methylation status of each CpG in CpG island 1 of the T1R1 gene in grass carp before or after the food habit transition.
| CpG position | −1921 | −1916 | −1891 | −1861 | −1845 | −1833 | −1830 | −1827 | −1813 | −1807 | Total |
|---|---|---|---|---|---|---|---|---|---|---|---|
| Me-CpG Fish before food habit transition (Group A) |
11/30 36.3% |
25/30 83.3% |
21/30 70.0% |
23/30 76.7% |
13/30 43.3% |
19/30 63.3% |
20/30 66.7% |
16/30 53% |
30/30 100.0% |
30/30 100.0% |
204/298 68.5% |
| Me-CpG Fish after food habit transition (Group B) |
12/30 40.0% |
19/29 65.5% |
21/30 70.0% | 26/30 86.7% | 17/29 56.7% | 21/30 70.0% | 15/30 50.0% | 24/30 80.0% | 30/30 100.0% | 30/30 100.0% | 214/298 71.8% |
| significance | — | — | — | — | — | — | — | * | — | — | — |
*P < 0.05 —P > 0.05.
Table 5.
Methylation status of each CpG in CpG island 2 of the T1R1 gene in grass carp before or after the food habit transition.
| CpG position | −1309 | −1288 | −1272 | −1259 | −1254 | −1241 | −1236 | −1231 | −1220 | −1196 | −1191 | −1179 | −1174 | −1172 | −1156 | −1127 | Total |
|---|---|---|---|---|---|---|---|---|---|---|---|---|---|---|---|---|---|
| Me-CpG Fish before food habit transition (Group A) |
27/30 90.0% |
27/30 90.0% |
3/30 10.0% |
20/30 66.7% |
20/30 66.7% |
12/30 40.0% |
26/30 86.7% |
14/30 46.7% |
16/30 53.3% |
24/30 80.0% |
24/30 80.0% |
24/30 80.0% |
25/30 83.3% |
0/30 0.0% |
21/30 70.0% |
28/30 93.3% |
311/480 64.8% |
| Me-CpG Fish after food habit transition (Group B) |
26/30 86.7% |
21/30 70.0% |
4/30 13.3% |
25/30 83.3% |
15/30 50.0% |
18/30 60.0% |
27/30 90.0% |
15/30 50.0% |
17/30 56.7% |
26/30 86.7% |
28/30 93.3% |
27/30 90.0% |
23/30 76.7% |
0/30 0.0% |
24/30 80.0% |
24/30 80.0% |
320/480 66.7% |
| significance | — | — | — | — | — | — | — | — | — | — | — | — | — | — | — | — | — |
*P < 0.05 —P > 0.05.
Table 6.
Methylation status of each CpG in CpG island 3 of the T1R1 gene in grass carp before or after the food habit transition.
| CpG position | −633 | −627 | −600 | −587 | −529 | −524 | −522 | −500 | Total |
|---|---|---|---|---|---|---|---|---|---|
| Me-CpG Fish before food habit transition (Group A) |
28/30 93.3% |
24/30 80.0% |
25/30 83.3% |
9/30 30.0% |
2/30 6.7% |
16/30 53.3% |
1/30 3.3% |
11/30 36.7% |
116/240 48.3% |
| Me-CpG Fish after food habit transition (Group B) |
28/30 93.3% |
26/30 86.7% |
25/30 83.3% |
8/30 26.7% |
21/30 70.0% |
19/30 63.3% |
11/30 36.7% |
22/30 73.3% |
160/240 66.7% |
| significance | — | — | — | — | * | — | * | * | — |
*P < 0.05 —P > 0.05.
Luciferase activity assay of the upstream regulatory region of T1R1 in grass carp
Three recombinant vectors with the upstream sequences of grass carp T1R1 of different lengths (PGL6-T1R1-P, PGL6-T1R1-CPG1−, PGL6-T1R1-CPG3−) were successfully constructed (Fig. 10A). They were then co-transfected into HEK293T cells with plasmid pRL-SV40-N as the internal control, and the luciferase activity was detected at 36 h after transfection. Dual luciferase assay showed that compared with the cells with PGL6-T1R1-P plasmid, the luciferase activity of the cells with PGL6-T1R1-CPG1− and PGL6-T1R1- CPG3− plasmid were significantly decreased (Fig. 10B).
Figure 10.
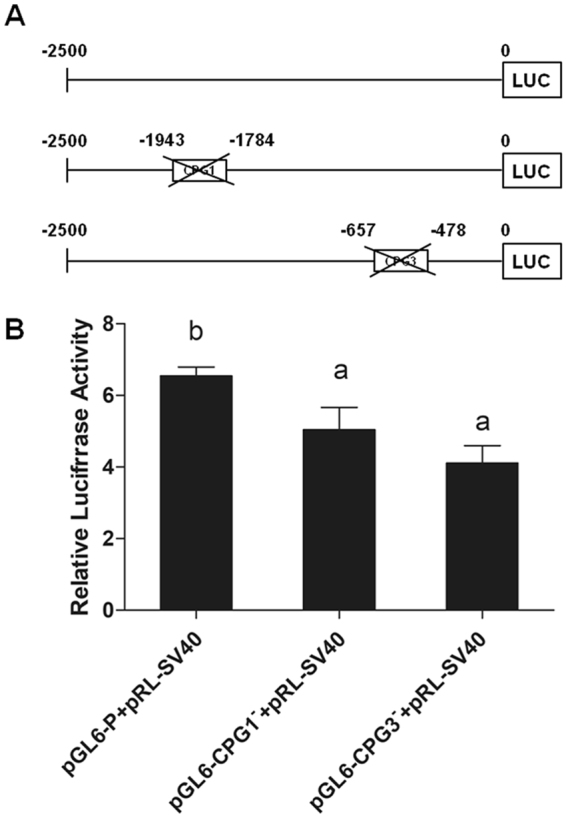
Relative activity of the upstream regulatory region of T1R1 gene. (A) Schematic representation of the upstream regulatory region of T1R1 gene. A series of plasmids containing the upstream sequences of grass carp T1R1 of different lengths (PGL6-T1R1-P, PGL6-T1R1-CPG1−, PGL6-T1R1-CPG3−) fused in the frame to the luciferase were co-transfected with pRL-SV40 into HEK293T cells. (B) Relative activity of the upstream regulatory region of T1R1 gene with deletions. Values were normalized to the control plasmid pGL6-Basic and represented as the ratio between firefly and Renilla luciferase activities. The results are expressed as the mean ± SEM arbitrary units of three independent experiments (P < 0.05).
Discussion
The pseudogenization or absence of T1R1 gene in western clawed frogs3, giant pandas5,6, pinnipeds7,8 and blunt snout bream has been hypothesized to be related to food habits. These studies have reported that the absence or presence of functional T1R1 was concordant with food habits, suggesting the adaptive evolution of T1R1 to food habit transition or environmental changes. However, this concordance between genetic and behavioral evidence has been challenged9. Research has suggested that additional factors shape T1R1 evolution, such as in the relatively closely related species, the high dietary diversity can impact on the evolution of T1R1 and umami taste4. In the present study, no pseudogenization or frameshift mutations of T1R1 and T1R3 genes were found in the herbivore grass carp. T1R1 and T1R3 of grass carp were most evolutionarily related to zebrafish, as they belong to Cyprinidae, rather than a product of independent evolution with its herbivorous food habit. It is suggested that the evolution of umami taste receptor genes in fish could be independent of feeding ecology.
T1R1 and T1R3 have been identified in several mammals22–24, zebrafish, medaka and puffer fish25. In the present study, we cloned the complete coding sequence of T1R1 and T1R3 genes in grass carp. The predicted secondary structures of T1R1 and T1R3 proteins were conserved not only in fish but also in mammals23,25. Synteny analysis revealed that the genes adjacent to T1R1 or T1R3 genes were strictly conserved in humans and mice, while no obvious synteny was found in fish, especially T1R1 gene, suggesting a more complicated evolutionary relationship in fish. Genes adjacent to T1R1 were more variable than those adjacent to T1R3, suggesting the potential unique transcription regulation and interactions of umami receptor genes with adjacent gene in fish. Interestingly, hairy-related genes and the hes family were conservatively located on the downstream of T1R1 gene in fish. Her factors have been demonstrated to play important roles in developmental and neurogenic processes, including somitogenesis and components of the central nervous system as well as the neuro-sensory system26. The conserved gene locus in fish might be attributed to the co-evolution of sensory system in fish.
Li et al.23 showed that T1R1/T1R3 heterodimers respond to AAs in mammals. Oike et al.27 revealed that unlike mammals, T1R2/T1R3 was not activated by sugars in medaka or zebrafish. Zebrafish mainly detect amino acids by T1R2s/T1R3 rather than by T1R1/T1R3. Medaka could detect amino acids by both T1R2/T1R3 and T1R1/T1R3. Vertebrate T1R2s have probably evolved to adapt themselves to necessary nutrients depending on the species. However, in the present study, the results revealed that T1R1/T1R3 of grass carp strongly responded to L-Arg and L-Lys, moderately to L-Glu and weakly to other amino acids. In addition, we identified more isoforms of T1R2 genes in grass carp than zebrafish and medaka. All T1R2s were responded to glucose or fructose in vitro (unpublished data). The results were different from those of zebrafish and medaka fish. Facial nerve recordings and calcium imaging using an HEK293T heterologous expression system in zebrafish demonstrated that the fish perceived to L-Ala and L-Pro but not to sugras, mainly by T1R2s/T1R3, Calcium imaging analysis of T1Rs medaka fish revealed that both T1R1/T1R3 and a series of T1R2/T1R3 responded to amino acids (strongly to L-Arg and L-Ser) but not to sugars27. Although the gene sequences of T1R1 and T1R3 were highly conserved in grass carp and zebrafish, the diversity of amino acids sequence in ligand-binding domain of T1R1 might raise the possibility of different binding affinity and response to amino acids between grass carp and zebrafish.
Previous studies have demonstrated that amino acid recognition in humans and mice could be determined by separate sets of amino acids in VFTD, which is the key domain for the sensitivity of umami taste receptor27–29. Raliou et al.30 reported that amino acid substitutions (A110V and R507Q) in the N-terminal ligand-binding domain of T1R1 in humans leads to the impaired response of T1R1/T1R3 to monosodium glutamate in vitro. The amino acid composition was different in aquatic macrophytes (main food source of grass carp) and tubificidae, daphnia, or the fish body (main food sources of zebrafish and medaka)31,32. We hypothesize that the different responses of T1R1 and T1R3 to amino acids might contribute to their preferences for plant protein or animal proteins. These findings might offer a good explanation for the high species specificity in amino acid preferences and food habits in teleosts24,27.
Research has revealed that the activation of T1R1/T1R3 initiated the peristaltic reflex and pellet propulsion in the distal colon33. In addition, the activation of T1R1/T1R3-initiated sensing of amino acids by the gut-expressed T1R1/T1R3 could stimulate CCK secretion in the proximal intestine of mice34, providing evidence of the significant role of T1R1/T1R3 in nutrient sensing in the intestinal tract. The presence of taste receptor mRNA has been reported in the midgut of rainbow trout35. Evidence of the existence of taste receptors in fish guts have suggested that the sensing of food might also have functional effects beyond oral taste sensations. In our previous research16, grass carp fed with duckweed had significantly greater growth than fish before the food habit transition or those without a food habit transition fed with chironomid larvae. It has been suggested that a longer gut could enable fish to achieve higher growth rates on plant materials, which are relatively poor in nutritional quality16. These results have indicated the importance of gastrointestinal development in the food habit transition of grass carp. For the study of evolution of the food habit transition from carnivory to herbivory in grass carp, we have focused on the umami receptors in the gut of grass carp. A comparative analysis between carnivores and herbivores in one species eliminated the differences in results from different species15,16.
The upstream regulatory region of T1R1 gene was methylated in grass carp both before and after the food habit transition. DNA methylation levels at the sites of −1827, −529, −522 and −500 in CpG1 and CPG3 were significantly higher in grass carp after the food habit transition than those before the transition. The transcription factor binding sites that are sensitive to methylation were predicted in these differentially methylated regions. We also found that the upstream regulatory region of T1R1 (−2500-0 bp) without CPG1 or CPG3 sequences showed lower transcriptional promotion than those with CPG1 or CPG3 by luciferase activity assay, indicating that the CPG1 and CPG3 might involved in the transcriptional regulation of T1R1 gene. However, no CPG island of T1R3 gene was found in grass carp although the expression results revealed a drastic transcriptional down-regulation after food habit transition, suggesting T1R3 might not be regulated through DNA methylation during food habit transition of grass carp. T1R3 is more crucial for taste perception and could also combine with T1R2 to respond to sweet substance. There could exist other mechanism for transcriptional regulation of T1R3 gene which was unidentified at present. The higher DNA methylation levels of the T1R1 gene were correlated with its lower expression in grass carp after the food habit transition than those before the food habit transition. Previous studies indicated that umami tastes were strictly dependent on T1R receptors, and the selective elimination of T1R subunits by knockout could differentially abolish behavioral and nerve responses to umami compounds36,37. As the qualitative changes in the amino acid profiles of the diets of grass carp before and after the food habit transition from carnivory to herbivory, the reduced expression levels of the umami receptor gene suggested an insensitivity to umami taste, which might be the cause of vegetarian adaptation in grass carp. It could be a new mechanism for the vegetarian adaptation of grass carp by the regulation of the expression of the umami receptor via DNA methylation of the umami receptor gene in addition to the pseudogenization or frameshift mutation of the umami receptor gene.
In conclusion, no pseudogenization or frameshift mutations of T1R1 and T1R3 were found in grass carp, which was different from other herbivorous fish, the blunt snout bream. The T1R1/T1R3 in grass carp strongly responded to L-Arg and L-Lys, moderately to L-Glu and weakly to other amino acids, which was different from the response in zebrafish and medaka. The gene expression of T1R1 was significantly decreased in grass carp after the food habit transition, which might be attributed to the higher DNA methylation levels in the upstream regulatory region of T1R1 with CPG islands. This might be a new adaptation mechanism for amino acid preferences and food habits in vertebrates.
Materials and Methods
All animals and experiments were conducted in accordance with the “Guidelines for Experimental Animals” of the Ministry of Science and Technology (Beijing, China). The study was approved by the Institutional Animal Care and Use Ethics Committee of Huazhong Agricultural University. All efforts were made to minimize suffering.
Cloning of grass carp T1R1 and T1R3 gene sequences
To obtain the T1R1 and T1R3 gene sequences in grass carp, we searched the genome database of grass carp available at the official National Center for Gene Research website (http://www.ncgr.ac.cn/grasscarp/). In the first step, TBLASTN searches were conducted with E-value 10−10 against the genomic data using the coding sequences (CDS) of T1R1 and T1R3 identified from the genome databases of zebrafish Danio rerio, medaka Oryzias latipes and fugu Takifugu rubripes23. The obtained sequences were confirmed by BLASTP searches against NCBI non-redundant (nr) database, if the best hit was a previously known T1R1 and T1R3, it was considered a candidate sequence. In the second step, each region of BLAST similarity was extended in 5′ and 3′ directions to establish a detailed prediction of the coding sequences. The exon-intron junctions were determined by comparing the genomic sequence with the cDNA sequence using SPIDEY (http://www.ncbi.nlm.nih.gov). In the third step, the cDNA of lip and tongue were used to verify the sequences. Polymerase chain reaction (PCR) was conducted on Biometra Thermo cyclers (Biometra, Germany) using Phanta® Super-Fidelity DNA Polymerase (Vazyme Biotech, China) with the designed primers (Table 7).
Table 7.
Nucleotide sequences of the primers.
| Primers | Sequences (5′-3′) |
| Primers for cloning of T1R1 and T1R3 | |
| CLgc T1R1 F | ATGTTGGTCTGGTGTGTGTTTCTCTC |
| CLgc T1R1 R | TCACTGCTTGGACATGGTGTACATT |
| CLgc T1R3 F | ATGGCTAAGGAGTGGACGCTT |
| CLgc T1R3 R | CTAGCTTTCTTCAGGTGGTGTTGG |
| Primers for construction of expression vector | |
| EXgc T1R1 F | TAGTCCAGTGTGGTGGAATTCATGTTGGTCTGGTGTGTGTTTCTCTC |
| EXgc T1R1 R | GGTTTAAACGGGCCCTCTAGATCACTGCTTGGACATGGTGTACATT |
| EXgc T1R3 F | TAGTCCAGTGTGGTGGAATTCATGGCTAAGGAGTGGACGCTT |
| EXgc T1R3 R | GGTTTAAACGGGCCCTCTAGA CTAGCTTTCTTCAGGTGGTGTTGG |
| Primers for genomic DNA amplicon | |
| CPG1 T1R1 F | TGTTTAAGTGCTATATCAGGTCCC |
| CPG1 T1R1 R | CAAAGGTCTTACGGCTGTGGAAT |
| CPG2 T1R1 F | GCCGCTCAGATATTGCTCCC |
| CPG2 T1R1 R | CATTTCTGTCAAACCCAACCTCTG |
| CPG3 T1R1 F | ACAGAGGTTGGGTTTGACAGAA |
| CPG3 T1R1 R | GTGTGAGCAAAAACACGCAGTT |
| Primers for BSP amplicon | |
| BSP1 T1R1 F | AGAAAATATGAAAAAGGATAATTT |
| BSP1 T1R1 R | ACTTTACCTCGCTTACGAAAAC |
| BSP2 T1R1 F | GAGAATATTTTTGGTGCGTTAAAA |
| BSP2 T1R1 R | ATATTATAAAACGACGAAAATATT |
| BSP3 T1R1 F | AGGTATATGTAGTCGATGAGTTGA |
| BSP3 T1R1 R | CCCTATTTAAATATAAACAAAAACAC |
| Primers for cloning of the upstream regulatory region of T1R1 gene | |
| gc T1R1-P F | GGTACCGCTTGGGTGTCGAGGTTGTG |
| gc T1R1-P R | CTCGAGGTTACTTCCTCTGATATGAGCTCTTC |
| gc T1R1-CPG1−A F | GGTACCGCTTGGGTGTCGAGGTTGTG |
| gc T1R1-CPG1−A R | CTTCAAAAATACTTACATTTAAGGCTTGCCAAAACAAAGTT |
| gc T1R1-CPG1−B F | ACTTTGTTTTGGCAAGCCTTAAATGTAAGTATTTTTGAAGGGTTA |
| gc T1R1-CPG1−B R | CTCGAGGTTACTTCCTCTGATATGAGCTCTTC |
| gc T1R1-CPG3−A F | GGTACCGCTTGGGTGTCGAGGTTGTG |
| gc T1R1-CPG3−A R | GTTTTTGTATGACCCTTTAAAGAAGTTACAACTTTTAGAATGCAT |
| gc T1R1-CPG3−B F | TTCTAAAAGTTGTAACTTCTTTAAAGGGTCATACAAAAACTGCGT |
| gc T1R1-CPG3−B R | CTCGAGGTTACTTCCTCTGATATGAGCTCTTC |
| Primers for real-time PCR | |
| RTgc EF1 F | GCTGACTGTGCCGTGCTGAT |
| RTgc EF1 R | GCTGACTTCCTTGGTGATTTCC |
| RTgc T1R1 F | CTGCCGCCACCTTCCTCA |
| RTgc T1R1 R | CTCCGGCCGACTTCACCAC |
| RTgc T1R3 F | CACAGGATGGTCTCTGAACG |
| RTgc T1R3 R | ATAGGGACTGAATAGGCGAA |
Sequence analysis of T1R1 and T1R3
The sequences of grass carp T1R1 and T1R3 genes were analyzed by the program Editseq to translate into amino acid sequences using standard genetic codes. Multiple alignments of amino acid sequences were performed by ClustalW2 (http://www.ebi.ac.uk/Tools/msa/clustalw2/). The phylogenetic tree based on the amino acid sequences was constructed by the Maximum Likelihood method of the MEGA 7.0 program (http://www.megasoftware.net/index.html) and decorated by iTOL (http://itol.embl.de/). Numbers at the branches reflect the confidence levels as obtained by bootstrapping (1000 replications).
To determine whether T1R1 and T1R3 genes of grass carp are orthologous to other vertebrate species, synteny analysis was performed by searching the flanking gene(s) of T1R1 and T1R3 in human, mouse, zebrafish, medaka, fugu (Takifugu rubripes) and tongue sole (Cynoglossus semilaevis) genomes using the Ensembl genome browser (http://www.ensembl.org/index.html), UCSC Genome Bioinformatics (http://genome.ucsc.edu/index.html) and NCBI map viewer (http://www.ncbi.nlm.nih.gov/mapview/).
Grass carp T1R1/T1R3 co-expressing cells and Ca2+ imaging analysis
The complete coding sequences of T1R1 and T1R3 genes of grass carp were subcloned into the pcDNA3.1 expression vector (Invitrogen) using ClonExpressTM II (Vazyme Biotech, China). Human embryonic kidney 293T (HEK293T) cells were cultured in Dulbecco’s modified Eagle’s medium (DMEM) (Cat. No. C11995500, Life Technologies, Carlsbad, CA, USA) supplemented with 10% fetal bovine serum (Sigma-Aldrich, Saint Louis, MO) at 37 °C in 10% CO2. After 18 hours, the cells were transiently transfected with grass carp T1R1 and T1R3 gene using Lipofectamine 2000 reagent (Invitrogen, Carlsbad, CA). Cells transfected with empty vector, lacking T1R1 or T1R3, were employed to control for unspecific reactions of the cellular background. Eighteen hours after transfection, the cells were washed with Hanks balanced salt solution (HBSS) (Sigma-Aldrich, Saint Louis, MO). Cells were loaded with 4 µM of the calcium indicator dye fluo-4 AM (Cat. No. F10489, Invitrogen, Carlsbad, CA) diluted in HBSS for 30–40 min at 37 °C and then rinsed and incubated in 1 ml of HBSS for >30 min. The stimulation was performed by the addition of 1 ml amino acid by pipette. Cells were transfected with the pEGFP-N1 vector, which can express green fluorescent protein, to evaluate the transfection efficiency. Thirty-six hours after transfection, the cells were washed with HBSS, and the green fluorescent protein was observed. The transfection efficiency was 70% to 80%.
The fluo-4 AM fluorescence intensities resulting from excitation at 494 nm were measured at 514 nm using an inverted confocal microscope (FluoView FV1000; Olympus, Tokyo, Japan). Baseline was established for at least 15 s before stimulation, as shown in the Fig. 7B. After that, cells were perfused with 100 mM L-amino acids (Sigma-Aldrich, Saint Louis, MO) at a rate of 2 ml/min. Images were recorded at 6.54-s intervals up to 183.16 s after the addition and analyzed using FV10-ASW 3.1 Viewer software. The backgrounds of the emission intensities were subtracted. Data are expressed as the ratio of the fluorescence intensities of several single 20 HEK293T cells per dish and initial intensity (F/F0).
Fish and sample collection
Fish and samples were prepared according to the experiments of He et al.16. The grass carp embryos were obtained from Wuhan Academy of Agricultural Science and Technology (Wuhan, Hubei Province, China). Larvae were raised in tanks and fed with chironomid larvae Chironomus tentans. At 46 days post-hatch (dph) (body weight 0.39 ± 0.05 g, body length 28.05 ± 0.99 mm), 6 fish were randomly selected for sample collection as fish before food habit transition (Group A). The rest of the fish in Group B were fed with duckweed Lemna minor after the food habit transition to herbivores. Fish in both groups had free access to food 24 h a day and fed for 70 days. At 116 dph (body weight and body length for Group B were 7.34 ± 1.43 g and 72.78 ± 6.15 mm, respectively), 6 fish were randomly selected from the group for sample collection. The fish were deeply anesthetized with MS-222 (200 mg L−1) and killed by immediate spinal destruction for the measurement and dissection. The whole intestine of the grass carp before and after the food habit transition was collected and then frozen in liquid nitrogen and stored at −80 °C for RNA and DNA isolation. Total RNA was extracted using Trizol Reagent (TaKaRa, Japan), and then its integrity and quantity were measured using protein and agarose gel electrophoresis and an Eppendorf Biophotometer (Hamburg, Germany). According to the manufacturer’s instructions, cDNAs were obtained from 1 µg total RNA with the HiScript® II Reverse Transcriptase (Vazyme Biotech, China) in a 20-μL reaction volume.
DNA methylation analysis
Genomic DNA was extracted following the standard procedures using TIANamp Genomic DNA Kit (Tiangen, Beijing, China). DNA treatment with sodium bisulfite was performed using the EZ DNA Methylation Kit (Zymo Research, USA) according to the manufacturer’s protocol. The BSP primers were designed by the online MethPrimer software 14 and Primer 5.0 (Table 7). PCR was performed on Biometra Thermo cyclers (Biometra, Germany) by using Taq plus DNA Polymerase (Vazyme Biotech, China). The PCR products were gel purified using a Gel Purification Kit (Sangon, Shanghai, China) and then were subcloned into the pMD18-T clone vector (Takara, Japan). Ten positive clones for each subject were randomly selected for sequencing (Sangon, Shanghai, China). The final sequence results were processed by online QUMA software (http://quma.cdb.riken.jp/). Three samples from the intestine of grass carp before and after the food habit transition from carnivore to herbivore were analyzed.
Luciferase activity assay of the upstream regulatory region of T1R1 in grass carp
The upstream regulatory region sequences of T1R1 in grass carp were cloned by overlapping PCR38 using Phanta® Super-Fidelity DNA Polymerase (Vazyme Biotech, China), and specific primers containing Kpn I and Xho I restriction sites were designed (Table 7). As shown in Fig. 10A, three sequences were obtained, including the sequence of the upstream regulatory region of −2500 bp upstream from the transcription initiation site (designated as 0), the −2500 bp sequence without CPG1, the −2500 bp sequence without CPG3. For the generation of luciferase reporter, the PCR product was purified and subsequently digested using kpn I and Xho I restriction enzymes, then cloned into the corresponding restriction sites of pGL6-basic vector by a ClonExpress™ II One Step Cloning Kit (Vazyme, USA).
For determining the function of the upstream regulatory region of T1R1, transfection assays were performed. HEK293T cells were plated in 24-well plates for 24 h and then transfected with different plasmids with Lipofectamine 2000. Equimolar amounts (500 ng) of reporter plasmids were used in Opti-MEM (Gibco/Invitrogen), and they were co-transfected with 1 ng pRL-SV40, a Renilla luciferase reporter vector, as the internal control. After 4 h, the cell culture medium was replaced by 10% FBS-DMEM. Thirty-six hours later, transfected cells were washed twice with phosphate buffered saline (PBS) and then collected. The cells were lysed with Passive Lysis Buffer (Promega) and assayed for Firefly and Renilla luciferase activities in a luminometer by the Dual-Luciferase Reporter Assay System (Promega). The luciferase value of each sample was first normalized against the pRL-SV40 levels, and the relative light unit (RLU) intensity was presented as the ratio of firefly luciferase to Renilla luciferase. The results were normalized to the control reporter pGL6-Basic. All experiments were performed in triplicate and repeated three times.
T1R1 and T1R3 gene expression analysis of the food habit transition from carnivore to herbivore in grass carp
To detect the expressions of T1R1 and T1R3 mRNA in grass carp before and after food habit transition from carnivore to herbivore, real-time PCR assays were carried out by quantitative thermal cycler (MyiQ™ 2 Two-Color Real-Time PCR Detection System, BIO-RAD, USA). Primers were designed according to the sequences we cloned (Table 7). The EF1 gene was used to normalize the template amount as an endogenous reference. All amplifications for each RNA sample were performed in triplicate. The reaction volume was 10 μL GoTaq® qPCR Master Mix (BIO-RAD, USA), 1 μl of cDNA, and 0.2 μM of each primer. The PCR cycling parameters were 95 °C for 30 s followed by 40 cycles at 95 °C for 10 s, 58 °C for 30 sec and a melt curve step from 65 °C, gradually increasing from 0.5 °C·s−1 to 95 °C, with acquisition data every 6 sec. Gene expression levels were quantified relative to the expression of EF1 gene using the optimized comparative Ct (2−ΔΔCt) value method. The specificity of the primers was determined through sequencing and the melting curve of PCR products. Plasmid containing target fragments were dilated 10-fold. qPCR was conducted using different dilutions as templates to construct standard curves for genes. The amplification efficiencies were analyzed according to the slope of the standard curve in a given run.
Statistical analysis
The normality of data was assessed by using SPSS 19.0 software with the Shapiro-Wilk test. All data of T1R1 and T1R3 gene expression levels were subjected to one-way analysis of variance using SPSS 19.0 software. Differences between the means were tested by Duncan’s multiple range test after the homogeneity of variances was checked. The DNA methylation analysis was determined with the χ2 test. Statistical significance was determined at the 5% level. All data were presented as the mean ± S.E.M (standard error of the mean).
Acknowledgements
This work was financially supported by the National Basic Research Program of China (2014CB138601), the National Natural Science Foundation of China (31602131), and Da Bei Nong Group Promoted Project for Young Scholar of HZAU (No. 2017DBN014).
Author Contributions
Xu-Fang Liang, Shan He and Wenjing Cai designed the research; Wenjing Cai and Xiaochen Yuan performed the research; Wenjing Cai analyzed the data; Shan He and Wenjing Cai wrote and edited the paper.
Competing Interests
The authors declare no competing interests.
Footnotes
Wenjing Cai and Shan He contributed equally to this work.
Publisher's note: Springer Nature remains neutral with regard to jurisdictional claims in published maps and institutional affiliations.
References
- 1.Hoon MA, et al. Putative mammalian taste receptors: a class of taste-specific GPCRs with distinct topographic selectivity. Cell. 1999;96:541–551. doi: 10.1016/S0092-8674(00)80658-3. [DOI] [PubMed] [Google Scholar]
- 2.Treesukosol Y, Smith KR, Spector AC. The functional role of the t1r family of receptors in sweet taste and feeding. Physiol. Behav. 2011;105:14–26. doi: 10.1016/j.physbeh.2011.02.030. [DOI] [PMC free article] [PubMed] [Google Scholar]
- 3.Shi P, Zhang J. Contrasting modes of evolution between vertebrate sweet/umami receptor genes and bitter receptor genes. Mol. Biol. Evol. 2006;23:292–300. doi: 10.1093/molbev/msj028. [DOI] [PubMed] [Google Scholar]
- 4.Zhao H, Xu D, Zhang S, Zhang J. Genomic and genetic evidence for the loss of umami taste in bats. Genome Biol. Evol. 2012;4:73–79. doi: 10.1093/gbe/evr126. [DOI] [PMC free article] [PubMed] [Google Scholar]
- 5.Li R, et al. The sequence and de novo assembly of the giant panda genome. Nature. 2010;463:311–317. doi: 10.1038/nature08696. [DOI] [PMC free article] [PubMed] [Google Scholar]
- 6.Zhao H, Yang JR, Xu H, Zhang J. Pseudogenization of the umami taste receptor gene Tas1r1 in the giant panda coincided with its dietary switch to bamboo. Mol. Biol. Evol. 2010;27:2669–2673. doi: 10.1093/molbev/msq153. [DOI] [PMC free article] [PubMed] [Google Scholar]
- 7.Jiang P, et al. Major taste loss in Carnivore mammals. Proc. Natl. Acad. Sci. USA. 2012;109:4956–4961. doi: 10.1073/pnas.1118360109. [DOI] [PMC free article] [PubMed] [Google Scholar]
- 8.Sato JJ, Wolsan M. Loss or major reduction of umami taste sensation in pinnipeds. Sci. Nat. 2012;99:655–659. doi: 10.1007/s00114-012-0939-8. [DOI] [PMC free article] [PubMed] [Google Scholar]
- 9.Zhao HB, Zhang JZ. Mismatches between feeding ecology and taste receptor evolution: An inconvenient truth. Proc. Natl. Acad. Sci. USA. 2012;109:E1464–E1464. doi: 10.1073/pnas.1205205109. [DOI] [PMC free article] [PubMed] [Google Scholar]
- 10.Hara TJ. Olfaction and gustation in fish: an overview. Acta Physiol. Sca. 1994;152:207–217. doi: 10.1111/j.1748-1716.1994.tb09800.x. [DOI] [PubMed] [Google Scholar]
- 11.Kasumyan AO, DÖving KB. Taste preferences in fishes. Fish Fisheries. 2003;4:289–347. doi: 10.1046/j.1467-2979.2003.00121.x. [DOI] [Google Scholar]
- 12.Liu H, et al. The draft genome of blunt snout bream (Megalobrama amblycephala) reveals the development of intermuscular bone and adaptation to herbivorous diet. Gigascience. 2017;6:1–13. doi: 10.1093/gigascience/gix039. [DOI] [PMC free article] [PubMed] [Google Scholar]
- 13.Okada S. The taste system of small fish species. Biosci. Biotech. Bioch. 2015;7:1039–1043. doi: 10.1080/09168451.2015.1023251. [DOI] [PubMed] [Google Scholar]
- 14.Watkins CE, Shireman JV, Rottmann RW, Collem DE. Food habits of fingerling grass carp. Progres. Fish-Culturist. 1981;43:95–97. doi: 10.1577/1548-8659(1981)43[95:FHOFGC]2.0.CO;2. [DOI] [Google Scholar]
- 15.Wang YP, et al. The draft genome of the grass carp (Ctenopharyngodon idellus) provides insights into its evolution and vegetarian adaptation. Nat. Genet. 2015;47:625–631. doi: 10.1038/ng.3280. [DOI] [PubMed] [Google Scholar]
- 16.He S, et al. Transcriptome analysis of food habit transition from carnivory to herbivory in a typical vertebrate herbivore, grass carp Ctenopharyngodon idella. BMC genomics. 2015;16:15. doi: 10.1186/s12864-015-1217-x. [DOI] [PMC free article] [PubMed] [Google Scholar]
- 17.Shigemura N, Shirosaki S, Sanematsu K, Yoshida R, Ninomiya Y. Genetic and molecular basis of individual differences in human umami taste perception. Plos One. 2009;4:e6717. doi: 10.1371/journal.pone.0006717. [DOI] [PMC free article] [PubMed] [Google Scholar]
- 18.Chen QY, et al. Perceptual variation in umami taste and polymorphisms in TAS1R taste receptor genes. Am. J. Clin. Nutr. 2009;90:770S–779S. doi: 10.3945/ajcn.2009.27462N. [DOI] [PMC free article] [PubMed] [Google Scholar]
- 19.Reed DR, et al. Polymorphisms in the taste receptor gene (Tas1r3) region are associated with saccharin preference in 30 mouse strains. J. Neurosci. 2004;24:938–946. doi: 10.1523/JNEUROSCI.1374-03.2004. [DOI] [PMC free article] [PubMed] [Google Scholar]
- 20.Bird A. DNA methylation patterns and epigenetic memory. Genes Dev. 2002;16:6–21. doi: 10.1101/gad.947102. [DOI] [PubMed] [Google Scholar]
- 21.Plass C, Soloway PD. DNA methylation, imprinting and cancer. Eur. J. Hum. Genet. 2002;10:6–16. doi: 10.1038/sj.ejhg.5200768. [DOI] [PubMed] [Google Scholar]
- 22.Feng P, Zhao H. Complex evolutionary history of the vertebrate sweet/umami taste receptor genes. Chinese Sci. Bull. 2013;58:2198–2204. doi: 10.1007/s11434-013-5811-5. [DOI] [Google Scholar]
- 23.Li X, et al. Human receptors for sweet and umami taste. Proc. Natl. Acad. Sci. USA. 2002;99:4692–4696. doi: 10.1073/pnas.072090199. [DOI] [PMC free article] [PubMed] [Google Scholar]
- 24.Sainz E, Korley JN, Battey JF, Sullivan SL. Identification of a novel member of the T1R family of putative taste receptors. J. Neurochem. 2001;77:896–903. doi: 10.1046/j.1471-4159.2001.00292.x. [DOI] [PubMed] [Google Scholar]
- 25.Ishimaru Y, et al. Two families of candidate taste receptors in fishes. Mech. Develop. 2005;122:1310–1321. doi: 10.1016/j.mod.2005.07.005. [DOI] [PubMed] [Google Scholar]
- 26.Wilson, S. G. Role of hairy-related (her) genes during vertebrate retinaldevelopment and regeneration. Theses and Dissertations–Biology. 36 (2016).
- 27.Oike H, et al. Characterization of ligands for fish taste receptors. J. Neurosci. 2007;27:5584–5592. doi: 10.1523/JNEUROSCI.0651-07.2007. [DOI] [PMC free article] [PubMed] [Google Scholar]
- 28.Mouritsen OG, Khandelia H. Molecular mechanism of the allosteric enhancement of the umami taste sensation. Febs. J. 2012;279:3112–3120. doi: 10.1111/j.1742-4658.2012.08690.x. [DOI] [PubMed] [Google Scholar]
- 29.Dang Y, Gao X, Xie A, Wu X, Ma F. Interaction Between Umami Peptide and Taste Receptor T1R1/T1R3. Cell Biochem. Biophy. 2014;70:1841–1848. doi: 10.1007/s12013-014-0141-z. [DOI] [PubMed] [Google Scholar]
- 30.Raliou M, et al. Human genetic polymorphisms in T1R1 and T1R3 taste receptor subunits affect their function. Chem. Senses. 2011;36:527–537. doi: 10.1093/chemse/bjr014. [DOI] [PubMed] [Google Scholar]
- 31.Chen SL, Liu XF, Su ZG. Nutrition and bioenergetics of the Chinese herbivorous fishes with important food values, maximum consumption and digestion of seven aquatic plants by Ctenopharynogodon idella and Megalobrama amblycephala. Acta hydrobiol. sinica. 1993;17:1–12. [Google Scholar]
- 32.Yang JJ, Lin Y, Liang JN, Chen Z. Analysis and evaluations on nutrition of natural forages of Mystus guttatus. J. Zhanjiang Ocean University. 2001;21:19–22. [Google Scholar]
- 33.Kendig DM, et al. Activation of the umami taste receptor (t1r1/t1r3) initiates the peristaltic reflex and pellet propulsion in the distal colon. Am. J. Physiol- Gastr. Li. 2014;307:G1100–G1107. doi: 10.1152/ajpgi.00251.2014. [DOI] [PMC free article] [PubMed] [Google Scholar]
- 34.Daly K, et al. Sensing of amino acids by the gut-expressed taste receptor T1R1-T1R3 stimulates CCK secretion. Am. J. Physiol-Gastr. L. 2013;304:G271–G282. doi: 10.1152/ajpgi.00074.2012. [DOI] [PMC free article] [PubMed] [Google Scholar]
- 35.Polakof S, Soengas JL. Evidence of sugar sensitive genes in the gut of a carnivorous fish species. Comp. Biochem. Physiol. B Biochem. Mol. Biol. 2013;166:58–64. doi: 10.1016/j.cbpb.2013.07.003. [DOI] [PubMed] [Google Scholar]
- 36.Damak S, et al. Detection of sweet and umami taste in the absence of taste receptor T1r3. Science. 2003;301:850–853. doi: 10.1126/science.1087155. [DOI] [PubMed] [Google Scholar]
- 37.Zhao GQ, et al. The receptors for mammalian sweet and umami taste. Cell. 2003;115:255–266. doi: 10.1016/S0092-8674(03)00844-4. [DOI] [PubMed] [Google Scholar]
- 38.Heckman KL, Pease LR. Gene splicing and mutagenesis by pcr-driven overlap extension. Nat. Protocol. 2007;2:924–932. doi: 10.1038/nprot.2007.132. [DOI] [PubMed] [Google Scholar]


