

SUMMARY
Using molecular, biochemical, and untargeted stable isotope tracing approaches, we identify a previously unappreciated glutamine-derived α-ketoglutarate (αKG) energy-generating anaplerotic flux to be critical in mitochondrial DNA (mtDNA) mutant cells that harbor human disease-associated oxidative phosphorylation defects. Stimulating this flux with αKG supplementation enables the survival of diverse mtDNA mutant cells under otherwise lethal obligatory oxidative conditions. Strikingly, we demonstrate that when residual mitochondrial respiration in mitochondrial DNA mutant cells exceeds 45% of control levels, αKG oxidative flux prevails over reductive carboxylation. Furthermore, in a mouse model of mitochondrial myopathy, we show that increased oxidative αKG flux in muscle arises from enhanced alanine synthesis and release into blood, concomitant with accelerated amino acid catabolism from protein breakdown. Importantly, in this mouse model of mitochondriopathy, muscle amino acid imbalance is normalized by αKG supplementation. Taken together, our findings provide a rationale for αKG supplementation as a therapeutic strategy for mitochondrial myopathies.
Keywords: Mitochondrial diseases, mitochondria, glutamine, glutamate, anaplerosis, myopathy
eTOC blurb
XXX et al show that patient cells with mtDNA mutations, and a mouse model of mitochondrial myopathy, have compensatory glutamine-derived anaplerotic flux to generate αKG to the TCA cycle to enable mutant cell survival. The metabolic fate of αKG (oxidative vs. reductive) depends on the severity of OXPHOS impairment.

INTRODUCTION
Human disorders caused by mitochondrial gene mutations often result in oxidative phosphorylation (OXPHOS) impairment and typically affect multiple organs, manifesting with severe neurological and myopathic symptoms (Gorman et al., 2016). Currently, there are no effective treatments for mitochondrial diseases, due to the lack of defined targets. In particular, there is limited understanding of the metabolic consequences of OXPHOS defects. OXPHOS deficient cells are forced to adapt their metabolism to compensate for energy defects and the inability to efficiently utilize the tricarboxylic acid (TCA) cycle for generation of energy and macromolecule building blocks (Eales et al., 2016). The resulting metabolic rewiring inevitably affects intermediary cell metabolism, in particular the metabolism of amino acids that feed into the TCA cycle. Accordingly, in the setting of mitochondrial disorders, failure to efficiently utilize reducing equivalents from the TCA cycle can result in a critical imbalance of amino acid metabolites that contribute significantly to disease pathogenesis (Smeitink et al., 2006).
Glutamine is the most abundant circulating amino acid. In rapidly proliferating cells, glutamine serves an anaplerotic role by replenishing TCA cycle intermediates for the production of reducing equivalents that drive the mitochondrial respiratory chain (RC) and generate lipid and nucleotide biosynthetic precursors (Daye and Wellen, 2012; Tong et al., 2009). Through additional biochemical pathways, glutamine also plays an important role in the synthesis of neurotransmitters and glutathione (GSH) (Tapiero et al., 2002). Recently, in the setting of mtDNA mutations that result in complete OXPHOS shutdown, glutamine was shown to exclusively undergo a reductive flux via the TCA cycle, culminating in aspartate synthesis that is essential for nucleotide synthesis and cell proliferation in culture (Birsoy et al., 2015; Sullivan et al., 2015). Notably, complete OXPHOS shutdown is not a condition that is compatible with human life. Notwithstanding, this finding led to the hypothesis that aspartate supplementation could be generically beneficial in diseases associated with RC defects. These findings prompted us to investigate in detail the metabolic rewiring in cells with disease-associated mtDNA mutations with moderate/incomplete OXPHOS defects. In particular, we sought to investigate the metabolic role and fate of glutamine, beyond the anaplerotic influx into the TCA cycle and how this may be impacted by the extent of OXPHOS impairment.
Through tissue specific metabolism, glutamine is critically involved in trans-organ metabolic fluxes. Mostly synthesized from glutamate in skeletal muscle, glutamine is released in blood for utilization by multiple tissues. Glutamine serves in kidney for acid-base homeostasis, in liver as a substrate for ureogenesis, and in both kidney and liver as a precursor for gluconeogenesis. Accordingly, the synthesis and release of glutamine from skeletal muscle is stimulated in response to metabolic acidosis and starvation (Chang and Goldberg, 1978; He et al., 2010; Taylor and Curthoys, 2004), as well as under stress conditions that include injury, infections, and burns (Newsholme et al., 1988). To address the specific cell autonomous effects of OXPHOS deficiency on glutamine metabolism in skeletal muscle, without the contribution of other organs, we investigated a genetic mouse model of muscle-specific RC complex IV deficiency.
Here, we uncover compensatory energy-generating anaplerotic mechanisms that appear concomitant with mtDNA mutations that partially impair OXPHOS activity, as found in human mitochondrial disease cases. We demonstrate the fundamental requirement of glutamine-glutamate-αKG oxidative metabolism for mtDNA mutant cell survival and reveal the molecular basis for this need. The present study sheds new light on the fundamental metabolic dysfunctions that underlie mitochondrial disease pathogenesis and obligate metabolic compensations, and identify a novel metabolic strategy for therapy of mitochondrial myopathies.
RESULTS
mtDNA mutant cells with OXPHOS dysfunction are highly dependent on glutamine metabolism
Cancer cells are well-known to exhibit a high rate of glycolysis and lactic acid fermentation, even under normoxic conditions (i.e., the Warburg effect). In addition to glucose as a critical carbon source, they display a marked dependence upon extracellular glutamine (glutamine addiction) as a nitrogen source and for anaplerotic input into the TCA cycle via the glutamine-glutamate-αKG (gln-glu-αKG) pathway (Wise and Thompson, 2010). To define the metabolic fate of glutamine in the setting of human mtDNA mutations that result in OXPHOS dysfunction, we studied its metabolism in patient-derived cytoplasmic hybrid cells (cybrids) harboring mtDNA mutations associated with mitochondrial diseases. Toward this end, we compared mtDNA mutant cybrids with moderate OXPHOS dysfunction vs. parental cybrids with wild type mtDNA (i.e., the 143B osteosarcoma cell line). Notably, in this cybrid comparison, mutant and WT cells possess same nuclear genomes, so any observed metabolic perturbations can be specifically attributed to differences in their mtDNA genotypes.
In one set of experiments, we analyzed cybrids containing a homoplasmic T8993G mtDNA mutation in subunit 6 of ATPase (A6MT), which is clinically-associated with the NARP/MILS syndrome (Nijtmans et al., 2001). We previously showed that this cell line exhibits a significant reduction of both ATP synthesis (70% decrease) and respiration (50% decrease) (D’Aurelio et al., 2010). Notwithstanding this bioenergetics defect, the proliferation rate of A6MT cells in 25 mM glucose-DMEM (containing 1 mM pyruvate and 4 mM glutamine) was diminished by 17% vs. WT (Fig. 1A). Additionally, the elimination of pyruvate from culture medium had a <10% suppressive effect on A6MT proliferation (Fig. 1A), indicating that, contrary to what happens in cells with no mtDNA, that results in a complete loss of OXPHOS (King and Attardi, 1989), A6MT cells are not auxotrophic for pyruvate. However, it is notable that both WT and A6MT cell growth was highly dependent on glutamine, as shown by the marked drop in proliferation rate in glucose-DMEM lacking glutamine (Fig. 1A). Notably, A6MT cells were more greatly impacted by glutamine deprivation (84% and 62% decrease in proliferation for A6MT and WT cells, respectively: Fig. 1B). Accordingly, the consumption rate of extracellular glutamine was observed to be significantly increased in A6MT vs. WT cells (50%, Fig. 1C, 1D), suggesting a greater glutamine dependence of A6MT cells.
Figure 1. A6MT cells with OXPHOS defect are highly dependent on glutamine metabolism.
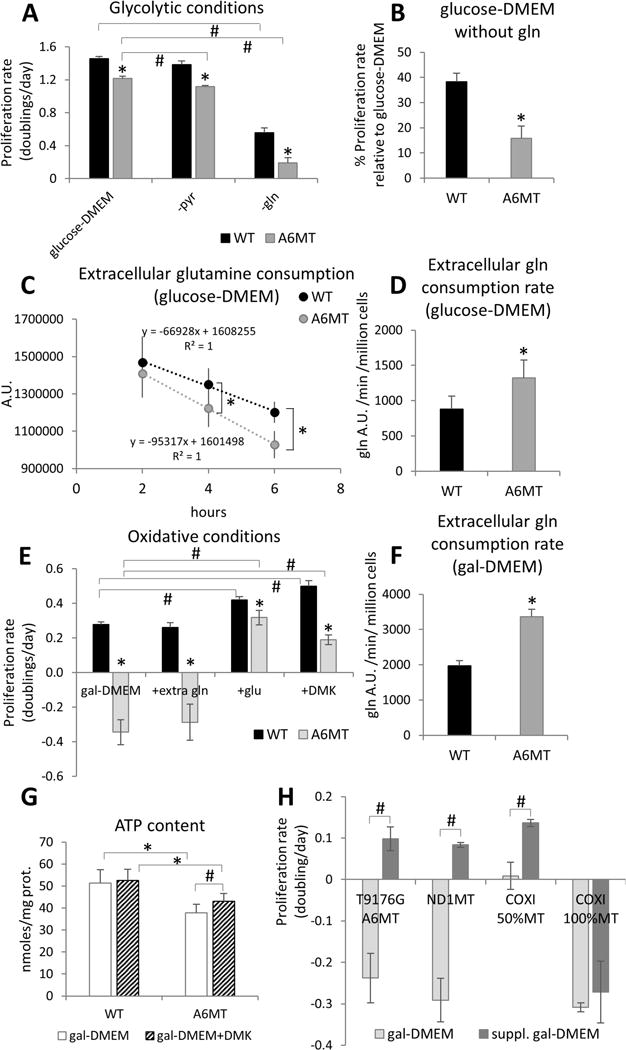
(A) Proliferation rates (doublings/day) in glucose-DMEM, glucose-DMEM without pyruvate (-pyr), and glucose-DMEM without glutamine (-gln) calculated over three days. (B) Proliferation rate in glucose-DMEM without glutamine expressed as percentage of proliferation rate in glucose-DMEM. In A and B, n=3 independent cultures. *, p<0.05 A6MT vs. WT in the same conditions; #, p<0.05. (C) Extracellular levels of glutamine in A6MT and WT cells cultured for 2 h, 4 h, and 6 h in glucose-DMEM. D) Rates of extracellular glutamine consumption in A6MT and WT cells cultured for 6 hours in glucose-DMEM. A.U., arbitrary units. In C and D, n=6 independent cultures. *, p<0.05 A6MT vs. WT. (E) Proliferation rates (doublings/day) in gal-DMEM and gal-DMEM supplemented with 6 mM extra glutamine (+extra gln), with 6 mM glutamate (+glu), and with 6 mM DMK (+DMK) calculated over three days. n=3 independent cultures. *, p<0.05 A6MT vs. WT in the same conditions; #, p<0.05. (F) Rates of extracellular glutamine consumption in A6MT and WT cells cultured for 6 hours in gal-DMEM. n=6 independent cultures. *, p<0.05 A6MT vs. WT. (G) Intracellular ATP levels in WT and A6MT cells cultured for 48 h in gal-DMEM with (striped bars) or without (white bars) DMK supplementation (6 mM). (H) Proliferation rate in gal-DMEM and gal-DMEM supplemented with glutamate (A6MT) and DMK (ND1MT, COXI 50%MT, and COXI 100%MT). In G and H, n=3 independent cultures. *, p<0.05; #, p<0.05.
In A-H, data are presented as average ± S.D.
αKG anaplerosis enhances viability of mtDNA mutant cells in oxidative conditions
Under glucose-free conditions, OXPHOS defective cells are unable to grow (Robinson, 1996). In accord, A6MT cells failed to proliferate in the presence of galactose as a carbon source (i.e., glucose-free DMEM containing 25 mM galactose, 1 mM pyruvate, and 4 mM glutamine, Fig. 1E). Since galactose is poorly utilized for glycolysis, as shown by the several-fold decrease in lactate production compared to glycolytic conditions (Fig. S1A), glutamine becomes an essential energy source, and glutamine deprivation completely suppresses cell proliferation (Fig. S1B). Reciprocally, we hypothesized that enhancing glutamine anaplerosis could effectively enhance A6MT cell proliferation under oxidative growth conditions.
For anaplerotic use, glutamine is transformed to glutamate, followed by conversion to αKG for entry into the TCA cycle. Accordingly, we independently assessed each intermediate of the anaplerotic glutamine utilization for the potential to increase A6MT cell proliferation in gal-DMEM. Whereas supplementation with an excess of glutamine (10 mM vs. 4 mM) did not restore A6MT proliferation, supplementation with glutamate (6 mM) or dimethyl-αKG (DMK, 6 mM), a membrane-permeant αKG analog, markedly enhanced A6MT cells proliferation (Fig. 1E, S1B, S1C). These findings suggest that in the setting of OXPHOS defect, glutamate and αKG can activate anaplerotic energy metabolism and support mtDNA mutant cell growth in gal-DMEM. Further, an increased consumption of extracellular glutamine by A6MT cells (70% increase vs. WT, Fig. 1F, S1E) suggested that glutamine-derived glutamate, rather than glutamine per se, may be rate-limiting for A6MT cells anaplerosis. Since glutamate was not detected in the extracellular galactose-DMEM medium (Table S1), we excluded the possibility that the failure of glutamine to activate anaplerosis was due to the exchange of intracellular glutamate with other metabolites such as cystine (Shin et al., 2017). Interestingly, WT cell proliferation was also increased by supplementation with glutamate or DMK, but not with glutamine (Fig. 1E, S1D), further suggesting that in oxidative conditions glutamine conversion to glutamate could be a rate-limiting step for anaplerosis.
DMK treatment induced a significant increase in ATP content (Fig. 1G) and respiration (Fig. S1F) in A6MT cells, affirming the use of DMK as an energy source. The ability to utilize αKG as a respiratory substrate was also assessed in permeabilized cells and compared with pyruvate as a bioenergetic fuel. Interestingly, αKG (6 mM) was a better respiratory substrate than pyruvate (6 mM) for A6MT cells, while no difference between these two substrates was observed with WT cells (Fig. S1G). Accordingly, the growth of A6MT cells in DMK supplemented gal-DMEM was similar in the presence and absence of pyruvate (Fig. S2A), demonstrating that αKG rescue of A6MT cell growth is independent of pyruvate. Finally, the effect of DMK was completely abolished by the αKG dehydrogenase (OGDH) inhibitor succinylphosphonate carboxyethyl ester (CESP, 2 mM) (Bunik et al., 2005; Santos et al., 2006), (Fig. S2B), indicating that DMK rescue requires oxidation, and presumably entry into the TCA cycle.
Next, we investigated if aspartate, which has been shown to enable proliferation of cells that are completely OXPHOS deficient (Birsoy et al., 2015; Sullivan et al., 2015), can similarly rescue A6MT cells when grown in gal-DMEM. Results showed that supplementation with aspartate (10 mM) elicits a 50% increase of intracellular aspartate (Fig. S2C), but no acceleration of A6MT cell growth (Fig. S2D). On the contrary, aspartate supplementation hindered DMK rescue (Fig. S2D), suggesting that high intracellular aspartate may inhibit anaplerotic flux.
To determine whether amelioration of cell growth in gal-DMEM by glutamate anaplerosis generally applies to cells with OXPHOS defects, independently of the RC complex affected, glutamate and DMK supplementation was tested in osteosarcoma-derived cybrids harboring different mtDNA mutations. We studied the following cell lines with partial OXPHOS defects: homoplasmic T9176G mutants in ATP6 subunit, (NARP (Carrozzo et al., 2001)), homoplasmic G3460A mutants in ND1 subunit of complex I (ND1MT, 50% decrease in respiration, Leber’s optic atrophy (Baracca et al., 2005)) and heteroplasmic G6930A mutants (50% mutation load) in subunit I of cytochrome c oxidase (COXI 50%MT, decreased complex IV activity and respiration, mitochondrial encephalopathy (Bruno et al., 1999; D’Aurelio et al., 2001)). For comparison, we also studied homoplasmic G6930A mutants (COXI 100%MT) with a complete abolition of OXPHOS activity. Cell proliferation in gal-DMEM was significantly improved by supplementation with either glutamate or DMK in NARP T9176G, ND1MT, and COXI 50%MT, but not in COXI 100%MT (Fig. 1H), indicating that stimulating αKG anaplerosis is beneficial to cells with diverse mtDNA mutations, but it requires some residual OXPHOS activity. Furthermore, mtDNA mutation analysis of COXI 50%MT cells showed that mtDNA heteroplasmy levels were stable after DMK administration (Fig. S2E), indicating that growth rescue in gal-DMEM was not due to a genetic drift toward lower levels of mtDNA mutation. We also tested HeLa-derived cybrids harboring homoplasmic T8993G mtDNA mutation in ATP6 (HeLa A6MT) and compared to parental HeLa WT cells. HeLa A6MT cell proliferation in gal-DMEM was decreased compared to WT and was restored to WT levels by DMK supplementation (Fig. S2F), indicating that boosting glutamate anaplerosis specifically restores OXPHOS defective cell growth by a mechanism that is independent of the nuclear genome.
Glutamine and glutamine metabolites are altered in cells harboring mtDNA mutations
HPLC was utilized to quantify changes in the intracellular levels of amino acids related to the gln-glu-αKG pathway in A6MT and WT cells. Glutamine levels progressively decreased in A6MT cells relative to WT cells at 48 h, 72 h, and 96 h of culture in glucose-DMEM (Fig. 2A). These results suggested that mutant cells convert glutamine to glutamate at a faster rate. Notably, the more rapid disappearance of glutamine in A6MT cells occurred concomitantly with an accelerated decrease of intracellular glutamate (Fig. 2B).
Figure 2. Levels of glutamine metabolites are altered in mtDNA mutant cells.

Intracellular levels of glutamine (A), glutamate (B), and aspartate (C) by HPLC analysis in A6MT and WT cells cultured for 48 h, 72 h, and 96 h in glucose-DMEM and for 96 h in glucose-DMEM with 4 mM extra glutamine (+extra gln). In A-C, n=3 independent cultures. *, p<0.05 MT vs. WT at the same time point; #, p<0.05. (D) Levels of metabolites in mtDNA mutant cells cultured for 72 h in glucose-DMEM expressed as percentage of WT (the dashed line indicates WT levels) by LC-MS analysis. n=6 independent cultures. All metabolites were significantly decreased (*, p<0.05) in mtDNA mutant cells as compared to WT.
In A-D, data are presented as average ± S.D.
To test the hypothesis that extracellular glutamine is limiting for glutamate production, A6MT cells were cultured for 96 h in glucose-DMEM supplemented with extra glutamine (8 mM vs. 4 mM). This extracellular glutamine supplementation significantly opposed intracellular depletion in A6MT cells (Fig. 2A), confirming that glutamine uptake was limited by extracellular availability. Strikingly, in A6MT cells, although glutamine levels remained markedly lower than in WT (4 vs. 53 nmoles/mg protein) when grown in 8 mM glutamine, extra glutamine completely normalized glutamate levels (Fig. 2B), in accord with efficient glutamine conversion to glutamate. In contrast, additional glutamine did not increase intracellular levels of aspartate (Fig. 2C), which is a co-product of αKG in the glutamate-oxaloacetate transamination (GOT) reaction, suggesting that aspartate was rapidly consumed to allow for glutamate-αKG flux into the TCA cycle. Importantly, the metabolic profile characterized by decreased levels of intracellular glutamine, glutamate, and aspartate was similarly found in homoplasmic ND1MT and heteroplasmic COXI 50%MT cells (Fig. S2G). These findings suggest that accelerated glutamine utilization is a common feature of cells with partial OXPHOS defects, irrespective of the OXPHOS complex affected.
Untargeted mass spectrometry-based metabolomics was utilized to broadly identify differences in the levels of functionally relevant intracellular metabolites in A6MT and COXI 50%MT cells. Heatmap analyses of metabolites (Fig. S3A, S3B) showed clear differences in metabolomic profiles for mtDNA mutant cells, compared to WT cells. Pathway analysis of the depicted heatmap data revealed that both mtDNA mutant cells exhibited marked perturbations in alanine, glutamine and glutamate metabolism and these pathways were impacted to the greatest extent (Fig. S3C, S3D).
Targeted metabolomics was then utilized to identify common differences in the levels of glutamine-derived intracellular metabolites in A6MT and COXI 50%MT cells. Multidimensional LC/MS findings not only confirmed decreased levels of glutamine, glutamate, and aspartate in both mtDNA mutant cell lines, but also revealed decreases in GSH, citrulline, ornithine, and proline, relative to WT cells (Fig. 2D). Notably, each of these metabolites derive from glutamine deamination and subsequent metabolic steps. For example, ornithine is synthesized from glutamate through glutamate-αKG dependent transaminase (ornithine aminotransferase, OAT) and citrulline from ornithine reacting with carbamoyl phosphate, which carries the ammonia group of glutamine (Fig. S4A). Therefore, it is not surprising that increased gln-glu-αKG anaplerosis could affect ornithine and citrulline homeostasis by altering ammonia and glutamate levels and modifying the directionality of reversible transaminase reactions. Furthermore, supplementation of DMK to glucose-DMEM resulted in a decrease in glutamate, aspartate, and citrulline levels in both mutant and WT cells (Table S2). Taken together, these results indicate that increased glutamine anaplerosis in mtDNA mutant cells profoundly affects related non-anaplerotic metabolic pathways.
The gln-glu-αKG oxidative flux is increased in mtDNA mutant cells
To better explore the gln-glu-αKG flux and the metabolic fates of glutamine in A6MT cells, we performed a mass spectrometry-based stable isotope tracing study. WT and A6MT cells were cultured in glucose-DMEM (containing 4 mM glutamine) supplemented with 2 mM of uniformly labeled [13C]- glutamine, and the time-dependent incorporation of 13C into TCA cycle and related metabolic intermediates was quantified (note that under these experimental conditions the maximum 33.3% incorporation of [U-13C] glutamine is equivalent to 100% isotope enrichment). In this tracer experiment, oxidative metabolism of [U-13C]-glutamine (i.e., with the TCA cycle running in a clockwise direction) would predictably generate (M+4) forms of succinate, malate, aspartate, citrate, and aconitate, owing to the incorporation of four 13C atoms in each of these species (see Fig. 3A, left panel). In contrast, reductive carboxylation would predictably yield (M+5) forms of aconitate and citrate (i.e., five 13C atoms incorporated) and (M+3) forms of oxaloacetate (OAA) and aspartate (i.e., with three 13C atoms incorporated; see schematic in Fig. 3A, right panel). Thus, by determining the isotopologue distribution and abundance of 13C enrichment in TCA cycle intermediates, the relative contribution of oxidative metabolism vs. reductive carboxylation arising from gln-glu-αKG flux can be confidently quantified.
Figure 3. The anaplerotic flux of glutamine is increased in mtDNA mutant cells.

(A) Schematic representation of oxidative (left panel in green) and reductive (right panel in blue) gln-glu-αKG influx. Filled red circles represent 13C atoms derived from [U-13C] glutamine. 2-oxoglutarate, αKG; OAA, oxaloacetate; sucl-CoA, succinyl-CoA. Mass isotopologue analysis of glutamate (B), αKG (C), malate (D) aspartate (E), citrate (F), aconitate (G) in WT (-) and A6MT (+) cells cultured for 0.5 h, 1 h, 2 h, 4 h with [U-13C] glutamine. (H) Intracellular levels of total aspartate (13C-labeled plus unlabeled) in WT and A6MT. In B-H data are presented as average ± S.D., n=6 independent cultures. *, p<0.05; #, p<0.05, A6MT vs. WT at the same time point.
Results showed that glutamate and αKG possess a significantly greater M+5 fractional incorporation in A6MT cells, compared to WT cells. These results, along with increased rates of glutamine consumption (Fig. 1D), indicated a significantly accelerated rate of glutamine conversion into glutamate, and subsequent conversion to αKG in A6MT cells (Fig. 3B, 3C). The data also indicated that maximal 13C incorporation (0.33 fractional incorporation, i.e., 100% enrichment) was evident by 4 h. Additionally, malate and aspartate displayed an overall greater M+4 incorporation in A6MT cells vs. WT, in accord with a significantly increased αKG oxidative flux in mutant cells, compared to WT (Fig. 3D, 3E). Indeed, the M+4 isotopologue of aspartate was approximately 4-fold greater than the M+3 isotopologue of aspartate, affirming that oxidative metabolism is the predominant pathway of glutamine-derived aspartate production (Fig. 3E). However, the increase of aspartate M+3, citrate M+5, and aconitate M+5 in A6MT cells as compared to WT (Fig. 3E, 3F, 3G) indicated that, despite being a lesser flux, reductive carboxylation was also increased in A6MT cells. Note that under these experimental conditions citrate and aconitate M+6 were not detected. Decreased total levels of malate, aspartate, citrate, and aconitate (i.e., the combination of all labeled and unlabeled isotopologues; Figs. S4C, 3H, S4D, S4E), together with increased fractional incorporation (13C-labeled/total, Figs. 3D, 3E, 3F, 3G), consistently indicated a faster glutamine flux through the TCA cycle in A6MT cells as compared to WT. Overall, these results demonstrate increased bidirectional metabolism of gln-glu-αKG influx in A6MT cells, with oxidative metabolism occurring at a faster pace than reductive carboxylation.
The observed increase in oxidative influx from glutamine to aspartate provides a potentially important, but relatively unappreciated, source of ATP, since oxidation of succinyl-CoA to succinate generates substrate level production of ATP/GTP, a source of high energy phosphate that relies on neither OXPHOS nor glycolysis. Total intracellular aspartate levels (13C-labeled and unlabeled) were confirmed to be decreased in A6MT cells, compared to WT (Fig. 3H). Notably, rapid conversion of aspartate facilitates αKG oxidative influx in the TCA cycle by diminishing the extent of feedback inhibition of mitochondrial glutamate-oxaloacetate transaminase (GOT2) and accumulation of OAA which is a potent inhibitor of succinate dehydrogenase (Kotlyar and Vinogradov, 1984).
Aspartate conversion to alanine sustains glutamine oxidative flux in mtDNA mutant cells
We hypothesized that glutamine-derived aspartate was effluxed into the cytosol of A6MT cells by the mitochondrial aspartate-glutamate carrier AGC, thereby allowing a continuous influx of glutamate-αKG into the TCA cycle. In an attempt to discover the potential fates of glutamine beyond anaplerotic influx into the TCA cycle as αKG and efflux as aspartate, we applied a mass spectrometry-based untargeted stable isotope tracing (USIT) strategy to survey 13C glutamine-derived metabolites and compared their relative 13C-enrichment in A6MT and WT cells as a function of time (0.5-24 h). Approximately 200 untargeted ion features were found to incorporate 13C after 4 h in culture with [U-13C]-glutamine (not shown). It is noteworthy that no significant difference was observed between mutant and WT cells for the small but detectable contribution of glutamine-derived aspartate into the pyrimidine ring of uridine for UDP and UTP biosynthesis at 4 h (Fig. S5A and S5B, see [M+3] isotopologue), indicating that the increased glutamine flux in mutant cells is not directed towards pyrimidine production in contrast to a prior report (Sullivan et al., 2015).
Alanine and lactate showed detectable incorporation as early as 2 h (Fig. 4A, 4C). The M+4 isotopologue of aspartate, derived from gln-glu-αKG oxidative flux, predictably generates the M+3 isotopologue of alanine and lactate (Fig. 4E), while the M+3 isotopologue of aspartate from the gln-glu-αKG reductive flux would generate the M+2 isotopologue of alanine and lactate. Our tracing studies revealed a significant enrichment in the M+3 isotopologue of alanine and lactate in A6MT cells relative to WT, both intracellularly at 2 and 4 h (Fig. 4A, 4C), as well as extracellularly, at 24 h (Fig. 4B, 4D). This finding indicates that cataplerotic efflux of aspartate was relatively accelerated in mutant cells. Aspartate efflux from mitochondria and conversion to cytosolic alanine and lactate, followed by increased alanine and lactate secretion, predictably serves to facilitate glutamine utilization through the TCA cycle in the direction of αKG oxidation (Fig. 4E), thereby promoting energy generation by substrate level phosphorylation. Further, the αKG flux to cytosolic alanine and lactate contributes to the re-oxidization of glycolytic NADH by malate dehydrogenase (MDH1) and lactate dehydrogenase (LDH), additionally providing a source of cytosolic NADPH by malic enzyme (MAE) for redox maintenance (i.e., GSSG reduction to GSH) and de novo lipid biosynthesis (Fig. 4E). While the aspartate (M+4) contribution in A6MT cells to total lactate at 24 h was small (2% when corrected for the 33% enrichment), indicating that lactate in these cells is dominantly generated by glycolysis, aspartate (M+4) contributed to a significant portion of alanine (19% when corrected for the 33% enrichment). Therefore, while the carbon skeleton of glutamate is oxidized by the TCA cycle, its amino group is eliminated through alanine excretion.
Figure 4. Cataplerotic efflux and conversion of aspartate sustains glutamine oxidative flux in mtDNA mutant cells.

Mass isotopologue analysis of intracellular (A) and extracellular (B) lactate and intracellular (C) and extracellular (D) alanine in WT and A6MT cells cultured for 2, 4 h (intracellular), and 24 h (extracellular) with [U-13C] glutamine. (E) Schematic representation of the oxidative gln-glu-αKG influx followed by the cataplerotic aspartate efflux and cytosolic conversion (red arrows). Filled red circles represent 13C atoms derived from [U-13C] glutamine. OAA, oxaloacetate; sucl-CoA, succinyl- CoA; AGC, aspartate-glutamate carrier. Mass isotopologue analysis of malate (F), aspartate (G), citrate (H), and aconitate (I) in WT and heteroplasmic COXI 50%MT cells cultured for 4 h with [U-13C] glutamine. Intracellular (J) and extracellular (K) alanine in WT and heteroplasmic COXI 50%MT cells cultured for 4 h (intracellular) and 24 h (extracellular) with [U-13C] glutamine.
In A-D and F-K, data are presented as average ± S.D., n=6 independent cultures. *, p<0.05; #, p<0.05, MT vs. WT at the same time point.
In agreement with a modest reductive flux of glutamine, 13C-incorporation into citrate-derived acetyl-CoA (M+2, Fig. 3A right panel) for phospholipids synthesis was detected, but markedly delayed relative to other [13C]-glutamine fates, and barely detected at 4 h. However, it became detectable and was slightly increased in mutant vs. WT cells (Fig. S5D, S5E, S5F) at 24 h. Similarly, the pyrimidine nucleotide sugar UDP-N-acetyl-glucosamine showed higher incorporation of citrate-derived acetyl-CoA (M+2) at 24 h (Fig. S5C). These results demonstrate that glutamine reductive carboxylation in A6MT cells contributes directly to acetylation and lipid synthesis.
Rewiring of glutamine metabolism was also evaluated in heteroplasmic COXI 50%MT cells. In this partially OXPHOS disabled cell line, malate and aspartate M+4 isotopologues were also increased at 4 h compared to WT (Fig. 4F, 4G), confirming that increased αKG oxidative flux occurs in these mtDNA mutant cells. Aspartate M+4 was more abundant than aspartate M+3, confirming that the oxidative metabolism of αKG predominates (Fig. 4G). And similar to A6MT cells, reductive carboxylation flux was also increased in COXI 50%MT cells compared to WT cells, reflected by a greater fractional incorporation of aspartate M+3, aconitate M+5, and citrate M+5 (Fig. 4G, 4I, 4H). Increased intracellular alanine M+3 at 4 h (Fig. 4J) and increased extracellular alanine M+3 at 24 h (Fig. 4K) confirmed that enhanced aspartate efflux and conversion to alanine also occurred in COXI 50%MT cells. Taken together, these results suggest that in cells with partial OXPHOS impairment, oxidative glutamine utilization predominates and could serve as an alternative energy-generating pathway.
The severity of the OXPHOS defect determines the prevalent direction of the gln-glu-αKG flux
In the clockwise (oxidative) TCA pathway, αKG conversion to aspartate is associated with generation of two NADH and one FADH2 that are subsequently oxidized by the RC for ATP production. To ascertain whether residual OXPHOS function is required for oxidative flux of αKG, we investigated two homoplasmic mtDNA mutant cell lines, COXI (COXI100) and cytochrome b (Cyb100, associated with parkinsonism/MELAS syndrome (De Coo et al., 1999)) that completely lack OXPHOS. Glutamate and αKG showed a greater M+5 incorporation at 4 h in COXI100 and Cyb100 mutants compared to WT, indicating faster conversion of glutamine to glutamate and glutamate to αKG (Fig. 5B, 5C). Citrate and aconitate also displayed prevalent M+5 incorporation (Fig. 5D, S5G) through reductive carboxylation of glutamine-derived αKG (Fig. 5A). Notably, in the αKG reductive carboxylation pathway, citrate M+5 is converted by the cytosolic enzyme ATP citrate lyase to OAA M+3 and to acetyl-CoA M+2, which is directed to fatty acids and lipid synthesis (Fig. 5A). OAA M+3 is then converted to aspartate M+3 (by reverse GOT1) and to malate M+3 (by MDH1). OAA-derived aspartate and malate were mostly M+3 (Fig. 5E, 5F), confirming a predominant reductive metabolism of αKG in COXI100 and Cyb100 mutants. Fumarate and succinate M+3, likely derived from cytosolic malate M+3, were also increased in COXI100 and Cyb100 mutants (Fig. S5H, 5G). Interestingly, succinate M+4 incorporation (oxidative metabolism) was prevalent and similar in WT and homoplasmic mutants (Fig. 5G). This result is in agreement with the finding that NADH generated by αKG oxidation to succinate is required for its reductive carboxylation by reverse isocitrate dehydrogenase (IDH2) activity (Mullen et al., 2014).
Figure 5. Anabolic glutamine reductive flux is prevalent in mutant cells with severe OXPHOS defect.

(A) Schematic representation of the reductive gln-glu-αKG influx followed by citrate efflux and cytosolic conversion (red arrows). Filled red circles represent 13C atoms derived from [U-13C] glutamine. OAA, oxaloacetate; sucl-CoA, succinyl-CoA. Mass isotopologue analysis of glutamate (B), αKG (C), citrate (D), aspartate (E), malate (F), succinate (G), phosphatidylglycerol, PG (H), and phosphatidylethanolamine, PE (I), in WT and homoplasmic COXI 100%MT (COXI100) and Cyb 100%MT (Cyb100) mutant cells cultured for 4 h with [U-13C] glutamine. n=6 independent cultures. *, p<0.05; #, p<0.05; ^, p<0.05, MT vs. WT. (J) Mass isotopologue analysis of aspartate in COXI mutant cell lines containing different proportions of COXI mutation and in the isogenic control (COXI 0%). n=6 independent cultures. *, p<0.05; #, p<0.05, M+4 vs. M+3 of aspartate in the same cell line.
In B-J, data are presented as average ± S.D.
[13C]-Glutamine incorporation into M+2, M+4, and M+6 of citrate-derived acetyl-CoA (M+2) units in phospholipids (phosphatidylglycerol, PG and phosphatidylethanolamine, PE) was abundant in the homoplasmic OXPHOS mutants, as early as 4 h (Fig. 5H, 5I). Accordingly, citrate-derived acetyl-CoA (M+2) incorporation in homoplasmic mutants was also markedly increased in N-acetyl-aspartate at 4 h (Fig. S5I). Furthermore, acetyl-CoA M+2 incorporation in N-acetyl-serine, and N-acetyl-methionine was increased at 24 h (Fig. S5J, S5K). Reductive glutamine metabolism, mainly directed toward anabolic processes of acetylation and lipid biosynthesis, was prevalent in cells with complete OXPHOS impairment and independent of the specific OXPHOS defect. These results are in agreement with findings previously reported in Cyb100 cybrids, in cells treated with RC inhibitors, and in cells exposed to hypoxia (Fendt et al., 2013; Metallo et al., 2012; Mullen et al., 2012). Since heteroplasmic and homoplasmic COXI MT cells carry the same mtDNA mutation, differences in glutamine utilization (i.e., oxidative vs. reductive flux) must derive from the difference in bioenergetics (i.e., moderate vs. total cellular OXPHOS defect). To test this hypothesis, we investigated cybrids containing varying levels of mutated COXI gene and respiration (Fig. 5J) vs. their isogenic control cybrid cell line (COXI 0%). Aspartate isotopologue analysis in mutants with 86% and 46% residual mitochondrial respiration showed predominant M+4 (oxidative) incorporation. Mutant cells with 45% residual respiration showed an equal degree of M+3 (reductive) and M+4 (oxidative) incorporation and mutants with 13% residual respiration showed predominant M+3 incorporation. Therefore, our findings indicate that 45% respiration is the threshold below which reductive carboxylation flux in the TCA cycle predominates.
In summary, here we find that the directionality of glutamine metabolism in the TCA cycle is determined by the degree of OXPHOS impairment, with moderate defects favoring the energy-generating oxidative flux and severe/complete impairment favoring an anabolic reductive flux.
Key components of the glutamine anaplerosis pathway are upregulated in mtDNA mutant cells
To explore the molecular basis for increased glutamine flux in cells with moderate OXPHOS defects, we investigated transcriptional and protein level regulation of key steps in glutamine anaplerosis (Fig. 6A).
Figure 6. Key components of the glutamine anaplerosis pathways are upregulated in mtDNA mutant cells.

(A) Schematic representation of the transporter and enzymatic network controlling glutamine-derived αKG flux in osteosarcoma cells, based on transcript and protein analysis. Thick black arrows indicate the upregulated steps of glutamine flux found in A6MT. (B) Western blots of cell lysates separated by denaturing SDS–PAGE and probed for ASCT2, β-actin, GOT2, and TIM23 (top panel), GOT1 and β-actin (bottom panel). (C) Western blots of isolated mitochondria separated by denaturing SDS–PAGE and probed for GAC and TIM23. (D) Protein levels expressed as percentage of WT, estimated by band densitometry normalized by β-actin (cytosolic and plasma membrane proteins) and by TIM23 (mitochondrial proteins). (E) Western blot of native (untreated) and de-glycosylated (de-glycosyl) proteins separated by denaturing SDS–PAGE and probed for ASCT2 and β-actin. (F) Immunostaining of WT and A6MT cells with ASCT2 antibody. Immunofluorescence is concentrated at the plasma membrane and Golgi apparatus. (G) ASCT2 activity measured by 3H-glutamine uptake. (H) Western blot of cell lysates separated by denaturing SDS–PAGE and probed for OGDH, AGC1, and TIM23. (I) OGDH and AGC1 protein levels estimated by band densitometry normalized by TIM23, expressed as percentage of WT. Western blots of isolated mitochondria (J) and cell lysates (L), obtained after culturing the cells in glucose- and gal-DMEM for 24 h, separated by denaturing SDS–PAGE and probed for antibodies of interest. GAC (K) and GOT1 (M) levels expressed as percentage of WT in glucose-DMEM, estimated by band densitometry normalized by TIM23 (GAC) and β-actin (GOT1).
In D, G, I, K, and M, data are presented as average ± S.D., n=3 independent cultures. *, p<0.05 MT vs. WT; #, p<0.05.
First, we assessed the potential contribution of the neutral amino acid transporter ASCT2, which plays a pivotal role in glutamine uptake in rapidly proliferating cells (Fuchs and Bode, 2005; McGivan and Bungard, 2007). We found that ASCT2 mRNA levels are significantly increased (83%) in A6MT cells relative to WT (Fig. S6A). Since glutamine is also taken up by the sodium-coupled neutral amino acid family of transporters (SNAT), we assessed transcript expression levels for system A (SNAT1, SNAT2) and system N (SNAT3 and SNAT5) transporters. SNAT1, SNAT2, and SNAT5 expression was undetectable, while SNAT3 expression exhibited no difference between mutant and WT cells (Fig. S6B). We also found that mRNA encoding the B0AT1 (system B0) transporter (McGivan and Bungard, 2007) was undetectable in cybrid cells. Therefore, we conclude that ASCT2 was the most likely candidate regulating glutamine uptake in A6MT cells.
We further investigated the potential contribution of ASCT2 to glutamine uptake in mtDNA mutant cells by Western blot analysis. Results demonstrated that ASCT2 protein was markedly increased in A6MT (Fig. 6B), approximately double that of WT (Fig. 6D) confirming that the observed increase in ASCT2 mRNA translates to increased protein abundance. Notably, ASCT2 protein migrated to a gel position of apparently greater mass (approximately 70KDa) than predicted from its inferred molecular weight (55 KDa). Previous studies reported a similar discrepancy between the observed and predicted molecular weight of ASCT2, and attributed it to protein glycosylation (Avissar et al., 2001; Marin et al., 2003; Utsunomiya-Tate et al., 1996). The migration of ASCT2 of A6MT cells was slower than WT cells, suggesting a more extensive degree of ASCT2 glycosylation in A6MT cells. To confirm ASCT2 glycosylation, the N-linked oligosaccharides were enzymatically removed with N-glycosidase F. As expected, the cleavage of all asparagine-linked oligosaccharides resulted in an increase in the ASCT2 band gel mobility to an equivalent extent in WT and A6MT cell extracts (Fig. 6E). After ASCT2 deglycosylation, ASCT2 band intensity was stronger in A6MT cells than in WT, confirming increased protein content in A6MT cells. We also assessed the intracellular distribution of ASCT2 by immunostaining. As expected, A6MT cells showed a stronger immunostaining in the plasma membrane region and in the Golgi apparatus (Fig. 6F, S6C), where glycosylation takes place. Increased levels of ASCT2 on the plasma membrane was in agreement with the 50% increase in glutamine uptake in A6MT cells compared to WT (Fig. 1D). Furthermore, we confirmed that the relative activity of ASCT2 was increased in A6MT and COXI 50%MT cells by evaluating the cellular uptake of 3H-glutamine (Fig. 6G, S6D), suggesting that ASC2 upregulation of glutamine uptake is a common feature of mtDNA mutant cells with partial OXPHOS defects, independent of the OXPHOS complex affected.
We next tested the differences between A6MT and WT cells in mRNAs encoding enzymes involved in the gln-glu-αKG pathway (Fig. 6A). Glutamine enters mitochondria and is deaminated to glutamate by glutaminase (GLS). The only GLS isoform transcript detected was the one encoding a splice variant of kidney GLS, known as phosphate-activated GLS (GAC) (de la Rosa et al., 2009; Elgadi et al., 1999; Kita et al., 2007). Although GAC mRNA was slightly decreased in A6MT relative to WT cells (Fig. S6A), GAC protein levels were significantly greater (49% increased) in A6MT cells (Fig. 6C, 6D).
We also assessed relative levels of transcripts encoding both mitochondrial (GOT2) and cytosolic (GOT1) forms of glutamate-oxaloacetate transaminase. GOT1 mRNA was significantly increased (30%) in A6MT cells compared to WT, while no differences were detected in GOT2 mRNA levels (Fig. S6A). In agreement with the mRNA, protein levels of GOT1 were also significantly increased in A6MT cells compared to WT (95% increase, Fig. 6B, 6D), whereas no difference was found in GOT2 protein levels (Fig. 6B, 6D).
Glutamine-derived aspartate exits mitochondria in exchange with glutamate, through the aspartate-glutamate carrier (AGC). We found that AGC1 was upregulated (46% increased) in A6MT compared to WT (Fig. 6H, 6I). In addition, the mRNA and protein levels of OGDH, the E1 component of the αKG dehydrogenase complex, were significantly upregulated in A6MT compared to WT cells (103%, Fig. S6A and 73%, Fig. 6H, 6I).
Taken together, these findings established that the key components of the glutamine utilization pathway that are responsible for glutamine uptake, conversion to glutamate and αKG, oxidation of αKG, and conversion to aspartate for cytosolic efflux, were all upregulated in mtDNA mutant cells with partial OXPHOS defects.
Next, we investigated if key components of the glutamine utilization pathway were differentially regulated in non-glycolytic conditions, in gal-DMEM. Under this imposed obligatory oxidative condition, A6MT cells were unable to actively utilize glutamine for energy purposes, resulting in cell proliferation arrest (Fig. 1E). Levels of ASCT2 were lower in both WT and A6MT cells cultured in gal-DMEM compared to glucose-DMEM (50% and 60% decrease, respectively, Fig. S6E, S6F). However, since the rate of extracellular glutamine consumption in gal-DMEM was greater in the A6MT cell line, compared to WT (Fig. 1F), results suggest that glutamine uptake was not rate-limiting for A6MT glutamine utilization. Since supplementation of glutamate and αKG could restore A6MT proliferation under oxidative growth conditions (Fig. 1E), we investigated if levels of GAC were limiting for glutamine utilization. We found that GAC protein levels in gal-DMEM grown A6MT cells were not significantly different from WT (Fig. 6J, 6K). Therefore, it is possible that GAC activity, rather than GAC protein abundance, could be limiting for glutamine flux under oxidative conditions. Interestingly, cytosolic GOT1 protein was significantly increased in both WT and A6MT cells in gal-DMEM compared to glucose-DMEM (Fig. 6L, 6M), suggesting that pathways of glutamine utilization downstream of GAC were activated and may underlie the increased cell growth when glutamate and DMK anaplerosis are boosted.
Glutamate metabolism is altered in a mouse model of mitochondrial myopathy
Muscle is the main glutamine producing tissue in mammals. Notably, decreased levels of plasma glutamine and increased glutamine demand, stimulate myofibrillar protein degradation for de novo release of glutamine (Curthoys and Watford, 1995; Wagenmakers, 1998b). During this net protein breakdown, amino acids are metabolized through aminotransferases to precursors of the TCA cycle intermediates, including glutamate that can be converted to glutamine by glutamine synthetase (GS) (Wagenmakers, 1998b).
To test the effects of OXPHOS deficiency on glutamate/glutamine metabolism in vivo, we studied the heme A: farnesyltransferase (COX10) muscle-specific KO mouse (COX10 KO) (Diaz et al., 2005). In this mouse, CRE recombinase is expressed under the control of the myosin light chain 1F promoter, and causes a severe cytochrome c oxidase deficiency selectively in skeletal muscle (90% decrease in COX activity, Table S3), which results in progressive mitochondrial myopathy characterized by muscle weakness (Fig. S6G) and weight loss (Fig. S6H).
Unbiased metabolomics was utilized to identify differences in the levels of intramuscular metabolites in COX10 KO male mice at the fully symptomatic stage of myopathy (150 days of age), compared to age- and gender-matched littermate controls (CTL). Heatmap analyses of metabolites (Fig. S7A) showed that among more than 100 significant differentially-abundant features, several amino acids involved in the glutamate-glutamine metabolism and one carbon metabolism pathways were observed (Fig. 7A, 7B, 7C, S7C). Interestingly, changes in the levels of amino acids from the one-carbon pathway were previously reported in muscle from a mouse mutated in the mtDNA helicase Twinkle (Deletor mouse (Nikkanen et al., 2016)). However, despite a similar increase in glycine, there were several major differences between the two murine models. For example, serine was decreased in COX10 KO muscle and increased in the Deletor muscle. These differences likely reflect the different pathogenic mechanisms in the two mice.
Figure 7. Glutamate metabolism is altered in the COX10 KO mouse.

Levels of glutamate (A) alanine (B), and glutamine (C) by LC-MS analysis in calf muscle of COX10 KO and CTL mice and COX10 KO and CTL mice treated with DMK (COX10 KO+DMK and CTL+DMK). n=6 mice per group. #, p<0.05. (D) Schematic representation of proposed amino acid metabolism in COX10 KO muscle. Thick blue arrows indicate upregulated pathways of glutamate anaplerosis coupled to aspartate cataplerosis and alanine production and release. The dashed arrows indicate downregulation of glutamine synthetase (GS). The red arrows indicate increased synthesis and release of alanine. Gln, glutamine; glu, glutamate; ala, alanine; asp, aspartate; BCAA, branched-chain amino acids (leucine, isoleucine, and valine); αKA, α-ketoacids; S-CoA, succinyl-CoA; OAA, oxaloacetate; pyr, pyruvate. Western blots of calf muscle homogenate separated by denaturing SDS–PAGE and probed for ALT1, AGC1 (E), ALT2 (F), OGDH (G), GOT1 (H), and GOT2 (I). (J) Protein levels expressed as percentage of CTL, estimated by band densitometry normalized by GAPDH. n=8 mice per group. *, p<0.05 COX10 KO vs. CTL. (K) Western blots of calf muscle homogenate separated by denaturing SDS–PAGE and probed for GS. (L) Protein levels expressed as percentage of CTL, estimated by band densitometry normalized by α-actin. n=12 mice per group. *, p<0.05 COX10 KO vs. CTL. (M) Western blot of calf muscle homogenate separated by denaturing SDS–PAGE and probed for p-ULK1ser757, p-AMPK, AMPK, and α-actin. (N) Protein levels expressed as percentage of CTL, estimated by band densitometry normalized by α-actin (p-ULK1) and by AMPK (p-AMPK). n=7 mice per group. *, p<0.05 COX10 KO vs. CTL. Western blots of calf muscle homogenate separated by denaturing SDS–PAGE and probed for LC3B (O) and p62 (P). (Q) Protein levels expressed as percentage of CTL, estimated by band densitometry normalized by GAPDH. n=8 mice per group. *, p<0.05 COX10 KO vs. CTL.
In A-C, data are presented as average ± S.E.M. In J, L, N, and Q, data are presented as average ± S.D.
In muscle, the pool of intracellular free amino acids is contributed predominantly by only three species: glutamine, glutamate, and alanine, which represent 79% of total amino acids (Bergstrom et al., 1974). Interestingly, glutamate and alanine were significantly increased in COX10 KO vs. CTL muscle, while glutamine levels were unchanged (Fig 7A, 7B, 7C). Glutamate, alanine, and glutamine were unchanged in heart and liver of the same COX10 KO mice (Fig. S7B), in accord with these tissues being unaffected by the COX10 deletion.
Increased levels of free lysine, leucine, isoleucine, asparagine, and aspartate (Fig. S7C), which are among the most abundant amino acids in skeletal muscle proteins (Dai et al., 2014), suggested enhanced protein breakdown in COX10 KO myofibers. Arginine and ornithine, glutamate-derivatives through the P5CS- and OAT-mediated enzymatic reactions (Fig. S4A) were also increased (Fig. S7C). Together, these results indicate a negative net muscle protein balance and upregulated glutamate metabolism in COX10 KO muscle.
In skeletal muscle, transamination by ALT of glucose-derived pyruvate and glutamate produces alanine and αKG, respectively (Fig. 7D). The resulting alanine is released into the circulation, where it becomes available for liver gluconeogenesis via the glucose-alanine Cahill cycle (Wagenmakers, 1998a). Interestingly, plasma levels of alanine were increased by 50% in COX10 KO mice (Fig. S7D), while no other amino acids changes were detected. Since the direction of the reversible ALT is controlled by substrate levels, increased glutamate levels combined with increased alanine excretion from muscle would favor alanine and αKG production. We hypothesized that in OXPHOS defective muscle glutamate provides αKG for substrate level ATP production via TCA cycle-mediated oxidative metabolism. To test this hypothesis, we investigated if stimulating αKG anaplerosis could improve the myopathy in COX10 KO mice and decrease the glutamate transamination to alanine. COX10 KO and CTL mice were subcutaneously injected with DMK (250 mg/Kg) three times per week from 30 to 150 days of age. A small but consistent improvement of grip strength was observed in COX10 KO mice throughout the duration of the treatment (Fig. S6G). Since the treatment had no effect on body weight (Fig. S6H), the DMK effect likely results from metabolic changes, rather than via increased muscle mass. Interestingly, muscle levels of glutamate and alanine were normalized by DMK treatment of COX10 KO mice, but unchanged in DMK-treated CTL mice (Fig. 7A, 7B). This suggests that stimulation of αKG anaplerosis in COX10 KO mice provides a source of ATP and simultaneously opposes glutamate and alanine accumulation. DMK treatment also decreased the levels of valine, leucine, isoleucine, and asparagine (Fig. S7C), suggesting that DMK reversed the imbalance of glutamate metabolism in COX10 KO muscle. In contrast, DMK had no effect on the acyl-carnitine levels (Fig. S7E) or amino acids of the one carbon metabolism pathway (Fig. S7C), indicating that impairment of neither beta-oxidation nor one carbon trafficking is improved by αKG anaplerosis in skeletal muscle.
Next, we investigated if regulation of key enzymes of the glutamate anaplerotic pathway supported our interpretation of metabolomic data in skeletal muscle. We found increased levels of mitochondrial (ALT2; 231%) and cytosolic (ALT1; 335%) alanine aminotransferase (Fig. 7E, 7F, 7J) in COX10 KO muscle, consistent with the hypothesis that alanine and αKG metabolism are accelerated. Furthermore, OGDH levels were increased (96%, Fig. 7G, 7J), suggesting that oxidation of αKG is upregulated in COX10 KO muscle. We also found increased GOT2 (130%), AGC1 (66%), and GOT1 (97%) in COX10 KO muscle (Fig. 7I, 7E, 7H, 7J), suggesting that αKG-derived OAA exits the TCA cycle and is transaminated and transported as aspartate into the cytosol, similarly to mtDNA mutant cells in culture (Fig. 4E, 7D). Furthermore, glutamine synthetase (GS) was decreased in COX10 KO muscle vs. CTL (40%, Fig. 7K, 7L), which could explain why increased glutamate did not result in increased levels of glutamine.
Notably, the levels of OGDH, ALT1, ALT2, GOT1, and GOT2 were unchanged in muscle of COX10 KO mice at 50 days of age (Fig. S7F), an early stage of myopathy, indicating that changes in the expression of these enzymes were dependent on the stage of disease progression.
Since the alterations in metabolite and enzyme profiles in COX10 KO muscle suggested increased net muscle protein breakdown, we investigated the molecular pathways controlling autophagy, a process utilized by skeletal muscle to deliver proteins to lysosomes for amino acid recycling (Neel et al., 2013). Autophagy in muscle is known to be mediated by AMP-activated protein kinase (AMPK), which is activated by phosphorylation (p-AMPK) in response to relatively low cellular energy levels (Kjobsted et al., 2017). mTOR, a major sensor of extracellular nutrient levels (i.e., amino acids and growth factors) is an inhibitor of autophagy in muscle. Notably, active mTORC1 phosphorylates ULK1 at ser757, disrupting ULK1 interaction with AMPK and thereby inhibiting AMPK activity (Kim et al., 2011). Light chain 3 II (LC3 II), a protein that coats the surface of autophagosomes, is a marker of starvation-induced autophagic activity in muscle (Neel et al., 2013) and p62, an adaptor protein for LC3, accumulates in sarcopenic mice muscle (Sakuma et al., 2016). In COX10 KO muscle, we observed an increase in the levels of p-AMPK (190%, Fig. 7M, 7N), LC3 II (115%, Fig. 7O, 7Q) and p62 (52%, Fig. 7P, 7Q), concomitant with decreased levels of ser757 phosphorylated ULK1 (54%, Fig. 7M, 7N). Together, these findings indicate that muscle autophagy is upregulated in COX10 KO, providing a potential source of glutamate to fuel ATP synthesis by the oxidative TCA cycle.
DISCUSSION
Intracellular glutamine homeostasis is controlled by complex mechanisms. First, glutamine transporters, GSL, and GS are subject to both transcriptional and post-transcriptional regulation (Curthoys and Watford, 1995; Palmada et al., 2005). Second, the regulation of glutamine metabolism is cell-type and tissue specific; examples are the perivenous and periportal hepatocytes involved in glutamine synthesis and degradation, respectively (Haussinger, 1986), the “glutamine-glutamate” cycle between astrocytes and neurons (Albrecht et al., 2007), and the interplay between muscle and kidney in glutamine synthesis and catabolism in response to metabolic acidosis (Taylor and Curthoys, 2004).
Specialization of glutamine metabolism is also found in cancer, where it supplies carbon and nitrogen for cell proliferation (Wise and Thompson, 2010). Because biosynthetic precursors and ATP derive from glucose and glutamine, their usage must be coordinated (Metallo and Vander Heiden, 2010).
The glutamine-glutamate influx into mitochondria delivers αKG to the TCA cycle for the generation of high-energy molecules (NADH and FADH2). The oxidation of αKG is also an OXPHOS-independent energy-generating pathway, because the conversion of succinyl-CoA to succinate is coupled to the formation of ATP and/or GTP through substrate-level phosphorylation by succinyl-CoA ligase (Fig. 4E). Thus, glutamine-derived αKG oxidative flux offers a potentially significant source of ATP in mtDNA mutant cells.
Since pyruvate is preferentially converted to lactate in OXPHOS defective cells, little acetyl-CoA is available to condensate with the OAA derived from glutamine anaplerosis. Consequently, for glutamine anaplerosis via the TCA cycle in mtDNA mutant cells with partial OXPHOS defect, efficient elimination of OAA is necessary to avoid feedback inhibition of the cycle. Results from stable isotope tracing analysis and our finding of upregulated GOT1 and AGC1 strongly suggest that increased glutamine anaplerosis is coupled with the mitochondrial transamination of OAA to aspartate, followed by efflux of aspartate from mitochondria (through AGC1), and re-conversion to OAA in cytosol (by GOT1). Based on this model, aspartate cataplerosis and low aspartate levels would predictably be critical for maintenance of the αKG oxidative flux (Fig. 4E). Aspartate-derived cytosolic OAA is converted to malate and NAD+ and then to pyruvate and NADPH (Fig. 4E). Pyruvate is then converted predominantly to alanine, which is excreted from cells to avoid accumulation. Overall, this pathway allows for the generation of mitochondrial ATP and results in increased cytosolic levels of NAD+ and NADPH that serve to sustain glycolysis, oppose oxidative stress and prevent TCA cycle rundown. A similar mechanism has been shown to maintain the cellular redox state in pancreatic cancer cells (Son et al., 2013).
Increased glutamine anaplerosis is a common feature of all mtDNA mutant lines, but we show here for the first time that the metabolic fate of αKG (predominantly oxidative vs. reductive) depends on the severity of OXPHOS impairment. Reductive carboxylation predominates only when the respiration is severely compromised (more than 55% inhibition). In cells with moderate OXPHOS defects, increased glutamine-derived αKG flux is utilized by the TCA cycle in a bidirectional manner, but predominantly through the oxidative pathway. In these cells, the smaller αKG reductive flux is directed to citrate for acetylation and synthesis of lipids, possibly as a compensatory mechanism for the limited citrate generation from pyruvate-derived acetyl CoA. Instead, in cells with severe OXPHOS impairment, NADH consumption by mitochondria is precluded and reductive carboxylation of αKG predominates.
As a result of the different pathways of αKG utilization, the role of aspartate differs between cells with severe and moderate OXPHOS defects. In cells with severe OXPHOS defects, supplementation with aspartate improves cell proliferation, as previously reported (Birsoy et al., 2015; Sullivan et al., 2015). In these cells, aspartate is generated from OAA through reverse reaction of GOT1 (Fig 5A). However, since part of OAA is also converted to malate, limited aspartate availability impairs nucleotide synthesis and cell proliferation. Instead, in cells with moderate OXPHOS impairment, aspartate supplementation is not beneficial (Fig. S2D), because increased aspartate inhibits αKG utilization. Rather, these cells benefit from metabolites that stimulate glutamate anaplerosis, since supplementation with glutamate or DMK improves ATP production and cell viability.
When cells with moderate OXPHOS defects are cultured in regular glucose-DMEM, we observed that intracellular levels of glutamate are indistinguishable from WT, until extracellular glutamine availability becomes limiting. This suggests that in mtDNA mutant cells glutamate homeostasis is maintained at the expenses of glutamine through glutaminase activity. Since in gal-DMEM the growth of OXPHOS defective cells could be rescued by glutamate or αKG supplementation, but not by addition of glutamine, we infer that GAC activity is limiting for glutamine anaplerosis. GAC is a splice variant of the kidney GLS1, which is activated during metabolic acidosis to increase glutamine catabolism and ammonia release in the proximal convoluted tubules (Curthoys and Watford, 1995). Therefore, it is possible that GAC is stimulated by medium acidification that occurs in glucose-DMEM due to lactate production, but not in gal-DMEM. The effect of local pH could be relevant for understanding the role of glutaminase in cancer and cancer therapy (Chen and Cui, 2015).
Altered glutamine metabolism could play a fundamental role in mitochondrial diseases. Increased glutamine anaplerosis in mtDNA mutant cells would predictably results in an imbalance of glutamine-derived metabolites involved in non-anaplerotic pathways, such as GSH, citrulline, ornithine, and proline with potential adverse consequences for cellular redox and ammonia detoxification (Fig. 2D). Interestingly, low circulating citrulline was reported in plasma from patients with mitochondrial diseases, such as NARP/MILS (Debray et al., 2010; Parfait et al., 1999; Rabier et al., 1998) and MELAS (mitochondrial encephalomyopathy, lactic acidosis, and stroke-like episodes, (Naini et al., 2005)). Furthermore, in MELAS, supplementation with citrulline was proposed as an approach to increase nitric oxide synthesis and improve brain perfusion (El-Hattab et al., 2015). We speculate that alterations of these metabolites in mitochondrial patients could be explained by altered glutamine metabolism in the glutamine-utilizing tissues, such as small intestine and liver.
In enterocytes, dietary and circulating glutamine is the principal metabolic fuel of oxidative metabolism, but is also converted to citrulline, which is released into the blood stream. Most of the circulating citrulline derives from glutamine conversion in enterocytes (Curis et al., 2005; Wu, 1998). Citrulline is taken up by the kidney and converted to arginine, which is then released into the circulation (Brosnan and Brosnan, 2004) as a substrate for NO production by immune, neural, and endothelial cells (Wu et al., 2009). Citrulline-derived arginine is also utilized by hepatocytes to capture ammonia in the setting of hyperammonemia (Newsholme et al., 2003). Therefore, perturbed glutamine metabolism can cause unbalanced ammonia and pH homeostasis, and altered levels of circulating citrulline and arginine. Interestingly, lactic acidosis, hypocitrullinemia, and impaired immune responses are all typical symptoms of patients with mitochondrial mtDNA mutations (Debray et al., 2010; Edmonds et al., 2002; El-Hattab et al., 2015; Longo, 2003), suggesting that altered glutamine metabolism may be an important contributor to mitochondrial disease pathogenesis.
Given the prominent role of muscle in maintaining glutamine homeostasis, we investigated glutamine metabolism in a muscle-specific in vivo model of OXPHOS dysfunction, the muscle COX10 KO mouse. Our results suggest that COX10 KO muscle uses glutamate-derived αKG and amino acid-derived ketoacids for energetic purposes, thereby driving muscle protein breakdown. Overall, this interpretation is supported by the following findings: (1) elevated muscle levels of free glutamate and amino acids (lysine, leucine, isoleucine, asparagine) which are main constituents of skeletal muscle proteins; (2) increased levels of plasma alanine, and (3) upregulation of key anaplerotic enzymes and autophagy markers in muscle. In cell culture and in vivo model systems of mitochondrial diseases, increased anaplerosis appears to be a common mechanism, driven by glutamine and amino acids, respectively. Increased alanine output, observed in both mtDNA mutant cells and in the COX10 KO mouse, could be attributed to the need to safely dispose of excess amino groups, preventing toxic buildup of ammonia.
Interestingly, increased alanine release has been previously reported in the culture media of OXPHOS defective differentiated myotubes (Shaham et al., 2010) and elevated plasma alanine is considered a biomarker of mitochondrial disease in pediatric patients (Morava et al., 2006; Shatla et al., 2014). Therefore, our findings in COX10 KO mice could be directly relevant to patients, in whom chronic muscle proteins breakdown is accompanied by increased alanine output. This process could mimic a starvation response and contribute to exercise intolerance and muscle weakness. In agreement with this hypothesis, studies in a different mouse model of mitochondrial myopathy have reported the activation of a starvation-like response (Tyynismaa et al., 2010). However, in the typical muscle response to starvation, increased proteolysis and amino acids catabolism serve to boost the synthesis and release of glutamine, resulting in increased plasma glutamine for utilization by organs, facilitating kidney and liver gluconeogenesis (Blackshear et al., 1975; Marliss et al., 1971; Tan et al., 2017). Instead, muscle-specific COX10 KO mice do not lack systemic nutrients; rather, they use amino acids catabolism to drive anaplerosis, which results in increased production and release of pyruvate-derived alanine, while plasma glutamine levels are unchanged.
In patients with OXPHOS defects, metabolic acidosis caused by overproduction of lactic acid can result in irreversible coma and death (Danhauser et al., 2015). Based on our findings, we suggest that this occurrence could be due to the rewiring of muscle amino acid metabolism that prevents adequate buffering of acidosis. In fact, during metabolic acidosis normally the kidney increases glutamine uptake, ammoniogenesis, and gluconeogenesis to enhance acid and ammonium excretion and the production of bicarbonate. This increased extraction of glutamine by the kidney is balanced by an increased release from muscle (Taylor and Curthoys, 2004). However, in OXPHOS defective patients, rewired muscle glutamate metabolism for anaplerosis can potentially prevent this compensation, leading to uncontrolled acidosis.
In the scenario of muscle metabolic rewiring, a compound utilized for anaplerotic energy generation downstream of glutamine offers a rational therapeutic approach. In a proof of concept experiment, we show that supplementation with DMK, a membrane permeable analogue of αKG, improves strength and metabolites homeostasis in COX10 KO muscle. While strategies for delivery and dosing of DMK and/or related αKG precursors will require development and optimization, our results suggest that supplementation of anaplerotic substrates offers a potential therapeutic approach for mitochondriopathies.
Limitations of the study
One limitation of this study is that it utilizes cybrids lines as cellular models of mtDNA diseases. This model is appropriate for investigating the influence of mtDNA mutations on bioenergetics and metabolism. However, because of their highly proliferative nature, cybrid lines derived from cancer cells may not fully recapitulate the metabolic regulations of post mitotic tissues, such as skeletal muscle. This limitation must be taken into account when interpreting the results and determining therapeutic strategies.
STAR METHODS
CONTACT FOR REAGENT AND RESOURCE SHARING
Further information and requests for resources and reagents should be directed to and will be fulfilled by the Lead Contact, Marilena D’Aurelio (mad2003@med.cornell.edu).
EXPERIMENTAL MODEL AND SUBJECT DETAILS
Cell lines
Cybrid cell lines were derived from human 143B osteosarcoma or HeLa cell lines depleted of mtDNA and repopulated with patient-derived human mtDNA.
Mouse model
Homozygous COX10Flx mice used to generate the muscle specific COX10 KO mice were a generous gift from Dr. Carlos Moraes (University of Miami). The phenotype of these mice has been described previously (Diaz et al., 2005). Only male mice were utilized for our experiments and data analysis. All animal procedures were conducted in accordance with protocols approved by the Cornell University Research Animals Resource Center (RARC).
METHOD DETAILS
Cell culture
Cybrid cells were cultured in Dulbecco Modified Eagle’s Medium (DMEM, Thermo Fisher Scientific) containing 4.5 mg/ml glucose, 1 mM pyruvate, 4 mM glutamine, and supplemented with 5% fetal bovine serum (FBS, Atlanta Biologicals) and 50 μg/ml uridine (Sigma). Cells were maintained at 37°C and 5% CO2.
Growth rates in glucose or galactose were determined by seeding 0.2×10⁶ cells in six-well plates in triplicates in DMEM or in DMEM without glucose containing 4.5 mg/ml galactose. Adherent cells growing in log phase were washed two times with 1 ml phosphate buffered saline (PBS), trypsinized, and counted using Coulter Z1 automated cell counter. Proliferation rates were calculated using the following formula: Proliferation Rate (Doublings per day) = log2 (Final cell count (day n)/Initial cell count (day 0))/n (days).
mtDNA mutation analysis
Total DNA was extracted from exponentially growing cells by standard techniques. PCR/RFLP analysis was performed to detect the mtDNA G6930A mutation and to quantify the proportion of mutated mtDNA as described elsewhere (D’Aurelio et al., 2001). Briefly, amplified mtDNA fragments digested with Alu I were separated on a 12% polyacrylamide gel and quantified with ChemiDoc Touch Imaging System (BioRad) using the Image Labsoftware (BioRad).
mRNA and protein analysis
Transcripts levels were quantified by RT-qPCR. Specific primers were designed with primer-BLAST (Table S4). mRNA extracted from cells (RNAqueous-4PCR kit, Ambion), was transcribed to cDNA (ImProm II reverse transcriptase system, Promega) PCR amplified (LightCycler Fast Start DNA Master SYBR Green I, Roche) and quantified (Livak and Schmittgen, 2001). The ribosomal protein L32 was the internal control mRNAs used to normalize the levels of the transcripts of interest since this mRNA is unlikely to be regulated by metabolic changes (Thellin et al., 1999). Analyses of the relative gene expression levels were performed using the 2−ΔΔCT method (Livak and Schmittgen, 2001).
Protein levels and post-translational modifications were investigated by Western blot using specific antibodies against the proteins of interest (anti-hASCT2, Millipore; anti-GOT1, anti-GOT2, anti-GAC, anti-OGDH, anti-ALT1, anti-ALT2, anti-GAPDH, Proteintech; anti-β-actin, anti-LC3B, Sigma-Aldrich; anti-p62, Abnova; anti-GS, anti-TIM23, BD Transduction Laboratories; anti-AGC1, anti-AMPK, anti-phospho-AMPK, anti-pULK1s757, Cell Signaling; anti-α-actin, abcam). ASCT2 glycosylation was evaluated with the Glycoprotein Deglycosylation Kit (Calbiochem/Millipore), as described in the manufacturer’s data sheet, with the addition of protease inhibitors (protease inhibitors cocktail, Roche). Deglycosylation of native proteins was performed for 24 h at 37°C with the five deglycosylation enzymes included in the kit, followed by protein detection by Western blot. Western blots were detected using a Licor Odyssey system, and Image Studio software was used for protein quantification. Mitochondrial and cytosolic proteins from cell lysates were normalized by TIM23 and β-actin respectively. In mouse muscle homogenates, GAPDH was used to normalize proteins, α-actin for GS, and AMPK for p-AMPK.
Isolation of mitochondria from cells
Enriched mitochondrial fractions were prepared from cells to investigate GAC protein levels by Western blot and avoid the detection of non-specific bands observed in Western blot of cell lysates samples. Briefly, cells were harvested and homogenized in mannitol-sucrose buffer (225 mM mannitol, 75 mM sucrose, 5 mM HEPES, 1 mM EGTA, 1 mg/mL fatty-acid free BSA, pH 7.4), and centrifuged at 4°C at 800 rcf for 5 minutes. Supernatants were centrifuged at 10,000 rcf for 10 minutes, and pellets washed in BSA-free mannitol-sucrose buffer and then resuspended in mannitol-sucrose buffer. Protein concentrations were quantified using the DC protein assay kit (Bio-Rad).
Measurements of bioenergetics parameters
A6MT cells were grown for 24 h in gal-DMEM or in gal-DMEM supplemented with 6 mM DMK. Cells were collected by trypsinization, pelleted by centrifugation, and resuspended in the same culture medium. Cell suspension was transferred in an Oxygraph chamber equipped with Clark-type electrode (Hansatech) where oxygen consumption was measured at 37°C as described (D’Aurelio et al., 2001). Alternatively, oxygen consumption was measured in cybrids with various proportion of COXI mutation, as described above, in DMEM without glucose containing 1 mM pyruvate and 4 mM glutamine. Alternatively, oxygen consumption was measured in A6MT and WT digitonin-permeabilized cells using 6 mM pyruvate or 6 mM αKG as substrates, 200 nmoles ADP (0.7 mM) for rapid state 3 respiration, and 1 mM KCN as terminal inhibitor, as described (Hofhaus et al., 1996).
ATP content was measured using an Enliten ATP assay system (Promega), according to the manufacturer’s instructions.
The activity of complex IV was measured in isolated tissue mitochondria as described previously (D’Aurelio et al., 2010).
DMK supplementation in vivo
COX10 KO and CTL mice were treated with PBS or DMK (250 mg/Kg) three times per week from 30 to 150 days of age via subcutaneous injections. DMK (Sigma-Aldrich, Cat#349631) was diluted in PBS (25 μg/μl) freshly before injections.
Muscle strength
Muscle strength was assayed by grip test to assess the onset and progression of the mitochondrial myopathy. A computerized grip-strength meter (Columbus Instruments) was used to measure forelimb grip strength. The test was repeated 3 consecutive times with 15 min intervals within the same session and the average value was recorded (Meyer et al., 1979).
Metabolites quantification
Amino acids analysis was performed by HPLC after pre-column derivatization with o-phthaldialdehyde (OPA) as previously described (Wu and Meininger, 2008) with an analytical column (C18; 4.6mm × 15cm, 3μm, Sigma) and a guard column (C18; 4.6mm × 5cm, 15μm, Waters). The amino acids were simultaneously separated and quantified in the same chromatogram.
Lactate analysis was performed using the Waters 2489 HPLC-UV/VIS system equipped with C-18 reverse-phase analytical column (YMC, Triart, 250×3.0mm I.D., particle size 3μm, 12nm), equipped with Phenomenex Secuirity guard column (cartridge C18, 4×2mm, PN# AJ0-4286). The mobile phase was 20 mM K2PO4 (pH 2.9), the flow rate was 0.45 ml/min, and the detection was at 210 nm. The samples were extracted in ice-cold 10% perchloric acid (PCA) and lactate separated and quantified.
Glutamine uptake assay
0.1×10⁶ cells were seeded in 24 well plates 24 h before the experiment. Cells were incubated in medium containing radiolabeled 3H-glutamine (0.1 μM) and cold glutamine (50 μM) or background medium containing 3H-glutamine (0.1 μM) and glutamine (10 mM), for 10 min at 37°C and 5% CO2. Cell lysates were analyzed by liquid scintillation using a scintillation counter and the background medium counts were subtracted. Cpm values were normalized by μg of protein.
Immunocytochemistry
For immunocytochemistry the following primary antibodies were used: anti-hASCT2 (Santa Cruz Biotechnology) and anti-GM130 (BD Transduction Laboratories), followed by appropriate fluorescently labeled secondary antibodies (Jackson ImmunoResearch).
Metabolomics
Metabolomics was performed by LC-MS analysis essentially as described previously (Chen et al., 2012; Ismailoglu et al., 2014), using a platform comprised of an Agilent Model 1200 liquid chromatography system coupled to an Agilent Model 6230 time-of-flight MS analyzer.
Metabolite extraction protocol
mtDNA mutant and WT cells were plated in 6 well plates, 0.2×10⁶ per well, six replicas per cell line, and metabolites extracted after 72 h using 80% methanol. Cells were quickly washed twice with ice-cold PBS, followed by metabolite extraction using −70°C 80:20 methanol:water (LC-MS grade methanol, Fisher Scientific). The cell-methanol mixture was subjected to bead-beating for 45 sec using a Tissuelyser cell disrupter (Qiagen). Extracts were centrifuged for 5 min at 5000 rpm to pellet insoluble material and supernatants were transferred to clean tubes. The extraction procedure was repeated two additional times and all three supernatants were pooled, dried in a speed-vac (Savant) and stored at −80°C until analysis. The methanol-insoluble protein pellet was solubilized in 0.2M NaOH at 95°C for 20 min and quantified using the BioRad DC assay. On the day of metabolite analysis, dried cell extracts were reconstituted in 70% acetonitrile at a relative protein concentration of 1μg/ml and 4ul of this reconstituted extract was injected for LC/MS-based untargeted metabolite profiling.
Muscle tissues were washed with PBS and subjected to 80% extraction as described above.
Plasma metabolites were extracted by adding 1-part of plasma to 20 parts (vol: vol) of 70% acetonitrile in ddH2O. The mixture was briefly vortexed and then centrifuged for 5 min at 16,000 × rcf to pellet precipitated proteins. An aliquot of the resulting extract (3 μl) was subjected to untargeted metabolite profiling using LC/MS and both positive and negative ion monitoring.
For measurements of extracellular glutamine consumption in glucose- and gal-DMEM, A6MT and WT cells were plated in 6 well plates, 0.5×10⁶ per well, six replicas per cell line. After 24 h of culture the medium was replaced with glucose- or gal-DMEM containing 1 mM pyruvate and 0.4 mM glutamine. Thereafter, at 2 h, 4 h, and 6 h, 100 μl aliquots of medium were collected from each well for LC-MS analysis. The number of A6MT and WT cells per well was counted at 6 h. The average number of cells per well was similar in the two cell lines: 1.27×10⁶ ± 0.64, and 1.20×10⁶ ± 0.06, WT and A6MT, respectively, in glucose-DMEM and 0.66×10⁶ ± 0.07 and 0.54×10⁶ ± 0.02, WT and A6MT, respectively in gal-DMEM.
Untargeted stable isotope tracing of glutamine
We applied an untargeted stable isotope tracing (USIT) strategy to obtain all possible fates of [U-13C] glutamine, and quantitative information on the relative incorporation of glutamine–derived metabolites based on the stable isotope labeling pattern. USIT used the Agilent untargeted metabolite profiling software [MassHunter Qualitative Analysis6.0, MassProfinder 8.0 and MassProfiler Professional (MPP 13.0)] for an initial untargeted identification of differentially-expressed metabolites in cells grown in [U-13C] glutamine-versus [U-12C] glutamine supplemented media. Differential ion features then serve as targets for generating curated isotopologues that are expected to contain incorporated stable isotope elements. To enhance true positive discovery rate, and diminish false positives/negatives, USIT then seeks to confirm the presence of a reciprocal shift in isotopologue spectral patterns, i.e., that incorporation of the heavy isotope occurs concomitantly with a decrease in light isotope content. USIT also calculates and corrects for the natural abundance of heavy isotope in samples. In the glutamine tracing experiment, extra 2 mM of [U-13C] glutamine or 2 mM of [U-12C] glutamine was added to the DMEM medium already containing 4 mM of [U-12C] glutamine. We predict a maximum 33.3% of 13C glutamine incorporation.
QUANTIFICATION AND STATISTICAL ANALYSIS
Statistical analyses
In all of the assays the values are averages of at least three independent measurements. Error bars indicate standard deviation (S.D.) or standard error of the mean (S.E.M.). Statistically significant differences between two groups were estimated by unpaired two-tailed Student’s test with significance set at p<0.05. In the figures and tables, *, #, $, and ˆ indicate p˂0.05.
DATA AND SOFTWARE AVAILABILITY
Data Resources
Supplementary Material
Table S5. Ion abundance of intracellular metabolites in A6MT and WT cells. Related to Fig. S3A.
Table S6. Ion abundance of intracellular metabolites in COXI 50%MT and WT cells. Related to Fig. S3B.
Table S7. Ion abundance of metabolites in COX10 KO and CTL calf muscle. Related to Fig. S7A.
Highlights.
Glutamine anaplerosis is increased in OXPHOS defective mtDNA mutant cells
The severity of the OXPHOS defect determines the direction of glutamine flux
Protein breakdown and amino acid catabolism are enhanced in COX10KO muscle
COX10KO muscle increases energy-generating glutamate anaplerosis and alanine output
Acknowledgments
This work was supported by grants MDA276237 (to M.D.) and NIH GM088999 and NS084524 to (G.M.).
Footnotes
Publisher's Disclaimer: This is a PDF file of an unedited manuscript that has been accepted for publication. As a service to our customers we are providing this early version of the manuscript. The manuscript will undergo copyediting, typesetting, and review of the resulting proof before it is published in its final citable form. Please note that during the production process errors may be discovered which could affect the content, and all legal disclaimers that apply to the journal pertain.
AUTHOR CONTRIBUTIONS
Q.C. designed and performed metabolomics and USIT experiments, analyzed data and contributed to manuscript writing. K.K. performed mouse genotype and phenotype analyses, collected and analyzed mouse tissues. Y.I.S., D.Z., A.J.A., I.S., F.V., G.P., and E.L.C. performed biochemical experiments. V.C., T.T.D., and F.M.B. conceived experiments and contributed to data interpretation. S.S.G. conceived and designed metabolomics and USIT experiments, supervised data analysis and contributed to manuscript writing. G.M. and M.D. conceived and designed experiments, supervised data analysis and wrote the manuscript.
DECLARATION OF INTERESTS
The authors declare no competing interests
SUPPLEMENTAL INFORMATION
Supplemental Information includes seven figures and four tables.
References
- Albrecht J, Sonnewald U, Waagepetersen HS, Schousboe A. Glutamine in the central nervous system: function and dysfunction. Front Biosci. 2007;12:332–343. doi: 10.2741/2067. [DOI] [PubMed] [Google Scholar]
- Avissar NE, Ryan CK, Ganapathy V, Sax HC. Na(+)-dependent neutral amino acid transporter ATB(0) is a rabbit epithelial cell brush-border protein. Am J Physiol Cell Physiol. 2001;281:C963–971. doi: 10.1152/ajpcell.2001.281.3.C963. [DOI] [PubMed] [Google Scholar]
- Baracca A, Solaini G, Sgarbi G, Lenaz G, Baruzzi A, Schapira AH, Martinuzzi A, Carelli V. Severe impairment of complex I-driven adenosine triphosphate synthesis in leber hereditary optic neuropathy cybrids. Arch Neurol. 2005;62:730–736. doi: 10.1001/archneur.62.5.730. [DOI] [PubMed] [Google Scholar]
- Bergstrom J, Furst P, Noree LO, Vinnars E. Intracellular free amino acid concentration in human muscle tissue. J Appl Physiol. 1974;36:693–697. doi: 10.1152/jappl.1974.36.6.693. [DOI] [PubMed] [Google Scholar]
- Birsoy K, Wang T, Chen WW, Freinkman E, Abu-Remaileh M, Sabatini DM. An Essential Role of the Mitochondrial Electron Transport Chain in Cell Proliferation Is to Enable Aspartate Synthesis. Cell. 2015;162:540–551. doi: 10.1016/j.cell.2015.07.016. [DOI] [PMC free article] [PubMed] [Google Scholar]
- Blackshear PJ, Holloway PA, Alberti KG. Factors regulating amino acid release from extrasplanchnic tissues in the rat. Interactions of alanine and glutamine. Biochem J. 1975;150:379–387. doi: 10.1042/bj1500379. [DOI] [PMC free article] [PubMed] [Google Scholar]
- Brosnan ME, Brosnan JT. Renal arginine metabolism. J Nutr. 2004;134:2791S–2795S. doi: 10.1093/jn/134.10.2791S. discussion 2796S-2797S. [DOI] [PubMed] [Google Scholar]
- Bruno C, Martinuzzi A, Tang Y, Andreu AL, Pallotti F, Bonilla E, Shanske S, Fu J, Sue CM, Angelini C, et al. A stop-codon mutation in the human mtDNA cytochrome c oxidase I gene disrupts the functional structure of complex IV. Am J Hum Genet. 1999;65:611–620. doi: 10.1086/302546. [DOI] [PMC free article] [PubMed] [Google Scholar]
- Bunik VI, Denton TT, Xu H, Thompson CM, Cooper AJ, Gibson GE. Phosphonate analogues of alpha-ketoglutarate inhibit the activity of the alpha-ketoglutarate dehydrogenase complex isolated from brain and in cultured cells. Biochemistry. 2005;44:10552–10561. doi: 10.1021/bi0503100. [DOI] [PubMed] [Google Scholar]
- Carrozzo R, Tessa A, Vazquez-Memije ME, Piemonte F, Patrono C, Malandrini A, Dionisi-Vici C, Vilarinho L, Villanova M, Schagger H, et al. The T9176G mtDNA mutation severely affects ATP production and results in Leigh syndrome. Neurology. 2001;56:687–690. doi: 10.1212/wnl.56.5.687. [DOI] [PubMed] [Google Scholar]
- Chang TW, Goldberg AL. The metabolic fates of amino acids and the formation of glutamine in skeletal muscle. J Biol Chem. 1978;253:3685–3693. [PubMed] [Google Scholar]
- Chen L, Cui H. Targeting Glutamine Induces Apoptosis: A Cancer Therapy Approach. Int J Mol Sci. 2015;16:22830–22855. doi: 10.3390/ijms160922830. [DOI] [PMC free article] [PubMed] [Google Scholar]
- Chen Q, Park HC, Goligorsky MS, Chander P, Fischer SM, Gross SS. Untargeted plasma metabolite profiling reveals the broad systemic consequences of xanthine oxidoreductase inactivation in mice. PLoS One. 2012;7:e37149. doi: 10.1371/journal.pone.0037149. [DOI] [PMC free article] [PubMed] [Google Scholar]
- Curis E, Nicolis I, Moinard C, Osowska S, Zerrouk N, Benazeth S, Cynober L. Almost all about citrulline in mammals. Amino Acids. 2005;29:177–205. doi: 10.1007/s00726-005-0235-4. [DOI] [PubMed] [Google Scholar]
- Curthoys NP, Watford M. Regulation of glutaminase activity and glutamine metabolism. Annu Rev Nutr. 1995;15:133–159. doi: 10.1146/annurev.nu.15.070195.001025. [DOI] [PubMed] [Google Scholar]
- D’Aurelio M, Pallotti F, Barrientos A, Gajewski CD, Kwong JQ, Bruno C, Beal MF, Manfredi G. In vivo regulation of oxidative phosphorylation in cells harboring a stop-codon mutation in mitochondrial DNA-encoded cytochrome c oxidase subunit I. J Biol Chem. 2001;276:46925–46932. doi: 10.1074/jbc.M106429200. [DOI] [PubMed] [Google Scholar]
- D’Aurelio M, Vives-Bauza C, Davidson MM, Manfredi G. Mitochondrial DNA background modifies the bioenergetics of NARP/MILS ATP6 mutant cells. Hum Mol Genet. 2010;19:374–386. doi: 10.1093/hmg/ddp503. [DOI] [PMC free article] [PubMed] [Google Scholar]
- Dai Z, Wu Z, Jia S, Wu G. Analysis of amino acid composition in proteins of animal tissues and foods as pre-column o-phthaldialdehyde derivatives by HPLC with fluorescence detection. J Chromatogr B Analyt Technol Biomed Life Sci. 2014;964:116–127. doi: 10.1016/j.jchromb.2014.03.025. [DOI] [PubMed] [Google Scholar]
- Danhauser K, Smeitink JA, Freisinger P, Sperl W, Sabir H, Hadzik B, Mayatepek E, Morava E, Distelmaier F. Treatment options for lactic acidosis and metabolic crisis in children with mitochondrial disease. J Inherit Metab Dis. 2015;38:467–475. doi: 10.1007/s10545-014-9796-2. [DOI] [PubMed] [Google Scholar]
- Daye D, Wellen KE. Metabolic reprogramming in cancer: unraveling the role of glutamine in tumorigenesis. Semin Cell Dev Biol. 2012;23:362–369. doi: 10.1016/j.semcdb.2012.02.002. [DOI] [PubMed] [Google Scholar]
- De Coo IF, Renier WO, Ruitenbeek W, Ter Laak HJ, Bakker M, Schagger H, Van Oost BA, Smeets HJ. A 4-base pair deletion in the mitochondrial cytochrome b gene associated with parkinsonism/MELAS overlap syndrome. Annals of Neurology. 1999;45:130–133. doi: 10.1002/1531-8249(199901)45:1<130::aid-art21>3.3.co;2-q. [DOI] [PubMed] [Google Scholar]
- de la Rosa V, Campos-Sandoval JA, Martin-Rufian M, Cardona C, Mates JM, Segura JA, Alonso FJ, Marquez J. A novel glutaminase isoform in mammalian tissues. Neurochem Int. 2009;55:76–84. doi: 10.1016/j.neuint.2009.02.021. [DOI] [PubMed] [Google Scholar]
- Debray FG, Lambert M, Allard P, Mitchell GA. Low citrulline in Leigh disease: still a biomarker of maternally inherited Leigh syndrome. J Child Neurol. 2010;25:1000–1002. doi: 10.1177/0883073809351983. [DOI] [PubMed] [Google Scholar]
- Diaz F, Thomas CK, Garcia S, Hernandez D, Moraes CT. Mice lacking COX10 in skeletal muscle recapitulate the phenotype of progressive mitochondrial myopathies associated with cytochrome c oxidase deficiency. Hum Mol Genet. 2005;14:2737–2748. doi: 10.1093/hmg/ddi307. [DOI] [PMC free article] [PubMed] [Google Scholar]
- Eales KL, Hollinshead KE, Tennant DA. Hypoxia and metabolic adaptation of cancer cells. Oncogenesis. 2016;5:e190. doi: 10.1038/oncsis.2015.50. [DOI] [PMC free article] [PubMed] [Google Scholar]
- Edmonds JL, Kirse DJ, Kearns D, Deutsch R, Spruijt L, Naviaux RK. The otolaryngological manifestations of mitochondrial disease and the risk of neurodegeneration with infection. Arch Otolaryngol Head Neck Surg. 2002;128:355–362. doi: 10.1001/archotol.128.4.355. [DOI] [PubMed] [Google Scholar]
- El-Hattab AW, Adesina AM, Jones J, Scaglia F. MELAS syndrome: Clinical manifestations, pathogenesis, and treatment options. Mol Genet Metab. 2015;116:4–12. doi: 10.1016/j.ymgme.2015.06.004. [DOI] [PubMed] [Google Scholar]
- Elgadi KM, Meguid RA, Qian M, Souba WW, Abcouwer SF. Cloning and analysis of unique human glutaminase isoforms generated by tissue-specific alternative splicing. Physiol Genomics. 1999;1:51–62. doi: 10.1152/physiolgenomics.1999.1.2.51. [DOI] [PubMed] [Google Scholar]
- Fendt SM, Bell EL, Keibler MA, Olenchock BA, Mayers JR, Wasylenko TM, Vokes NI, Guarente L, Vander Heiden MG, Stephanopoulos G. Reductive glutamine metabolism is a function of the alpha-ketoglutarate to citrate ratio in cells. Nat Commun. 2013;4:2236. doi: 10.1038/ncomms3236. [DOI] [PMC free article] [PubMed] [Google Scholar]
- Fuchs BC, Bode BP. Amino acid transporters ASCT2 and LAT1 in cancer: partners in crime? Semin Cancer Biol. 2005;15:254–266. doi: 10.1016/j.semcancer.2005.04.005. [DOI] [PubMed] [Google Scholar]
- Gorman GS, Chinnery PF, DiMauro S, Hirano M, Koga Y, McFarland R, Suomalainen A, Thorburn DR, Zeviani M, Turnbull DM. Mitochondrial diseases. Nat Rev Dis Primers. 2016;2:16080. doi: 10.1038/nrdp.2016.80. [DOI] [PubMed] [Google Scholar]
- Haussinger D. Regulation of hepatic ammonia metabolism: the intercellular glutamine cycle. Adv Enzyme Regul. 1986;25:159–180. doi: 10.1016/0065-2571(86)90013-0. [DOI] [PubMed] [Google Scholar]
- He Y, Hakvoort TB, Kohler SE, Vermeulen JL, de Waart DR, de Theije C, ten Have GA, van Eijk HM, Kunne C, Labruyere WT, et al. Glutamine synthetase in muscle is required for glutamine production during fasting and extrahepatic ammonia detoxification. J Biol Chem. 2010;285:9516–9524. doi: 10.1074/jbc.M109.092429. [DOI] [PMC free article] [PubMed] [Google Scholar]
- Hofhaus G, Shakeley RM, Attardi G. Use of polarography to detect respiration defects in cell cultures. Methods Enzymol. 1996;264:476–483. doi: 10.1016/s0076-6879(96)64043-9. [DOI] [PubMed] [Google Scholar]
- Ismailoglu I, Chen Q, Popowski M, Yang L, Gross SS, Brivanlou AH. Huntingtin protein is essential for mitochondrial metabolism, bioenergetics and structure in murine embryonic stem cells. Dev Biol. 2014;391:230–240. doi: 10.1016/j.ydbio.2014.04.005. [DOI] [PMC free article] [PubMed] [Google Scholar]
- Kim J, Kundu M, Viollet B, Guan KL. AMPK and mTOR regulate autophagy through direct phosphorylation of Ulk1. Nat Cell Biol. 2011;13:132–141. doi: 10.1038/ncb2152. [DOI] [PMC free article] [PubMed] [Google Scholar]
- King MP, Attardi G. Human cells lacking mtDNA: repopulation with exogenous mitochondria by complementation. Science. 1989;246:500–503. doi: 10.1126/science.2814477. [DOI] [PubMed] [Google Scholar]
- Kita K, Suzuki T, Ochi T. Down-regulation of glutaminase C in human hepatocarcinoma cell by diphenylarsinic acid, a degradation product of chemical warfare agents. Toxicol Appl Pharmacol. 2007;220:262–270. doi: 10.1016/j.taap.2007.01.009. [DOI] [PubMed] [Google Scholar]
- Kjobsted R, Hingst JR, Fentz J, Foretz M, Sanz MN, Pehmoller C, Shum M, Marette A, Mounier R, Treebak JT, et al. AMPK in skeletal muscle function and metabolism. FASEB J. 2017 doi: 10.1096/fj.201700442R. [DOI] [PMC free article] [PubMed] [Google Scholar]
- Kotlyar AB, Vinogradov AD. Interaction of the membrane-bound succinate dehydrogenase with substrate and competitive inhibitors. Biochim Biophys Acta. 1984;784:24–34. doi: 10.1016/0167-4838(84)90168-7. [DOI] [PubMed] [Google Scholar]
- Livak KJ, Schmittgen TD. Analysis of relative gene expression data using real-time quantitative PCR and the 2(-Delta Delta C(T)) Method. Methods. 2001;25:402–408. doi: 10.1006/meth.2001.1262. [DOI] [PubMed] [Google Scholar]
- Longo N. Mitochondrial encephalopathy. Neurol Clin. 2003;21:817–831. doi: 10.1016/s0733-8619(03)00015-x. [DOI] [PubMed] [Google Scholar]
- Marin M, Lavillette D, Kelly SM, Kabat D. N-linked glycosylation and sequence changes in a critical negative control region of the ASCT1 and ASCT2 neutral amino acid transporters determine their retroviral receptor functions. J Virol. 2003;77:2936–2945. doi: 10.1128/JVI.77.5.2936-2945.2003. [DOI] [PMC free article] [PubMed] [Google Scholar]
- Marliss EB, Aoki TT, Pozefsky T, Most AS, Cahill GF., Jr Muscle and splanchnic glutmine and glutamate metabolism in postabsorptive andstarved man. J Clin Invest. 1971;50:814–817. doi: 10.1172/JCI106552. [DOI] [PMC free article] [PubMed] [Google Scholar]
- McGivan JD, Bungard CI. The transport of glutamine into mammalian cells. Front Biosci. 2007;12:874–882. doi: 10.2741/2109. [DOI] [PubMed] [Google Scholar]
- Metallo CM, Gameiro PA, Bell EL, Mattaini KR, Yang J, Hiller K, Jewell CM, Johnson ZR, Irvine DJ, Guarente L, et al. Reductive glutamine metabolism by IDH1 mediates lipogenesis under hypoxia. Nature. 2012;481:380–384. doi: 10.1038/nature10602. [DOI] [PMC free article] [PubMed] [Google Scholar]
- Metallo CM, Vander Heiden MG. Metabolism strikes back: metabolic flux regulates cell signaling. Genes Dev. 2010;24:2717–2722. doi: 10.1101/gad.2010510. [DOI] [PMC free article] [PubMed] [Google Scholar]
- Meyer OA, Tilson HA, Byrd WC, Riley MT. A method for the routine assessment of fore- and hindlimb grip strength of rats and mice. Neurobehav Toxicol. 1979;1:233–236. [PubMed] [Google Scholar]
- Morava E, van den Heuvel L, Hol F, de Vries MC, Hogeveen M, Rodenburg RJ, Smeitink JA. Mitochondrial disease criteria: diagnostic applications in children. Neurology. 2006;67:1823–1826. doi: 10.1212/01.wnl.0000244435.27645.54. [DOI] [PubMed] [Google Scholar]
- Mullen AR, Hu Z, Shi X, Jiang L, Boroughs LK, Kovacs Z, Boriack R, Rakheja D, Sullivan LB, Linehan WM, et al. Oxidation of alpha-ketoglutarate is required for reductive carboxylation in cancer cells with mitochondrial defects. Cell Rep. 2014;7:1679–1690. doi: 10.1016/j.celrep.2014.04.037. [DOI] [PMC free article] [PubMed] [Google Scholar]
- Mullen AR, Wheaton WW, Jin ES, Chen PH, Sullivan LB, Cheng T, Yang Y, Linehan WM, Chandel NS, DeBerardinis RJ. Reductive carboxylation supports growth in tumour cells with defective mitochondria. Nature. 2012;481:385–388. doi: 10.1038/nature10642. [DOI] [PMC free article] [PubMed] [Google Scholar]
- Naini A, Kaufmann P, Shanske S, Engelstad K, De Vivo DC, Schon EA. Hypocitrullinemia in patients with MELAS: an insight into the “MELAS paradox”. J Neurol Sci. 2005;229–230:187–193. doi: 10.1016/j.jns.2004.11.026. [DOI] [PubMed] [Google Scholar]
- Neel BA, Lin Y, Pessin JE. Skeletal muscle autophagy: a new metabolic regulator. Trends Endocrinol Metab. 2013;24:635–643. doi: 10.1016/j.tem.2013.09.004. [DOI] [PMC free article] [PubMed] [Google Scholar]
- Newsholme EA, Newsholme P, Curi R, Challoner E, Ardawi MSM. A Role for Muscle in the Immune-System and Its Importance in Surgery, Trauma, Sepsis and Burns. Nutrition. 1988;4:261–268. [Google Scholar]
- Newsholme P, Procopio J, Lima MM, Pithon-Curi TC, Curi R. Glutamine and glutamate–their central role in cell metabolism and function. Cell Biochem Funct. 2003;21:1–9. doi: 10.1002/cbf.1003. [DOI] [PubMed] [Google Scholar]
- Nijtmans LG, Henderson NS, Attardi G, Holt IJ. Impaired ATP synthase assembly associated with a mutation in the human ATP synthase subunit 6 gene. J Biol Chem. 2001;276:6755–6762. doi: 10.1074/jbc.M008114200. [DOI] [PubMed] [Google Scholar]
- Nikkanen J, Forsstrom S, Euro L, Paetau I, Kohnz RA, Wang L, Chilov D, Viinamaki J, Roivainen A, Marjamaki P, et al. Mitochondrial DNA Replication Defects Disturb Cellular dNTP Pools and Remodel One-Carbon Metabolism. Cell Metab. 2016;23:635–648. doi: 10.1016/j.cmet.2016.01.019. [DOI] [PubMed] [Google Scholar]
- Palmada M, Speil A, Jeyaraj S, Bohmer C, Lang F. The serine/threonine kinases SGK1, 3 and PKB stimulate the amino acid transporter ASCT2. Biochem Biophys Res Commun. 2005;331:272–277. doi: 10.1016/j.bbrc.2005.03.159. [DOI] [PubMed] [Google Scholar]
- Parfait B, de Lonlay P, von Kleist-Retzow JC, Cormier-Daire V, Chretien D, Rotig A, Rabier D, Saudubray JM, Rustin P, Munnich A. The neurogenic weakness, ataxia and retinitis pigmentosa (NARP) syndrome mtDNA mutation (T8993G) triggers muscle ATPase deficiency and hypocitrullinaemia. Eur J Pediatr. 1999;158:55–58. doi: 10.1007/s004310051009. [DOI] [PubMed] [Google Scholar]
- Rabier D, Diry C, Rotig A, Rustin P, Heron B, Bardet J, Parvy P, Ponsot G, Marsac C, Saudubray JM, et al. Persistent hypocitrullinaemia as a marker for mtDNA NARP T 8993 G mutation? J Inherit Metab Dis. 1998;21:216–219. doi: 10.1023/a:1005391300203. [DOI] [PubMed] [Google Scholar]
- Robinson BH. Use of fibroblast and lymphoblast cultures for detection of respiratory chain defects. Methods Enzymol. 1996;264:454–464. doi: 10.1016/s0076-6879(96)64041-5. [DOI] [PubMed] [Google Scholar]
- Sakuma K, Kinoshita M, Ito Y, Aizawa M, Aoi W, Yamaguchi A. p62/SQSTM1 but not LC3 is accumulated in sarcopenic muscle of mice. J Cachexia Sarcopenia Muscle. 2016;7:204–212. doi: 10.1002/jcsm.12045. [DOI] [PMC free article] [PubMed] [Google Scholar]
- Santos SS, Gibson GE, Cooper AJ, Denton TT, Thompson CM, Bunik VI, Alves PM, Sonnewald U. Inhibitors of the alpha-ketoglutarate dehydrogenase complex alter [1-13C]glucose and [U-13C]glutamate metabolism in cerebellar granule neurons. J Neurosci Res. 2006;83:450–458. doi: 10.1002/jnr.20749. [DOI] [PubMed] [Google Scholar]
- Shaham O, Slate NG, Goldberger O, Xu Q, Ramanathan A, Souza AL, Clish CB, Sims KB, Mootha VK. A plasma signature of human mitochondrial disease revealed through metabolic profiling of spent media from cultured muscle cells. Proc Natl Acad Sci U S A. 2010;107:1571–1575. doi: 10.1073/pnas.0906039107. [DOI] [PMC free article] [PubMed] [Google Scholar]
- Shatla HM, Tomoum HY, Elsayed SM, Elagouza IA, Shatla RH, Mohsen MM, Hamed AN. Role of plasma amino acids and urinary organic acids in diagnosis of mitochondrial diseases in children. Pediatr Neurol. 2014;51:820–825. doi: 10.1016/j.pediatrneurol.2014.08.009. [DOI] [PubMed] [Google Scholar]
- Shin CS, Mishra P, Watrous JD, Carelli V, D’Aurelio M, Jain M, Chan DC. The glutamate/cystine xCT antiporter antagonizes glutamine metabolism and reduces nutrient flexibility. Nat Commun. 2017;8:15074. doi: 10.1038/ncomms15074. [DOI] [PMC free article] [PubMed] [Google Scholar]
- Smeitink JA, Zeviani M, Turnbull DM, Jacobs HT. Mitochondrial medicine: a metabolic perspective on the pathology of oxidative phosphorylation disorders. Cell Metab. 2006;3:9–13. doi: 10.1016/j.cmet.2005.12.001. [DOI] [PubMed] [Google Scholar]
- Son J, Lyssiotis CA, Ying H, Wang X, Hua S, Ligorio M, Perera RM, Ferrone CR, Mullarky E, Shyh-Chang N, et al. Glutamine supports pancreatic cancer growth through a KRAS-regulated metabolic pathway. Nature. 2013;496:101–105. doi: 10.1038/nature12040. [DOI] [PMC free article] [PubMed] [Google Scholar]
- Sullivan LB, Gui DY, Hosios AM, Bush LN, Freinkman E, Vander Heiden MG. Supporting Aspartate Biosynthesis Is an Essential Function of Respiration in Proliferating Cells. Cell. 2015;162:552–563. doi: 10.1016/j.cell.2015.07.017. [DOI] [PMC free article] [PubMed] [Google Scholar]
- Tan HWS, Sim AYL, Long YC. Glutamine metabolism regulates autophagy-dependent mTORC1 reactivation during amino acid starvation. Nat Commun. 2017;8:338. doi: 10.1038/s41467-017-00369-y. [DOI] [PMC free article] [PubMed] [Google Scholar]
- Tapiero H, Mathe G, Couvreur P, Tew KD. II. Glutamine and glutamate. Biomed Pharmacother. 2002;56:446–457. doi: 10.1016/s0753-3322(02)00285-8. [DOI] [PubMed] [Google Scholar]
- Taylor L, Curthoys NP. Glutamine metabolism: Role in acid-base balance*. Biochem Mol Biol Educ. 2004;32:291–304. doi: 10.1002/bmb.2004.494032050388. [DOI] [PubMed] [Google Scholar]
- Thellin O, Zorzi W, Lakaye B, De Borman B, Coumans B, Hennen G, Grisar T, Igout A, Heinen E. Housekeeping genes as internal standards: use and limits. J Biotechnol. 1999;75:291–295. doi: 10.1016/s0168-1656(99)00163-7. [DOI] [PubMed] [Google Scholar]
- Tong X, Zhao F, Thompson CB. The molecular determinants of de novo nucleotide biosynthesis in cancer cells. Curr Opin Genet Dev. 2009;19:32–37. doi: 10.1016/j.gde.2009.01.002. [DOI] [PMC free article] [PubMed] [Google Scholar]
- Tyynismaa H, Carroll CJ, Raimundo N, Ahola-Erkkila S, Wenz T, Ruhanen H, Guse K, Hemminki A, Peltola-Mjosund KE, Tulkki V, et al. Mitochondrial myopathy induces a starvation-like response. Hum Mol Genet. 2010;19:3948–3958. doi: 10.1093/hmg/ddq310. [DOI] [PubMed] [Google Scholar]
- Utsunomiya-Tate N, Endou H, Kanai Y. Cloning and functional characterization of a system ASC-like Na+-dependent neutral amino acid transporter. J Biol Chem. 1996;271:14883–14890. doi: 10.1074/jbc.271.25.14883. [DOI] [PubMed] [Google Scholar]
- Wagenmakers AJ. Muscle amino acid metabolism at rest and during exercise: role in human physiology and metabolism. Exerc Sport Sci Rev. 1998a;26:287–314. [PubMed] [Google Scholar]
- Wagenmakers AJ. Protein and amino acid metabolism in human muscle. Adv Exp Med Biol. 1998b;441:307–319. doi: 10.1007/978-1-4899-1928-1_28. [DOI] [PubMed] [Google Scholar]
- Wise DR, Thompson CB. Glutamine addiction: a new therapeutic target in cancer. Trends Biochem Sci. 2010;35:427–433. doi: 10.1016/j.tibs.2010.05.003. [DOI] [PMC free article] [PubMed] [Google Scholar]
- Wu G. Intestinal mucosal amino acid catabolism. J Nutr. 1998;128:1249–1252. doi: 10.1093/jn/128.8.1249. [DOI] [PubMed] [Google Scholar]
- Wu G, Bazer FW, Davis TA, Kim SW, Li P, Marc Rhoads J, Carey Satterfield M, Smith SB, Spencer TE, Yin Y. Arginine metabolism and nutrition in growth, health and disease. Amino Acids. 2009;37:153–168. doi: 10.1007/s00726-008-0210-y. [DOI] [PMC free article] [PubMed] [Google Scholar]
- Wu G, Meininger CJ. Analysis of citrulline, arginine, and methylarginines using high-performance liquid chromatography. Methods Enzymol. 2008;440:177–189. doi: 10.1016/S0076-6879(07)00810-5. [DOI] [PubMed] [Google Scholar]
Associated Data
This section collects any data citations, data availability statements, or supplementary materials included in this article.
Supplementary Materials
Table S5. Ion abundance of intracellular metabolites in A6MT and WT cells. Related to Fig. S3A.
Table S6. Ion abundance of intracellular metabolites in COXI 50%MT and WT cells. Related to Fig. S3B.
Table S7. Ion abundance of metabolites in COX10 KO and CTL calf muscle. Related to Fig. S7A.