

Abstract
Combined MEK and CDK4/6 inhibition (MEKi+CDK4i) has shown promising clinical outcomes in NRAS mutant melanoma patients. Here, we interrogated longitudinal biopsies from a patient who initially responded to MEKi+CDK4i therapy but subsequently developed resistance. Whole exome sequencing and functional validation identified an acquired PIK3CAE545K mutation as conferring drug resistance. We demonstrate that PIK3CAE545K pre-existed in a rare subpopulation that was missed by both clinical and research testing, but was revealed upon multi-region sampling due to PIK3CAE545K being non-uniformly distributed. This resistant population rapidly expanded after the initiation of MEKi+CDK4i therapy and persisted in all successive samples even after immune checkpoint therapy and distant metastasis. Functional studies identified activated S6K1 as both a key marker and specific therapeutic vulnerability downstream of PIK3CAE545K-induced resistance. These results demonstrate that difficult-to-detect pre-existing resistance mutations may exist more often than previously appreciated and also posit S6K1 as a common downstream therapeutic nexus for the MAPK, CDK4/6, and PI3K pathways.
Keywords: melanoma, MEK inhibitor, S6K1 inhibitor, CDK4/6 inhibitor, PIK3CA
Introduction
NRAS mutations are able to induce constitutive RAF-MEK-ERK signaling cascade activation, promoting survival, proliferation and tumor progression. Activating NRAS mutations occur in 15-20% of melanomas (1,2) and effective therapeutic approaches to this genetic subtype of tumors are still needed. MEK inhibitors have emerged as a likely cornerstone therapy for NRAS melanoma, as it inhibits the main signal transduction pathway: the compound MEK162 has shown activity in a Phase 3 clinical trial, inducing a 15% overall response rate (3). However, a major obstacle for single-agent MEKi is the ability of NRAS signaling to induce multiple pro-oncogenic signaling networks (4–6), making it a daunting task to select appropriately complementary partner therapies for combination. In a previous study using genetically engineered mouse models, systems biology analyses pinpointed CDK4 as a critical node that, when targeted in combination with MEKi, approximates the full shutdown of NRAS signaling (6). This manifests as the synergistic induction of apoptosis and cell cycle arrest, leading to frank regression in multiple models of NRAS as well as BRAF melanoma (6–8). A Phase Ib/II clinical trial (NCT01781572) using MEK162 and LEE011 against NRAS melanoma was designed based on these findings and interim results show promising response rates and progression-free survival (9). The combination is also under active investigation in KRAS-mutant lung (NCT03170206), pancreatic, and colon cancer (NCT02703571). Anticipating mechanisms of resistance is pivotal for the clinical evolution of this therapeutic regimen.
In this study, we analyze for the first time a case of clinical acquired resistance to MEKi+CDK4i combined therapy in a patient enrolled in clinical trial NCT01781572. The patient showed initial response to the therapy but eventually developed resistance. Our longitudinal biospecimen investigation revealed that a PIK3CAE545K mutation pre-existed in a rare subpopulation whose expansion upon therapy was responsible for the observed drug resistance. Through functional studies we demonstrate that the key resistance mechanism conferred by PIK3CAE545K is sustained cell proliferation via the pharmacologically targetable S6K1-S6 signaling axis. Our study provides the first evidence that subclonal populations of cells harboring resistance mechanisms can evade detection in single pre-treatment biopsies due to a combination of their rarity and non-uniform distribution across the tumor.
Results
Case Report
A 59 year old female patient presented with recurrent, unresectable Stage IIIC malignant melanoma with in-transit metastases in the left popliteal fossa and groin lymphadenopathy (Fig S1 A-B). She had a history of a nodular pigmented melanoma on the left calf which was resected 7 years prior. Clinical targeted next-generation sequencing (NGS) of a 46-gene panel of a popliteal fossa lesion identified an NRAS mutation (p.G13R, NRASG13R) and wild type PIK3CA (Table S1) with an average read depth of ≥3500× per gene. The patient underwent 2 cycles of High-Dose IL-2 (HDIL-2) which resulted in progression of disease. She was then enrolled to clinical trial NCT01781572 of MEK162 (MEKi) dosed at 45mg by mouth twice daily continuously and LEE011 (CDK4i) 200mg daily for 21 days of a 28 day cycle (Fig. 1A). The patient had a confirmed partial response (−39%) to therapy per RECIST 1.1 as well as a decrease in serum LDH (Fig. 1 B-C), but was eventually taken off protocol because of progression of the lesions (Fig. 1C). She was then treated with successive single-agent anti-CTLA4 and single agent anti-PD-1 therapies with a lack of response to anti-CTLA4 and an initial mixed response to anti-PD1 followed by progression, (Fig. 1C and Fig S1) including the development of distant metastases to the bowel and brain. Five longitudinal biopsies were collected from the patient for whole exome sequencing (WES): pre-treatment, on-MEKi+CDK4i (Day 16), post-progression (Day 151), and on-anti-PD1 (one from a responding lesion and one from a non-responding lesion) (Fig 1A and Fig S1C). All biopsies were of the in-transit metastases in the left popliteal fossa other than the anti-PD1 responding lesion biopsy which was of a groin lymph node.
Figure 1.
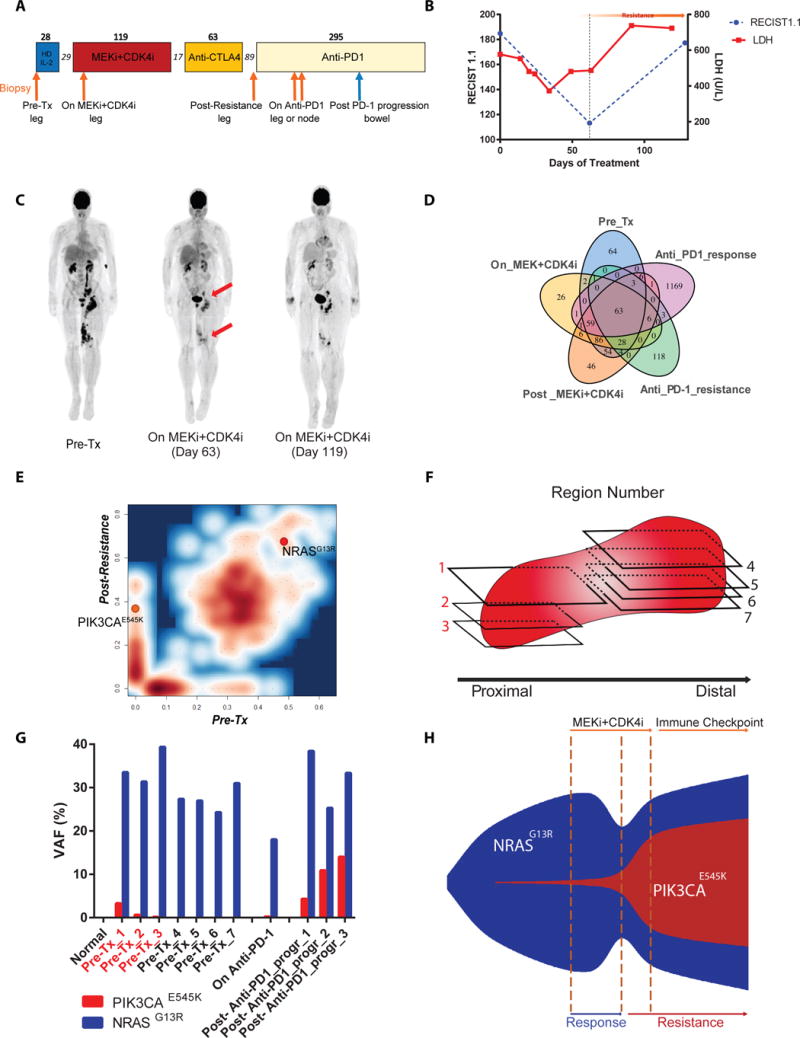
Mutational analysis of patient samples pre-treatment, on-treatment, and post-resistance to MEKi+CDKi. A) Timeline of therapy. Arrows indicate biopsy timepoints. Numbers over boxes indicate days of treatment; numbers in italics represent days off treatment. Orange arrows underwent WES. B) RECIST measurements and LDH levels over 4 cycles of MEKi+CDKi therapy. C) PET scans of the patient. D) Venn diagram of all mutations identified by WES in the 5 biopsies. E) Mutation contour plot comparing pre-treatment and post-resistance samples by variant allele frequency (VAF), adjusted for tumor purity. F) Schematic of 7 FFPE blocks taken from the pre-treatment tumor for BDA analysis. Red numbering indicates sections that tested positive for PIK3CAE545K by BDA. G) BDA measurement of VAFs for NRASG13R and PIK3CAE545K. H) Schematic of clonal evolution of the PIK3CAE545K subpopulation.
PIK3CAE545K pre-existed in a rare subpopulation and expanded early in MEKi+CDK4i-treatment
WES was performed on the 5 biopsies and matched normal tissue and the Mutect program was used to identify somatic mutations among the samples. Single Nucleotide Variant (SNV) analysis revealed that all 5 biopsies were clonally related, sharing a minimum of 63 trunk mutations including the driver oncogenic mutation NRASG13R (Fig 1D and Table S2). We noted that one of the samples, the on-anti-PD-1 responding lymph node lesion, was an outlier with a much higher mutational load (Fig 1D). This observation is in line with highly mutated tumors being more responsive to checkpoint blockade (10).
In order to identify candidate mutations involved in MEKi+CDK4i resistance, we focused on the comparison between pre-treatment and post-resistance samples, aided by their high tumor purities (Table S3). Between these two samples, 303 mutations were shared while 53 were private to the post-resistance sample, of which 16 were non-synonymous coding mutations (Fig 1D-E). This indicates a strong evolutionary continuity between the two samples and suggests that mutations private to the post-resistance sample may include causative resistance mutation(s). We hypothesized that cells with the causative mutation(s) would be a dominant clone; therefore, we prioritized mutations that were present with an allelic fraction greater than 25% and not detected before the start of treatment (Table S3). Only one mutation of this set has been reported in the COSMIC database and was known from the literature to be an oncogenic mutation: PI3KCAE545K (11), at an allelic fraction of 33%. PI3KCAE545K (c.1633G>A, p.E545K) is a hotspot oncogenic mutation, known to be involved in breast, GI tract, bladder and other cancers’ development, but has rarely been reported in melanoma (~1%) (4,12,13). In the current patient, PIK3CAE545K was detected as early as 16 days after the initiation of MEKi+CDK4i treatment. (Table S3). Moreover, PIK3CAE545K persisted in all of the biopsies including the one from the lymph node (Table S3 and Fig S2). Since liquid biopsies offer the capacity to non-intrusively test for acquired resistance-causing mutations (14–17), we isolated circulating cell free DNA and tested it by digital droplet PCR (ddPCR). Indeed, the PIK3CAE545K mutation was readily detected in the plasma after the acquisition of resistance (Fig S3).
The detection of PIK3CAE545K at only 16 days on therapy is consistent with the hypothesis that drug-resistant clones may exist as rare subpopulations prior to therapy which are then positively selected for (18). To our knowledge, however, while this hypothesis has been validated in vitro through an elegant barcoding strategy that identified pre-existing EGFR or ABL1 inhibitor-resistant subclones that became dominant upon therapy (19), it has not been explicitly quantified in longitudinal solid tumor biopsies (20,21). Therefore, we performed Blocker Displacement Amplification (BDA) to enrich for the detection of rare variants (22) on 7 different regions of the pre-treatment sample (Fig 1F). BDA is capable of detecting rare variants to a limit of ~0.1%. Indeed, we could confidently detect the presence of PIK3CAE545K in 3/7 pre-treatment regions as rare variants (Fig 1G), compared to 4/4 post-resistance regions comprised of 1/1 region from early on anti-PD-1 therapy and 3/3 regions from a bowel metastasis biopsy at 103 days on anti-PD-1 therapy (272 days post-MEKi+CDKi therapy, Fig. 1A) (Fig 1G). By weighing the BDA data of each region for the relative tumor area they covered, we estimated that PIK3CAE545K existed as approximately 0.13% of the entire pre-treatment tumor and 10.2% of the entire post-resistance bowel metastasis tumor. Moreover, the PIK3CAE545K-positive and -negative pre-treatment regions were spatially segregated rather than uniformly distributed (Fig. 1F-G), offering an explanation of why single-region sampling for the WES data at 200× read coverage missed detecting this subpopulation. Indeed, both the clinical and research NGS samples came from the same area as the blocks that tested PIK3CAE545K-negative (Fig. 1F). In sum, our patient sample analyses indicate that a rare PI3KCAE545K subpopulation rapidly expanded upon MEK+CDK4i therapy, possibly due to positive selection for its putative drug resistance properties (Fig. 1H).
PIK3CAE545K confers resistance to NRAS mutant melanoma cells and increases S6K1 and S6 phosphorylation
In order to validate and explore the mechanisms and therapeutic vulnerabilities of the PIK3CAE545K mutation in MEKi+CDK4i resistance, we overexpressed GFP, wild-type PIK3CA, or PIK3CAE545K in two NRAS-mutant cutaneous melanoma cell lines, WM1366 and SB2. The cells were then assayed for sensitivity to MEKi+CDK4i treatment (Fig 2A-F). Consistent with previous studies, MEKi+CDK4i showed a stronger inhibitory effect in the control cell lines than either drug alone (Fig 2A and 2D). By contrast, the cells that expressed PIK3CAE545K were significantly more resistant to the MEKi+CDK4i combination (Fig 2A and 2D), a well as to single-agent MEK162 or LEE011 (Fig 2B-C and 2E-F).
Figure 2.
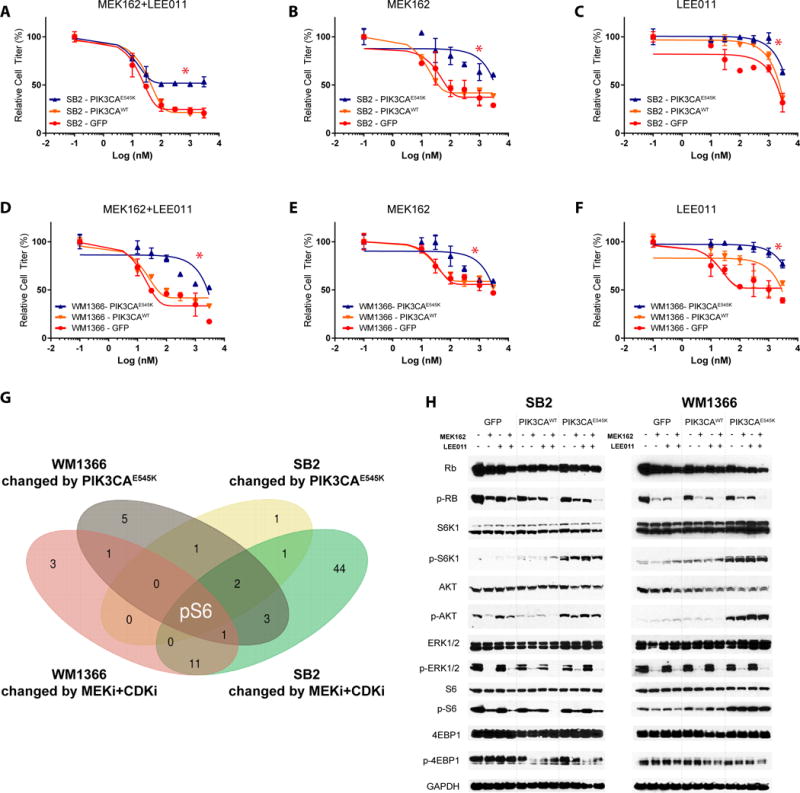
PIK3CAE545K confers drug resistance to MEKi+CDK4i. A-F) Effect of GFP, PIK3CAWT, or PIK3CAE545K overexpression on single-agent or combined MEKi and CDK4i response in two NRAS-mutant cell lines, SB2 and WM1366. Asterisks (*) represent p<0.05 in paired t-test vs control groups. Cell titer is normalized to control group (DMSO 0.01%) cell confluence after 72h of drug treatments. Error bars represent SEM. G) Venn diagram of RPPA results on >300 proteins showing the intersection of significant changes induced by PIK3CAE545K with those induced by MEKi+CDK4i across both cell lines. H) Western blot validation of selected proteins in both cell lines after 24h of drugs administration (300nM).
In order to better understand the molecular mechanisms underlying the observed resistance, reverse phase protein array (RPPA) analysis of >300 proteins was performed on the cell lines administered with vehicle, MEKi, CDK4i or their combination, and western blot validation of selected proteins. First, to validate our model systems, we examined expected on-target changes of the various perturbations. We found that the expression of PIK3CAE545K increased AKT phosphorylation in both SB2 and WM1366 cells; this was not affected by MEKi+CDK4i, as expected (Fig. 2G and Table S4). Next, we noted that pERK and Dusp4 were decreased by MEK162, both markers of MAPK pathway inhibition. Finally, we observed decreases in the cell cycle markers pRb, Plk1, and Ccnb1 by either drug alone, and synergistically by MEKi+CDKi in both cell lines (Fig. 2G and Table S4), consistent with our previous study in colon cancer (23).
Next, we asked which proteins are responsible for MEKi+CDK4i efficacy in control cells that are then subverted by PIK3CAE545K signaling. We reasoned this could done by first identifying proteins altered by the combination therapy, then intersecting them with proteins consistently altered by PIK3CAE545K in both cell lines (Fig. 2G and Table S4). The goal of this approach was to identify potentially druggable target(s) at the intersection of all three oncogenic cascades (MAPK, CDK4/6, PI3K). This approach identified a single protein state: S6 phosphorylated at the S235/S236 and S240/S244 residues (Fig. 2G). The perturbation of this mTOR effector was validated through immunoblotting (Fig. 2H): MEKi+CDK4i administration was able to efficiently impair S6 phosphorylation in control cells, but not in PIK3CAE545K cells which showed a consistent residual S6 activation in both SB2 and WM1366 (Fig. 2G-H). This increase by PIK3CAE545K was accompanied by an enhanced phosphorylation of the direct S6 upstream kinase S6K1 (Fig. 2H), which was not affected by drug treatments. No change in phosphorylation level of the mTOR effector 4E-BP1 was detected. Mechanistically, we highlight that MEK+CDK4i was able to abolish Rb phosphorylation in all cell lines, meaning that PIK3CAE545K did not rescue loss of pRb (Fig. 2H Fig. S4).
Specific S6K1 inhibition re-sensitizes PIK3CAE545K cells to MEKi+CDK4i
S6 is a ribosomal protein, part of the pre-40S subunit. S6 phosphorylation by S6K1 is involved in a plethora of biologic processes including cell proliferation, translation initiation, and metabolic regulation and is known to be activated downstream of the PI3K-mTOR axis (24–26); very little has been studied regarding the specific involvement of S6K1 in drug resistance. As PIK3CAE545K induced an increase in S6K1 activity and consequent S6 phosphorylation, we investigated the effect of pharmacologically inhibiting S6K1 signaling. We first tested inhibition of its upstream regulator mTOR. Consistent with our observations, the combination of MEKi+CDKi and a mTORi (Rapamycin) significantly reduced PIK3CAE545K cell growth, compared to the single and even double combination treatments (MEKi+CDK4i, MEKi+mTORi and CDK4i+mTORi), which were only able to achieve a partial inhibition of cell growth (Fig. 3A-D). Single-agent mTORi did not show any effect (Fig. 3 C-D, Fig. S5A). As S6K1/S6 activity but not p4EBP1 was shown to be increased by PIK3CAE545K, we next asked whether specific inhibition of S6K1 was able to phenocopy the mTORi effect. PF-4708671 is a highly specific S6K1 inhibitor (S6K1i) with a 400-fold selectivity over S6K2 and no activity against 73/75 other kinases; the two showing minimal activity, MSK1 and RSK1, did not show modulation of substrate phosphorylation in cellular assays up to 10μM (27). We found that PF-4708671 was sufficient to resensitize PIK3CAE545K cells to combined MEKi+CDK4i, at a GI50 in the double digit nanomolar range for all three drugs (Fig. 3A-D). PF-4708671 administration as single agent did not elicit any significant effect on any of the tested cell lines (Fig. S5B). We also noted that neither mTORi nor S6K1i elicited an additional effect to MEKi+CDK4i in control GFP or PIK3CAWT cells. (Fig S5C-F). Moreover, MEKi+CDK4i+S6K1i displayed a GI50 >3μM against non-tumorigenic hTert-immortalized human melanocytes (Fig S6). Together, these results demonstrate that the increased efficacy of the triple combination is specific for PIK3CAE545K-expressing cells and is not generically toxic.
Figure 3.
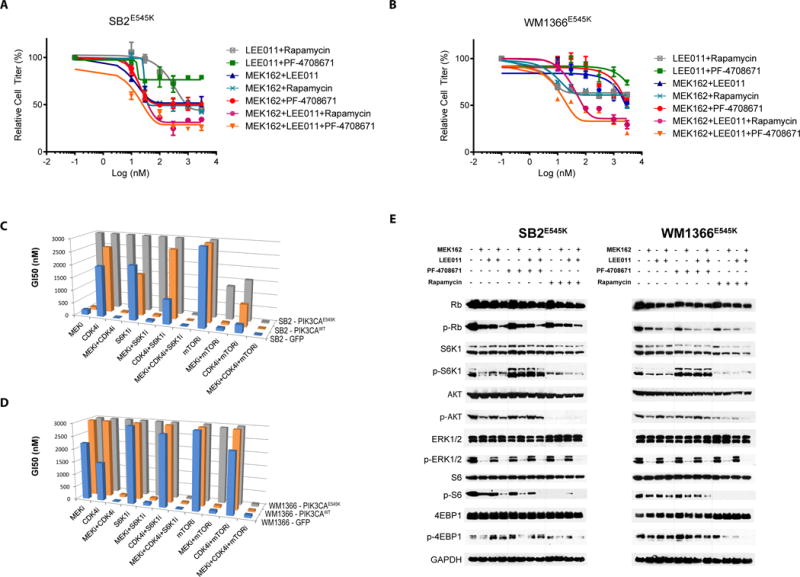
Pharmacological S6K1 inhibition reverses PIK3CAE545K-mediated drug resistance in vitro. A-B) Effect of Rapamycin or PF-4708671 on MEKi and/or CDK4i in PIK3CAE545K-expressing SB2 and WM1366 cell lines. Cell titer is normalized to control group (DMSO 0.01%) cell confluence after 72h of drug treatments. Error bars represent SEM. C,D) Summary of the GI50 for all drugs and drug combinations on all cell lines. E) Western blot assay of selected proteins after 24h of drugs administration (300nM).
Molecular analyses confirmed that mTORi administration was effective and on-target, as both pS6K and pS6 levels were abrogated, as well as p4EBP1; by contrast, S6K1i increased pS6K1, as expected due to feedback loops (27,28) and achieved extinction of pS6 but not p4EBP1 in combination with MEKi+CDK4i (Fig. 3E). Interestingly, neither mTORi nor S6K1i impacted pRb levels with MEKi+CDK4i (Fig. 3E and Fig. S7). Mechanistically, PIK3CAE545K expression suppressed MEKi+CDK4i-induced cell cycle arrest (Fig. 4A-B), but did not prevent the induction of apoptosis (Fig 4 C-D). The addition of S6Ki to MEKi+CDK4i enhanced cell cycle arrest and decreased cell proliferation by propidium iodide and CFSE analysis, respectively, in PIK3CAE545K but not PIK3CAWT -expressing cells (Fig. 4 A-B, Fig. S8, Fig. S9 A-B, and Table S5); by contrast, the addition of S6Ki did not increase apoptosis by Caspase 3/7 activation, Annexin V, or propidium iodide assays in any line (Fig. 4 C-D, Fig. S9 C-D, Fig. S10 and Table S5). These data indicate that PIK3CAE545K induces resistance primarily through abrogating the cell cycle arrest triggered by MEKi+CDK4i, and that adding specific S6K inhibition is sufficient to reinstate the arrest to levels similar to those of the sensitive parental cells (Fig. 4A-B). However, we note that neither pS6 inhibition alone by mTORi/S6Ki nor pRb inhibition alone by MEKi+CDK4i was sufficient to re-induce cell cycle arrest, but only when both targets were inhibited by the triple combination (Fig. 3E, Fig. 4A-B, Fig S7 and Fig. S11).
Figure 4.
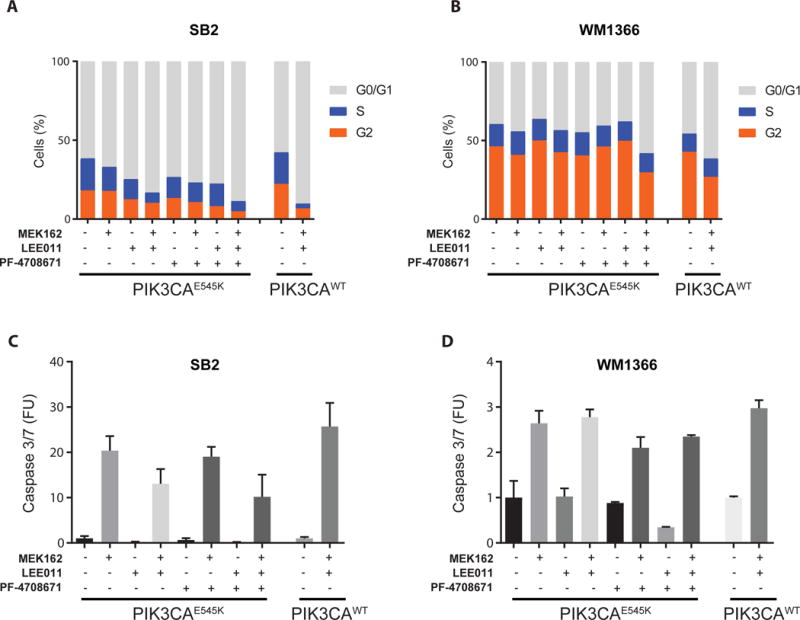
Pharmacological S6K1 inhibition reinstates cell cycle arrest in PIK3CAE545K-expressing cells. A-B) Quantitation of cell cycle phases in PIK3CAE545K- or PIK3CAWT-expressing SB2 and WM1366 cells with the indicated drug treatments, by flow cytometric measurement of propidium iodide 24h after drug treatments (300nM). Representative experiment out of 3 replicates. C-D) Quantitation of apoptosis by measurement of Caspase3/7 activity. FUs are the percentage of apoptotic over total cell confluence after 72h of drug treatments (300 nM). Error bars represent SEM.
S6K1 inhibition reverts PIK3CAE545K–induced resistance to MEKi+CDK4i in vivo
To determine the in vivo translatability of our findings, we next conducted drug dosing experiments in the SB2 xenograft model. SB2-GFP tumors treated with MEKi+CDK4i showed rapid tumor regression leading to multiple complete responses (red line), whereas SB2-PIK3CAE545K tumors did not regress and eventually resumed growth (Fig 5A, purple vs red lines), thus confirming the ability of the PIK3CAE545K mutation to confer resistance to MEKi+CDK4i in vivo. Consistent with our in vitro findings, the addition of S6K1i to the MEKi+CDK4i combination reverted this drug resistance, leading to frank regression and multiple complete responses (Fig 5A, black line). Importantly, none of the drug combinations caused significant weight loss, indicating a lack of generalized toxicity (Fig. 5B).
Figure 5.
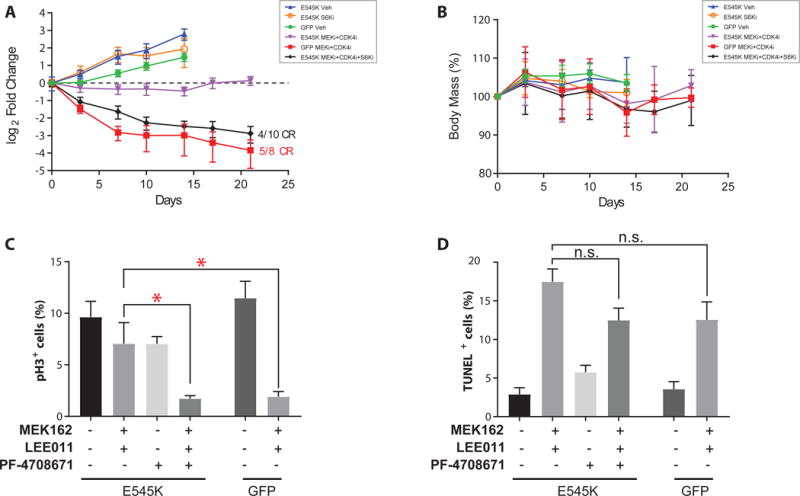
S6K1 inhibition reverts PIK3CAE545K–induced resistance to MEKi+CDK4i in vivo. A) Tumor volumes of SB2 xenograft mouse experiment. GFP- or PIK3CAE545K-expressing tumors were assigned to the treatment gropus indicated in the legend (n≥8). B) Weight chart body mass expressed as % relative to Day 0. Quantification of C) pH3 and D) TUNEL positvity in SB2 tumors after 4d of treatment (n=4). CR=complete response; Asterisks (*) represent p<0.05 in unpaired t-test vs control groups; n.s., not statistically significant. Error bars represent SEM.
To determine the anti-oncogenic mechanism in vivo, we conducted phospho-Histone H3 (pH3) immunohistochemistry and TUNEL assays on tumor sections to assess the impact on cell cycle and apoptosis, respectively. The results confirmed our in vitro observations that PIK3CAE545K subverts MEKi+CDKi-induced cell cycle arrest but not apoptosis and that the addition of S6K1i restores sensitivity primarily by re-inducing cell cycle arrest rather than by inducing apoptosis (Fig 5C-D and Fig S12-S13).
Finally, to confirm clinical relevance, we determined that 5/5 post-resistance patient biopsies at two different timepoints showed increased levels of pS6 by immunohistochemistry compared to pre-treatment samples (Fig. 6A-B). Consistent with our findings, pre-treatment samples from E545K+ regions showed intermediate levels of pS6, while E545K− biopsies were virtually negative (Fig. 6B) Together, these results suggest that S6 phosphorylation downstream of mTOR and S6K1 could lie at a critical nexus of multiple oncogenic signaling cascades, and that S6K1i could be broadly indicated for resistance mechanisms affecting the MAPK, CDK4, and/or PI3K pathways (Fig. 6C).
Figure 6.
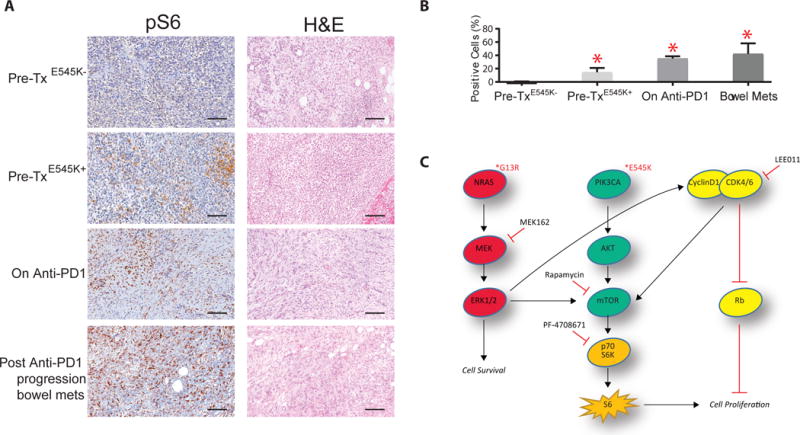
PIK3CAE545K increases pS6 expression levels in patient samples A) Representative pS6 immunohistochemistry and hematoxylin and eosin staining in the patient’s samples: pre-treatment (E545K+ and E545K− regions, n=3 and n=4 respectively), on-anti-PD1 (n=2), and post-PD1-progression (bowel metastasis, n=3); B) Quantification of the pS6 IHC staining signal. Asterisks (*) represent p<0.05 in unpaired t-test vs Pre-treatment group. Error bars represent SEM. C) Schematic of proposed signal transduction pathways culminating in S6- and Rb-mediated control of cell proliferation. Bars represent 100 μm.
Discussion
In this work we present the first study of clinical resistance to combined MEK and CDK4/6 inhibition. We provide evidence that PIK3CAE545K pre-existed in a rare, spatially segregated subpopulation which expanded upon treatment, conferred resistance to the drug combination, and presented a therapeutically vulnerable node at the S6K1-S6 signaling axis. These discoveries were made possible through the longitudinal biopsy of patient tissues and blood, including multi-region tumor sampling allowing for a comprehensive and quantitative assessment of the pre-treatment state. We found that PIK3CAE545K evaded detection in both the clinical and research next generation sequencing assays by virtue of both a low prevalence (0.15% of pre-treatment tumor cells) and a non-uniform distribution across the tumor, leading to 4/7 pre-treatment regions being negative for PIK3CAE545K, even with a ~1000-fold mutant allele enrichment by BDA. To our knowledge, this is the first work in a solid tumor to quantitatively track a rare pre-existing resistant subclone through an extended longitudinal analysis and confirms that such subclones can rapidly expand to become the dominant resistant clone. Specifically, after the acquisition of drug resistance, we estimated the PIK3CAE545K population expanded from a 0.13% to a 10-33% VAF (variant allele frequency), as early as 16 days of MEKi+CD4Ki treatment. We note that this detection level is an order of magnitude more sensitive than previous studies of pre-existing resistance mutations in solid cancers (29–31). All together, these findings strongly suggest that single-region assays of pre-treatment samples likely often miss the detection of rare resistant subpopulations, particularly when their prevalence is very close to the reliable detection limit of even high-coverage assays. Therefore, our data suggest that multi-region sampling within a tumor – which is not routinely performed in pathology or research laboratories – has the potential to reveal the intratumoral heterogeneity of candidate pre-existing resistant subclones (32).
Mechanistically, unbiased RPPA analysis of our cell lines revealed S6 but not 4EBP1 phosphorylation as one of the most strongly downregulated targets downstream of MEKi+CDK4i, being modulated by both drugs singly and synergistically by the combination, consistent with our previous study in colon cancer (23). We show here that PI3KCAE545K subverts this S6K1-S6 signaling axis, leading to revocation of the MEKi+CDK4i-mediated cell cycle arrest – though not the MEKi-mediated apoptosis – ultimately causing drug resistance via continued cell proliferation. Interestingly, PI3KCAE545K did not restore Rb phosphorylation levels abolished by MEKi+CDK4i despite the resumption of proliferation, which was surprising given the central role of pRb in governing entrance into the cell cycle (6). Consistently, inhibition of pS6 by either the mTOR inhibitor rapamycin or the specific S6K1 inhibitor PF-4708671 in the double digit nanomolar range was sufficient to reinstate cell cycle arrest – but only when pRb was also inhibited – and resensitize PI3KCAE545K cells to MEKi+CDK4i (Fig. 4A-B and Fig. S8). In vivo studies further confirmed that PF-4708671 was able to revert the resistance via the restoration of cell cycle arrest and without obvious toxicity. This mechanism is consistent with the known phenotype of liver-specific S6 mouse knockouts having defective liver regeneration via initiation of cell cycle arrest (24). Relevantly, pS6 has previously been described as a key intrinsic resistance biomarker during early BRAF or MEK inhibition in melanoma (33). Our findings on acquired resistance involving the MEK, CDK4/6, and PI3K pathways and sufficiency of the understudied S6K1i drug class (28) to reverse the resistance expand our understanding of the role of S6 in targeted therapy. Together, these findings suggest that pRb and pS6 may cooperate in controlling cancer cell proliferation downstream of multiple pathways (Fig. 6C) and posit the S6K1-S6 axis as a critical drug target node at their convergence, enabling simultaneous inhibition of all three oncogenic pathways at the level of a single shared downstream effector. We also note that activating PIK3CA mutations occur in 20-30% of colon cancer, 1-2% of pancreatic cancer, and 1-3% of NSCLC, cancers which are just beginning MEKi+CDK4i clinical trials.
In summary, our findings shed light on the evolution of tumor resistance from a rare pre-existing subpopulation and lay a blueprint for the functional identification of counter-therapeutic vulnerabilities. Currently, it is unknown the ratio at which acquired resistance mutations in patients arise from de novo versus pre-existing mutations (18,32); this knowledge would be critical as they have different implications for therapeutic management. Our finding that a very low frequency, spatially segregated pre-existing resistance subclone can rapidly expand in response to therapy suggests that such rare subclones may exist more often than previously appreciated. It also argues that comprehensive, high resolution, multi-region sampling is crucial for uncovering such rare subclones; determining how often they exist in the general cancer patient population would provide a foundation from which to rationally strategize detection and differential counter-resistance therapy options. Similarly, a thorough cataloging of potentially effective counter-resistance therapies like MEKi+CDKi+S6K1i would enable the design of preclinical and clinical trials with highly personalized, precision medicine. As targeted therapy in melanoma and other cancers moves steadily towards second- and third-line treatments to overcome acquired resistance to previous regimens, the existence of rare resistant subpopulations prior to therapy argues that improving first-line combination treatments informed by functional studies may pay up-front dividends and extend patient survival.
Methods
Patient tumor samples and imaging
The patient was treated at the UT MD Anderson Cancer Center between October 2013 and January 2015. Patient was enrolled to clinical trial NCT01781572, which was conducted in accordance with the declaration of Helsinki. Tumor samples were obtained from the MD Anderson Cancer Center Department of Pathology archive and Institutional Tumor Bank with appropriate written informed consent. Biopsy collection and analyses were approved by the MD Anderson Cancer Center IRB (PA12-0305). LDH analysis and PET and spiral CT scans were obtained using standard procedures in the UT MD Anderson Cancer Center as part of the routine clinical care of the patient. RECIST 1.1 measurements were performed by a physician formally trained in tumor metrics. A next generation sequencing (NGS)-based analysis for the detection of frequently reported (hotspot) mutations in a total of 46 genes, including the genes requested clinically, was performed on the DNA extracted from the sample in a CLIA-certified molecular diagnostics laboratory.
Sample processing
After fixation and mounting, 5 to 10 slices with 5-μm thickness were obtained from formalin-fixed, paraffin-embedded (FFPE) tumor blocks. Tumor-enriched tissue was macrodissected, and xylene (EMD Millipore) was used for deparaffinization, followed by two ethanol washes. Reagents from the Qiagen QIAamp DNA FFPE Tissue Kit (#56404) were used in conjunction with an overnight incubation at 55°C to complete tissue lysis. Next, samples were incubated at 90°C for 1 hour to reverse formaldehyde modification of nucleic acids. After isolation by QIAamp MinElute column, variable amounts of buffer ATE were added to each column to elute the DNA. Germline DNA was obtained from peripheral blood mononuclear cells. The post-resistance (“post-ipi”) biopsy was exhausted during this procedure, making slides unavailable for IHC or other procedures.
Whole Exome Sequencing analysis
The initial genomic DNA input into the shearing step was 250 ng in 55 μl of low tris-EDTA buffer. Forked Illumina paired-end adapters with random eight–base pair indexes were used for adapter ligation. All reagents used for end repair, A-base addition, adapter ligation, and library enrichment polymerase chain reaction (PCR) were from the KAPA Hyper Prep Kit (#KK8504). Unligated adapter and/or adapter-dimer molecules were removed from the libraries before cluster generation using solid-phase reverse immobilization bead cleanup. The elution volume after postligation cleanup was 25 μl. Library construction was performed following the manufacturer’s instructions. Sample concentrations were measured after library construction using the Agilent Bioanalyzer. Each hybridization reaction contained 650 to 750 ng of the prepared library in a volume of 3.4 μl. Samples were lyophilized and reconstituted to bring the final concentration to 221 ng/μl. After reconstitution, the Agilent SureSelectXT Target Enrichment (#5190-8646) protocol was followed according to the manufacturer’s guidelines. The libraries were then normalized to equal concentrations using an Eppendorf Mastercycler EP Gradient instrument and pooled to equimolar amounts on the Agilent Bravo B platform. Library pools were quantified using the KAPA Library Quantification Kit (#KK4824). On the basis of quantitative PCR quantification, libraries were then brought to 2 nM and denatured using 0.2 N NaOH. After denaturation, libraries were diluted to 14 to 20 pM using Illumina hybridization buffer. Next, cluster amplification was performed on denatured templates according to the manufacturer’s guidelines (Illumina), HiSeq v3 cluster chemistry and flow cells, as well as Illumina’s Multiplexing Sequencing Primer Kit. The pools were then added to flow cells using the cBot System, sequenced using the HiSeq 2000/2500 v3 sequencingby-synthesis method, and then analyzed using RTA v.1.13 or later. Each pool of whole-exome libraries was subjected to paired 76–base pair runs. An eight–base pair index-sequencing read was used to meet coverage and to demultiplex the pooled samples. The mean coverage for exome data was 177×. Sequence data has been deposited at the European Genome-phenome Archive (EGA), which is hosted by the EBI and the CRG, under accession number EGAS00001002846.
Mutation calling
Exome sequencing data were processed using Saturn V, the nextgeneration sequencing data processing and analysis pipeline developed and maintained by the bioinformatics group of the Institute for Applied Cancer Science and Department of Genomic Medicine at the UT MD Anderson Cancer Center. BCL files (raw output of Illumina HiSeq) were processed using Illumina CASAVA (Consensus Assessment of Sequence and Variation) software (v1.8.2) for demultiplexing/conversion to FASTQ format. The FASTQ files were then aligned to the hg19 human genome build using BWA (v0.7.5). The aligned BAM files were subjected to mark duplication, realignment, and recalibration using the Picard tool and GATK software tools. The BAM files were then used for downstream analysis. MuTect (v1.1.4)was applied to identify somatic point mutations. ABSOLUTE algorithm was used to estimate sample purity, ploidy, and absolute somatic copy numbers.
Blocker Displacement Amplification (BDA)
BDA qPCR assays were performed on a CFX96 Touch Real-Time PCR Detection System using 96-well plates (Bio-Rad). In a typical Taq polymerase-based assay, PowerUp SYBR Green Master Mix (Thermo Fisher) was used for enzymatic amplification and fluorescence signal generation; primer concentrations were 400 nM each, and blocker concentration was 4 μM. gDNA sample input was 10 ng per well; reactions were performed in triplicate, and the total volume was 20 μL in each well. Thermal cycling started with a 3 min incubation step at 95_℃ for polymerase activation, followed by 66 repeated cycles of 10 s at 95℃ for DNA denaturing and 30 s at 60℃ for annealing/extension. All amplicon sequences were verified by Sanger sequencing (GeneWiz) to verify mutation identity.
Cell lines and drugs
SB2 and WM1366 human melanoma cell lines were mantained in RPMI1640 supplemented with 10% FBS and Penicillin-Streptomycin (100U/ml – 100 ug/ml). Cells were acquired in 2012. SB2 cells are a kind gift of Dr. Menashe Bar-Eli; WM1366 were acquired from MD Anderson IACS cell bank. Cells were last authenticated in 2016 by T200 sequencing platform. SB2 harbors the following notable mutations: NRASQ61K, DDX3XK35X, RAC1P34H, and a Tert promoter mutation. WM1366: NRASQ61L, DDX3XG123X, RAC1V51M, CDKN2AP24L, NF1P2242L, and a Tert promoter mutation. hTert-immortalized human melanocytes were purchased from ABMGood and maintained in Prigrow II medium supplemented with 10% FBS and Penicillin-Streptomycin (100U/ml – 100 ug/ml). Drugs used were MEK162 (MEK inhibitor, Chemietek), LE0011 (CDK4 inhibitor, Chemietek), Rapamycin (mTOR inhibitor, Selleckem) and PF-4708671 (SK61 inhibitor, Selleckem) at the indicated concentrations.
Cell titer, proliferation and apoptosis assessment
For cell titer, apotposis and CSFE analysis the time-lapse fluorescence microscope system Incucyte was used (Essen Bioscience); 10,000 cells per well were seeded in a 96well plate, allowed to adhere for 24h and then administred with drugs. Cell confluence and fluorescence were recorded at 2h intervals and analyzed using Incucyte Zoom software; cell titer was espressed as the cell confluence measured at the 72h time point after treatment initiation normalized to control treatment (DMSO 0.01%).
For apoptosis assays, IncuCyte™ Annexin V Red Reagent and IncuCyte™ Caspase 3/7 Reagent were used as manifacturer’s instructions. Briefly, Caspase 3/7 reagent (5μM) and Annexin V (1:200) were addded to cells simultaneously with drug treatments; green and red fluorescence were measured every 2h for 72h and percentage of green or red cells was normalized to the percentage of cell confluence and expressed as Fluorescence Units (FU). For CFSE cell proliferation analysis, cell were treated with 5 μM CFSE and incubated at 37°C for 30 minutes. After two washings, cells were seeded and let adhere 24h. Green fluorescence was monitored every 2h. Percentage of CFSE retaining cells was normalized to the percentage of cell confluence.
For Propidium Iodide assays, cells were detached using trypsin and immediately fixed in 70% v/v ethanol at −20°C (24h after treatment start). Cells were then treated with DNAse free RNAse (200μg/ml) and stained with Propidium Iodide (20μg/ml). Fluorescence was assessed using BD Accuri ™. Data were analyzed using FlowJo Software (v10.2).
Plasmids and viral infections
pBabe-puro-HA-PIK3CA and pBabe-puro-HA-PIK3CA-E545K were purchased from Addgene (#12522 and #12525 respectively). Retrovirus were produced by transfecting 293T cells with the expression plasmids and the two packaging vectors VSVG and pHIT60, using PEI (3μg per ug of DNA). Viral supernatants were collected after 72h, filtered though a 0.45μm filter and used to infect target cells in addition with Polybrene (8μg/ml, SantaCruz). After 24h, cells were washed and put under antibiotic selection for 96h (Puromycin 1μg/ml).
RPPA and immunoblotting
Melanoma cell lines were lysed using RIPA buffer additioned with Protease and Phosphatase Inhibitor Cocktail (ThermoFisher Scientific) 24h after the initiation of treatments. For molecular analysis, drug were used at a concentration of 300nM. Protein content was existimated using BCA protein assay (Thermo Fisher Scientific) and resolved by SDS-PAGE on pre-cast mini gels (Invitrogen). Blotting was performed using Trans Blot Turbo Transfer System (BioRad). After blocking, nitrocellulose membranes were incubated with primary antobidy. Primary antibodies used were: Anti mTOR (#2983), Anti-phospho-S2448-mTOR (#5536), Anti-p70-S6 Kinase (#9202), Anti phospho-T389-p70-S6 Kinase (#9234), Anti-AKT (#4691), Anti phospho-S473-Akt (#4060), Anti-Ribosomal-Protein-S6 (#2317), Anti phospho-S235/236-Ribosomal-Protein-S6 (#4858), Anti-Rb (#9309), Anti-phospho-S780-Rb (#8180), Anti-4EBP1 (#9644), Anti-phopsho-T37/46-4EBP1(#2855), Anti-ERK1/2 (#9102), Anti-phospho-T202/Y204-ERK1/2 (#4370), (1:1000, Cell Signaling Technlogy), Anti GAPDH (1:5000, Millipore). The appropriate HRP-conjugated secondary antibody was then applied; chemiluminescent reaction was induced by SuperSignal West Dura Extended Duration Substrate (ThermoFisher Scientific) and then impressed on autoradiographic film. Secondary antibodies used: Anti-rabbit IgG, HRP-linked Antibody (#7074), Anti-mouse IgG, HRP-linked Antibody (#7076) (1:5000, Cell Signaling Technology). RPPA was performed by MD Anderson RPPA core.
ddPCR
DNA was extracted from patient plasma using Qiagen’s QiAmp circulating nucleic acid kit per manufacturer’s instructions. Extracted DNA was eluted in 30 μl low-TE buffer and quantified using Qubit fluorometer (ThermoFisher Scientific). Each sample was run in duplicate. The maximum volume of sample input was used for setting up droplet PCR reaction. The droplets were automatically generated using BioRad’s automatic droplet generator after which they were amplified in a deep well thermocycler. The droplets were read with the BioRad droplet reader and analyzed using the Quantasoft software (BioRad).
Immunohistochemistry and TUNEL assay
FFPE tumor specimens were sectioned with a microtome (5μm sections) and put on slides. After deparaffinization, citrate based antigen retrieval was performed. Blocking was performed using Normal Horse Serum (ImmPRESS Reagent Kit, Vector Labs). Slides were then incubated with Anti phospho-S235/236-Ribosomal-Protein-S6 (#4858, Cell Signaling Technology) or Anti phospho-Histone H3 (#9701, Cell Signaling Technology) primary antibody overnight at 4°C in a humid chamber, avoiding drying of specimens. Slides were then incubated with HRP-conjugated anti-rabbit secondary antibody. Processed slides were finally added with 3,3′-diaminobenzidine (DAB, Vector Laboratories) to develop a chromogenic reaction or TSA™ Plus Fluorescein System (Perkin-Elmer) to allow flourophore deposition, and counter-stained with Hematoxylin (Vector Laboratories) or DAPI respectively. Coverslips were mounted after de-hydration of the sections, using Permanent Mounting Medium (Vector Laboratories). Tunel assay (Biotium) was performed following manifacturer instructions. Images were digitally acquired with ScanScope (Aperio). Images were digitally acquired with ScanScope (Aperio) and Nikon Eclipse T2 microsope connected to DS-Ri2 camera (Nikon). Quantification of IHC and TUNEL assay signal, expressed as number of positive cells/number of total cells, was performed using ImageJ (Rasband, W.S., ImageJ, U. S. National Institutes of Health, Bethesda, Maryland, USA, https://imagej.nih.gov/ij/, 1997-2016.).
Statistical analysis
Data are presented as means ± SEM. For paired or un-paired t-test a p-value<0.05 was considered as significant. For RPPA expression datasets analysis, multiple t-tests were performed with a False Discovery Rate (FDR) of 1%. Statistical analysis was performed using GraphPad Prism (GraphPad Software).
Xenograft studies
SB2-GFP or SB2-E545K cells (5*106) were intra-dermally injected in the flanks of athymic nude female mice (Taconic). Tumor volumes were calculated using electronic calipers to measure the length (l), width (w) and height (h) and using the formula (l × w × h) × π/6. When the tumors reached the average volume of 100mm3, animals were distributed among the treatment groups. MEK162 and PF-4708671 were resuspended in 1% carboxymethylcellulose/0.5% Tween 80; LEE011 was resuspended in 0.5% methylcellulose. Because of different solubility properties of the drugs, LEE011 was always dosed 4h apart from MEK162 and PF-4708671. MEK162 (10 mg/kg, twice a day), LEE011 (100 mg/kg, daily) and PF-4708671 (50mg/kg, daily) were administered by oral gavage using sterile flexible plastic adapters in a volume of 100 μl. Body mass was measured using an electronic scale. Animal were euthanized when the tumor burden reached >1000mm3 or when the tumor became ulcerated. Animals used for molecular analysis, were euthanized 4 days after treatment start. All animal experiments were performed according to protocols approved by the Institutional Animal Care and Use Committees the University of Texas MD Anderson Cancer Center.
Supplementary Material
Significance.
We report the first characterization of clinical acquired resistance to MEKi+CDK4i, identifying a rare pre-existing PIK3CAE545K subpopulation that expands upon therapy and exhibits drug resistance. We suggest that single-region pre-treatment biopsy is insufficient to detect rare, spatially-segregated drug-resistant subclones. Inhibition of S6K1 is able to re-sensitize PIK3CAE545K-expressing NRAS-mutant melanoma cells to MEKi+CDK4i.
Acknowledgments
We thank the Melanoma informatics, tissue resource, and pathology core (MELCORE) for patient samples retrieving and processing. We also thank Gao Zhang and Kate Nathanson for help with WM1366.
Grant Support
The RPPA studies performed at the Functional Proteomics Core Facility at MD Anderson Cancer Center were supported by a National Cancer Institute (NCI) Cancer Center Support Grant (CA-16672). W.R was supported by CPRIT Graduate Scholar Award. M.A.D is supported by Sheldon and Miriam Adelson Medical Research Foundation. M.A.D and A.J.L are supported by the MD Anderson Melanoma Moon Shots Programs. P.S. and D.Y.Z. were supported by grant R01CA203964 from the National Cancer Institute. A.E.A. was supported by NIH/NCI R01 grant CA182635. L.K. was supported by the University of Texas Rising STARS award and the Melanoma Research Alliance Young Investigator Award 508743. L.K and P.A.F. were supported by by NIH/NCI grant 4P01 CA163222-04.
M.A.D. serves on advisory boards for GlaxoSmithKline, Novartis, Roche/Genentech, BristolMyersSquibb, Sanofi-Aventis and he received grant support from GlaxoSmithKline, Roche/Genentech, Sanofi-Aventis, Oncothyreon, Myriad, and Merck. D.Y.Z. is a significant equity owner of Nuprobe Technologies, a startup commercializing BDA. A.E.A. received grant support from Pfizer Inc. L.N.K. received grant support from Array BioPharma.
Footnotes
Conflict of interest disclosures: The other authors declare that no potential conflicts of interest exist.
References
- 1.Curtin JA, Fridlyand J, Kageshita T, Patel HN, Busam KJ, Kutzner H, et al. Distinct sets of genetic alterations in melanoma. The New England journal of medicine. 2005;353:2135–47. doi: 10.1056/NEJMoa050092. [DOI] [PubMed] [Google Scholar]
- 2.Jakob JA, Bassett RL, Ng CS, Curry JL, Joseph RW, Alvarado GC, et al. NRAS mutation status is an independent prognostic factor in metastatic melanoma. Cancer. 2012;118:4014–23. doi: 10.1002/cncr.26724. [DOI] [PMC free article] [PubMed] [Google Scholar]
- 3.Dummer R, Schadendorf D, Ascierto PA, Arance A, Dutriaux C, Di Giacomo AM, et al. Binimetinib versus dacarbazine in patients with advanced NRAS-mutant melanoma (NEMO): a multicentre, open-label, randomised, phase 3 trial. Lancet Oncol. 2017;18:435–45. doi: 10.1016/S1470-2045(17)30180-8. [DOI] [PubMed] [Google Scholar]
- 4.Hodis E, Watson IR, Kryukov GV, Arold ST, Imielinski M, Theurillat JP, et al. A landscape of driver mutations in melanoma. Cell. 2012;150:251–63. doi: 10.1016/j.cell.2012.06.024. [DOI] [PMC free article] [PubMed] [Google Scholar]
- 5.Posch C, Moslehi H, Feeney L, Green GA, Ebaee A, Feichtenschlager V, et al. Combined targeting of MEK and PI3K/mTOR effector pathways is necessary to effectively inhibit NRAS mutant melanoma in vitro and in vivo. Proceedings of the National Academy of Sciences of the United States of America. 2013;110:4015–20. doi: 10.1073/pnas.1216013110. [DOI] [PMC free article] [PubMed] [Google Scholar]
- 6.Kwong LN, Costello JC, Liu H, Jiang S, Helms TL, Langsdorf AE, et al. Oncogenic NRAS signaling differentially regulates survival and proliferation in melanoma. Nat Med. 2012;18:1503–10. doi: 10.1038/nm.2941. [DOI] [PMC free article] [PubMed] [Google Scholar]
- 7.Gao H, Korn JM, Ferretti S, Monahan JE, Wang Y, Singh M, et al. High-throughput screening using patient-derived tumor xenografts to predict clinical trial drug response. Nature medicine. 2015;21:1318–25. doi: 10.1038/nm.3954. [DOI] [PubMed] [Google Scholar]
- 8.Teh JL, Purwin TJ, Greenawalt EJ, Chervoneva I, Goldberg A, Davies MA, et al. An in vivo reporter to quantitatively and temporally analyze the effects of CDK4/6 inhibitor-based therapies in melanoma. Cancer research. 2016 doi: 10.1158/0008-5472.CAN-15-3384. [DOI] [PMC free article] [PubMed] [Google Scholar]
- 9.Sosman JA, Kittaneh M, Lolkema MPJ, Postow MA, Schwartz G, Franklin C, et al. A phase 1b/2 study of LEE011 in combination with binimetinib (MEK162) in patients with NRAS-mutant melanoma: Early encouraging clinical activity. Journal of clinical oncology : official journal of the American Society of Clinical Oncology. 2014 [Google Scholar]
- 10.McGranahan N, Furness AJ, Rosenthal R, Ramskov S, Lyngaa R, Saini SK, et al. Clonal neoantigens elicit T cell immunoreactivity and sensitivity to immune checkpoint blockade. Science (New York, NY) 2016;351:1463–9. doi: 10.1126/science.aaf1490. [DOI] [PMC free article] [PubMed] [Google Scholar]
- 11.Bader AG, Kang S, Vogt PK. Cancer-specific mutations in PIK3CA are oncogenic in vivo. Proceedings of the National Academy of Sciences of the United States of America. 2006;103:1475–9. doi: 10.1073/pnas.0510857103. [DOI] [PMC free article] [PubMed] [Google Scholar]
- 12.Manca A, Lissia A, Capone M, Ascierto PA, Botti G, Caraco C, et al. Activating PIK3CA mutations coexist with BRAF or NRAS mutations in a limited fraction of melanomas. Journal of translational medicine. 2015;13:37. doi: 10.1186/s12967-015-0401-8. [DOI] [PMC free article] [PubMed] [Google Scholar]
- 13.Cancer Genome Atlas N. Genomic Classification of Cutaneous Melanoma. Cell. 2015;161:1681–96. doi: 10.1016/j.cell.2015.05.044. [DOI] [PMC free article] [PubMed] [Google Scholar]
- 14.Russo M, Siravegna G, Blaszkowsky LS, Corti G, Crisafulli G, Ahronian LG, et al. Tumor Heterogeneity and Lesion-Specific Response to Targeted Therapy in Colorectal Cancer. Cancer Discov. 2016;6:147–53. doi: 10.1158/2159-8290.CD-15-1283. [DOI] [PMC free article] [PubMed] [Google Scholar]
- 15.Goyal L, Saha SK, Liu LY, Siravegna G, Leshchiner I, Ahronian LG. Polyclonal Secondary FGFR2 Mutations Drive Acquired Resistance to FGFR Inhibition in Patients with FGFR2 Fusion-Positive Cholangiocarcinoma. Cancer Discov. 2016 doi: 10.1158/2159-8290.CD-16-1000. [DOI] [PMC free article] [PubMed] [Google Scholar]
- 16.Piotrowska Z, Niederst MJ, Karlovich CA, Wakelee HA, Neal JW, Mino-Kenudson M, et al. Heterogeneity Underlies the Emergence of EGFRT790 Wild-Type Clones Following Treatment of T790M-Positive Cancers with a Third-Generation EGFR Inhibitor. Cancer discovery. 2015;5:713–22. doi: 10.1158/2159-8290.CD-15-0399. [DOI] [PMC free article] [PubMed] [Google Scholar]
- 17.Russo M, Misale S, Wei G, Siravegna G, Crisafulli G, Lazzari L, et al. Acquired Resistance to the TRK Inhibitor Entrectinib in Colorectal Cancer. Cancer discovery. 2016;6:36–44. doi: 10.1158/2159-8290.CD-15-0940. [DOI] [PubMed] [Google Scholar]
- 18.Schmitt MW, Loeb LA, Salk JJ. The influence of subclonal resistance mutations on targeted cancer therapy. Nature reviews Clinical oncology. 2016;13:335–47. doi: 10.1038/nrclinonc.2015.175. [DOI] [PMC free article] [PubMed] [Google Scholar]
- 19.Bhang HE, Ruddy DA, Krishnamurthy Radhakrishna V, Caushi JX, Zhao R, Hims MM, et al. Studying clonal dynamics in response to cancer therapy using high-complexity barcoding. Nat Med. 2015;21:440–8. doi: 10.1038/nm.3841. [DOI] [PubMed] [Google Scholar]
- 20.Heydt C, Kumm N, Fassunke J, Kunstlinger H, Ihle MA, Scheel A, et al. Massively parallel sequencing fails to detect minor resistant subclones in tissue samples prior to tyrosine kinase inhibitor therapy. BMC Cancer. 2015;15:291. doi: 10.1186/s12885-015-1311-0. [DOI] [PMC free article] [PubMed] [Google Scholar]
- 21.Misale S, Yaeger R, Hobor S, Scala E, Janakiraman M, Liska D, et al. Emergence of KRAS mutations and acquired resistance to anti-EGFR therapy in colorectal cancer. Nature. 2012;486:532–6. doi: 10.1038/nature11156. [DOI] [PMC free article] [PubMed] [Google Scholar]
- 22.Wu LR, Chen SX, Wu Y, Patel AA, Zhang DY. Multiplexed enrichment of rare DNA variants via sequence-selective and temperature-robust amplification. Nature Biomedical Engineering. 2017;1:714–23. doi: 10.1038/s41551-017-0126-5. [DOI] [PMC free article] [PubMed] [Google Scholar]
- 23.Lee MS, Helms TL, Feng N, Gay J, Chang QE, Tian F, et al. Efficacy of the combination of MEK and CDK4/6 inhibitors in vitro and in vivo in KRAS mutant colorectal cancer models. Oncotarget. 2016 doi: 10.18632/oncotarget.9153. [DOI] [PMC free article] [PubMed] [Google Scholar]
- 24.Volarevic S, Stewart MJ, Ledermann B, Zilberman F, Terracciano L, Montini E, et al. Proliferation, but not growth, blocked by conditional deletion of 40S ribosomal protein S6. Science. 2000;288:2045–7. doi: 10.1126/science.288.5473.2045. [DOI] [PubMed] [Google Scholar]
- 25.Nawroth R, Stellwagen F, Schulz WA, Stoehr R, Hartmann A, Krause BJ, et al. S6K1 and 4E-BP1 are independent regulated and control cellular growth in bladder cancer. PloS one. 2011;6:e27509. doi: 10.1371/journal.pone.0027509. [DOI] [PMC free article] [PubMed] [Google Scholar]
- 26.Kurebayashi Y, Nagai S, Ikejiri A, Ohtani M, Ichiyama K, Baba Y, et al. PI3K-Akt-mTORC1-S6K1/2 axis controls Th17 differentiation by regulating Gfi1 expression and nuclear translocation of RORgamma. Cell reports. 2012;1:360–73. doi: 10.1016/j.celrep.2012.02.007. [DOI] [PubMed] [Google Scholar]
- 27.Pearce Laura R, Alton Gordon R, Richter Daniel T, Kath John C, Lingardo L, Chapman J, et al. Characterization of PF-4708671, a novel and highly specific inhibitor of p70 ribosomal S6 kinase (S6K1) Biochemical Journal. 2010;431:245–55. doi: 10.1042/BJ20101024. [DOI] [PubMed] [Google Scholar]
- 28.Grasso S, Tristante E, Saceda M, Carbonell P, Mayor-Lopez L, Carballo-Santana M, et al. Resistance to Selumetinib (AZD6244) in colorectal cancer cell lines is mediated by p70S6K and RPS6 activation. Neoplasia. 2014;16:845–60. doi: 10.1016/j.neo.2014.08.011. [DOI] [PMC free article] [PubMed] [Google Scholar]
- 29.Su KY, Chen HY, Li KC, Kuo ML, Yang JC, Chan WK, et al. Pretreatment epidermal growth factor receptor (EGFR) T790M mutation predicts shorter EGFR tyrosine kinase inhibitor response duration in patients with non-small-cell lung cancer. Journal of clinical oncology : official journal of the American Society of Clinical Oncology. 2012;30:433–40. doi: 10.1200/JCO.2011.38.3224. [DOI] [PubMed] [Google Scholar]
- 30.Lee Y, Lee GK, Lee YS, Zhang W, Hwang JA, Nam BH, et al. Clinical outcome according to the level of preexisting epidermal growth factor receptor T790M mutation in patients with lung cancer harboring sensitive epidermal growth factor receptor mutations. Cancer. 2014;120:2090–8. doi: 10.1002/cncr.28711. [DOI] [PubMed] [Google Scholar]
- 31.Morelli MP, Overman MJ, Dasari A, Kazmi SM, Mazard T, Vilar E, et al. Characterizing the patterns of clonal selection in circulating tumor DNA from patients with colorectal cancer refractory to anti-EGFR treatment. Annals of oncology : official journal of the European Society for Medical Oncology / ESMO. 2015;26:731–6. doi: 10.1093/annonc/mdv005. [DOI] [PMC free article] [PubMed] [Google Scholar]
- 32.Amirouchene-Angelozzi N, Swanton C, Bardelli A. Tumor Evolution as a Therapeutic Target. Cancer discovery. 2017 doi: 10.1158/2159-8290.CD-17-0343. [DOI] [PubMed] [Google Scholar]
- 33.Corcoran RB, Rothenberg SM, Hata AN, Faber AC, Piris A, Nazarian RM, et al. TORC1 Suppression Predicts Responsiveness to RAF and MEK Inhibition in BRAF-Mutant Melanoma. Science Translational Medicine. 2013;5:196ra98. doi: 10.1126/scitranslmed.3005753. [DOI] [PMC free article] [PubMed] [Google Scholar]
Associated Data
This section collects any data citations, data availability statements, or supplementary materials included in this article.