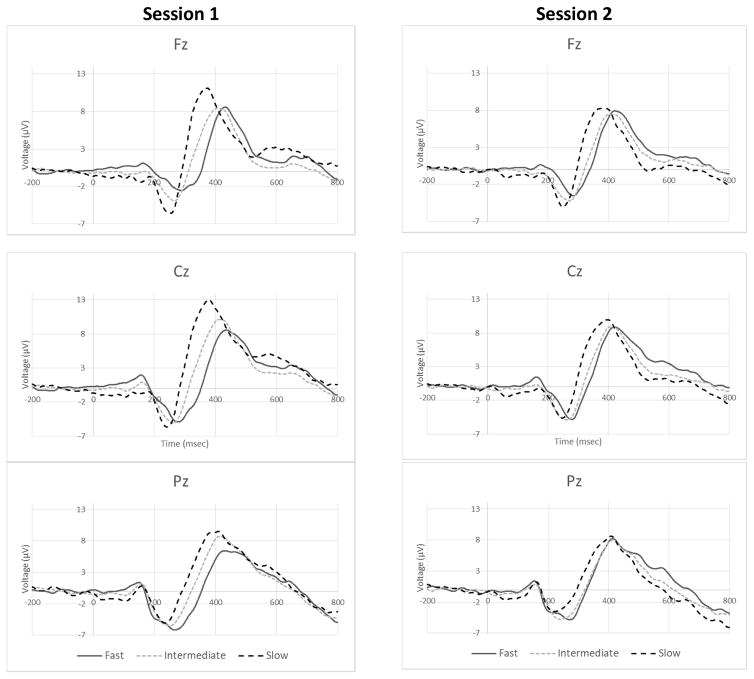
Fig. 3.
Baseline Grand Mean STOP ERPs. Grand Mean STOP ERPs at electrode locations Fz (Top), Cz (Middle), and Pz (Bottom) are displayed for each of the 3 SSD groups for Baseline Session 1 (Left) and Session 2 (Right). Each waveform reflects application of the modified ADJAR decontamination procedure.

