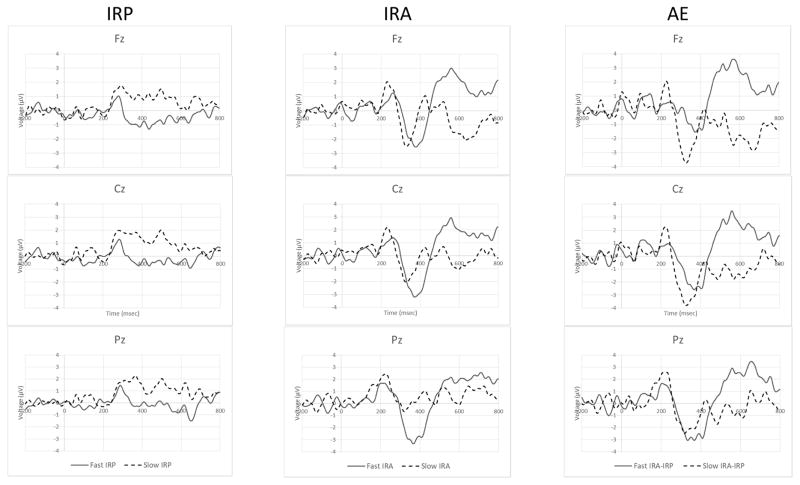
Fig. 5.
Differences of Grand Mean STOP ERPs. Tempero-spatial differences between FAST and SLOW SSD groups in the initial responses to placebo administration (IRP), initial responses to alcohol exposure at 60mg/dL (IRA), and the alcohol effect (AE) calcualted as the difference of differences (IRA-IRP)are displayed. None of these signals were actually measured and the comparison is meant only to illustrate group effects observed in association with alcohol exposure.

