

Abstract
Therapeutic mesenchymal stromal cells (MSCs) are attractive in part due to their immunomodulatory properties, achieved by their paracrine secretion of factors including prostaglandin E2 (PGE2). Despite promising pre-clinical data, demonstrating clinical efficacy has proven difficult. The current studies were designed to develop approaches to pre-induce desired functions from naïve MSCs and examine MSC donor variability, two factors contributing to this disconnect. MSCs from six human donors were pre-activated with interleukin 1 beta (IL-1β) at a concentration and duration identified as optimal or interferon gamma (IFN-γ) as a comparator. Their secretion of PGE2 after pre-activation and secondary exposure to pro-inflammatory molecules was measured. Modulation of tumor necrosis factor alpha (TNF-α) secretion from M1 pro-inflammatory macrophages by co-cultured pre-activated MSCs was also measured. Our results indicated that pre-activation of MSCs with IL-1β resulted in upregulated PGE2 secretion post exposure. Pre-activation with IL-1β or IFN-γ resulted in higher sensitivity to induction by secondary stimuli compared to no pre-activation. While IL-1β pre-activation led to enhanced MSC-mediated attenuation of macrophage TNF-α secretion, IFN-γ pre-activation resulted in enhanced TNF-α secretion. Donor variability was noted in PGE2 secretion and upregulation and the level of improved or impaired macrophage modulation.
Keywords: Immunomodulation, Interleukin 1 Beta, Macrophages, Mesenchymal Stromal Cells, Prostaglandin E2, Donor Variability
INNOVATION
Our results support the development of pre-activation protocols to direct desired MSC functions and describe an approach to quantify donor variability for functionally specific MSC responses. They additionally underscore the need for multi-metric characterization of MSCs as isolated culture metrics may not be sufficient to predict efficacy in a more complex system.
BACKGROUND
Mesenchymal stromal cells (MSCs) are a heterogeneous population of adult stem-like cells commonly isolated from various tissues including bone marrow, adipose tissue, placenta and umbilical cord1. They are identified by their adherence to tissue culture plastic, tri-lineage (osteogenic, adipogenic, chondrogenic) differentiation, and surface marker expression2 and are attractive as a cellular therapeutic in part due to their spectrum of potentially beneficial functions, such as immunomodulation. Many of these functions are achieved primarily by paracrine secretion of bioactive molecules3. The action of MSC-secreted immunomodulatory factors on target effector cells is an integral part of MSC-mediated functional improvements in many autoimmune and inflammatory conditions and tissue trauma4.
An abundance of promising pre-clinical data has led to a multitude of clinical trials to investigate the safety and efficacy of MSC administration for a number of diseases, conditions, and traumatic injuries5–8. Demonstrating significant clinical success, however, has been more difficult6,9,10, and many studies have demonstrated failure or low efficacy6,7,11,12. This disconnect between successful translation of MSC therapy from animal models to clinical applications is likely multifactorial and may include donor variability, which has been observed in functional assessments of MSCs13–24. Furthermore, therapeutically exploitable properties of MSCs are not spontaneous or constitutive, but are induced by cues within their microenvironment4,25,26. For activation by soluble factors, MSC phenotype is dictated by multiple parameters, including the type of activating molecule, its prevalence/concentration, duration/timing of exposure, and whether it is in combination with another factor(s)27. MSC pre-activation (also referred to as conditioning, pre-conditioning, pre-stimulation, pre-treatment, and priming) has gained momentum as a potential tool to increase the efficacy of MSC therapies for specific conditions28. Reports of pre-activation of MSCs with cytokines/growth factors24,29–45 and toll like receptor (TLR) ligands31,41,43,44,46–50 describe some improved outcomes in animal models of disease35,38,51–55. Nevertheless, the approach has not been systematically evaluated with respect to optimization of exposure time, factor concentration, functional characterization, or the effect of donor variability on MSC functional changes. Furthermore, it is difficult to compare activation or pre-activation approaches given the disparity in factor selection, exposure time or MSC-mediated outcome changes.
We previously identified interleukin (IL)-1β and lipopolysaccharide (LPS) as optimal activators of MSC prostaglandin E2 (PGE2) secretion and subsequent attenuation of inflammatory M1 macrophage tumor necrosis factor (TNF)-α secretion using a flexible high throughput design of experiments approach56. The current studies were designed to develop a more controlled approach to optimize pre-activating agents for the functional stimulation of MSCs from 6 different donors. Their functional responses, namely PGE2 secretion and attenuation of macrophage TNF-α secretion, were compared. Our results indicated that IL-1β pre-activation led to increased sensitivity of the MSCs to secondary inflammatory stimuli and enhanced their ability to attenuate inflammatory macrophage TNF-α. While interferon (IFN)-γ pre-activated MSCs were also more sensitive to secondary stimuli with respect to PGE2 secretion, these MSCs were not optimal in reducing inflammatory macrophage function. Variability amongst the donors was noted in the absolute levels of secreted PGE2, the degree of PGE2 upregulation compared to no pre-activation, and the level of improvement or impairment in macrophage modulation induced by IL-1β or IFN-γ pre-activation. Our results demonstrate the need for multi-metric characterization of MSCs as isolated culture metrics may not be sufficient to predict efficacy in a more complex system. In addition our studies describe an approach to quantify donor variability for functionally specific MSC responses.
METHODS
Chemicals and reagents
All cell culture reagents and growth factors were purchased from Life Technologies (Carlsbad, CA), unless otherwise stated. Cytokines were purchased from R&D Systems (Minneapolis, MN). LPS was purchased from InvivoGen (San Diego, CA).
Cell culture
All cells were maintained in a humidified 37°C incubator with 5% CO2 and cultured in the indicated basal medium supplemented with 10% fetal bovine serum (FBS) purchased from Life Technologies or Atlanta Biologics (Flowery Branch, GA), 2 mM L-glutamine, 100 U/mL penicillin, and 100 μg/mL streptomycin, with additional or alternative supplements added as indicated.
MSCs
Human bone marrow-derived MSCs were purchased at passage 1 from the Institute for Regenerative Medicine (donors 1–4, Texas A&M College of Medicine, Temple, TX) or donated at passage 2 from Extem, Inc. (donors 5–6, San Francisco, CA). Donor information is summarized in Table 1. Differentiation assays and surface molecule expression analysis by flow cytometry to validate the identity of the cells as MSCs were performed by the supplier. MSCs at passage 2–3 were thawed and seeded as a monolayer culture in 175 cm2 flasks at 1.5 × 10⁴ cells/mL. They were cultured in MEM-α containing no deoxy- or ribonucleosides, additionally supplemented with 1 ng/mL basic fibroblast growth factor (bFGF). The cells were grown to 70% confluence, detached with trypsin, seeded into 96-well plates at 2 × 10³/well, 48-well plates at 3 × 10³ cells/well, or transwell inserts (0.4 μm pore size polyester membrane, Corning, Lowell, MA) at 5 × 10⁴ cells/transwell, as required for specific experiments, and allowed to attach overnight. Experiments were set up using MSCs at passage 3–5 and fully supplemented RPMI 1640 medium.
Table 1.
MSC donor information provided by the supplier.
| Surface marker (% positive) | |||||||||||||
|---|---|---|---|---|---|---|---|---|---|---|---|---|---|
| Donor ID | Supplier | Sex | Age | Tri-lin. diff.a | CD44 | CD73 | CD90 | CD105 | CD166 | CD14 | CD34 | CD45 | HLA-DR |
| 1 | Texas A&M | M | 28 | ✓ | 99.20% | 99.13% | 99.27% | 99.27% | 99.39% | 0.06% | 0.14% | 0.14% | 3.18% |
| 2 | Texas A&M | F | 29 | ✓ | 93.97% | 97.56% | 96% | 99.04% | 97.97% | 0.05% | 0.13% | 0.18% | 1.48% |
| 3 | Texas A&M | M | 22 | ✓ | 99.51% | 99.99% | 100% | 100% | 100% | 0.28% | 0.04% | 0.67% | 1.51% |
| 4 | Texas A&M | F | 23 | ✓ | 99.28% | 99.99% | 99.97% | 99.99% | 99.97% | 0.01% | 0.03% | 0.31% | 1.18% |
| 5 | Extem, Inc. | M | 28 | ✓ | 97% | 100% | 100% | 100% | 100% | <1% | <1% | <1% | <1% |
| 6 | Estem, Inc. | F | 27 | ✓ | 99% | 100% | 100% | 100% | 98% | <1% | <1% | <1% | <1% |
Tri-lineage differentiation into adipogenic, ostrogenic, chondrogenic.
Macrophages
CD14+ monocytes were isolated from human peripheral blood from healthy adult donors (The Blood Center of New Jersey, East Orange, NJ; New York Blood Center, Long Island City, NY), differentiated to generate macrophages as described previously56, and cryopreserved. Macrophages at passage 1 were thawed, seeded into 24-well plates at 5 × 10⁴ cells/well, and allowed to attach overnight.
MSC activation and pre-activation
Culture medium of MSCs seeded into 96-well plates at 2 × 10³/well or 48-well plates at 3 × 10³ cells/well was replaced with fully supplemented RPMI 1640 medium with or without activation factors (IL-1β, LPS, IFN- γ, or TNF-α, as specified) for the specified duration, after which supernatants were collected and frozen at −80°C or discarded. In pre-activation experiments, activated MSCs were thoroughly washing with fresh medium 3 times prior to adding fresh medium with or without activation factors. Supernatants were collected after the specified durations and frozen at −80°C. The pre-activation experimental schematics are outlined in Fig. 1.
Figure 1.
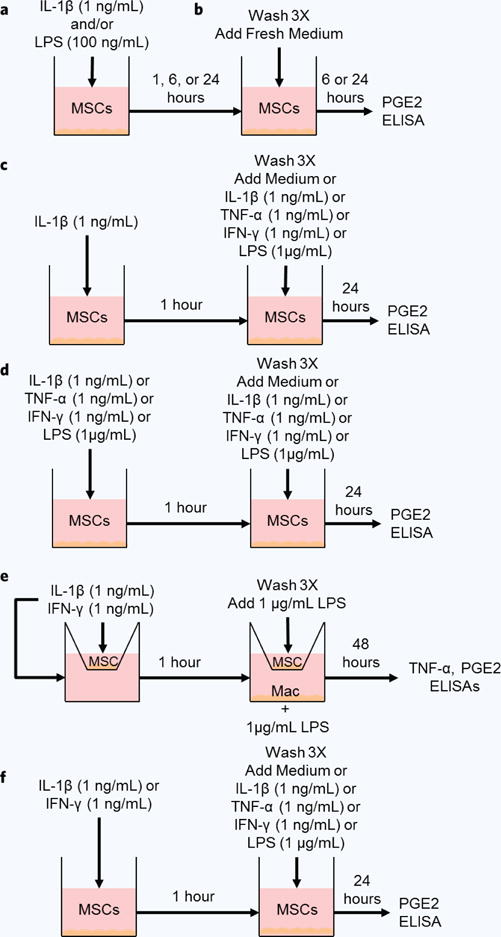
Experimental schematics. (a) MSC culture medium was replaced by medium without or with IL-1β, LPS or both for 1, 6, or 24 hours. (b) Pre-activated cell culture supernatants were replaced by fresh medium for 6 or 24 hours. (c) MSC culture medium was replaced by medium without or with IL-1β for 1 hour. Pre-activated cell culture supernatants were replaced by fresh medium without or with IL-1β, TNF-α, IFN-γ, or LPS for 24 hours. (d) MSC culture medium was replaced by medium without or with IL-1β, TNF-α, IFN-γ, or LPS for 1 hour. Pre-activated cell culture supernatants were replaced by fresh medium without or with the same factor. (e) MSC transwell culture medium was replaced by medium without or with IL-1β or IFN-γ for 1 hour, and then transwells were washed and transferred to macrophage cultures with LPS for 48 hours. (f) MSC culture medium was replaced by medium without or with IL-1β or IFN-γ for 1 hour. Pre-activated cell culture supernatants were replaced by fresh medium without or with IL-1β, TNF-α, IFN-γ, or LPS for 24 hours.
MSC/macrophage co-culture
MSC transwell cell culture medium was replaced with fully supplemented RPMI 1640 medium with activation factors for 1 hour. After thoroughly washing apical and basolateral chambers with fresh medium 3 times, fully supplemented RPMI 1640 medium with LPS (1 μg/mL) was added to the transwell apical chamber. In conditions containing both macrophages and MSCs, fully supplemented RPMI 1640 medium with LPS (1 μg/mL) was added to both the apical and basal chambers. Macrophage cell culture medium was replaced with fully supplemented RPMI 1640 medium with or without LPS (1 μg/mL) and MSC transwell inserts were added to LPS conditions. Basolateral supernatants were collected after 48 hours and frozen at −80°C.
Cell counting
After cell culture supernatants were collected and stored at −80°C, MSCs were fixed in 4% (w/v) paraformaldehyde (PF) for 20 minutes at room temperature and stored in 1% (w/v) PF at 4°C until further use. The nuclei of fixed monolayer MSCs stained with Hoechst and counted via microscopic imaging, as previously described56. Alternatively, cell culture supernatants were collected, stored at −80°C, and replaced with fully supplemented RPMI 1640 medium containing Alamar blue (Molecular Probes, Life Technologies, Carlsbad, CA) according to the manufacturer’s instructions. In parallel, a standard curve was created by seeding MSCs into a 48-well plate at 3 × 10³, 6 × 10³, 1.2 × 10⁴, or 2.4 × 10⁴ cells/well and allowing the cells to attach overnight. MSC cell culture medium was replaced with fully supplemented RPMI 1640 medium containing Alamar blue. Fluorescent Alamar blue readings were recorded after 4 hours of incubation using a microplate reader (DTX 880 Multimode Detector, Beckman Coulter, Fullerton, CA), and the standard curve was used to calculate cell number.
Cytokine measurement
Cell culture supernatants were thawed and analyzed using an enzymatic immunoassay for PGE2 (Cayman Chemical, Ann Arbor, MI), enzyme-linked immunosorbent assays (ELISAs) for TNF-α, IL-1β, and IFN-γ (Biolegend, San Diego, CA), and a bead-based 27 multiplex immunoassay (Bio-Plex Pro Human Cytokine Group I, Bio-Rad Laboratories Inc., Hercules, CA), according to the manufacturer’s instructions. Absorbances were recorded using microplate readers and data was analyzed in Matlab software version R2013b (MathWorks, Natick, MA) or Microsoft Excel (Microsoft, Redmond, WA).
Statistical analysis
Data points represent the mean ± standard error of the mean (SEM) for the indicated number of independent observations (n). Statistical differences between the conditions were determined using Student’s t test or analysis of variance (ANOVA) followed by Fisher’s least significant difference (LSD) post hoc analysis in KaleidaGraph software version 4.1 (Synergy Software, Reading, PA, USA). P values < 0.05 were considered significant. Pearson’s correlation coefficients (r) between donor age and PGE2 or TNF-α were calculated and scatter plots were generated in Microsoft Excel. Two-tailed t tests-based post hoc power analysis with α = 0.05 was performed on the metrics for the set of donors using the difference between 2 dependent means for matched pairs in G*Power software version 3.1.9.2 (University of Kiel, Kiel, Germany57).
RESULTS
Pre-activation optimization
We previously identified IL-1β and LPS, individually and in combination, as optimal inducers of MSC PGE2 secretion and subsequent attenuation of M1 macrophage TNF-α secretion56. In order to optimize the concentration of each of these activating factors for maximal PGE2 secretion, donor 1 MSCs were incubated with increasing doses of IL-1β (0.1, 1, or 10 ng/mL) and/or LPS (10, 100, 1000 ng/mL) and PGE2 secretion was quantified after 6, 24, and 48 hours. After 6 hours of activation, dose dependent effects of IL-1β (Fig. 2a) and LPS (Fig. 2b) were observed. PGE2 levels increased when the concentration of IL-1β or LPS increased from 0.1 to 1 ng/mL or 10 to 100 ng/mL, respectively. Further increasing the concentration of either factor did not further increase PGE2 secretion. Temporally, PGE2 levels were higher after 24 hours of activation, but plateaued at 48 hours. Notably, 100 ng/mL LPS induced more PGE2 secretion in 6 hours than did 10 ng/mL in 48 hours. Overall, IL-1β induced PGE2 secretion more potently than did LPS, which is consistent with our previous results56. Therefore, we next determined if LPS could be optimized to synergistically upregulate MSC PGE2 secretion with 1 ng/mL IL-1β. LPS in combination IL-1β significantly increased MSC PGE2 secretion for all time points and LPS concentrations (Fig. 2c). However, 100 ng/mL LPS combined with 1 ng/mL IL-1β, induced more PGE2 secretion in 24 hours than 1 ng/mL IL-1β alone did in 48 hours.
Figure 2.
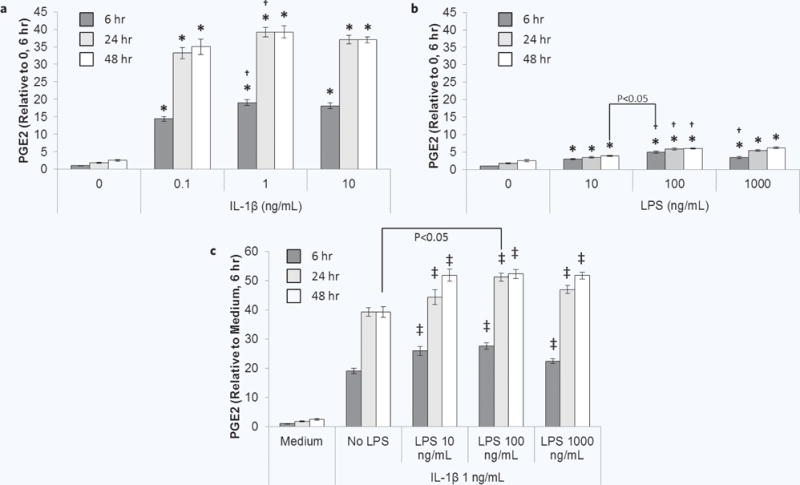
Dose response of MSC PGE2 secretion to IL-1β and LPS. MSCs were cultured without or with increasing doses of (a) IL-1β, (b) LPS, or (c) IL-1β + LPS for 6 (dark grey bars), 24 (light grey bars), or 48 hours (white bars) and then analyzed for PGE2. Data are the mean ± SEM for PGE2 normalized to cell number and medium control (0 ng/mL) at 6 hours for n = 6 replicates. *p < 0.05 compared to 0 ng/mL; †p < 0.05 compared to previous dose by ANOVA and Fisher’s LSD; ‡p < 0.05 compared to No LPS by ANOVA and Fisher’s LSD. Other statistical comparisons were performed using Student’s t test.
Based on the results of the dose response studies, 1 ng/mL IL-1β +/− 100 ng/mL LPS were used to activate donor 1 MSCs for 1, 6, or 24 hours (experimental schematic, Fig. 1a). After only 1 hour of exposure, MSCs upregulated their release of PGE2 in response to IL-1β (Fig. 3a). Further increases in PGE2 secretion with the addition of LPS became apparent starting at 6 hours of exposure (Fig. 3b) and became significant and synergistic after 24 hours of exposure (Fig. 3c). To determine if activation leads to sustained upregulated PGE2 secretion after removing the activating factor, activated MSC culture media were replaced by fresh medium for 6 or 24 hours (experimental schematic, Fig. 1b). LPS pre-activation of MSCs for 1 or 24 hours did not have a large effect on PGE2 secretion at 6 hours (Fig. 3d) or 24 hours (Fig. 3e) post-activation; miniscule yet significant increases in PGE2 from LPS pre-activated MSCs compared to MSCs without pre-activation were only seen when the cells were pre-activated for 6 hours. Pre-activation by IL-1β with or without LPS for 1, 6, or 24 hours resulted in sustained upregulation of PGE2 secretion compared to MSCs without pre-activation at both 6 and 24 hours post-activation. As cells proliferated from 6 to 24 hours post-activation, levels of PGE2 per cell decreased while still remaining upregulated compared to MSCs without pre-activation. Pre-activation for just 1 hour with 1 ng/mL IL-1β alone was sufficient to achieve a high level of sustained upregulated PGE2 post-activation. Therefore, these parameters were used for all subsequent studies.
Figure 3.
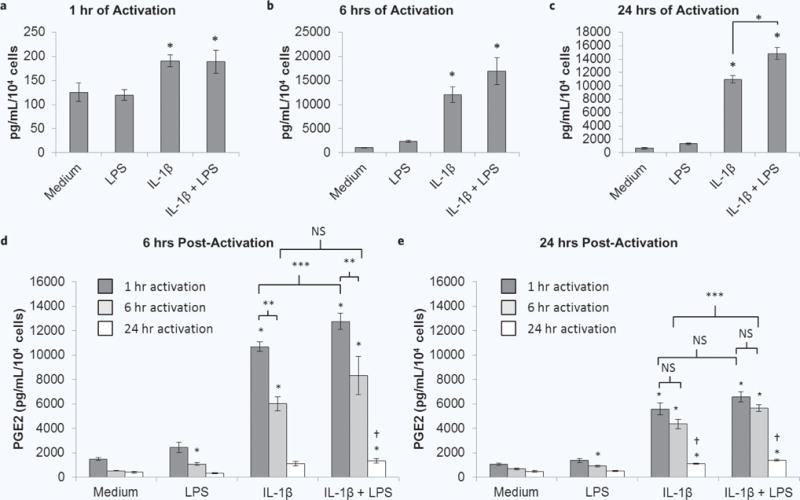
MSC PGE2 secretion at the end of the activation period and over time post-activation. MSCs were cultured without or with IL-1β, LPS or both for (a) 1, (b) 6, or (c) 24 hours. These supernatants were collected and analyzed for PGE2. Supernatants of MSCs that were activated by IL-1β, LPS or both for 1 (dark grey bars), 6 (light grey bars), or 24 (white bars) hours were replaced by fresh medium for (b) 6 or (c) 24 hours, which was collected and analyzed for PGE2. Data are the mean ± SEM for PGE2 normalized to cell number for n = 6 replicates. *p < 0.05 compared to medium by Student’s t test; **p < 0.05 by Student’s t test; ***p < 0.05 by ANOVA and Fisher’s LSD; †p < 0.05 compared to 1 or 6 hours of pre-activation by ANOVA and Fisher’s LSD.
We also used a bead-based multiplex immunoassay to quantify 27 analytes in MSC supernatants at the end of the 1 hour pre-activation and post-activation periods (Supplementary Fig. 1). Out of the 27 probed secreted factors, 15 were detectable in MSC supernatants at the end of the 1 hour activation period and included chemokines, pro-inflammatory, anti-inflammatory/trophic, and pleiotropic molecules (Supplementary Fig. 1a). MSCs that were exposed to IL-1β for 1 hour had significant release of IL-8, monocyte chemoattractant protein (MCP)-1, TNF-α, IL-1RA, fibroblast growth factor (FGF)-basic, vascular endothelial growth factor (VEGF), granulocyte-colony stimulating factor (G-CSF), and IL-6 at the end of the activation period compared to MSCs without pre-activation. At both 6 (Supplementary Fig. 1b) and 24 hours (Supplementary Fig. 1c), secretion of IL-8 and IL-6 remained highly upregulated from IL-1β pre-activated MSCs. TNF-α was also detectable at these time-points but at very low levels. Secretion of IL-1RA remained significantly upregulated from IL-1β pre-activated MSCs at 6 hours post-activation.
Secondary stimulation of pre-activated MSCs
After demonstrating that MSCs sustain upregulated secretion of PGE2 and other factors after brief pre-activation with IL-1β, we next determined whether this pre-activated population of MSCs is more sensitive to secondary stimuli found in an inflammatory environment. Donor 1 MSCs were pre-activated with IL-1β for 1 hour and then supernatants were replaced with fresh medium without or with 1 ng/mL IL-1β, 1 ng/mL TNF-α, 1 ng/mL IFN-γ, or 1 μg/mL LPS for 24 hours (experimental schematic, Fig. 1c). Consistent with previous results, IL-1β pre-activated MSCs exhibited upregulated PGE2 secretion when exposed to fresh medium (Fig. 4a). The upregulation was further enhanced when IL-1β pre-activated MSCs were then stimulated with TNF-α, IFN-γ, or LPS compared to MSCs stimulated with these secondary factors without pre-activation. Interestingly, PGE2 secretion from MSCs pre-activated with IL-1β and secondarily exposed to IL-1β again was not different than the response of MSCs with no pre-activation.
Figure 4.
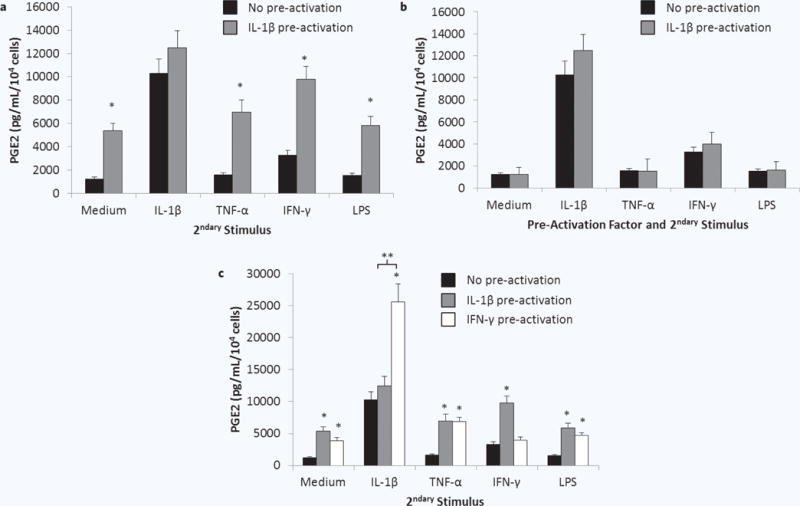
Sensitivity of pre-activated MSCs to pro-inflammatory secondary stimuli. MSCs were cultured (a) without (black bars) or with (grey bars) IL-1β for 1 hour, (b) without (black bars) or with (grey bars) IL-1β, TNF-α, IFN-γ, or LPS, or (c) without (black bars) or with IL-1β (grey bars) or IFN-γ (white bars) for 1 hour. Pre-activated cell culture supernatants were replaced by fresh medium without or with IL-1β, TNF-α, IFN-γ, or LPS for 24 hours. PGE2 was quantified in the resulting supernatants. Data are the mean ± SEM for secreted PGE2 level normalized to cell number for n = 9 replicates. *p < 0.05 compared to MSCs without pre-activation by Student’s t test; **p < 0.05 by Student’s t test.
To determine if the lack of enhanced PGE2 secretion from IL-1β pre-activated MSCs in response to a second dose of IL-1β is specific to this cytokine, the experiment was repeated using TNF-α, IFN-γ, or LPS as pre-activators as well as secondary stimuli (experimental schematic, Fig. 1d). No enhancement in PGE2 secretion was observed for MSCs pre-activated and secondarily stimulated with the same factor (Fig. 4b). When exposed to the rest of the panel of pro-inflammatory secondary stimuli (experimental schematic, Fig. 1d), the secretion of PGE2 from TNF-α or LPS pre-activated MSCs was not different from MSCs that were not pre-activated (data not shown). IFN-γ pre-activated MSCs, however, did exhibit enhanced PGE2 secretion in response to IL-1β, TNF-α, and LPS (Fig. 4c). Further, the secretion of PGE2 in response to secondary exposure to IL-1β was dramatically enhanced.
Pre-activated MSC modulation of macrophage TNF-α
After determining that the population of IL-1β pre-activated cells was more sensitive to secondary inflammatory stimuli, we next tested the MSC pre-activation protocol in a functional assay. Due to the results observed in the previous study, IFN-γ pre-activated MSCs were also evaluated. Donor 1 MSCs in transwell inserts were pre-activated with IL-1β or IFN-γ for 1 hour and then co-cultured with macrophages in the presence of 1 μg/mL LPS for 48 hours (experimental schematic, Fig. 1e). Without pre-activation, MSCs attenuated macrophage TNF-α secretion by 31% (Fig. 5a). Pre-activation of the MSCs with IL-1β resulted in enhanced macrophage modulation, attenuating TNF-α secretion by 54%. Surprisingly, IFN-γ pre-activation of MSCs not only failed to enhance MSC-mediated attenuation of macrophage TNF-α, but these cells performed slightly worse than MSCs without pre-activation (24% attenuation of TNF-α secretion, Fig. 5a). PGE2 levels in the co-culture supernatants (Fig. 5b) complemented the trends in TNF-α levels, with IL-1β pre-activated MSC conditions containing the highest amount of PGE2, followed by MSCs without pre-activation and then IFN-γ pre-activated MSCs.
Figure 5.
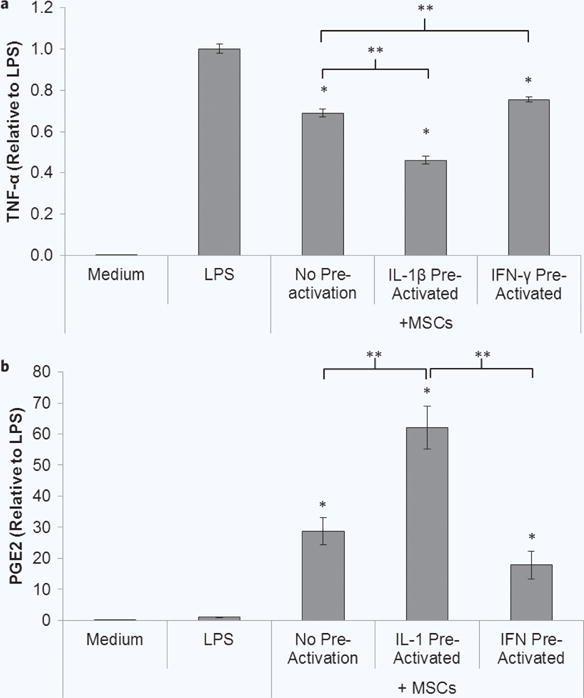
Pre-activated MSC modulation of macrophages. (a) MSCs in transwells were cultured without or with IL-1β or IFN-γ for 1 hour, and then transwells were washed and transferred to macrophage cultures with LPS for 48 hours. Co-culture supernatants were analyzed for (a) TNF-α and (b) PGE2. Data are the mean ± SEM for secreted level normalized to the LPS control for n = 9–19 replicates. *p < 0.05 compared to LPS by Student’s t test. **p < 0.05 determined by Student’s t test.
Donor variability response to secondary pro-inflammatory stimuli
The secretory response, upon reintroduction into a simulated pro-inflammatory environment after pre-activation, was assessed for MSCs derived from 6 healthy adult donors. MSCs were pre-activated with IL-1β or IFN γ for 1 hour and then supernatants were replaced with fresh medium without or with IL-1β, TNF-α, IFN-γ, or LPS for 24 hours (experimental schematic, Fig. 1f). The major trends observed for donor 1 were similar for the other donors (Fig. 6). While all donors exhibited upregulated PGE2 secretion after pre-activation with IL-1β or IFN-γ, there were quantitative PGE2 secretion differences when comparing IL-1β or IFN-γ -pre-activated MSCs in response to IFN-γ, TNF-α, or LPS. Upregulation of PGE2 for IFN-γ pre-activated MSCs in response to IL-1β was most dramatic for donors 1 and 2, followed by donors 4 and 5. This was not as pronounced for donor 3.
Figure 6.
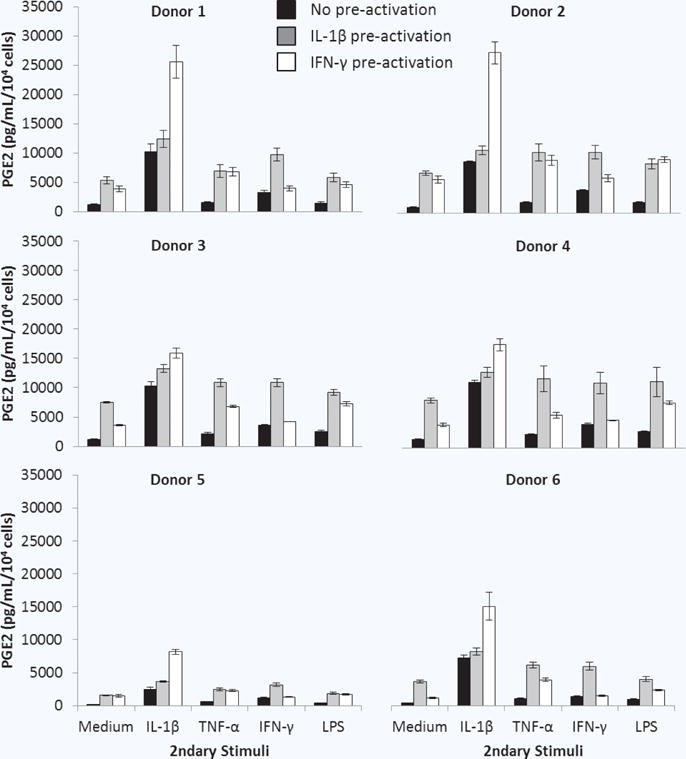
Response of pre-activated MSCs from multiple donors to secondary pro-inflammatory stimuli. MSCs were cultured without (black bars) or with IL-1β (grey bars) or IFN-γ (white bars) for 1 hour. PGE2 was quantified 24 hours after pre-activated cell culture supernatants were replaced by fresh medium without or with IL-1β, TNF-α, IFN-γ, or LPS. Data are the mean ± SEM for PGE2 normalized to cell number for n = 3 (Donors 2–6) or n = 9 (Donor 1) replicates.
To obtain a condensed view of the donor variability in these results, a box and whisker plot was generated for the donor pool (Fig. 7a). MSCs without pre-activation had the least amount of variability in PGE2 levels across the donors constitutively and in response to pro-inflammatory stimuli, despite the extremely low value observed for donor 5 in response to IL-1β. After pre-activation, the variability in PGE2 secretion amongst the donors increased.
Figure 7.
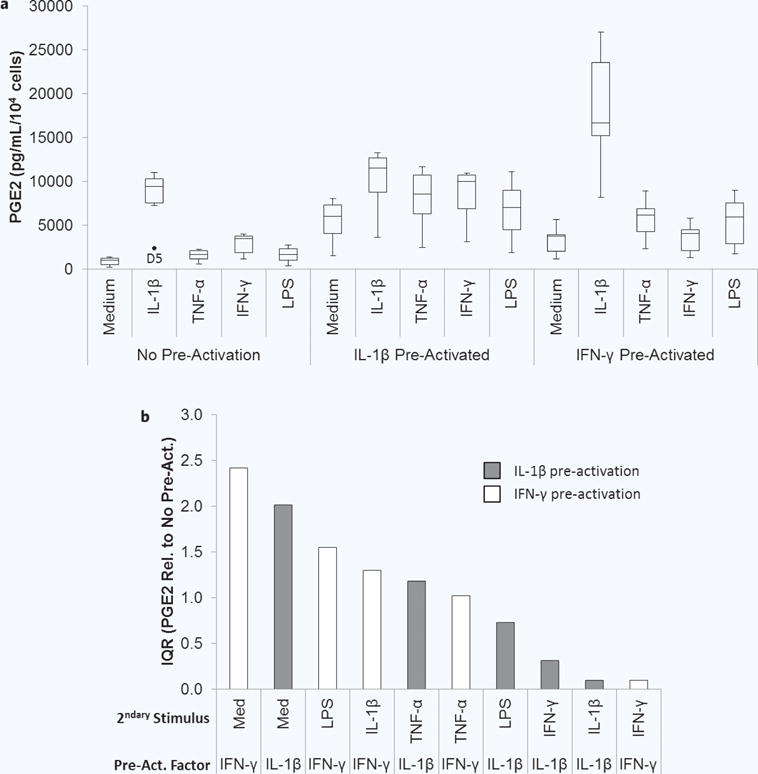
Two donor variability in pre-activated MSC response to secondary pro-inflammatory stimuli. (a) Box and whisker plots display the minimum, first quartile, median (second quartile), third quartile, maximum, and outliers in the normalized PGE2 level secreted by the donors for each activation condition. (b) The interquartile range (IQR) is the difference between the first and third quartile and is plotted for the fold change in PGE2 compared to no pre-activation for each activation condition in the order of highest to lowest (grey bars are IL-β pre-activated; white bars are IFN-γ pre-activated).
The fold changes in PGE2 compared to no pre-activation were also calculated to determine if the relative upregulation of PGE2 was similar amongst the donors, simply at different quantitative levels. To more quantitatively describe the variability, the interquartile range (IQR), which describes spread in the data, was calculated for each condition and then plotted in order from highest to lowest (Fig. 7b). The IQRs for this metric varied greatly amongst the activation conditions, with both the highest and lowest IQRs being observed for IFN-γ pre-activated MSCs. This indicates that the degree of upregulation, in addition to the quantitative PGE2 levels, varied amongst donors in an activation condition-dependent manner.
Pre-activated MSC donor variability and modulation of macrophage TNF-α
The performance of the IL-1β and IFN-γ pre-activation protocol across the set of donors was next evaluated in the MSC/macrophage co-culture assay (experimental schematic, Fig. 1e). All donors were tested using a single macrophage donor, to prevent convolution of the results by macrophage donor variability.
MSCs from all 6 donors were able to significantly re duce TNF-α without pre-activation, with MSCs from donor 4 achieving the greatest baseline attenuation (Fig. 8), and similarly trended towards further reduction with IL-1β pre-activation and diminished attenuation with IFN-γ pre-activation. PGE2 levels present in the co-culture supernatants varied greatly amongst the donors, but all trended toward higher PGE2 in IL-1β pre-activated conditions and lower PGE2 in IFN-γ pre-activated conditions, compared to no pre-activation. This variability was again visually condensed using box and whisker plots. The variability in relative PGE2 levels was relatively large, with donor 6 exhibiting extreme highs (Fig. 9b). Despite this, variability in the relative TNF-α level was lower (Fig. 9a).
Figure 8.
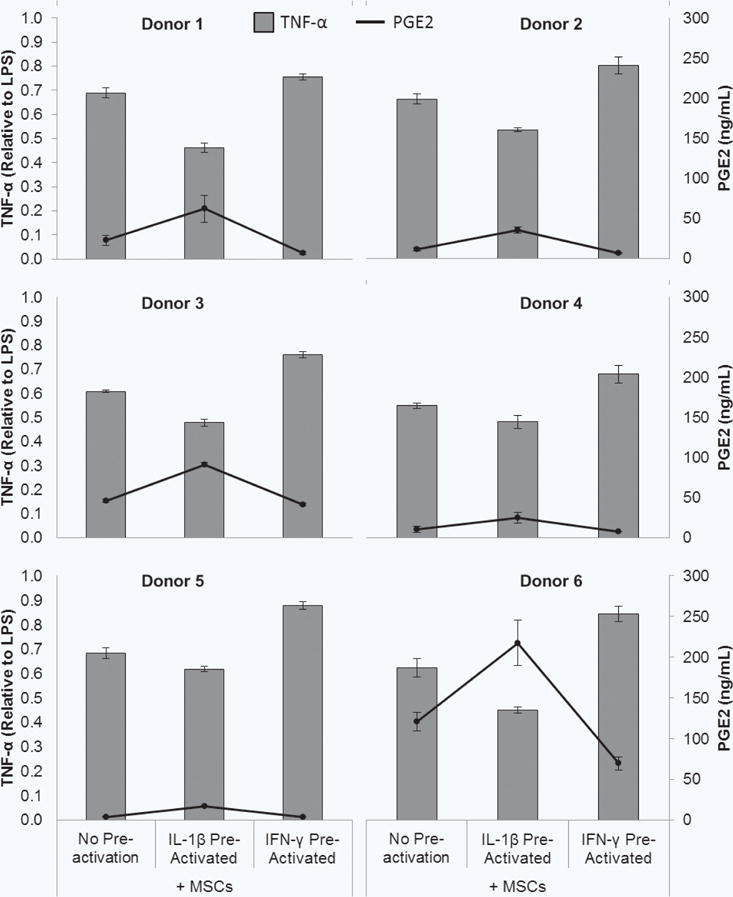
Pre-activated MSC modulation of macrophages. (a) MSCs in transwells were cultured without or with IL-1β or IFN-γ for 1 hour, and then transwells were washed and transferred to macrophage cultures with LPS for 48 hours. (b) Co-culture supernatants were analyzed for TNF-α (grey bars) and PGE2 (black circles/line). Data are the mean ± SEM for secreted level the LPS control for n = 3 (Donors 2–5) or n = 9–19 (Donor 1) replicates.
Figure 9.
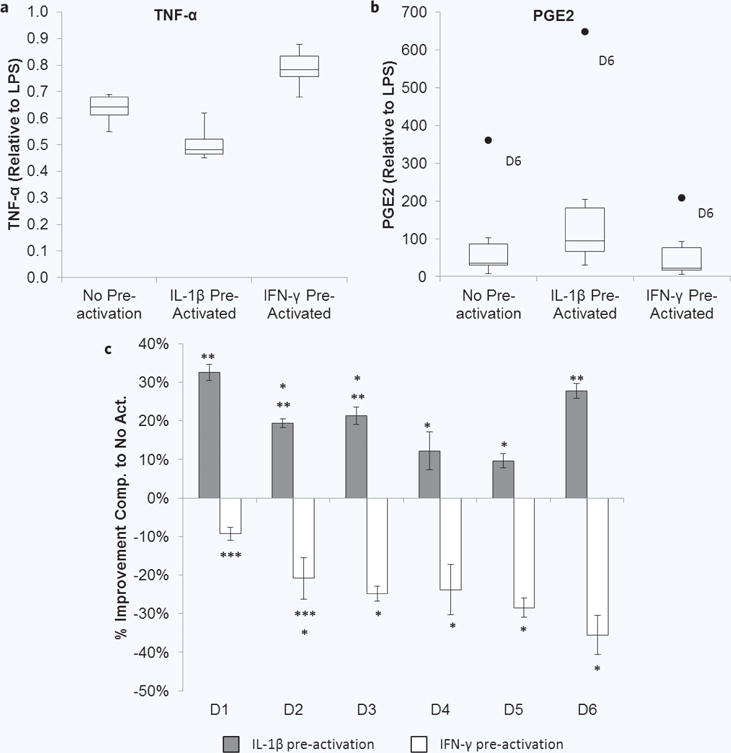
Donor variability in pre-activated MSC modulation of macrophages. Box and whisker plots display the minimum, first quartile, median (second quartile), third quartile, maximum, and outliers in the (a) TNF-α level (normalized to LPS) and (b) PGE2 (normalized to LPS) present in the co-cultures for each activation condition. (c) Comparison of percent improvement in TNF-α reduction imparted by pre-activation. Improvement in attenuation of TNF-α was determined using the percent change in relative TNF-α level for IL-1β pre-activated (grey bars) and IFN-γ pre-activated (white bars) MSC conditions compared to no pre-activation for each donor. Negative values indicate impaired attenuation of TNF-α. *p < 0.05 compared to donor 1, **p < 0.05 compared to donor 5, ***p < 0.05 compared to donor 6 by ANOVA with Fisher’s LSD.
To further tease out the performance of each donor, the improvement in macrophage modulation was determined by calculating the percent change in relative TNF-α level for IL-1β pre-activated and IFN-γ pre-activated MSC conditions compared to no pre-activation (Fig. 9c). MSCs from donors 1 and 6 had similar levels of improvement with IL-1β pre-activation which were the highest in the group. MSCs from donor 5, and similarly donor 4, exhibited the least amount of improvement after pre-activation with IL-1β. Donor 1 MSCs also exhibited the least amount of diminished macrophage modulation after pre-activation with IFN-γ. MSCs from donors 3–5 and particularly donor 6 showed the largest impairment of macrophage modulation after pre-activation with IFN-γ.
No significant correlations were observed between age and PGE2 secretion in response to pro-inflammatory stimuli after pre-activation (Supplementary Fig. 2) or relative TNF-α levels in MSC/macrophage co-culture supernatants (Supplementary Fig. 3). Similarly, no significant differences were detected in these metrics between male and female donors (Supplementary Fig. 4).
To determine the statistical power of the metrics used to test the performance of the successful IL-1β pre-activation protocol, power analyses were performed using the difference in means for pre-activation and no pre-activation averaged across the 6 donors used. The power of measuring the enhanced response of IL-1β pre-activated MSCs in response to secondary stimulation with TNF-α, IFN-γ, and LPS was calculated to be very high (>0.96, Supplementary Table 1), as was the power of detecting enhanced attenuation of macrophage TNF-α secretion (0.98, Supplementary Table 2). Enhanced PGE2 content in the MSC/macrophage co-cultures had less statistical power (0.76, Supplementary Table 3).
DISCUSSION
In the present studies we developed a pre-activation protocol for the enhancement of MSC-mediated modulation of M1 inflammatory macrophages by PGE2. We further characterized the pre-activated MSCs after reintroduction into pro-inflammatory environments in isolated culture and in co-cultures with macrophages. We found that brief (1 hour) exposure of MSCs to IL-1β (1 ng/mL) induced PGE2 secretion that remained upregulated after pre-activation and was enhanced upon exposure to pro-inflammatory stimuli. IL-1β pre-activation enhanced MSC-mediated attenuation of macrophage TNF-α secretion in co-culture, which was simultaneous with increases in PGE2. However, we also observed donor variability in MSC responses to activation, which may indicate the need to screen MSC populations for patient specific therapies.
IL-1β pre-activation produced a population of MSCs that was more sensitive to secondary inflammatory stimuli as indicated by enhanced PGE2 secretion. IL-1β activates several intermediate intracellular signaling molecules including mitogen-activated protein kinases (MAPKs) which lead to activation of transcription factors activator protein 1 (AP-1) and nuclear factor kappa B (NF-κB)58. Transcriptional activity of these factors increases expression of cyclooxygenase-2 (COX-2) and subsequent enzymatic production of PGE259. The secondary stimuli TNF-α and LPS also activate some of the same pathways as IL-1β via different receptors, thereby perhaps additively increasing the activity of their overlapping pathways60,61.
Interestingly, PGE2 secretion from IL-1β activated MSCs was also enhanced by secondary exposure to IFN-γ, a type II interferon, which signals primarily through signal transducer and activator of transcription 1 (STAT1). IFN-γ has also previously been reported to increase COX-2 expression and secretion of PGE2 from MSCs34,62. The promotor region for COX2 contains binding sites for both STAT1 and NF-κB63. Conflicting data has been reported regarding the interaction of STAT1 with NF-κB and COX-264 and the effect of IFN-γ on COX-2 activity and PGE2 secretion65 in different cell types. Incubation of IFN-γ with IL-1β for 48 hours antagonized IL-1β-induced PGE2 secretion. However, several studies have shown that IFN-γ activated STAT1 can synergize with NF-κB activated by molecules including LPS, TNF-α, and IL-166,67. This could explain the enhanced secretion of PGE2 that was also seen from IFN-γ pre-activated MSCs after secondary exposure to IL-1β, TNF-α, or LPS. Held et al. reported that IFN-γ priming of RAW 264.7 cells for 30 minutes resulted in increased NF-κB binding to DNA when secondarily stimulated with IL-1 or TNF-α68. The dramatic increase observed for secondary exposure to IL-1β in our results could be due to “head-start” elicitation of STAT1 combined with the already high potency of IL-1β in inducing PGE2.
Pre-activation with IL-1β or IFN-γ and then secondary stimulation with the same cytokine did not enhance PGE2 secretion compared to the response of MSCs with no pre-activation to those factors. The same was true for pre-activation with LPS or TNF-α. This suggests autocrine regulatory mechanisms that dampen the activity of stimuli over time. IL-1β has several known regulatory mechanisms. Attenuation of the response to IL-1β could be the result of a combination of decreased of expression of the signaling receptor (IL-1R1) or its accessory protein (IL-1RAcP), increased expression of the non-signaling receptor (IL-1R2), and induced expression of IL-1RA69. We observed that IL-1RA was induced by IL-1β during the 1 hour activation period and 6 hours post-activation. IFN-γ can negatively regulate its activity by decreasing recycling and surface expression of its receptor (IFNGR1), dephosphorylation of intracellular signaling intermediates, and induction of suppressor of cytokine signaling 1 (SOCS-1), which inhibits signaling by interfering with janus kinase 1/2 (JAK1/2)66. These mechanisms could also hold the key to why 1 hour of pre-activation was optimal. In addition to dilution of PGE2 induction by cell proliferation, extension of the pre-activation duration to 6 and 24 hours may allow time for autoregulatory mechanisms to reach their peak effect. This type of characterization sheds light not only on what phenotypic changes the pre-activation factor induces, but also how the cells might react after reintroduction into an inflammatory microenvironment, where they will be imparting their therapeutic benefits. Current pre-activation studies in the literature often stop at characterizing the cells only at the end of the pre-activation period and therefore may miss the opportunity to detect unexpected phenotypic changes.
The results discussed above were observed in isolated cultures of MSCs manipulated with a single molecule at a time in order to tease out specific effects. When IL-1β pre-activated MSCs were tested in the more complex, dynamic macrophage co-culture assay, we observed that they enhanced MSC-mediated attenuation of macrophage TNF-α secretion, as predicted based on the PGE2 results in isolated culture. The supernatants from these co-cultures also contained more PGE2. In tangentially continuing to explore the unexpected results of IFN-γ pre-activation, we saw that the promising observation of dramatically enhanced PGE2 secretion after IL-1β stimulation of IFN-γ pre-activated MSCs did not translate into enhanced performance in the co-culture assay. IFN-γ pre-activation of the MSCs resulted in higher TNF-α levels and lower PGE2 content compared to MSCs with no pre-activation. Analysis of the macrophage secretome and the secretome of isolated cultures of MSCs with secondary stimulation by cocktails of macrophage secreted factors or macrophage conditioned medium may shed additional light on the response of IFN-γ pre-activated MSCs to more complex inflammatory environments. If the observed phenomena are true, this IFN-γ MSC pre-activation protocol, while not optimal for reducing macrophage mediated inflammation, could be useful in treating cancer, as it has been reported that MSCs genetically engineered to secrete IFN-γ exerted anti-tumor effects in a nude mouse model of lung carcinoma by persistent activation of TNF-related apoptosis-inducing ligand (TRAIL)70.
We also compared the IL-1β pre-activation protocol on MSCs derived from 6 human donors. These donors consisted of equal numbers of healthy males and females between 20 and 30 years of age. The cells all met the ISCT minimum criteria for MSCs, but this does not guarantee equipotency. This was demonstrated in the variability observed amongst the donor set for the key metrics identified (response to secondary stimuli after pre-activation and modulation of macrophage TNF-α secretion in co-culture). In examining PGE2 secretion from the MSCs in response to secondary stimuli after pre-activation, we observed activation condition-dependent degrees of variability. The least amount of variability was seen when the MSCs were stimulated with inflammatory molecules without pre-activation. After pre-activation with either IL-1β or IFN-γ and exposure to these molecules, variability in the secreted PGE2 level and in the degree of PGE2 upregulation compared to no pre-activation was increased, with the highest variability being seen in IFN-γ pre-activated conditions.
Differences between donors were also observed in the baseline (no pre-activation) levels of macrophage TNF-α attenuation and the degree of enhancement or impairment of this function imparted by IL-1β or IFN-γ pre-activation, respectively. Performance in the isolated MSC culture assays did not consistently correlate with performance in the co-culture assay. MSCs from donor 5 and 6 had the lowest PGE2 secretion in the isolated culture assays. While MSCs from donor 5 also had the least improvement in macrophage TNF-α modulation after IL-1β secretion and the lowest co-culture PGE2 levels, MSCs from donor 6 exhibited one of the highest improvements and highest co-culture PGE2 levels. This again speaks to the need for both isolated culture and more complex assays in identifying suitable MSCs donors. Additionally, the statistical power with which differences between pre-activated and non-activated MSCs were detectable was higher for the metric of PGE2 secretion in response to secondary stimuli than PGE2 content in the MSC-macrophage co-cultures. Therefore, discretion must also be used when selecting suitable metrics to base identification of suitable donors upon.
These studies focused on PGE2 secretion and macrophage TNF-α secretion as metrics to characterize the effectiveness of pre-activated MSC in modulating M1 macrophage behavior. In our previous studies, fractional factorial design of experiments was used observe the effects of 13 different MSC-secreted factors on macrophage TNF-α secretion and CD206 expression71. Analysis of the high throughput screen results demonstrated that while IDO and IL-4 increased CD206 expression, PGE2 was the dominant factor in simultaneous suppression of TNF-α secretion and elevation of CD206 expression. We also demonstrated that PGE2 controlled both M1 attenuation and M2 macrophage phenotype promotion via distinct pathways. PGE2 binding to EP4 receptors activates the PI3k pathway which inhibits NF-kβ simulation of pro-inflammatory cytokines such as TNF-α and the cAMP pathway which leads to downstream activation of CREB signaling, and ultimately to the transcription of genes associated with the M2 macrophage phenotype71. Other MSC-secreted factors have been shown to modulate macrophage phenotype, including interleukin 1 receptor antagonist (IL1RA), transforming growth factor (TGF)-β, and tumor necrosis factor stimulated gene 6 (TSG6)25,72–74. Therefore the active components within the co-cultures should be teased out with further experimentation, especially when also evaluating other alternative M2 anti-inflammatory functions. Furthermore, in order to be clinically meaningful, the effects must translate to increased efficacy in vivo. Therefore MSCs pre-activated using our identified set of parameters must be tested in relevant animal models of disease. Future studies should also continue to examine additional relevant metrics, such as macrophage IL-10 secretion and surface marker expression, to identify optimal metrics that not only further describe the in vitro phenomenon but also correlate with improved performance in vivo.
While the donor pool in this study was relatively small, power analyses showed that the sample size was large enough to accurately detect changes in response to secondary stimuli and macrophage modulation after pre-activation with high statistical power. This analysis is affected, however, by several factors including the effect size75. The effect sizes in our metrics were large, meaning they could be noted in the data without extensive searching. Therefore while sufficient for this analysis, this effect size consideration also increases the motivation to expand the donor pool. Additionally, the MSCs used in these studies were all derived from donors characterized as “healthy” by the supplier. There is conflicting evidence as to whether MSCs derived from disease or injured donors exhibit impaired functions compared to MSCs from healthy donors76–85. Variability also exists amongst potential recipients of the MSCs in terms of disease type and state as well as concurrent or previous treatments14. These points together have implications for both autologous and allogeneic uses of MSCs and motivate future investigations to evaluate the performance our MSC pre-activation protocols across several macrophage donors as well as MSC donors for personalized therapeutic strategies.
In conclusion, we optimized an IL-1β MSC pre-activation protocol to attenuate pro-inflammatory M1 macrophage properties and demonstrated quantitative variability among the MSC donors. In addition, our parallel exploration of IFN-γ pre-activation demonstrated that using a single metric in isolated cultures may be insufficient to predict performance in a more complex, dynamic microenvironment. This has implications for suggestions in the field, for example, to use IFN-γ induction of indoleamine 2,3-dioxygenase (IDO) as a single metric to characterize MSC potency. While this may be predictive in treating diseases dominated by T cell responses, our approach to link activation mechanisms with other functional cell outputs can be tailored to develop a variety of disease-specific MSC potency assays and to select optimal donors for patient specific treatment. This is especially true since predictability continues to be a challenge in the clinical translation of MSC therapies, with a large proportion of patients being “non-responders”. We believe that pre-activation is a promising approach to enhance the performance of MSCs in the clinic in order to decrease the proportion of “non-responders”. Furthermore, the disappointing clinical success rate has bolstered support for developments in precision medicine, to identify treatments that are likely to work for an individual patient. The variability seen in our studies support this point. Therefore, our approach may offer new clinically translatable options in designing more precise MSC therapies. For instance, for third-party “off-the-shelf” allogeneic therapies, it could be used as a screening assay to identify MSC donor lots that demonstrate in vitro effectiveness after pre-activation for a particular patient and using the patient’s own immune cells. Alternatively, the patient’s own MSCs and immune cells could be used in the assay to determine if the patient is a candidate for autologous pre-activated MSC therapy.
Supplementary Material
Acknowledgments
The authors would like to acknowledge Dr. Serom Lee and Dr. Mehdi Ghodbane for their assistance with the multiplex immunoassay. The authors would also like to thank Extem Inc. for their donation of MSCs. This work was supported by the New Jersey Commission for Spinal Cord Injury [10-2947-SCR-R-0]; the New Jersey Commission for Brain Injury Research [CBIR12IRG019]; the National Institutes of Health (Ruth L. Kirschstein National Research Service Award [T32 GM8339] from the National Institute of General Medical Sciences); the National Science Foundation [0801620]; and the United States Department of Education [P200A100096].
ABBREVIATIONS
- AP-1
Activator protein 1
- ANOVA
Analysis of variance
- COX2
Cyclooxygenase-2
- ELISA
Enzyme linked immunosorbant assay
- bFGF
Fibroblast growth factor basic
- GCSF
Granulocyte colony stimulating factor
- IDO
Indoleamine 2,3-dioxygenase
- IFN-γ
Interferon gamma
- IFNGR1
Interferon gamma receptoy 1
- IL-6
Interleukin 6
- IL-β
Interleukin 1 beta
- IL-1R1, IL-1R2
Interleukin 1 receptor 1 and 2
- IL-1RAcP
Interleukin 1 receptor accessory protein
- IL-1RA
Interleukin 1 receptor antagonist
- IL-8
Interleukin 8
- JAK 1/2
Janus kinase 1/2
- LSD
Least significant difference
- LPS
Lipopolysaccharide
- MSC
Mesenchymal stromal cells
- MEM-α
Minimum essential medium alpha
- MAPK
Mitogen-activated protein kinases
- MCP-1
Monocyte chemoattractant protein 1
- NF-κB
Nuclear factor kappa B
- PF
Paraformaldehyde
- PGE2
Prostaglandin E2
- RPMI
Roswell Park Memorial Institute medium
- STAT-1
Signal transducer and activator of transcription 1
- SEM
Standard error of the mean
- TLR
Toll like receptor
- TGF-β
Transforming growth factor beta
- TNF-α
Tumor necrosis factor alpha
- TSG-6
Tumor necrosis factor stimulated gene 6
- VEGF
Vascular endothelial growth factor
References
- 1.Keating A. Mesenchymal stromal cells: New directions. Cell Stem Cell. 2012;10(6):709–716. doi: 10.1016/j.stem.2012.05.015. [DOI] [PubMed] [Google Scholar]
- 2.Dominici M, et al. Minimal criteria for defining multipotent mesenchymal stromal cells. The International Society for Cellular Therapy position statement. Cytotherapy. 2006;8(4):315–317. doi: 10.1080/14653240600855905. [DOI] [PubMed] [Google Scholar]
- 3.Meirelles Lda S, et al. Mechanisms involved in the therapeutic properties of mesenchymal stem cells. Cytokine Growth Factor Rev. 2009;20(5–6):419–427. doi: 10.1016/j.cytogfr.2009.10.002. [DOI] [PubMed] [Google Scholar]
- 4.Murphy MB, Moncivais K, Caplan AI. Mesenchymal stem cells: Environmentally responsive therapeutics for regenerative medicine. Exp Mol Med. 2013;45:e54. doi: 10.1038/emm.2013.94. [DOI] [PMC free article] [PubMed] [Google Scholar]
- 5.Trounson A, et al. Clinical trials for stem cell therapies. BMC Med. 2011;9:52. doi: 10.1186/1741-7015-9-52. [DOI] [PMC free article] [PubMed] [Google Scholar]
- 6.Trounson A, McDonald C. Stem cell therapies in clinical trials: Progress and challenges. Cell Stem Cell. 2015;17(1):11–22. doi: 10.1016/j.stem.2015.06.007. [DOI] [PubMed] [Google Scholar]
- 7.Sharma RR, et al. Mesenchymal stem or stromal cells: A review of clinical applications and manufacturing practices. Transfusion. 2014;54(5):1418–1437. doi: 10.1111/trf.12421. [DOI] [PMC free article] [PubMed] [Google Scholar]
- 8.https://www.clinicaltrials.gov.
- 9.Ankrum J, Karp JM. Mesenchymal stem cell therapy: Two steps forward, one step back. Trends Mol Med. 2010;16(5):203–209. doi: 10.1016/j.molmed.2010.02.005. [DOI] [PMC free article] [PubMed] [Google Scholar]
- 10.Galderisi U, et al. Is it possible to improve the success rate of cellular therapies based on mesenchymal stem cells? J Stem Cells Res Rev Rep. 2014;1(4):1–3. [Google Scholar]
- 11.Allison M. Genzyme backs Osiris, despite Prochymal flop. Nat Biotechnol. 2009;27(11):966–967. doi: 10.1038/nbt1109-966. [DOI] [PubMed] [Google Scholar]
- 12.Mills CR. Osiris Therapeutics announces preliminary results for Prochymal phase III GvHD trials. 2009 [cited 2013; Available from: http://investor.osiris.com/releasedetail.cfm?ReleaseID=407404]
- 13.Phinney DG. Functional heterogeneity of mesenchymal stem cells: Implications for cell therapy. J Cell Biochem. 2002;113(9):2806–2812. doi: 10.1002/jcb.24166. [DOI] [PubMed] [Google Scholar]
- 14.Srijaya TC, Ramasamy TS, Kasim NH. Advancing stem cell therapy from bench to bedside: Lessons from drug therapies. J Transl Med. 2014;12:243. doi: 10.1186/s12967-014-0243-9. [DOI] [PMC free article] [PubMed] [Google Scholar]
- 15.Choumerianou DM, et al. Comparative study of stemness characteristics of mesenchymal cells from bone marrow of children and adults. Cytotherapy. 2010;12(7):881–887. doi: 10.3109/14653249.2010.501790. [DOI] [PubMed] [Google Scholar]
- 16.Stolzing A, et al. Age-related changes in human bone marrow-derived mesenchymal stem cells: Consequences for cell therapies. Mech Ageing Dev. 2008;129(3):163–173. doi: 10.1016/j.mad.2007.12.002. [DOI] [PubMed] [Google Scholar]
- 17.Baxter MA, et al. Study of telomere length reveals rapid aging of human marrow stromal cells following in vitro expansion. Stem Cells. 2004;22(5):675–682. doi: 10.1634/stemcells.22-5-675. [DOI] [PubMed] [Google Scholar]
- 18.Siddappa R, et al. Donor variation and loss of multipotency during in vitro expansion of human mesenchymal stem cells for bone tissue engineering. J Orthop Res. 2007;25(8):1029–1041. doi: 10.1002/jor.20402. [DOI] [PubMed] [Google Scholar]
- 19.Ujiie M, Gomi K, Davies J. MSC functional phenotype: Assay, age and source dependence. Sci Proc. 2015;2(2):1–5. [Google Scholar]
- 20.Bernardo ME, et al. Ex vivo expansion of mesenchymal stromal cells. Best Pract Res Clin Haematol. 2011;24(1):73–81. doi: 10.1016/j.beha.2010.11.002. [DOI] [PubMed] [Google Scholar]
- 21.Francois M, et al. Cryopreserved mesenchymal stromal cells display impaired immunosuppressive properties as a result of heat-shock response and impaired interferon-gamma licensing. Cytotherapy. 2012;14(2):147–152. doi: 10.3109/14653249.2011.623691. [DOI] [PMC free article] [PubMed] [Google Scholar]
- 22.Galipeau J. The mesenchymal stromal cells dilemma — Does a negative phase III trial of random donor mesenchymal stromal cells in steroid-resistant graft-versus-host disease represent a death knell or a bump in the road? Cytotherapy. 2013;15(1):2–8. doi: 10.1016/j.jcyt.2012.10.002. [DOI] [PubMed] [Google Scholar]
- 23.Francois M, et al. Human MSC suppression correlates with cytokine induction of indoleamine 2,3-dioxygenase and bystander M2 macrophage differentiation. Mol Ther. 2012;20(1):187–195. doi: 10.1038/mt.2011.189. [DOI] [PubMed] [Google Scholar]
- 24.Zhukareva V, et al. Secretion profile of human bone marrow stromal cells: Donor variability and response to inflammatory stimuli. Cytokine. 2010;50(3):317–321. doi: 10.1016/j.cyto.2010.01.004. [DOI] [PubMed] [Google Scholar]
- 25.Shi Y, et al. How mesenchymal stem cells interact with tissue immune responses. Trends Immunol. 2012;33(3):136–143. doi: 10.1016/j.it.2011.11.004. [DOI] [PMC free article] [PubMed] [Google Scholar]
- 26.Gornostaeva A, Andreeva E, Buravkova L. Factors governing the immunosuppressive effects of multipotent mesenchymal stromal cells in vitro. Cytotechnology. 2016;68(4):565–577. doi: 10.1007/s10616-015-9906-5. [DOI] [PMC free article] [PubMed] [Google Scholar]
- 27.Krampera M. Mesenchymal stromal cell “licensing”: A multistep process. Leukemia. 2011;25(9):1408–1414. doi: 10.1038/leu.2011.108. [DOI] [PubMed] [Google Scholar]
- 28.Li Q, Wang Y, Deng Z. Pre-conditioned mesenchymal stem cells: A better way for cell-based therapy. Stem Cell Res Ther. 2013;4(3):63. doi: 10.1186/scrt213. [DOI] [PMC free article] [PubMed] [Google Scholar]
- 29.Carrero R, et al. IL1β induces mesenchymal stem cells migration and leucocyte chemotaxis through NF-κB. Stem Cell Rev Rep. 2012;8(3):905–916. doi: 10.1007/s12015-012-9364-9. [DOI] [PMC free article] [PubMed] [Google Scholar]
- 30.Chan JL, et al. Antigen-presenting property of mesenchymal stem cells occurs during a narrow window at low levels of interferon-gamma. Blood. 2006;107(12):4817–4824. doi: 10.1182/blood-2006-01-0057. [DOI] [PMC free article] [PubMed] [Google Scholar]
- 31.Crisostomo PR, et al. Human mesenchymal stem cells stimulated by TNF-alpha, LPS, or hypoxia produce growth factors by an NF kappa B- but not JNK-dependent mechanism. Am J Physiol Cell Physiol. 2008;294(3):C675–C682. doi: 10.1152/ajpcell.00437.2007. [DOI] [PubMed] [Google Scholar]
- 32.Croitoru-Lamoury J, et al. Human mesenchymal stem cells constitutively express chemokines and chemokine receptors that can be upregulated by cytokines, IFN-beta, and Copaxone. J Interf Cytok Res. 2007;27(1):53–64. doi: 10.1089/jir.2006.0037. [DOI] [PubMed] [Google Scholar]
- 33.De Luca A, et al. Role of the EGFR ligand/receptor system in the secretion of angiogenic factors in mesenchymal stem cells. J Cell Physiol. 2011;226(8):2131–2138. doi: 10.1002/jcp.22548. [DOI] [PubMed] [Google Scholar]
- 34.English K, et al. IFN-gamma and TNF-alpha differentially regulate immunomodulation by murine mesenchymal stem cells. Immunol Lett. 2007;110(2):91–100. doi: 10.1016/j.imlet.2007.04.001. [DOI] [PubMed] [Google Scholar]
- 35.Herrmann JL, et al. Preconditioning mesenchymal stem cells with transforming growth factor-alpha improves mesenchymal stem cell-mediated cardioprotection. Shock. 2010;33(1):24–30. doi: 10.1097/SHK.0b013e3181b7d137. [DOI] [PubMed] [Google Scholar]
- 36.Kemp K, et al. Inflammatory cytokine induced regulation of superoxide dismutase 3 expression by human mesenchymal stem cells. Stem Cell Rev. 2010;6(4):548–559. doi: 10.1007/s12015-010-9178-6. [DOI] [PubMed] [Google Scholar]
- 37.Krampera M, et al. Role for interferon-gamma in the immunomodulatory activity of human bone marrow mesenchymal stem cells. Stem Cells. 2006;24(2):386–398. doi: 10.1634/stemcells.2005-0008. [DOI] [PubMed] [Google Scholar]
- 38.Kwon YW, et al. Tumor necrosis factor-α-activated mesenchymal stem cells promote endothelial progenitor cell homing and angiogenesis. Biochim Biophys Acta. 2013;1832(12):2136–2144. doi: 10.1016/j.bbadis.2013.08.002. [DOI] [PubMed] [Google Scholar]
- 39.Lee MJ, et al. Proteomic analysis of tumor necrosis factor-α-induced secretome of human adipose tissue-derived mesenchymal stem cells. J Proteome Res. 2010;9(4):1754–1762. doi: 10.1021/pr900898n. [DOI] [PubMed] [Google Scholar]
- 40.Luo Y, et al. Pretreating mesenchymal stem cells with interleukin-1beta and transforming growth factor-beta synergistically increases vascular endothelial growth factor production and improves mesenchymal stem cell-mediated myocardial protection after acute ischemia. Surgery. 2012;151(3):353–363. doi: 10.1016/j.surg.2011.09.033. [DOI] [PubMed] [Google Scholar]
- 41.Opitz CA, et al. Toll-like receptor engagement enhances the immunosuppressive properties of human bone marrow-derived mesenchymal stem cells by inducing indoleamine-2,3-dioxygenase-1 via interferon-beta and protein kinase R. Stem Cells. 2009;27(4):909–919. doi: 10.1002/stem.7. [DOI] [PubMed] [Google Scholar]
- 42.Ren G, et al. Inflammatory cytokine-induced intercellular adhesion molecule-1 and vascular cell adhesion molecule-1 in mesenchymal stem cells are critical for immunosuppression. J Immunol. 2010;184(5):2321–2328. doi: 10.4049/jimmunol.0902023. [DOI] [PMC free article] [PubMed] [Google Scholar]
- 43.Romieu-Mourez R, et al. Cytokine modulation of TLR expression and activation in mesenchymal stromal cells leads to a proinflammatory phenotype. J Immunol. 2009;182(12):7963–7973. doi: 10.4049/jimmunol.0803864. [DOI] [PubMed] [Google Scholar]
- 44.van den Berk LC, et al. Mesenchymal stem cells respond to TNF but do not produce TNF. J Leukoc Biol. 2010;87(2):283–289. doi: 10.1189/jlb.0709467. [DOI] [PubMed] [Google Scholar]
- 45.Zhang A, et al. Mechanism of TNF-alpha-induced migration and hepatocyte growth factor production in human mesenchymal stem cells. J Cell Biochem. 2010;111(2):469–475. doi: 10.1002/jcb.22729. [DOI] [PubMed] [Google Scholar]
- 46.Lei J, et al. Ligation of TLR2 and TLR4 on murine bone marrow-derived mesenchymal stem cells triggers differential effects on their immunosuppressive activity. Cell Immunol. 2011;271(1):147–156. doi: 10.1016/j.cellimm.2011.06.014. [DOI] [PubMed] [Google Scholar]
- 47.Nurmenniemi S, et al. Toll-like receptor 9 ligands enhance mesenchymal stem cell invasion and expression of matrix metalloprotease-13. Exp Cell Res. 2010;316(16):2676–2682. doi: 10.1016/j.yexcr.2010.05.024. [DOI] [PubMed] [Google Scholar]
- 48.Tomchuck SL, et al. Toll-like receptors on human mesenchymal stem cells drive their migration and immunomodulating responses. Stem Cells. 2008;26(1):99–107. doi: 10.1634/stemcells.2007-0563. [DOI] [PMC free article] [PubMed] [Google Scholar]
- 49.Waterman RS, et al. A new mesenchymal stem cell (MSC) paradigm: Polarization into a pro-inflammatory MSC1 or an immunosuppressive MSC2 phenotype. PLoS ONE. 2010;5(4):e10088. doi: 10.1371/journal.pone.0010088. [DOI] [PMC free article] [PubMed] [Google Scholar]
- 50.Yao Y, et al. Lipopolysaccharide preconditioning enhances the efficacy of mesenchymal stem cells transplantation in a rat model of acute myocardial infarction. J Biomed Sci. 2009;16(1):1–11. doi: 10.1186/1423-0127-16-74. [DOI] [PMC free article] [PubMed] [Google Scholar]
- 51.Duijvestein M, et al. Pretreatment with interferon-gamma enhances the therapeutic activity of mesenchymal stromal cells in animal models of colitis. Stem Cells. 2011;29(10):1549–1558. doi: 10.1002/stem.698. [DOI] [PubMed] [Google Scholar]
- 52.Fan HY, et al. Pre-treatment with IL-1 beta enhances the efficacy of MSC transplantation in DSS-induced colitis. Cell Mol Immunol. 2012;9(6):473–481. doi: 10.1038/cmi.2012.40. [DOI] [PMC free article] [PubMed] [Google Scholar]
- 53.Waterman RS, Henkle SL, Betancourt AM. Mesenchymal stem cell 1 (MSC1)-based therapy attenuates tumor growth whereas MSC2-treatment promotes tumor growth and metastasis. PLoS ONE. 2012;7(9):e45590. doi: 10.1371/journal.pone.0045590. [DOI] [PMC free article] [PubMed] [Google Scholar]
- 54.Waterman RS, et al. Anti-inflammatory mesenchymal stem cells (MSC2) attenuate symptoms of painful diabetic peripheral neuropathy. Stem Cells Transl Med. 2012;1(7):557–565. doi: 10.5966/sctm.2012-0025. [DOI] [PMC free article] [PubMed] [Google Scholar]
- 55.Yoon N, et al. Pre-activated human mesenchymal stromal cells in combination with doxorubicin synergistically enhance tumor-suppressive activity in mice. Cytotherapy. 2015;0:1–10. doi: 10.1016/j.jcyt.2015.06.009. [DOI] [PubMed] [Google Scholar]
- 56.Gray A, et al. Identification of IL-1beta and LPS as optimal activators of monolayer and alginate-encapsulated mesenchymal stromal cell immunomodulation using design of experiments and statistical methods. Biotechnol Prog. 2015;31(4):1058–1070. doi: 10.1002/btpr.2103. [DOI] [PMC free article] [PubMed] [Google Scholar]
- 57.Faul F, et al. G*Power 3: A flexible statistical power analysis program for the social, behavioral, and biomedical sciences. Behav Res Methods. 2007;39(2):175–191. doi: 10.3758/bf03193146. [DOI] [PubMed] [Google Scholar]
- 58.Weber A, Wasiliew P, Kracht M. Interleukin-1 (IL-1) pathway. Sci Signal. 2010;3(105):cm1. doi: 10.1126/scisignal.3105cm1. [DOI] [PubMed] [Google Scholar]
- 59.Lindstrom TM, Bennett PR. The role of nuclear factor kappa B in human labour. Reproduction. 2005;130(5):569–581. doi: 10.1530/rep.1.00197. [DOI] [PubMed] [Google Scholar]
- 60.Bowie A, O’Neill LA. The interleukin-1 receptor/Toll-like receptor superfamily: Signal generators for pro-inflammatory interleukins and microbial products. J Leukocyte Biol. 2000;67(4):508–514. doi: 10.1002/jlb.67.4.508. [DOI] [PubMed] [Google Scholar]
- 61.Eder J. Tumour necrosis factor alpha and interleukin 1 signalling: Do MAPKK kinases connect it all? Trends Pharmacol Sci. 1997;18(9):319–322. doi: 10.1016/s0165-6147(97)01097-3. [DOI] [PubMed] [Google Scholar]
- 62.Matsuura H, et al. Regulation of cyclooxygenase-2 by interferon gamma and transforming growth factor alpha in normal human epidermal keratinocytes and squamous carcinoma cells. Role of mitogen-activated protein kinases. J Biol Chem. 1999;274(41):29138–29148. doi: 10.1074/jbc.274.41.29138. [DOI] [PubMed] [Google Scholar]
- 63.Bolli R, et al. Discovery of a new function of cyclooxygenase (COX)-2: COX-2 is a cardioprotective protein that alleviates ischemia/reperfusion injury and mediates the late phase of preconditioning. Cardiovasc Res. 2002;55(3):506–519. doi: 10.1016/s0008-6363(02)00414-5. [DOI] [PMC free article] [PubMed] [Google Scholar]
- 64.Zhang X, et al. Several transcription factors regulate COX-2 gene expression in pancreatic β-cells. Mol Biol Rep. 2007;34(3):199–206. doi: 10.1007/s11033-007-9085-3. [DOI] [PubMed] [Google Scholar]
- 65.Hanna N, et al. IFN-γ-mediated inhibition of COX-2 expression in the placenta from term and preterm labor pregnancies. Am J Reprod Immunol. 2004;51(4):311–318. doi: 10.1111/j.1600-0897.2004.00162.x. [DOI] [PubMed] [Google Scholar]
- 66.Schroder K, et al. Interferon-γ: An overview of signals, mechanisms and functions. J Leukocyte Biol. 2004;75(2):163–189. doi: 10.1189/jlb.0603252. [DOI] [PubMed] [Google Scholar]
- 67.Ohmori Y, Schreiber RD, Hamilton TA. Synergy between interferon-γ and tumor necrosis factor-α in transcriptional activation is mediated by cooperation between signal transducer and activator of transcription 1 and nuclear factor κB. J Biol Chem. 1997;272(23):14899–14907. doi: 10.1074/jbc.272.23.14899. [DOI] [PubMed] [Google Scholar]
- 68.Held TK, et al. Gamma interferon augments macrophage activation by lipopolysac-charide by two distinct mechanisms, at the signal transduction level and via an autocrine mechanism involving tumor necrosis factor alpha and interleukin-1. Infect Immun. 1999;67(1):206–212. doi: 10.1128/iai.67.1.206-212.1999. [DOI] [PMC free article] [PubMed] [Google Scholar]
- 69.Bellehumeur C, et al. Interleukin 1 regulates its own receptors in human endometrial cells via distinct mechanisms. Human Reprod. 2009;24(9):2193–2204. doi: 10.1093/humrep/dep192. [DOI] [PubMed] [Google Scholar]
- 70.Yang X, et al. IFN-γ-secreting-mesenchymal stem cells exert an antitumor effect in vivo via the TRAIL pathway. J Immunol Res. 2014;2014:9. doi: 10.1155/2014/318098. [DOI] [PMC free article] [PubMed] [Google Scholar]
- 71.Barminko JA, et al. Fractional factorial design to investigate stromal cell regulation of macrophage plasticity. Biotechnol Bioeng. 2014;111(11):2239–2251. doi: 10.1002/bit.25282. [DOI] [PMC free article] [PubMed] [Google Scholar]
- 72.Choi H, et al. Anti-inflammatory protein TSG-6 secreted by activated MSCs attenuates zymosan-induced mouse peritonitis by decreasing TLR2/NF-kappaB signaling in resident macrophages. Blood. 2011;118(2):330–338. doi: 10.1182/blood-2010-12-327353. [DOI] [PMC free article] [PubMed] [Google Scholar]
- 73.Gong D, et al. TGFbeta signaling plays a critical role in promoting alternative macrophage activation. BMC Immunol. 2012;13:31. doi: 10.1186/1471-2172-13-31. [DOI] [PMC free article] [PubMed] [Google Scholar]
- 74.Ortiz LA, et al. Interleukin 1 receptor antagonist mediates the anti-inflammatory and antifibrotic effect of mesenchymal stem cells during lung injury. Proc Natl Acad Sci USA. 2007;104(26):11002–11007. doi: 10.1073/pnas.0704421104. [DOI] [PMC free article] [PubMed] [Google Scholar]
- 75.Cohen J. Set correlation and contingency—Tables. Appl Psychol Meas. 1988;12(4):425–434. [Google Scholar]
- 76.Wang XY, et al. Donor myocardial infarction impairs the therapeutic potential of bone marrow cells by an interleukin-1-mediated inflammatory response. Sci Transl Med. 2011;3(100):100ra90. doi: 10.1126/scitranslmed.3002814. [DOI] [PMC free article] [PubMed] [Google Scholar]
- 77.Sanz-Nogues C, O’Brien T. MSCs isolated from patients with ischemic vascular disease have normal angiogenic potential. Mol Ther. 2014;22(11):1888–1889. doi: 10.1038/mt.2014.191. [DOI] [PMC free article] [PubMed] [Google Scholar]
- 78.Bocelli-Tyndall C, et al. Bone marrow mesenchymal stromal cells (BM-MSCs) from healthy donors and auto-immune disease patients reduce the proliferation of autologous- and allogeneic-stimulated lymphocytes in vitro. Rheumatology. 2007;46(3):403–408. doi: 10.1093/rheumatology/kel267. [DOI] [PubMed] [Google Scholar]
- 79.Bacigalupo A, et al. T-cell suppression mediated by mesenchymal stem cells is deficient in patients with severe aplastic anemia. Exp Hematol. 2005;33(7):819–827. doi: 10.1016/j.exphem.2005.05.006. [DOI] [PubMed] [Google Scholar]
- 80.Murphy JM, et al. Reduced chondrogenic and adipogenic activity of mesenchymal stem cells from patients with advanced osteoarthritis. Arthritis Rheum. 2002;46(3):704–713. doi: 10.1002/art.10118. [DOI] [PubMed] [Google Scholar]
- 81.Del Papa N, et al. Bone marrow endothelial progenitors are defective in systemic sclerosis. Arthritis Rheum. 2006;54(8):2605–2615. doi: 10.1002/art.22035. [DOI] [PubMed] [Google Scholar]
- 82.Kastrinaki MC, et al. Functional, molecular and proteomic characterisation of bone marrow mesenchymal stem cells in rheumatoid arthritis. Ann Rheum Dis. 2008;67(6):741–749. doi: 10.1136/ard.2007.076174. [DOI] [PubMed] [Google Scholar]
- 83.Papadaki HA, et al. Normal bone marrow hematopoietic stem cell reserves and normal stromal cell function support the use of autologous stem cell transplantation in patients with multiple sclerosis. Bone Marrow Transplant. 36(12):1053–1063. doi: 10.1038/sj.bmt.1705179. [DOI] [PubMed] [Google Scholar]
- 84.Mallam E, et al. Characterization of in vitro expanded bone marrow-derived mesenchymal stem cells from patients with multiple sclerosis. Mult Scler J. 2010;16(8):909–918. doi: 10.1177/1352458510371959. [DOI] [PubMed] [Google Scholar]
- 85.Mazzanti B, et al. Differences in mesenchymal stem cell cytokine profiles between MS patients and healthy donors: Implication for assessment of disease activity and treatment. J Neuroimmunol. 2008;199(1–2):142–150. doi: 10.1016/j.jneuroim.2008.05.006. [DOI] [PubMed] [Google Scholar]
Associated Data
This section collects any data citations, data availability statements, or supplementary materials included in this article.