

Abstract
The blood-brain barrier is dysfunctional in epilepsy, thereby contributing to seizure genesis and resistance to antiseizure drugs. Previously, several groups reported that seizures increase brain glutamate levels, which leads to barrier dysfunction. One critical component of barrier dysfunction is brain capillary leakage. Based on our preliminary data, we hypothesized that glutamate released during seizures mediates an increase in matrix-metalloproteinase (MMP) expression and activity levels, thereby contributing to barrier leakage. To test this hypothesis, we exposed isolated brain capillaries from male Sprague Dawley rats to glutamate ex vivo and used an in vivo/ex vivo approach of isolated brain capillaries from female Wistar rats that experienced status epilepticus as an acute seizure model. We found that exposing isolated rat brain capillaries to glutamate increased MMP-2 and MMP-9 protein and activity levels, and decreased tight junction protein levels, which resulted in barrier leakage. We confirmed these findings in vivo in rats after status epilepticus and in brain capillaries from male mice lacking cytosolic phospholipase A2. Together, our data support the hypothesis that glutamate released during seizures signals an increase in MMP-2 and MMP-9 protein expression and activity levels, resulting in blood-brain barrier leakage.
SIGNIFICANCE STATEMENT The mechanism leading to seizure-mediated blood-brain barrier dysfunction in epilepsy is poorly understood. In the present study, we focused on defining this mechanism in the brain capillary endothelium. We demonstrate that seizures trigger a pathway that involves glutamate signaling through cytosolic phospholipase A2, which increases MMP levels and decreases tight junction protein expression levels, resulting in barrier leakage. These findings may provide potential therapeutic avenues within the blood-brain barrier to limit barrier dysfunction in epilepsy and decrease seizure burden.
Keywords: barrier dysfunction, barrier leakage, Blood-Brain barrier, cPLA2, MMP
Introduction
With >70 million patients worldwide, epilepsy is one of the most common neurological disorders (Ngugi et al., 2010; World Health Organization, 2017). Approximately one-third of epilepsy patients suffer from refractory epilepsy and do not respond well to treatment with antiseizure drugs (ASDs) (Kwan and Brodie, 2010). These patients experience uncontrolled seizures and comorbidities that severely impact their quality of life (Edefonti et al., 2011; Tang et al., 2017).
Recent findings suggest that epilepsy etiology and pathology are not solely based on neuronal dysfunction. Altered immune response, glial dysfunction, persistent brain inflammation, and a dysfunctional blood-brain barrier also appear to play a role in epilepsy pathophysiology (Vezzani and Granata, 2005; Coulter and Eid, 2012; Heinemann et al., 2012; Sada et al., 2015). In the present study, we focus on barrier leakage, which is a key component of barrier dysfunction. Recently, several groups have shown that barrier leakage plays a role in epilepsy progression (Marchi et al., 2007b, 2010; Rigau et al., 2007; van Vliet et al., 2007; Tomkins et al., 2008; Kastanauskaite et al., 2009; Alonso-Nanclares and DeFelipe, 2014). For example, Marchi et al. (2009) and Salar et al. (2014) showed that barrier leakage potentially contributes to ASD resistance in refractory epilepsy. One explanation these authors provide is that serum proteins such as albumin enter the brain through a leaky barrier, then upon extravasation bind ASDs in the brain parenchyma, lowering brain concentration of free, unbound ASD, thereby limiting ASD brain levels and reducing ASD efficacy (Marchi et al., 2009; Salar et al., 2014). Moreover, multiple groups have demonstrated that barrier leakage is both a consequence and a trigger of seizures (Seiffert et al., 2004; Fabene et al., 2008; Marchi et al., 2011). This implies that a leaky barrier contributes to seizure genesis through a positive feedback loop, in which seizures drive barrier leakage leading to more seizures, thereby promoting epilepsy progression. Thus, strategies to repair barrier dysfunction could be valuable add-on treatments to existing pharmacotherapy. However, the mechanism of seizure-induced barrier leakage is not fully understood, and strategies to repair a leaky barrier are not available.
The data we present here suggest that seizures increase matrix metalloproteinase (MMP) expression and activity levels in capillary endothelial cells of the blood-brain barrier. In the neurovasculature, MMPs likely affect barrier integrity by digesting and remodeling the extracellular matrix surrounding brain capillaries and by degrading tight junction proteins that seal the endothelium (Lischper et al., 2010; Feng et al., 2011). Based on our data and reports from others, we postulated that seizures cause MMP upregulation at the blood-brain barrier that leads to degradation of tight junctions and results in barrier leakage.
We used pilocarpine to induce status epilepticus (SE) in rats and then isolated brain capillaries from these animals after acute SE. We found increased MMP-2 and MMP-9 activity levels, decreased tight junction expression levels, and barrier leakage in capillaries from rats after SE. Exposing rat brain capillaries to glutamate increased MMP-2 and MMP-9 protein and activity levels, decreased tight junction protein levels, and resulted in barrier leakage; blocking cytosolic phospholipase A2 (cPLA2) reversed these effects. We confirmed our findings using brain capillaries from cPLA2 knock-out (KO) mice and by conducting in vivo experiments in a rat seizure model using a cPLA2 inhibitor.
Together, our study suggests that glutamate released during seizures increases MMP-2 and MMP-9 levels at the blood-brain barrier, which results in reduced levels of tight junction proteins and consequently barrier leakage. Our data imply that cPLA2 could be a target to repair barrier dysfunction and improve the treatment of epilepsy and potentially other neurological disorders that are accompanied by blood-brain barrier leakage as well.
Materials and Methods
Chemicals and supplies.
Dulbecco's PBS (DPBS) was purchased from Fisher Scientific. Antibody against occludin (71–1500; RRID:AB_2533977) was obtained from Zymed Laboratories, antibody against claudin-5 (35-2500, RRID:AB_2533200) was from Invitrogen, antibodies against MMP-2 (ab37150; RRID:AB_881512), MMP-9 (ab7299; RRID:AB_305831), ZO-1 (ab96587; RRID:AB_10680012), claudin-1 (ab56417, RRID:AB_941048), and β-actin (ab8226, RRID:AB_306371), as well as MMP-9 protein were purchased from Abcam. Rat and mouse MMP-2, rat MMP-9, and fluorogenic MMP substrate Mca-PLGL-Dpa-AR-NH2 were from R&D Systems. GM6001 was purchased from Tocris Bioscience. The cPLA2-inhibitor arachidonyl trifluoromethyl ketone (ATK) was from Cayman Chemical. l-Glutamate, d-mannitol, pilocarpine, Texas Red, and all other chemicals and reagents were purchased from Sigma-Aldrich. The Phire Tissue Direct PCR Master Mix Kit and all other chemicals and supplies were purchased from Thermo Fisher Scientific.
Experimental design and statistical analysis.
Sample sizes (e.g., animal numbers, number of brain capillaries to be analyzed) for individual experiments were based on power analyses of preliminary data and previously published data (Bauer et al., 2008; Pekcec et al., 2009; Zibell et al., 2009; Hartz et al., 2017) and are given in the figure legends.
Number of repetitions are stated in Results and the figure legends. Female Wistar rats (RGD_2312511) were used for in vivo SE inductions. For ex vivo experiments using isolated brain capillaries, male CD IGS Sprague Dawley rats (RGD_734476) were used. For Texas Red leakage experiments, capillaries were isolated from male cPLA2 wild-type and KO mice (Bonventre et al., 1997).
Statistical analyses focused on comparisons between experimental groups and did not include adjustment variables. Two-group experiments were analyzed with two-tailed unpaired Student's t test, whereas ANOVA was used for more than two groups. Results presented are mean ± SEM. Analyses were performed using Microsoft Excel and Prism (version 7.00, GraphPad; RRID:SCR_002798). Because animals in each experiment were independent, observed differences were considered to be statistically significant when p < 0.05 (i.e., there were no multiple comparisons based on data from the same animals). The Anderson-Darling test for normality was performed to confirm normal distribution of the data. For the statistical analysis of Western blotting data presented in Tables 1–6, the mean for each treatment was compared with control using Dunnett's many-to-one t test with statistical significance determined at the 0.05 level for each endpoint.
Table 1.
Western blot analysis of MMP and tight junction protein expression levels in brain capillaries isolated from rats after SE (Fig. 2A)a
| Protein | Control | Pilo | SE |
|---|---|---|---|
| MMP-2 | 100 ± 5.1 | 95 ± 6.2 | 132 ± 5.2* |
| MMP-9 | 100 ± 5.1 | 93 ± 5.2 | 125 ± 7.5* |
| ZO-1 | 100 ± 13 | 83 ± 11.7 | 29 ± 3.9* |
| Occludin | 100 ± 2 | 108 ± 2 | 43 ± 0.6* |
| Claudin-1 | 100 ± 5.5 | 77 ± 10.9 | 52 ± 6.6* |
| Claudin-5 | 100 ± 3.9 | 94 ± 3.5 | 73 ± 2.6* |
aData were normalized to β-actin levels; values are percentage control ± SD (n = 3).
*p < 0.05, each endpoint versus control (Dunnett's many-to-one t test).
Table 6.
Western blot analysis of MMP and tight junction protein expression levels in brain capillaries isolated from rats after SE that were treated with or without the cPLA2 inhibitor ATK (Fig. 7A)a
| Protein | Control | Pilo | SE | SE + ATK |
|---|---|---|---|---|
| MMP-2 | 100 ± 2.9 | 102.6 ± 2.9 | 145.2 ± 3.4* | 111.3 ± 2.8 |
| MMP-9 | 100 ± 3.9 | 106.2 ± 3.5 | 139.6 ± 9.2* | 99.2 ± 4.3 |
| ZO-1 | 100 ± 11.6 | 115.7 ± 16.4 | 53.4 ± 8.4* | 101.8 ± 15.7 |
| Occludin | 100 ± 16.9 | 96.1 ± 19.1 | 41.2 ± 5* | 89 ± 23.6 |
| Claudin-1 | 100 ± 15.3 | 95.3 ± 16.6 | 49 ± 3.7* | 105.5 ± 18.4 |
| Claudin-5 | 100 ± 15.6 | 92.4 ± 17.1 | 44.9 ± 3.8* | 110.7 ± 19 |
aData were normalized to β-actin levels; values are percentage control ± SD (n = 3).
*p < 0.05, each endpoint versus control (Dunnett's many-to-one t test).
Animals.
Animal protocols were approved by the University of Minnesota and University of Kentucky Institutional Animal Care and Use Committees (University of Minnesota Institutional Animal Care and Use Committee #1012A93932, principal investigator B.B.; University of Kentucky Institutional Animal Care and Use Committee #2014-1234, principal investigator B.B.) and were in accordance with Association for Assessment and Accreditation of Laboratory Animal Care regulations, the Department of Agriculture Animal Welfare Act, and National Institutes of Health animal guidelines. Rats: Male CD IGS Sprague Dawley rats (275-300 g; RGD_734476) and female Wistar rats (180-215 g; RGD_2312511) were from Charles River Laboratories. Rats were housed under controlled conditions (23°C, 35% relative humidity, 12 h dark/light cycle) with free access to tap water and standard rodent feed (Harlan Teklad Chow 2918; Harlan Laboratories). Upon arrival in the animal facility, rats were given at least 1 week to acclimate to the new environment before experiments. Mice: Heterozygous cPLA2 breeding pairs were a kind gift from Dr. Joseph V. Bonventre (Brigham and Women's Hospital/Harvard Medical School) (Bonventre et al., 1997).
Genotyping of cPLA2 KO mice.
Genotyping was performed for cPLA2 wild-type, heterozygous, and KO mice using ear punch samples. DNA was isolated using the Phire Tissue Direct PCR Master Mix kit (F170S, Thermo Fisher Scientific) according to the manufacturer's protocol. The 2-mm-diameter ear punch samples were placed in a PCR tube containing 20 μl dilution buffer and 0.4 μl DNA release additive per sample. Samples were centrifuged, incubated at room temperature for 5 min, and incubated at 98°C for 2 min using a SimpliAmp thermal cycler (Thermo Fisher Scientific). Isolated DNA was stored at −20°C until use.
The PCR was performed using the Phire Tissue Direct PCR Master Mix (2×) with 3 specific primers: CGA CTC ATA CAG TGC CTT CAT CAC (CPLA604), GGG AAC TTC CTG ACT AGG GG (PGKNEO), TGT GTA CAA TCT TTG TGT TGT TTC A (CPLA 3F) at a final concentration of 10 μm with 2.5 μl of isolated DNA. The PCR was performed in a SimpliAmp thermal cycler (Thermo Fisher Scientific); PCR conditions were set to an initial denaturation at 98°C for 5 min; 40 cycles of a three-step amplification, including 98°C denaturation for 5 s, 62°C annealing for 5 s, and 72°C extension for 20 s; and a final extension at 72°C for 1 min. PCR products were resolved on E-Gel EX 4% agarose gels using an E-Gel Precast Agarose Electrophoresis System (Thermo Fisher Scientific). Gels were imaged using a ChemiDoc XRS+ System with accompanying Image Laboratory version 5.0 software (Bio-Rad Laboratories). Expected band sizes are as follows: 100 bp for the wild-type band and 300 bp for the cPLA2 KO band; for heterozygous mice, both bands appeared in the agarose gel.
SE induction in rats.
Female Wistar rats were handled at least 3 times before SE induction to minimize handling stress. At 12–18 h before pilocarpine dosing, all rats were given lithium chloride (127 mg/kg) by intraperitoneal injection; 30 min before pilocarpine dosing, all rats were given methylscopolamine (1 mg/kg) by intraperitoneal injection. To induce SE, rats in the pilocarpine group received pilocarpine (10–12 mg/kg) by repeated intraperitoneal injections every 20–30 min until the onset of ongoing generalized convulsive seizures. The maximum dose of pilocarpine per animal was limited to 120 mg/kg. Behavioral seizures were scored based on Racine's scale (Racine, 1972), and SE was defined by continuous tonic-clonic seizures or intermittent Class 4 and 5 seizures without recovery of normal conscious behavior between seizures. Rats that received pilocarpine but did not enter SE served as pilocarpine control animals. SE was continuously monitored and terminated after 90 min by intraperitoneal injections of diazepam (10 mg/kg every 20 min until cessation of seizures). Control rats received LiCl, methylscopolamine, normal saline, and diazepam but did not receive pilocarpine. Animals were killed 48 h after SE induction using CO2 and subsequent decapitation.
To test the effect of cPLA2 inhibition in vivo, rats were dosed with the selective cPLA2 inhibitor ATK (10 mg/kg, i.p.) every 12 h for 3.5 d (total of 7 i.p. injections). After three ATK treatments, rats underwent seizure induction with pilocarpine; after SE induction animals received 4 more ATK treatments.
Brain capillary isolation.
Brain capillaries from rat brain tissue were isolated as previously described (Bauer et al., 2008; Hartz et al., 2017). Rats were killed by CO2 inhalation and decapitated. The skull was opened with bone pliers, and brains were collected in ice-cold DPBS (2.7 mm KCl, 1.47 mm KH2PO4, 136.9 mm NaCl, 8.1 mm Na2HPO4, 0.9 mm CaCl2, 0.49 mm MgCl2, supplemented with 5 mm d-glucose and 1 mm sodium pyruvate, pH 7.4). Brains were dissected and cleaned by removing the brainstem, meninges, larger blood vessels, and white matter using forceps and stereomicroscopes. The remaining brain cortex tissue was minced and homogenized in DPBS with a Potter-Elvehjem homogenizer (clearance: 150–230 μm), followed by another homogenization using a Dounce homogenizer (clearance: 80–130 μm). The brain homogenate was mixed with Ficoll (final concentration 15%), and the mixture was centrifuged at 5800 × g for 15 min at 4°C. The pellet containing brain capillaries was resuspended in DPBS (with 1% BSA), the capillary suspension was filtered through a 300 μm mesh and passed over a glass bead column using DPBS (1% BSA). Capillaries adhering to the glass beads were washed off and collected by agitation in DPBS (1% BSA) followed by filtration through a 100 μm cell strainer (Falcon; Corning). After centrifugation (1500 × g, 3 min, 4°C), the capillary pellet was washed 3 times with DPBS (no BSA). Freshly isolated brain capillaries were exposed to 100 μm glutamate (with/without inhibitors) for 30 min, washed, and incubated in glutamate-free DPBS buffer for 5.5 h. After a total of 6 h, capillaries were used for the endpoint measurements described below.
Capillary membrane isolation.
Brain capillaries were lysed in CelLytic buffer (Sigma-Aldrich) containing Complete protease inhibitor mixture (Roche) using a Polytron 2500E homogenizer (Kinematica). The cell lysate was first centrifuged at 10,000 × g for 30 min, and the resulting supernatant was centrifuged at 100,000 × g for 2 h. The final pellet (crude capillary membranes) was resuspended, and brain capillary membranes were frozen at −80°C until further use.
Western blotting.
Protein concentration of brain capillary membrane samples was determined using the Bradford protein assay. Normalized brain capillary membrane samples were separated and transferred using the NuPAGE electrophoresis and blotting system (Invitrogen). After protein transfer, the blotting membranes were incubated overnight with primary antibody (MMP-2: 1 μg/ml, ab37150; RRID:AB_881512, Abcam; MMP-9: 1 μg/ml, ab7299; RRID:AB_305831, Abcam; occludin: 1 μg/ml, 71-1500; RRID:AB_2533977, Zymed Laboratories; claudin-1: 1 μg/ml, ab56417, RRID:AB_941048, Abcam; claudin-5: 1 μg/ml, 35-2500, RRID:AB_2533200, Invitrogen; ZO-1: 1 μg/ml, ab96587; RRID:AB_10680012, Zymed Laboratories; tissue inhibitors of metalloproteinase-1 [TIMP-1]: 1 μg/ml, ab61224; RRID:AB_945838, Abcam; TIMP-2: 1 μg/ml, ab38973; RRID:AB_778471, Abcam; TIMP-3: 1 μg/ml, ab39184, RRID:AB_2204971, Abcam; or β-actin: 1 μg/μl, ab8226, RRID:AB_306371, Abcam). After antibody incubation, the membrane was washed and incubated with the corresponding HRP-conjugated secondary antibody (1:10,000; Pierce). Proteins were detected using SuperSignal West Pico chemoluminescent substrate (Pierce), and protein bands were visualized with a Gel Doc XRS imaging system (Bio-Rad Laboratories) and analyzed with Image Laboratory (version 5.0) software.
MMP-2 and MMP-9 ELISA.
Freshly isolated brain capillaries were lysed in CelLytic buffer (Sigma-Aldrich) containing Complete protease inhibitor mixture using a Polytron 2500E homogenizer (Kinematica). Samples were centrifuged at 10,000 × g for 30 min, and the resulting supernatants were collected. To quantitate MMP-2 and MMP-9, we used the Total MMP-2 Quantikine ELISA Kit and the Total MMP-9 Quantikine ELISA Kit according to the manufacturer's instructions (R&D Systems). Briefly, samples were transferred into microplates coated with monoclonal antibody specific for MMP-2 or MMP-9, respectively, and incubated for 2 h. Plates were washed 5 times, and HRP-linked polyclonal antibody specific for MMP-2 or MMP-9 was added for 2 h. After another five washes, substrate solution (tetramethylbenzidine) was added and a blue colored diimine developed proportionally to the amount of MMP bound to antibody in the plate. After 30 min, the color reaction was stopped by adding sulfuric acid, which turned the tetramethylbenzidine to yellow; color intensity was measured at 450 and 570 nm (to correct for optical imperfections in the microplate) using a Synergy H1 Hybrid Multi-Mode Reader (BioTek). The raw data were analyzed, and results were presented as total protein concentration in ng/ml. In preliminary experiments, MMP-2 levels in brain capillary samples were found to be near the detection limit (0.5 ng/ml); therefore, samples and blanks were spiked with 4 ng/ml exogenous MMP-2 to raise levels to the linear range of the standard curve. After detection, the values for the spiked blanks were subtracted from the sample values to determine the actual MMP-2 concentration in the sample.
Immunohistochemistry.
Brain capillaries were transferred to confocal imaging chambers with coverslip bottoms and allowed to attach for 15 min. Capillaries were fixed for 30 min with fixation solution (3% PFA, 0.25% glutaraldehyde in PBS), permeabilized for 1 h with Surfact-Amps X-100 (0.5% in PBS), and blocked for at least 2 h with 1% BSA (in PBS). Brain capillaries were then incubated overnight at 4°C with MMP-2 (ab37150; RRID:AB_881512) and MMP-9 (ab7299; RRID:AB_305831) primary antibody (concentration: 1 μg/ml in 1% BSA). After washing with 1% BSA, capillaries were incubated with the corresponding AlexaFluor-488 s antibody (diluted 1:1000 in 1% BSA) for 1 h at 37°C in the dark. Subsequently, cell nuclei were counterstained for 10 min with DAPI (1 μg/ml in 1% BSA). Capillaries were examined with a Zeiss LSM 710 inverted confocal microscope that was equipped with a C-Apochromat 40×/1.2 W Corr objective and using the 488 nm line of an argon laser (Carl Zeiss).
Texas Red efflux assay.
Texas Red efflux assays using brain capillaries were performed as previously described (Hartz et al., 2012). Brain capillaries were transferred to glass coverslips and incubated for 1 h with fluorescent 2 μm Texas Red (sulforhodamine 101 acid chloride; 641 Da) to load capillary lumens. After washing with DPBS, the efflux of Texas Red from the lumen of control and treated brain capillaries was monitored with confocal microscopy. Per group, n = 7–10 brain capillary images were taken with an LSM 710 inverted confocal microscope (C-Apochromat 40×/1.2 W Corr objective, 488 nm argon laser line; Carl Zeiss) or a TCS SP5 confocal microscope with a 63× 1.2 NA water-immersion objective (Leica Instruments). Luminal fluorescence intensity was quantitated using Zeiss ZEN 2012 Imaging software or ImageJ version 1.48v (Wayne Rasband, National Institutes of Health). First-order efflux rate constants were calculated using nonlinear regression (Prism, version 7.00; RRID:SCR_002798, GraphPad Software).
Zymography.
Isolated brain capillaries were lysed as described above, and protein concentration of capillary lysates was determined by the Bradford protein assay. Normalized capillary lysate samples were added to prewashed Sepharose beads (GE Healthcare) on a spin column (Thermo Fisher Scientific). Samples were incubated for 60 min at 4°C while rotating at 40 rpm, followed by a 30 min incubation at room temperature while rotating at 20 rpm. Samples were centrifuged for 2 min at 500 × g; the supernatant was discarded. The beads were washed twice by gentle vortexing for 5 min with 500 μl PBS (Ca2+/Mg2+/0.05% Tween). After each washing step, the columns were centrifuged for 2 min at 500 × g; the supernatant was discarded. MMPs adhering to the Sepharose beads were eluted by vortexing for 30 min with 40 μl of a 1:1 mix of water and Novex Tris-glycine SDS sample Buffer (Invitrogen). Samples were centrifuged for 2 min at 1000 × g, and the MMP-containing supernatants were collected. Zymography was performed with the NuPAGE electrophoresis system using Novex Zymogram Gelatin Protein Gels (Invitrogen) according to the manufacturer's instructions. Recombinant rat MMP-2 and MMP-9 were used as standards (R&D Systems). Gels were first incubated for 30 min at room temperature in Novex Zymogram Renaturing Buffer and then equilibrated for 30 min at room temperature in Novex Zymogram Developing Buffer. After equilibration, fresh 1× Novex Zymogram Developing Buffer was added and the gel was incubated at 37°C for 36–40 h. The gel was stained for 8 h using the Colloidal Blue Staining Kit (Invitrogen) according to the manufacturer's instructions. Afterward, the gel was transferred into deionized water for overnight destaining. The gels were imaged with a Gel Doc XRS system (Bio-Rad Laboratories), and MMP activity was analyzed using Image Laboratory (version 5.0) software according to a procedure described by Hu and Beeton (2010).
MMP activity measurements.
Total MMP activity in isolated rat brain capillaries was measured with a substrate activity assay using Mca-PLGL-Dpa-AR-NH2 fluorogenic MMP substrate (#ES001, R&D Systems). Brain capillaries were lysed in CelLytic M (Sigma-Aldrich) using a Polytron 2500E homogenizer (Kinematica) and centrifuged at 30,000 rpm for 30 min; the resulting supernatant was collected for MMP activity measurements. After adding 10 μm Mca-PLGL-Dpa-AR-NH2, fluorescence was measured using a Synergy H1 Hybrid Multi-Mode Reader (BioTek) at an excitation wavelength of 320 nm and an emission wavelength of 405 nm. These settings were consistent throughout all measurements done in this study. Blank values were subtracted from all raw values, and data were presented as relative fluorescence (relative fluorescence units) normalized to MMP activity in control samples.
Blood serum isolation.
At 48 h after SE, rats were killed by CO2 inhalation, the thoracic cavity was opened, and blood was drawn via right ventricular heart puncture. Blood was collected in a 3.5 ml SST Vacutainer (BD Biosciences), carefully inverted 5 times, and incubated for 30 min at room temperature. The tubes were centrifuged at 1300 × g for 10 min at 4°C in a Marathon 3200R swing-head centrifuge (Fisher Scientific). Supernatant was collected, aliquoted, and kept at −20°C until further use.
S100β ELISA.
The S100β ELISA kit (EMD Millipore, #EZHS100B-33K) was used to detect S100β in blood serum samples. ELISA reagents, standards, and serum samples were prepared and plated as recommended by the manufacturer. Absorbance was measured at 450 and 590 nm using a Synergy H1 Hybrid Multi-Mode Reader (BioTek). A standard curve was plotted using Gen5 software (version 2.07; values at 450 nm were corrected by the absorbance at 590 nm; Four Parameter Logistic ELISA curve fitting was chosen) to determine the concentration of S100β in serum samples.
Results
MMP expression and activity in isolated rat brain capillaries
First, we isolated rat brain capillaries and analyzed protein expression and functional activity of MMP-2 and MMP-9 at the blood-brain barrier. Figure 1A shows MMP-2 and MMP-9 immunostaining in freshly isolated rat brain capillaries. MMP-2 was mainly localized at the abluminal membrane of rat brain capillaries (Fig. 1A, left, arrow), whereas MMP-9 was mainly localized at the luminal membrane (Fig. 1A, middle, arrow, right, negative control [no primary antibody] is an overlay of the green, blue, and transmitted light channels). Using Western blotting, we detected a band for MMP-2 at 72 kDa and a band for MMP-9 at 92 kDa in liver lysate, liver crude membrane fraction, brain lysate, choroid plexus lysate, and brain capillary lysate (Fig. 1B). In kidney brush border membranes, we detected a strong band for MMP-9, whereas no obvious band was visible for MMP-2. In another series of Western blots, we compared the expression of MMP-2 and MMP-9 in brain capillary lysate and brain capillary membrane fraction (Fig. 1C). MMP-2 expression was enriched in brain capillary membranes compared with capillary lysate, whereas MMP-9 protein expression levels were higher in brain capillary lysate compared with capillary membranes.
Figure 1.
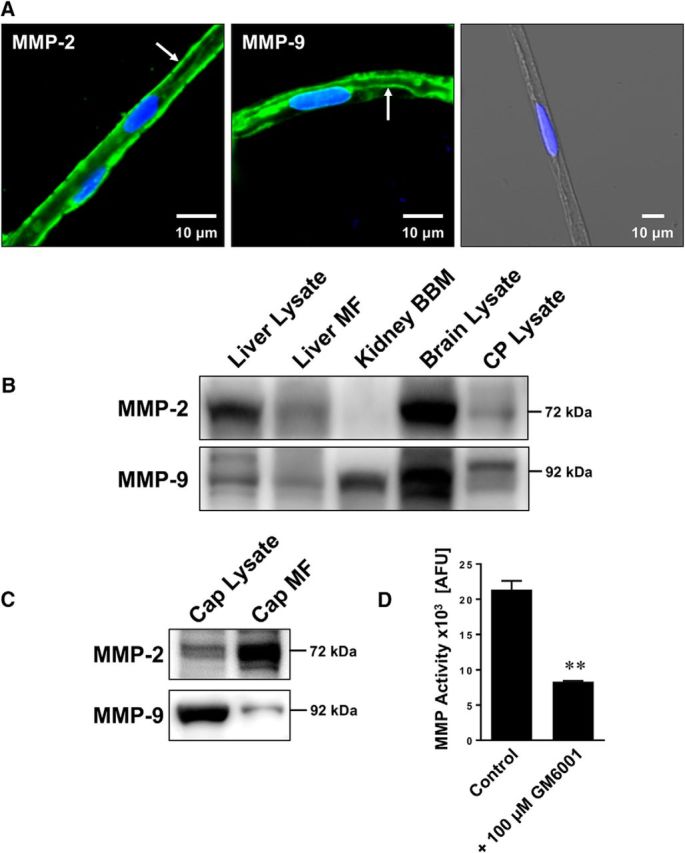
Expression and activity of MMP-2 and MMP-9 in isolated brain capillaries. A, Representative immunostaining for MMP-2 (left), MMP-9 (middle), and the negative control (right; overlay of green, blue, and transmitted light channels) in isolated rat brain capillaries. Green represents MMPs. Blue represents nuclei counterstained with DAPI. B, Western blot showing MMP-2 and MMP-9 in liver lysate, liver crude membrane fraction (MF), kidney brush border membrane (BBM), brain lysate, and choroid plexus (CP) lysate. C, Western blot showing MMP-2 and MMP-9 in brain capillary (Cap) lysate and brain capillary crude membrane fraction (Cap MF). D, Total MMP enzyme activity in brain capillaries was measured using the fluorogenic substrate Mca-PLGL-Dpa-AR-NH2. MMP activity was assessed in brain capillary lysate with or without MMP inhibitor (GM6001). MMP activity is given as AFU; data are mean ± SEM (n = 3 independent experiments; pooled tissue from n = 10 rats per experiment). **Significantly lower than control (t(2) = 10.37, p = 0.0092; unpaired t test).
To determine MMP functional activity in rat brain capillaries, we used a fluorogenic MMP assay using the nonfluorescent MMP substrate Mca-PLGL-Dpa-AR-NH2. This peptide has a fluorescent 7-methoxycoumarin (Mca) moiety that is connected by a PLGL peptide sequence with a 2,4-dinitrophenyl (Dpa) moiety that quenches Mca fluorescence. MMP-mediated cleavage of the PLGL sequence between the glycine and leucine releases Mca from the Dpa quencher resulting in fluorescence. Because the PLGL peptide is a substrate for multiple MMPs, including MMP-1, -2, -7, -8, -9, -12, -13, -14, -15, and -16, this assay determines overall MMP functional activity. Using this assay, we detected fluorescence (21,357 ± 1023 absolute fluorescence units [AFU]) representing MMP activity in isolated brain capillaries from control rats (Fig. 1D). Adding the broad-spectrum MMP inhibitor GM6001 reduced fluorescence significantly by 61% (8324 ± 105 AFU; t(2) = 10.37, p = 0.0092; unpaired t test; n = 3 independent experiments), indicating that MMPs are responsible for the largest portion of the observed fluorescence. Together, these data demonstrate that both MMP-2 and MMP-9 are expressed in isolated brain capillaries from healthy rats.
Epileptic seizures mediate barrier leakage
Next, we tested the effect seizures have on blood-brain barrier integrity. We isolated brain capillaries from rats 48 h after pilocarpine-induced SE and analyzed protein expression levels of tight junction proteins as well as MMP-2 and MMP-9 by Western blotting (Fig. 2A). MMP-2 and MMP-9 protein expression levels were increased in brain capillaries from animals that experienced SE. In the same samples, protein expression levels of the tight junction proteins ZO-1, occludin, claudin-1, and claudin-5 were decreased. Importantly, in brain capillaries from animals that received pilocarpine but did not experience SE, no such effects on tight junction and MMP protein expression levels were observed, indicating that seizures, not pilocarpine, mediated the observed changes in expression levels. Table 1 shows data from Western blot analyses; the Dunnett's test showed that for each endpoint SE significantly (p < 0.05) differed from controls.
Figure 2.
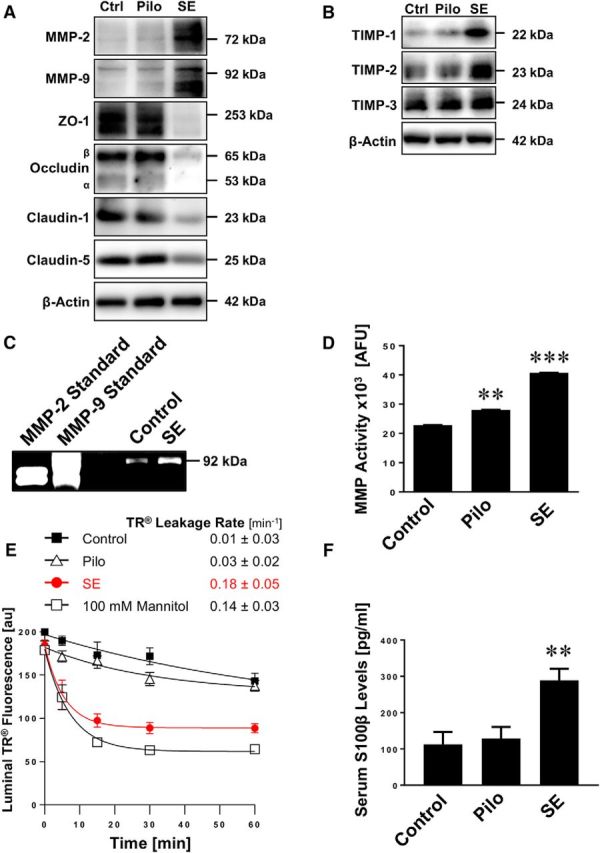
SE increases MMP levels, decreases levels of tight junction proteins, and causes barrier leakage in brain capillaries. A, Western blot showing MMP-2, MMP-9, ZO-1, occludin, claudin-1, and claudin-5 in isolated brain capillaries from rats after an SE induced with pilocarpine, rats that received pilocarpine but did not develop an SE (Pilo), and untreated control rats (Ctrl). β-Actin was used as protein loading control. B, Western blot showing TIMP-1, TIMP-2, and TIMP-3 protein expression in isolated brain capillaries from control, pilocarpine, and SE rats. C, Representative MMP-9 gelatin zymogram of brain capillary lysates from rats after SE and from control rats. Left, Positive controls from recombinant expressed MMP-2 and MMP-9. D, Total MMP enzyme activity in brain capillaries isolated from control rats, rats that received pilocarpine but did not develop an SE (Pilo), and rats after an SE was measured using the fluorogenic substrate Mca-PLGL-Dpa-AR-NH2. ***SE significantly higher than control, 1.8-fold (t(2) = 78.6, p = 0.0002; ANOVA post hoc test); Pilo significantly higher than control, 1.2-fold (t(2) = 19.0, p = 0.0028; ANOVA post hoc test); n = 2 independent experiments. E, Texas Red (TR) leakage from capillaries of rats after an SE induced by pilocarpine (SE), rats that received pilocarpine but did not develop an SE (Pilo), and untreated control rats with or without high osmotic mannitol used as positive control for barrier opening. Data are mean ± SEM for n = 7 capillaries per time point from one brain capillary isolation with n = 10 rats. Shown are 0–255 AFU. First-order efflux rates were calculated using nonlinear regression. F, S100β levels in serum samples from control rats, rats that received pilocarpine but did not develop an SE (Pilo), and rats after an SE was determined by ELISA. **Control versus SE: t(2) = 3.79, p > 0.0012; Pilo versus SE: t(2) = 3.58, p > 0.002 (ANOVA post hoc tests). n = 2 independent experiments.
TIMPs are endogenous inhibitors of MMPs and belong to the family of protease inhibitors. We show that protein expression levels of TIMP-1 and TIMP-2 are increased in isolated brain capillaries from SE animals, whereas TIMP-3 levels remained unchanged (Fig. 2B). Table 2 summarizes data from Western blot analyses; the Dunnett's test showed that TIMP-1 and TIMP-2 levels for SE are significantly (p < 0.05) different from controls. Consistent with increased MMP protein expression levels, gelatin zymography showed increased MMP-9 activity (92 kDa) in brain capillaries from SE rats compared with control rats (Fig. 2C). We also determined MMP activity in lysate from brain capillaries isolated from rats after SE and observed an increase in fluorescence by 80% (t(2) = 78.6, p = 0.0002; ANOVA post hoc test; n = 2 independent experiments) compared with brain capillary lysate from control animals, indicating that overall MMP activity was increased in SE rats (Fig. 2D). In brain capillary lysate from rats that received pilocarpine and experienced a few seizures (<10) but did not develop SE, fluorescence was elevated by ∼20% (t(2) = 19.0, p = 0.0028; ANOVA post hoc test) compared with controls (Fig. 2D).
Table 2.
Western blot analysis of TIMP protein expression levels in brain capillaries isolated from rats after SE (Fig. 2B)a
| Protein | Control | Pilo | SE |
|---|---|---|---|
| TIMP-1 | 100 ± 15.8 | 121.2 ± 17.8 | 235.6 ± 23* |
| TIMP-2 | 100 ± 9.8 | 107.1 ± 10.9 | 148.4 ± 16.4* |
| TIMP-3 | 100 ± 14.3 | 109.7 ± 15.9 | 115.0 ± 17.8 |
aData were normalized to β-actin levels; values are percentage control ± SD (n = 3).
*p < 0.05, each endpoint versus control (Dunnett's many-to-one t test).
To determine whether seizures affect blood-brain barrier integrity in isolated brain capillaries from male Sprague Dawley rats after SE, we used a previously established dye leakage assay (Hartz et al., 2004, 2012). In this assay, isolated brain capillaries are exposed to fluorescent Texas Red (641 Da, 2 μm). Because Texas Red is a substrate for the efflux transporter Mrp, it is actively transported into the capillary lumen, where it accumulates (Bauer et al., 2008). After 1 h, when luminal Texas Red fluorescence levels reached steady state, the dye is removed and Texas Red leakage from capillary lumens is monitored over time by live cell imaging using confocal microscopy. Luminal Texas Red fluorescence is quantified with image analysis software. First-order Texas Red leakage rate constants were calculated by nonlinear regression (Prism, version 7.00; RRID:SCR_002798, GraphPad). Using this assay, we demonstrate that the Texas Red leakage rate constant from brain capillary lumens of SE rats (0.18 ± 0.05 min−1) was 18-fold higher compared with the Texas Red leakage rate constant from capillaries from control rats (0.01 ± 0.03 min−1, Fig. 2E). The leakage rate constant from capillaries of SE rats was sixfold higher than in capillaries from rats that received pilocarpine and had some seizures but did not experience SE (0.03 ± 0.02 min−1; Fig. 2E). The Texas Red leakage rate constant from brain capillaries of SE rats (0.18 ± 0.05 min−1) was comparable with that from brain capillaries exposed to a hypertonic (100 mm) mannitol solution (0.14 ± 0.03 min−1), which was used as a positive control to osmotically open the barrier and increase Texas Red leakage (i.e., increase capillary permeability) (Hartz et al., 2004, 2012). Further, in serum isolated from SE rats, we found significantly elevated levels of S100β, an astrocytic protein that is used as a marker for barrier leakage, compared with control animals (Fig. 2F; Control vs SE: t(2) = 3.79, p < 0.0012; Pilo vs SE: t(2) = 3.58, p < 0.002; ANOVA post hoc tests; n = 2 independent experiments).
Together, these data suggest that seizure-induced increases in MMP-2 and MMP-9 expression and activity levels result in decreased expression levels of tight junction proteins and blood-brain barrier leakage.
Glutamate triggers barrier leakage
Glutamate is the most important excitatory neurotransmitter in the brain that is released in excessive amounts during seizures and has been shown to change blood-brain barrier properties (Ueda and Tsuru, 1995; Bauer et al., 2008; Pekcec et al., 2009; Zibell et al., 2009; Hartz et al., 2017). Here, we postulated that glutamate triggers barrier leakage. To test this hypothesis, we used a protocol we previously established (Bauer et al., 2008) and exposed isolated rat brain capillaries to 50 and 100 μm glutamate, removed glutamate after 30 min, and incubated capillaries in glutamate-free buffer for additional 5.5 h. After a total incubation time of 6 h, brain capillaries were analyzed. Similar to the effects observed in SE rats, we found decreased expression levels of the tight junction proteins ZO-1, occludin, and claudin-1 by Western blotting in isolated membranes of brain capillaries exposed to 100 μm glutamate; the effect of glutamate on claudin-5 expression levels was minimal (Fig. 3A). Moreover, 100 μm glutamate increased MMP-2 and MMP-9 protein levels in brain capillaries. In contrast, 50 μm glutamate had little to no effect on the expression levels of both tight junction proteins and MMPs. Table 3 summarizes data from Western blot analyses; the Dunnett's test showed that for each endpoint treatment with 100 μm glutamate, protein expression levels of MMP-2, MMP-9, ZO-1, occludin, and claudins-1 and -5 were significantly (p < 0.05) different from controls. In contrast to MMPs, protein expression levels of TIMP-1, TIMP-2, and TIMP-3 remained unchanged in capillaries exposed to glutamate (Fig. 3B). This suggests that TIMPs may be regulated via a different pathway that does not involve glutamate signaling. To further quantitate the glutamate-mediated increase of MMP protein expression levels, we also determined MMP-2 and MMP-9 protein levels by ELISA. Figure 3C shows that MMP-2 protein levels in brain capillaries exposed to glutamate increased by 45% compared with control capillaries (control: 0.105 ± 0.005 ng/ml, glutamate: 0.152 ± 0.005 ng/ml; n = 3 independent experiments, t(4) = 6.65, p = 0.0027; unpaired t test). Figure 3D shows that MMP-9 protein levels increased by 115% (control: 0.202 ± 0.04 ng/ml, glutamate: 0.434 ± 0.03 ng/ml; n = 3 independent experiments, t(4) = 4.63, p = 0.0098; unpaired t test). Further, we determined Texas Red leakage and found that brain capillaries exposed to glutamate had an increased Texas Red leakage rate constant compared with untreated control capillaries (Fig. 3E). Texas Red leakage rate constants were 0.1 ± 0.04 min−1 for untreated control capillaries, 0.2 ± 0.02 min−1 for capillaries exposed to glutamate, and 0.3 ± 0.08 min−1 for capillaries exposed to high osmotic mannitol (positive control for barrier opening). Thus, exposing brain capillaries to glutamate increased Texas Red leakage constant rates by twofold compared with Texas Red leakage constant rates from untreated control capillaries. Together, these findings demonstrate that glutamate mediates similar effects on tight junction and MMP protein expression levels and capillary permeability in isolated brain capillaries to those effects observed in brain capillaries isolated from SE rats. This suggests that the effects seizures have on brain capillaries are mediated by glutamate that is released during seizures.
Figure 3.

Glutamate increases MMP-2 and MMP-9 levels, decreases tight junction protein levels, and causes barrier leakage in isolated brain capillaries. A, Western blot showing MMP-2, MMP-9, ZO-1, occludin, claudin-1, and claudin-5 in isolated rat brain capillaries exposed to 0, 50, or 100 μm glutamate (Glu); β-actin was used as protein loading control. B, Western blot showing TIMP-1, TIMP-2, and TIMP-3 protein expression in isolated brain capillaries from control, pilocarpine, and SE rats. C, MMP-2 protein levels in rat brain capillary lysate determined by ELISA from control capillaries and capillaries exposed to 100 μm glutamate. Data are mean ± SEM (n = 3 independent experiments; pooled tissue of n = 10 rats per experiment). Statistical comparison: **t(4) = 6.65, p = 0.0027 (unpaired t test). D, MMP-9 protein levels in rat brain capillary lysate determined by ELISA from control capillaries and capillaries exposed to 100 μm glutamate. Data are mean ± SEM (n = 3 independent experiments; pooled tissue of n = 10 rats per experiment). Statistical comparison: **t(4) = 4.63, p = 0.0098 (unpaired t test). E, Texas Red leakage from rat brain capillaries exposed to 100 μm glutamate; high osmotic mannitol was used as positive control for barrier opening. Data are 0–255 AFU and presented as mean ± SEM for n = 7 brain capillaries per time point from one brain capillary isolation with n = 10 rats.
Table 3.
Western blot analysis of MMP and tight junction protein expression levels in brain capillaries exposed to glutamate (Fig. 3A)a
| Protein | Control | 50 μm glutamate | 100 μm glutamate |
|---|---|---|---|
| MMP-2 | 100 ± 11.2 | 91.1 ± 9.7 | 191.2 ± 8.4* |
| MMP-9 | 100 ± 2.0 | 102.4 ± 2.1 | 169.2 ± 3.6* |
| ZO-1 | 100 ± 6.4 | 92.8 ± 6.4 | 42.3 ± 3.3* |
| Occludin | 100 ± 0.9 | 102.8 ± 1.0 | 86.4 ± 0.8* |
| Claudin-1 | 100 ± 2.3 | 100.5 ± 5.2 | 59.8 ± 2.5* |
| Claudin-5 | 100 ± 15.6 | 92.4 ± 17.1 | 83.9 ± 2.9* |
aData were normalized to β-actin levels; values are percentage control ± SD (n = 3).
*p < 0.05, each endpoint versus control (Dunnett's many-to-one t test).
Glutamate increases MMP activity
We determined MMP activity in brain capillaries exposed to glutamate using gelatin zymography and the MMP activity assay described above. Figure 4A shows a representative zymogram with strong bands at 92 kDa representing MMP-9. The zymogram shows that exposing isolated rat brain capillaries to glutamate increased MMP-9 activity compared with untreated control capillaries. MMP-9 standard protein (positive control) is shown in the left lane. Figure 4B shows the results from optical density measurements of zymograms from four independent experiments. These data demonstrate that glutamate increased MMP-9 activity (1.81 ± 0.28-fold, t(6) = 5.77, p = 0.0012; unpaired t test) compared with untreated control capillaries. For MMP-2 we observed faint bands in the zymogram (data not shown). When we determined MMP activity, we found that exposing brain capillaries to glutamate significantly (p < 0.05) increased total MMP activity levels by 38% compared with control capillaries (control: 18,107 ± 616 AFU, glutamate: 25,041 ± 1917 AFU; n = 3 independent experiments; t(4) = 3.44, p = 0.026, unpaired t test; Fig. 4C). Recombinant MMP-2 and MMP-9 (6.25 ng each) were used as standard controls (MMP-2: 20,944 ± 1220 AFU; MMP-9: 16,509 ± 538 AFU). Thus, the results from these experiments demonstrate that exposing isolated rat brain capillaries to glutamate increases MMP activity.
Figure 4.
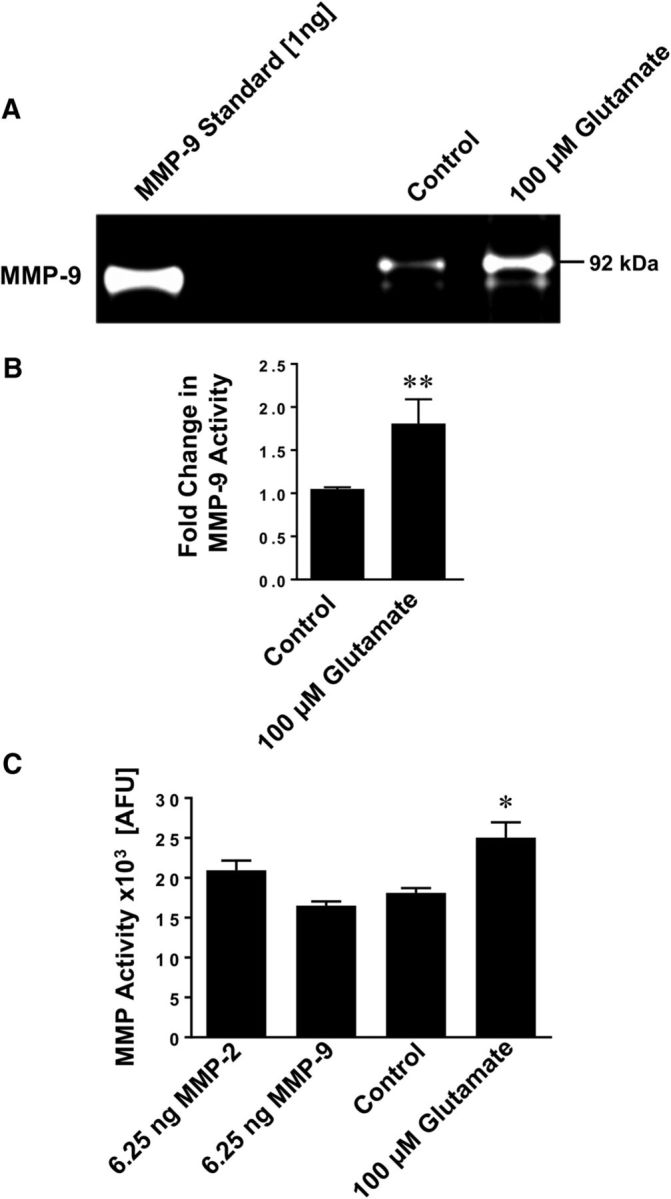
Glutamate increases MMP activity in isolated brain capillaries. A, Representative MMP-9 gelatin zymogram of lysate from brain capillaries exposed to 100 μm glutamate. Left, Recombinant MMP-9 (positive control). B, Densitometric analysis of n = 4 gelatin zymograms. Data are mean ± SEM (n = 4 independent experiments) and show the fold change over controls (1.81 ± 0.28-fold; t(6) = 5.77, p = 0.0012; unpaired t test) for MMP-9 activity in lysate from rat brain capillaries exposed to 100 μm glutamate. C, Total MMP enzyme activity in brain capillaries was measured using the fluorogenic substrate Mca-PLGL-Dpa-AR-NH2. MMP activity was measured in lysate from isolated brain capillaries exposed to 100 μm glutamate; recombinant rat MMP-2 and rat MMP-9 were used as positive controls. MMP activity is given as AFU; data are mean ± SEM (n = 3 independent experiments). *Significantly lower than control (t(4) = 3.44, p = 0.026, unpaired t test). **Significantly higher than control, p < 0.01.
MMP inhibition prevents glutamate-mediated blood-brain barrier leakage
To further clarify the role of MMPs in glutamate-mediated barrier leakage, we exposed isolated rat brain capillaries to glutamate with or without the broad-spectrum MMP inhibitor GM6001. We found that glutamate-mediated increase in MMP activity was fully blocked by GM6001 (control: 10.7 ± 0.6 AFU; glutamate: 16.8 ± 0.8 AFU; glutamate + GM6001: 11.3 ± 0.2 AFU; glutamate + GM6001 vs control: t(2) = 0.69, p = 0.56; glutamate + GM6001 vs glutamate: t(2) = 4.83, p = 0.04, ANOVA post hoc tests; n = 3 independent experiments; Figure 5A). Importantly, GM6001 also fully blocked glutamate-mediated brain capillary leakage as determined by the Texas Red assay (Fig. 5B). Thus, GM6001 prevented barrier leakage, suggesting that MMP inhibition can maintain barrier function. These data indicate that MMPs are involved in glutamate-mediated barrier leakage.
Figure 5.

Effect of inhibiting MMPs on glutamate-mediated barrier leakage. A, Total MMP enzyme activity in brain capillaries was assessed by using the fluorogenic substrate Mca-PLGL-Dpa-AR-NH2. MMP activity was measured in lysate from isolated brain capillaries exposed to 100 μm glutamate with or without the MMP inhibitor GM6001. MMP activity is given as AFU; data are mean ± SEM (n = 3 independent experiments; pooled tissue of 10 rats per experiment). Statistical comparison: *control: 10.7 ± 0.6 AFU; glutamate: 16.8 ± 0.8 AFU; glutamate + GM6001: 11.3 ± 0.2 AFU; glutamate + GM6001 versus control: t(2) = 0.69, p = 0.56; glutamate + GM6001 versus glutamate: t(2) = 4.83, p = 0.04 (ANOVA post hoc tests). B, Texas Red leakage was measured in capillaries exposed to 100 μm glutamate with or without the MMP inhibitor GM6001.
Glutamate mediates barrier leakage by signaling through cPLA2
In the following experiments, we identified signaling steps underlying glutamate-mediated MMP upregulation and barrier leakage. We and other groups have previously shown that the NMDAR is expressed in brain capillaries and that glutamate signals through NMDAR, which triggers changes at the blood-brain barrier (Zhu and Liu, 2004; Bankstahl et al., 2008; Bauer et al., 2008). In the present study, we exposed isolated rat brain capillaries to glutamate with or without the NMDAR antagonist MK801. Blocking the NMDAR with MK801 abolished the glutamate-mediated increase in MMP-2 and MMP-9 protein expression levels as demonstrated by Western blotting (Fig. 6A; for Western blot analyses, see Table 4). MK801 also prevented the glutamate-mediated increase in the Texas Red leakage rate constant (Fig. 6B; control: 0.2 ± 0.09 min−1; glutamate: 0.6 ± 0.13 min−1; glutamate and MK801: 0.2 ± 0.08 min−1; mannitol (positive control): 0.7 ± 0.17 min−1). These data suggest that glutamate causes barrier leakage by signaling through the NMDAR.
Figure 6.
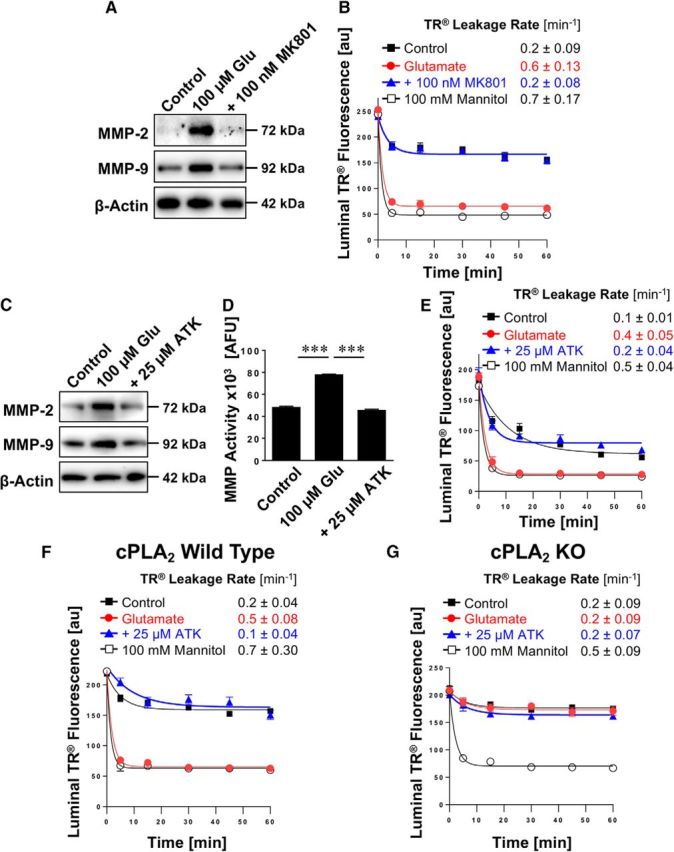
Effect of inhibiting cPLA2 on glutamate-mediated MMP-2 and MMP-9 induction and barrier leakage. A, Western blots showing MMP-2 and MMP-9 protein expression in isolated rat brain capillaries exposed to 100 μm glutamate with or without the NMDAR antagonist MK801. β-Actin was used as protein loading control. B, Texas Red leakage assay showing glutamate-mediated barrier leakage with or without the NMDAR antagonist MK801. C, Western blots showing MMP-2 and MMP-9 protein expression levels in isolated rat brain capillaries exposed to 100 μm glutamate with or without the cPLA2 inhibitor ATK. β-Actin was used as protein loading control. D, MMP activity assessed in isolated capillaries exposed to 100 μm glutamate with or without ATK (ATK vs control: t(2) = 3.08, p = 0.091; ANOVA post hoc test). E, Texas Red leakage assay showing glutamate-mediated barrier leakage with or without ATK (cPLA2 inhibitor). Texas Red leakage assay in capillaries from (F) wild-type and (G) cPLA2 KO mice that were exposed to 100 μm glutamate with or without the cPLA2 inhibitor ATK. Data are 0–255 AFU and presented as mean ± SEM for n = 7 brain capillaries per time point from one capillary isolation with n = 10 rats or n = 30 mice, respectively. ***Significantly higher than control, p < 0.001.
Table 4.
Western blot analysis of MMP protein expression levels in brain capillaries exposed to glutamate (Fig. 6A)a
| Protein | Control | 100 μm glutamate | + MK801 |
|---|---|---|---|
| MMP-2 | 100 ± 8.2 | 190.8 ± 6.1* | 129.8 ± 6.6 |
| MMP-9 | 100 ± 4.2 | 183.4 ± 5.3* | 123.0 ± 5.8 |
aData were normalized to β-actin levels; values are percentage control ± SD (n = 3).
*p < 0.05, each endpoint versus control (Dunnett's many-to-one t test).
In the next set of experiments, we exposed isolated rat brain capillaries to glutamate with or without ATK, a selective inhibitor of cPLA2. ATK blocked the glutamate-mediated increase in MMP-2 and MMP-9 protein expression levels as demonstrated by Western blotting (Fig. 6C; for Western blot analyses, see Table 5). Inhibiting cPLA2 with ATK also prevented the glutamate-mediated increase in MMP activity levels (Fig. 6D; ATK vs control: t(2) = 3.08, p = 0.091; ANOVA post hoc test). Consistent with this, ATK attenuated the glutamate-mediated increase in Texas Red leakage (Fig. 6E; control: 0.1 ± 0.01 min−1; glutamate: 0.4 ± 0.05 min−1; glutamate and ATK: 0.2 ± 0.04 min−1; mannitol [positive control]: 0.5 ± 0.04 min−1). Thus, inhibiting cPLA2 blocked the glutamate-mediated increase in MMP protein and activity levels, thereby preventing capillary leakage. We repeated this experiment with capillaries isolated from wild-type and cPLA2 KO mice. As before, we observed leakage in capillaries isolated from wild-type mice that were exposed to glutamate (Fig. 6F); this effect was abolished by cPLA2 inhibition with ATK. In contrast, exposing isolated brain capillaries from cPLA2 KO mice to glutamate did not result in detectable Texas Red leakage compared with control capillaries (Fig. 6G). This indicates that glutamate triggers capillary leakage by signaling through cPLA2.
Table 5.
Western blot analysis of MMP protein expression levels in brain capillaries exposed to glutamate (Fig. 6C)a
| Protein | Control | 100 μm glutamate | + ATK |
|---|---|---|---|
| MMP-2 | 100 ± 3.3 | 174.4 ± 8.0* | 109.5 ± 5.2 |
| MMP-9 | 100 ± 2.8 | 174.1 ± 3.2* | 108.3 ± 2.6 |
aData were normalized to β-actin levels; values are percentage control ± SD (n = 3).
*p < 0.05, each endpoint versus control (Dunnett's many-to-one t test).
Together, these data show that inhibiting cPLA2 or genetically knocking out cPLA2 abolishes glutamate-induced barrier leakage, which, in turn, suggests that cPLA2 is responsible for glutamate-mediated upregulation of MMPs and capillary leakage.
Inhibiting cPLA2 in vivo prevents SE-induced barrier leakage
To confirm that cPLA2 signaling is involved in SE-induced barrier leakage, we conducted an in vivo study using the specific cPLA2 inhibitor ATK. Rats were dosed with ATK (10 mg/kg, i.p.) every 12 h for 3.5 d (total of 7 i.p. injections); control rats received vehicle injections. After 4 ATK treatments, rats underwent seizure induction with pilocarpine; after SE induction animals received 3 more treatments with ATK. Forty-eight hours after SE induction, brain capillaries were isolated from control rats (n = 6), pilocarpine control rats (n = 4), SE rats (n = 6), and ATK-treated SE rats (n = 6). As before, we detected increased MMP-2 and MMP-9 protein expression levels and decreased tight junction protein expression levels in brain capillaries isolated from rats after SE (Fig. 7A; for Western blot analyses, see Table 6). However, in animals treated with ATK, MMP and tight junction protein levels were comparable with those in capillaries from control animals and animals that received pilocarpine but did not develop SE. Data from analyzed Western blots (Table 2) show that MMP-2, MMP-9, and claudin-5 protein expression levels in brain capillaries from SE animals were significantly different (p < 0.05; Dunnett's test) from those of the control group. Only MMP-2 protein expression levels in brain capillaries from ATK-treated SE rats differed from control rats. Protein expression levels in brain capillaries from rats that received pilocarpine but did not experience SE did not differ from protein levels in capillaries from control rats for any of the endpoints. Consistent with this, ATK also blocked SE-mediated capillary leakage as measured by the Texas Red leakage assay (control: 0.03 ± 0.02 min−1; pilocarpine: 0.03 ± 0.05 min−1; SE: 0.10 ± 0.02 min−1; SE + ATK: 0.03 ± 0.01 min−1; mannitol [positive control]: 0.21 ± 0.04 min−1, Fig. 7B). Thus, dosing rats with ATK to inhibit cPLA2 blocks the SE-mediated increase in MMP protein levels, the decrease in tight junction protein levels, and prevents barrier leakage.
Figure 7.

Inhibition of cPLA2 in vivo in SE rats. A, Western blot showing MMP-2, MMP-9, ZO-1, occludin, claudin-1, and claudin-5 in brain capillaries isolated from control rats (Ctrl) and from rats that experienced pilocarpine-induced SE, that received pilocarpine but did not develop SE (Pilo), and that experienced SE and received the cPLA2 inhibitor ATK (SE + ATK). B, Texas Red leakage in brain capillaries from control rats (n = 6), pilocarpine control rats (n = 4), SE control rats (n = 6), and ATK-treated SE rats (n = 6). High osmotic mannitol was used as positive marker for capillary leakage. Data are 0–255 AFU and are presented as mean ± SEM for n = 7 brain capillaries per time point from pooled tissue per group.
Together, our observations indicate that cPLA2 inhibition in vivo prevents seizure-induced upregulation of MMP2 and MMP-9, decreased TJ protein levels and barrier leakage in rats that experienced SE. Thus, cPLA2 appears to be involved in mediating seizure-induced barrier dysfunction.
Discussion
In the present study, we show that MMP-2 and MMP-9 are expressed and functionally active in isolated rat brain capillaries (Fig. 1). We also demonstrate that seizures result in increased MMP-2 and MMP-9 protein and activity levels, reduced expression levels of the tight junction proteins ZO-1, occludin, claudin-1, and claudin-5, elevated S100β serum levels, and in capillary leakage (Fig. 2). We found increased expression levels of TIMP-1 in capillaries isolated from rats that experienced seizures (Fig. 2B), which is similar to the finding that TIMP-1 is upregulated in neurons and astrocytes in rats after kainic acid-induced seizures (Rivera et al., 1997). However, TIMP-1, TIMP-2, and TIMP-3 protein expression levels did not change in capillaries exposed to glutamate, suggesting that TIMPs may be regulated via a different pathway that does not involve glutamate signaling (Fig. 3B). We further demonstrate that glutamate signals through the NMDAR, which triggers increases in MMP expression and capillary leakage (Figs 6A,B). We also show that glutamate signals through cPLA2 to trigger increases in MMP expression and activity levels, decreases in tight junction protein levels, and capillary leakage ex vivo (Figs. 3–6). We confirmed these findings in vivo by using the potent and selective cPLA2 inhibitor ATK in a rat seizure model. We show that ATK treatment blocks seizure-induced increases in MMP expression levels, decreases in tight junction protein levels, and prevents capillary leakage (Fig. 7). Based on these data, we propose that seizure-induced release of glutamate leads to activation of cPLA2, which, in turn, increases MMP expression and activity levels. MMPs then decrease tight junction protein expression resulting in barrier leakage (Fig. 8). Together, our data suggest that cPLA2 could be a potential pharmaceutical target to normalize barrier function and improve treatment of epilepsy. In the following sections, we discuss several points of the present study in more detail.
Figure 8.

Proposed signaling pathway.
Recent studies have shown that the blood-brain barrier is severely altered in epilepsy and that barrier dysfunction affects neuronal function and leads to seizures (Marchi et al., 2007a,b; Rigau et al., 2007; van Vliet et al., 2007; Tomkins et al., 2008; Kastanauskaite et al., 2009; Alonso-Nanclares and DeFelipe, 2014). One critical element of barrier dysfunction is barrier leakage, which was observed in animal seizure and epilepsy models as well as in epilepsy patients (Nitsch and Klatzo, 1983; Mihály and Bozóky, 1984; Cornford and Oldendorf, 1986; Horowitz et al., 1992; Padou et al., 1995). Our data from the present study are consistent with these observations. Several studies showed that blood-brain barrier leakage in epilepsy was restricted to anatomically specific brain regions and that these brain regions are often implicated in the development and propagation of seizures (Nitsch and Klatzo, 1983; Cornford et al., 1998). This suggests a connection between barrier leakage and seizures. Indeed, recent studies provide additional evidence for the hypothesis that a leaky barrier contributes to seizure genesis through a pernicious feedback loop, in which seizures drive barrier leakage, leading to more seizures, thereby promoting epilepsy progression (Seiffert et al., 2004; Marchi et al., 2007b, 2010, 2011; van Vliet et al., 2007; Fabene et al., 2008).
The exact mechanism by which barrier leakage develops in epilepsy is unknown. Rapid increases in vascular permeability following seizures have been reported by Uva et al. (2008) and Vazana et al. (2016). In the present study, we focus on seizure-induced effects on barrier function that are mediated MMPs. The extracellular matrix together with tight junction proteins seal the endothelial cells and thus are critical components for proper barrier function. Previously, it has been shown that MMPs cleave the extracellular matrix and degrade tight junction proteins, thereby contributing to barrier leakage (Lischper et al., 2010; Thanabalasundaram et al., 2010). Based on these data, we hypothesized that MMPs may be key players responsible for barrier leakage in epilepsy. In this regard, we show that MMP-2 and MMP-9 are expressed in different rat tissues, including isolated brain capillaries. These data are consistent with previous reports (Zeisberg et al., 2002; Nico et al., 2006; Zeni et al., 2007; Thanabalasundaram et al., 2010; Hartz et al., 2012; Kurzepa et al., 2014). To test whether MMPs are functionally active in isolated brain capillaries, we used gelatin zymography. Although we detected strong bands for MMP-9 activity, band intensity for MMP-2 activity was low and could not be clearly visualized. We therefore developed an MMP assay based on the digestion of the fluorogenic MMP substrate PLGL. Because PLGL is a substrate for various MMPs, the data obtained from this assay reflect overall MMP activity in brain capillary samples. The only MMPs known to be expressed in the brain capillary endothelium are MMP-2, MMP-9, and MMP-14 (or MT1-MMP; which is known to activate MMP-2). Based on preliminary data (data not shown) from our group, MMP-14 protein is expressed at relatively low levels compared with MMP-2 and MMP-9. Therefore, we conclude that the assay we used here mainly determines MMP-2 and MMP-9 activity in isolated brain capillaries. Based on our preliminary data with brain lysate (data not shown), we found no increase in MMP activity in brain tissue from SE animals compared with control animals. This indicates that the observed increase of MMP activity after seizures appears to be specific to brain capillaries.
The data from rats that experienced an SE also suggest that seizures lead to increased MMP levels, which in turn leads to decreased tight junction protein levels, thereby causing barrier leakage within 48 h after SE. This is consistent with findings from human studies showing increased blood-brain barrier permeability shortly after seizure onset (Clarke and Gabrielsen, 1989; Marchi et al., 2007a; Rigau et al., 2007; van Vliet et al., 2007; Tomkins et al., 2008). Preclinical studies with patients evaluated for acute stroke suggest a significant relationship between MMP-9 and barrier leakage in humans (Barr et al., 2010). Utilizing a mouse model of cortical spreading depression, Gursoy-Ozdemir et al. (2004) showed that increased MMP-9 activity causes barrier leakage, which was confirmed in MMP-9 KO mice. Le and Friedman (2012) recently reported that proMMP-7 protein levels were elevated in culture medium from brain slices exposed to kainic acid for 24 h. They also observed that MMP-7 protein and activity levels were decreased and TIMP-1 protein expression levels were increased in hippocampal sections after kainic acid-induced seizures. In contrast, we found that MMP-2 and MMP-9 as well as TIMP-1 and TIMP-2 were elevated in isolated brain capillaries 48 h after SE induction with pilocarpine (Fig. 2), suggesting that the observed increase in TIMP levels was not sufficient to block MMP activity in capillaries. Le and Friedman (2012) also demonstrated that exogenously supplied MMP-7 to hippocampal slices in combination with kainic acid displayed a neuroprotective effect, which highlights the ambivalent role MMPs play in epilepsy.
A critical discovery was made in 1975 when Nemeroff and Crisley (1975) found that intraperitoneal injections of monosodium l-glutamate (4.0 g/kg) induce seizures in rats and lead to increased blood-brain barrier permeability to plasma proteins. In 1995, Ueda and Tsuru (1995) reported that glutamate is excessively released during seizures; this finding was confirmed by other groups (Ronne-Engström et al., 1992; During and Spencer, 1993; Wilson et al., 1996). We previously reported that glutamate released by seizures acts as an initial trigger of a signaling cascade in brain capillary endothelial cells that drives upregulation of the drug efflux transporter P-glycoprotein. In this regard, we demonstrated that glutamate signaling is mediated through the NMDAR, cyclooxygenase (COX)-2, and the prostaglandin E2 receptor EP1 (Bauer et al., 2008; Pekcec et al., 2009; Zibell et al., 2009). Here, we demonstrate in brain capillaries that glutamate also acts as an initial trigger of a signaling cascade that results in elevated MMP-2 and MMP-9 protein and activity levels, decreased expression levels of the TJ proteins occludin, claudin-1, claudin-5 and ZO-1, and consequently barrier leakage. Together, these data confirm our previously published reports and provide additional and novel insights into the underlying mechanism through which glutamate triggers barrier leakage.
The neurotransmitter glutamate exerts its effects by activating glutamate receptors. We and others previously showed that the glutamate receptor NMDAR is expressed in brain capillary endothelial cells (Bauer et al., 2008; Betzen et al., 2009) and that it mediates seizure- and glutamate-induced increases in P-gp protein expression and transport activity levels (Zhu and Liu, 2004; Bankstahl et al., 2008; Bauer et al., 2008). We show that the NMDAR is also involved in glutamate-induced increases in MMP-2 and MMP-9 protein expression levels and in glutamate-induced brain capillary leakage (Fig. 6A,B). This is consistent with a previous report showing that NMDAR is critical for glutamate-induced decreases of occludin protein expression levels leading to decreased endothelial integrity in brain microvascular endothelial cells (András et al., 2007). Vazana et al. (2016) found that seizure-induced glutamate release in rats leads to vascular permeability through activation of the NMDAR. Betzen et al. (2009) demonstrated in cell culture experiments in vitro that oxidative stress upregulates NMDAR protein expression and activity levels, which leads to glutamate-induced barrier leakage in the mouse brain capillary bEND3 cell line. In contrast, Sharp et al. (2005) showed that human cerebral endothelial cells respond to glutamate by generating oxidative stress via activation of the NMDAR. Together, these data suggest a key role for the NMDAR in glutamate-mediated barrier dysfunction.
Glutamate has also been shown to activate calcium-dependent cPLA2 to trigger downstream signaling events (Six and Dennis, 2000; Shen et al., 2007; Shelat et al., 2008). Here we demonstrate that cPLA2 inhibition fully abolished all observed glutamate effects and thus prevented the increase in MMP expression and activity levels, the decrease in tight junction protein levels, and capillary leakage. Further, we show that the cPLA2 inhibitor ATK prevents seizure-induced barrier leakage and normalizes MMP levels as well as ZO-1, occludin, claudin-1, and claudin-5 protein levels. Based on these findings, we conclude that seizure-induced glutamate release results in cPLA2 activation, which leads to barrier leakage. Our data imply that arachidonic acid, a second messenger and key inflammatory intermediate generated by cPLA2, is involved in this signaling pathway. After its release, arachidonic acid is converted by cyclooxygenase-2 into prostaglandins or by 5-lipoxygenase into leukotrienes (Samuelsson et al., 1978; Goetzl et al., 1980; Sirois et al., 1980).
Together, our data suggest that cPLA2 inhibition has the potential to prevent blood-brain barrier leakage and that cPLA2 could be an additional therapeutic target in the treatment of epilepsy and help reduce seizure burden. However, this needs further confirmation and should be considered carefully. Because cPLA2 signaling is a component of the brain's inflammatory response, targeting cPLA2 could have a range of consequences, expected and beneficial as well as unintended and detrimental. For example, given that cPLA2 is part of the COX-2 pathway, inhibiting cPLA2 is likely to cause side effects similar to those observed for NSAIDs. Further, whereas the majority of studies using COX-2 inhibitors showed a neuroprotective effect in animal seizure and epilepsy models, some studies showed that COX-2 inhibition resulted in an increased seizure burden, neuronal loss, and death (Baik et al., 1999; Desjardins et al., 2003; Takemiya et al., 2006; Holtman et al., 2010; Polascheck et al., 2010).
In conclusion, in the present study, we use a combined ex vivo/in vivo approach and demonstrate at the blood-brain barrier that seizures increase MMP-2 and MMP-9 levels, resulting in reduced levels of tight junction proteins and subsequently barrier leakage. We also show that glutamate signals through cPLA2 to trigger these changes ex vivo and in vivo. Thus, we propose cPLA2 as a potential pharmaceutical target to repair barrier dysfunction and improve epilepsy treatment. Additional studies are needed to gain more detailed insight into the mechanism responsible for barrier leakage in epilepsy and to test whether cPLA2 has potential as a therapeutic target for epilepsy treatment and other neurological disorders with underlying barrier dysfunction.
Footnotes
This work was supported by National Institute of Neurological Disorders and Stroke Grant 1R01NS079507 to B.B. The content is solely the responsibility of the authors and does not necessarily represent the official views of the National Institute of Neurological Disorders and Stroke or the National Institutes of Health. We thank Dr. Joseph V. Bonventre (Brigham and Women's Hospital, Harvard Medical School) for cPLA2 breeding pairs; Eileen O'Leary for advice on breeding and genotyping; Stephanie Edelmann for technical assistance with breeding and genotyping; and the B.B. and A.M.S.H. laboratories for proofreading the manuscript.
The authors declare no competing financial interests.
References
- Alonso-Nanclares L, DeFelipe J (2014) Alterations of the microvascular network in the sclerotic hippocampus of patients with temporal lobe epilepsy. Epilepsy Behav 38:48–52. 10.1016/j.yebeh.2013.12.009 [DOI] [PubMed] [Google Scholar]
- András IE, Deli MA, Veszelka S, Hayashi K, Hennig B, Toborek M (2007) The NMDA and AMPA/KA receptors are involved in glutamate-induced alterations of occludin expression and phosphorylation in brain endothelial cells. J Cereb Blood Flow Metab 27:1431–1443. 10.1038/sj.jcbfm.9600445 [DOI] [PubMed] [Google Scholar]
- Baik EJ, Kim EJ, Lee SH, Moon C (1999) Cyclooxygenase-2 selective inhibitors aggravate kainic acid induced seizure and neuronal cell death in the hippocampus. Brain Res 843:118–129. 10.1016/S0006-8993(99)01797-7 [DOI] [PubMed] [Google Scholar]
- Bankstahl JP, Hoffmann K, Bethmann K, Löscher W (2008) Glutamate is critically involved in seizure-induced overexpression of P-glycoprotein in the brain. Neuropharmacology 54:1006–1016. 10.1016/j.neuropharm.2008.02.008 [DOI] [PubMed] [Google Scholar]
- Barr TL, Latour LL, Lee KY, Schaewe TJ, Luby M, Chang GS, El-Zammar Z, Alam S, Hallenbeck JM, Kidwell CS, Warach S (2010) Blood-Brain barrier disruption in humans is independently associated with increased matrix metalloproteinase-9. Stroke 41:e123–128. 10.1161/STROKEAHA.109.570515 [DOI] [PMC free article] [PubMed] [Google Scholar]
- Bauer B, Hartz AM, Pekcec A, Toellner K, Miller DS, Potschka H (2008) Seizure-induced up-regulation of P-glycoprotein at the Blood-Brain barrier through glutamate and cyclooxygenase-2 signaling. Mol Pharmacol 73:1444–1453. 10.1124/mol.107.041210 [DOI] [PubMed] [Google Scholar]
- Betzen C, White R, Zehendner CM, Pietrowski E, Bender B, Luhmann HJ, Kuhlmann CR (2009) Oxidative stress upregulates the NMDA receptor on cerebrovascular endothelium. Free Radic Biol Med 47:1212–1220. 10.1016/j.freeradbiomed.2009.07.034 [DOI] [PubMed] [Google Scholar]
- Bonventre JV, Huang Z, Taheri MR, O'Leary E, Li E, Moskowitz MA, Sapirstein A (1997) Reduced fertility and postischaemic brain injury in mice deficient in cytosolic phospholipase A2. Nature 390:622–625. 10.1038/37635 [DOI] [PubMed] [Google Scholar]
- Clarke HB, Gabrielsen TO (1989) Seizure induced disruption of Blood-Brain barrier demonstrated by CT. J Comput Assist Tomogr 13:889–892. 10.1097/00004728-198909000-00026 [DOI] [PubMed] [Google Scholar]
- Cornford EM, Oldendorf WH (1986) Epilepsy and the Blood-Brain barrier. Adv Neurol 44:787–812. [PubMed] [Google Scholar]
- Cornford EM, Gee MN, Swartz BE, Mandelkern MA, Blahd WH, Landaw EM, Delgado-Escueta AV (1998) Dynamic [18F]fluorodeoxyglucose positron emission tomography and hypometabolic zones in seizures: reduced capillary influx. Ann Neurol 43:801–808. 10.1002/ana.410430615 [DOI] [PubMed] [Google Scholar]
- Coulter DA, Eid T (2012) Astrocytic regulation of glutamate homeostasis in epilepsy. Glia 60:1215–1226. 10.1002/glia.22341 [DOI] [PMC free article] [PubMed] [Google Scholar]
- Desjardins P, Sauvageau A, Bouthillier A, Navarro D, Hazell AS, Rose C, Butterworth RF (2003) Induction of astrocytic cyclooxygenase-2 in epileptic patients with hippocampal sclerosis. Neurochem Int 42:299–303. 10.1016/S0197-0186(02)00101-8 [DOI] [PubMed] [Google Scholar]
- During MJ, Spencer DD (1993) Extracellular hippocampal glutamate and spontaneous seizure in the conscious human brain. Lancet 341:1607–1610. 10.1016/0140-6736(93)90754-5 [DOI] [PubMed] [Google Scholar]
- Edefonti V, Bravi F, Turner K, Beghi E, Canevini MP, Ferraroni M, Piazzini A (2011) Health-related quality of life in adults with epilepsy: the effect of age, age at onset and duration of epilepsy in a multicentre Italian study. BMC Neurol 11:33. 10.1186/1471-2377-11-33 [DOI] [PMC free article] [PubMed] [Google Scholar]
- Fabene PF, Navarro Mora G, Martinello M, Rossi B, Merigo F, Ottoboni L, Bach S, Angiari S, Benati D, Chakir A, Zanetti L, Schio F, Osculati A, Marzola P, Nicolato E, Homeister JW, Xia L, Lowe JB, McEver RP, Osculati F, et al. (2008) A role for leukocyte-endothelial adhesion mechanisms in epilepsy. Nat Med 14:1377–1383. 10.1038/nm.1878 [DOI] [PMC free article] [PubMed] [Google Scholar]
- Feng ZH, Hao J, Ye L, Dayao C, Yan N, Yan Y, Chu L, Shi FD (2011) Overexpression of mu-calpain in the anterior temporal neocortex of patients with intractable epilepsy correlates with clinicopathological characteristics. Seizure 20:395–401. 10.1016/j.seizure.2011.01.010 [DOI] [PMC free article] [PubMed] [Google Scholar]
- Goetzl EJ, Hill HR, Gorman RR (1980) Unique aspects of the modulation of human neutrophil function by 12-L-hydroperoxy-5,8,10,14-eicosatetraenoic acid. Prostaglandins 19:71–85. 10.1016/0090-6980(80)90155-0 [DOI] [PubMed] [Google Scholar]
- Gursoy-Ozdemir Y, Qiu J, Matsuoka N, Bolay H, Bermpohl D, Jin H, Wang X, Rosenberg GA, Lo EH, Moskowitz MA (2004) Cortical spreading depression activates and upregulates MMP-9. J Clin Invest 113:1447–1455. 10.1172/JCI200421227 [DOI] [PMC free article] [PubMed] [Google Scholar]
- Hartz AM, Bauer B, Fricker G, Miller DS (2004) Rapid regulation of P-glycoprotein at the Blood-Brain barrier by endothelin-1. Mol Pharmacol 66:387–394. 10.1124/mol.104.001503 [DOI] [PubMed] [Google Scholar]
- Hartz AM, Bauer B, Soldner EL, Wolf A, Boy S, Backhaus R, Mihaljevic I, Bogdahn U, Klünemann HH, Schuierer G, Schlachetzki F (2012) Amyloid-beta contributes to Blood-Brain barrier leakage in transgenic human amyloid precursor protein mice and in humans with cerebral amyloid angiopathy. Stroke 43:514–523. 10.1161/STROKEAHA.111.627562 [DOI] [PMC free article] [PubMed] [Google Scholar]
- Hartz AM, Pekcec A, Soldner EL, Zhong Y, Schlichtiger J, Bauer B (2017) P-gp protein expression and transport activity in rodent seizure models and human epilepsy. Mol Pharm 14:999–1011. 10.1021/acs.molpharmaceut.6b00770 [DOI] [PMC free article] [PubMed] [Google Scholar]
- Heinemann U, Kaufer D, Friedman A (2012) Blood-Brain barrier dysfunction, TGFbeta signaling, and astrocyte dysfunction in epilepsy. Glia 60:1251–1257. 10.1002/glia.22311 [DOI] [PMC free article] [PubMed] [Google Scholar]
- Holtman L, van Vliet EA, Edelbroek PM, Aronica E, Gorter JA (2010) Cox-2 inhibition can lead to adverse effects in a rat model for temporal lobe epilepsy. Epilepsy Res 91:49–56. 10.1016/j.eplepsyres.2010.06.011 [DOI] [PubMed] [Google Scholar]
- Horowitz SW, Merchut M, Fine M, Azar-Kia B (1992) Complex partial seizure-induced transient MR enhancement. J Comput Assist Tomogr 16:814–816. 10.1097/00004728-199209000-00025 [DOI] [PubMed] [Google Scholar]
- Hu X, Beeton C (2010) Detection of functional matrix metalloproteinases by zymography. J Vis Exp 8:2445. 10.3791/2445 [DOI] [PMC free article] [PubMed] [Google Scholar]
- Kastanauskaite A, Alonso-Nanclares L, Blazquez-Llorca L, Pastor J, Sola RG, DeFelipe J (2009) Alterations of the microvascular network in sclerotic hippocampi from patients with epilepsy. J Neuropathol Exp Neurol 68:939–950. 10.1097/NEN.0b013e3181b08622 [DOI] [PubMed] [Google Scholar]
- Kurzepa J, Kurzepa J, Golab P, Czerska S, Bielewicz J (2014) The significance of matrix metalloproteinase (MMP)-2 and MMP-9 in the ischemic stroke. Int J Neurosci 124:707–716. 10.3109/00207454.2013.872102 [DOI] [PubMed] [Google Scholar]
- Kwan P, Brodie MJ (2010) Definition of refractory epilepsy: defining the indefinable? Lancet Neurol 9:27–29. 10.1016/S1474-4422(09)70304-7 [DOI] [PubMed] [Google Scholar]
- Le AP, Friedman WJ (2012) Matrix metalloproteinase-7 regulates cleavage of pro-nerve growth factor and is neuroprotective following kainic acid-induced seizures. J Neurosci 32:703–712. 10.1523/JNEUROSCI.4128-11.2012 [DOI] [PMC free article] [PubMed] [Google Scholar]
- Lischper M, Beuck S, Thanabalasundaram G, Pieper C, Galla HJ (2010) Metalloproteinase mediated occludin cleavage in the cerebral microcapillary endothelium under pathological conditions. Brain Res 1326:114–127. 10.1016/j.brainres.2010.02.054 [DOI] [PubMed] [Google Scholar]
- Marchi N, Oby E, Batra A, Uva L, De Curtis M, Hernandez N, Van Boxel-Dezaire A, Najm I, Janigro D (2007a) In vivo and in vitro effects of pilocarpine: relevance to ictogenesis. Epilepsia 48:1934–1946. 10.1111/j.1528-1167.2007.01185.x [DOI] [PMC free article] [PubMed] [Google Scholar]
- Marchi N, Angelov L, Masaryk T, Fazio V, Granata T, Hernandez N, Hallene K, Diglaw T, Franic L, Najm I, Janigro D (2007b) Seizure-promoting effect of Blood-Brain barrier disruption. Epilepsia 48:732–742. 10.1111/j.1528-1167.2007.00988.x [DOI] [PMC free article] [PubMed] [Google Scholar]
- Marchi N, Fan Q, Ghosh C, Fazio V, Bertolini F, Betto G, Batra A, Carlton E, Najm I, Granata T, Janigro D (2009) Antagonism of peripheral inflammation reduces the severity of status epilepticus. Neurobiol Dis 33:171–181. 10.1016/j.nbd.2008.10.002 [DOI] [PMC free article] [PubMed] [Google Scholar]
- Marchi N, Teng Q, Ghosh C, Fan Q, Nguyen MT, Desai NK, Bawa H, Rasmussen P, Masaryk TK, Janigro D (2010) Blood-Brain barrier damage, but not parenchymal white blood cells, is a hallmark of seizure activity. Brain Res 1353:176–186. 10.1016/j.brainres.2010.06.051 [DOI] [PMC free article] [PubMed] [Google Scholar]
- Marchi N, Tierney W, Alexopoulos AV, Puvenna V, Granata T, Janigro D (2011) The etiological role of Blood-Brain barrier dysfunction in seizure disorders. Cardiovasc Psychiatry Neurol 2011:482415. 10.1155/2011/482415 [DOI] [PMC free article] [PubMed] [Google Scholar]
- Mihály A, Bozóky B (1984) Immunohistochemical localization of extravasated serum albumin in the hippocampus of human subjects with partial and generalized epilepsies and epileptiform convulsions. Acta Neuropathol 65:25–34. 10.1007/BF00689824 [DOI] [PubMed] [Google Scholar]
- Nemeroff CB, Crisley FD (1975) Monosodium L-glutamate-induced convulsions: temporary alteration in Blood-Brain barrier permeability to plasma proteins. Environ Physiol Biochem 5:389–395. [PubMed] [Google Scholar]
- Ngugi AK, Bottomley C, Kleinschmidt I, Sander JW, Newton CR (2010) Estimation of the burden of active and life-time epilepsy: a meta-analytic approach. Epilepsia 51:883–890. 10.1111/j.1528-1167.2009.02481.x [DOI] [PMC free article] [PubMed] [Google Scholar]
- Nico B, Corsi P, Ria R, Crivellato E, Vacca A, Roccaro AM, Mangieri D, Ribatti D, Roncali L (2006) Increased matrix-metalloproteinase-2 and matrix-metalloproteinase-9 expression in the brain of dystrophic mdx mouse. Neuroscience 140:835–848. 10.1016/j.neuroscience.2006.02.077 [DOI] [PubMed] [Google Scholar]
- Nitsch C, Klatzo I (1983) Regional patterns of Blood-Brain barrier breakdown during epileptiform seizures induced by various convulsive agents. J Neurol Sci 59:305–322. 10.1016/0022-510X(83)90016-3 [DOI] [PubMed] [Google Scholar]
- Padou V, Boyet S, Nehlig A (1995) Changes in transport of [14C] alpha-aminoisobutyric acid across the Blood-Brain barrier during pentylenetetrazol-induced status epilepticus in the immature rat. Epilepsy Res 22:175–183. 10.1016/0920-1211(95)00046-1 [DOI] [PubMed] [Google Scholar]
- Pekcec A, Unkrüer B, Schlichtiger J, Soerensen J, Hartz AM, Bauer B, van Vliet EA, Gorter JA, Potschka H (2009) Targeting prostaglandin E2 EP1 receptors prevents seizure-associated P-glycoprotein up-regulation. J Pharmacol Exp Ther 330:939–947. 10.1124/jpet.109.152520 [DOI] [PubMed] [Google Scholar]
- Polascheck N, Bankstahl M, Löscher W (2010) The COX-2 inhibitor parecoxib is neuroprotective but not antiepileptogenic in the pilocarpine model of temporal lobe epilepsy. Exp Neurol 224:219–233. 10.1016/j.expneurol.2010.03.014 [DOI] [PubMed] [Google Scholar]
- Racine RJ. (1972) Modification of seizure activity by electrical stimulation: II. Motor seizure. Electroencephalogr Clin Neurophysiol 32:281–294. 10.1016/0013-4694(72)90177-0 [DOI] [PubMed] [Google Scholar]
- Rigau V, Morin M, Rousset MC, de Bock F, Lebrun A, Coubes P, Picot MC, Baldy-Moulinier M, Bockaert J, Crespel A, Lerner-Natoli M (2007) Angiogenesis is associated with Blood-Brain barrier permeability in temporal lobe epilepsy. Brain 130:1942–1956. 10.1093/brain/awm118 [DOI] [PubMed] [Google Scholar]
- Rivera S, Tremblay E, Timsit S, Canals O, Ben-Ari Y, Khrestchatisky M (1997) Tissue inhibitor of metalloproteinases-1 (TIMP-1) is differentially induced in neurons and astrocytes after seizures: evidence for developmental, immediate early gene, and lesion response. J Neurosci 17:4223–4235. [DOI] [PMC free article] [PubMed] [Google Scholar]
- Ronne-Engström E, Hillered L, Flink R, Spännare B, Ungerstedt U, Carlson H (1992) Intracerebral microdialysis of extracellular amino acids in the human epileptic focus. J Cereb Blood Flow Metab 12:873–876. 10.1038/jcbfm.1992.119 [DOI] [PubMed] [Google Scholar]
- Sada N, Lee S, Katsu T, Otsuki T, Inoue T (2015) Epilepsy treatment: targeting LDH enzymes with a stiripentol analog to treat epilepsy. Science 347:1362–1367. 10.1126/science.aaa1299 [DOI] [PubMed] [Google Scholar]
- Salar S, Maslarova A, Lippmann K, Nichtweiss J, Weissberg I, Sheintuch L, Kunz WS, Shorer Z, Friedman A, Heinemann U (2014) Blood-Brain barrier dysfunction can contribute to pharmacoresistance of seizures. Epilepsia 55:1255–1263. 10.1111/epi.12713 [DOI] [PubMed] [Google Scholar]
- Samuelsson B, Goldyne M, Granstrom E, Hamberg M, Hammarström S, Malmsten C (1978) Prostaglandins and thromboxanes. Annu Rev Biochem 47:997–1029. 10.1146/annurev.bi.47.070178.005025 [DOI] [PubMed] [Google Scholar]
- Seiffert E, Dreier JP, Ivens S, Bechmann I, Tomkins O, Heinemann U, Friedman A (2004) Lasting Blood-Brain barrier disruption induces epileptic focus in the rat somatosensory cortex. J Neurosci 24:7829–7836. 10.1523/JNEUROSCI.1751-04.2004 [DOI] [PMC free article] [PubMed] [Google Scholar]
- Sharp CD, Houghton J, Elrod JW, Warren A, Jackson TH 4th, Jawahar A, Nanda A, Minagar A, Alexander JS (2005) N-methyl-D-aspartate receptor activation in human cerebral endothelium promotes intracellular oxidant stress. Am J Physiol Heart Circ Physiol 288:H1893–H1899. 10.1152/ajpheart.01110.2003 [DOI] [PubMed] [Google Scholar]
- Shelat PB, Chalimoniuk M, Wang JH, Strosznajder JB, Lee JC, Sun AY, Simonyi A, Sun GY (2008) Amyloid beta peptide and NMDA induce ROS from NADPH oxidase and AA release from cytosolic phospholipase A2 in cortical neurons. J Neurochem 106:45–55. 10.1111/j.1471-4159.2008.05347.x [DOI] [PubMed] [Google Scholar]
- Shen Y, Kishimoto K, Linden DJ, Sapirstein A (2007) Cytosolic phospholipase A(2) alpha mediates electrophysiologic responses of hippocampal pyramidal neurons to neurotoxic NMDA treatment. Proc Natl Acad Sci U S A 104:6078–6083. 10.1073/pnas.0605427104 [DOI] [PMC free article] [PubMed] [Google Scholar]
- Sirois P, Borgeat P, Jeanson A, Roy S, Girard G (1980) The action of leukotriene B4 (LTB4) on the lung. Prostaglandins Med 5:429–444. 10.1016/0161-4630(80)90067-1 [DOI] [PubMed] [Google Scholar]
- Six DA, Dennis EA (2000) The expanding superfamily of phospholipase A(2) enzymes: classification and characterization. Biochim Biophys Acta 1488:1–19. 10.1016/S1388-1981(00)00105-0 [DOI] [PubMed] [Google Scholar]
- Takemiya T, Maehara M, Matsumura K, Yasuda S, Sugiura H, Yamagata K (2006) Prostaglandin E2 produced by late induced COX-2 stimulates hippocampal neuron loss after seizure in the CA3 region. Neurosci Res 56:103–110. 10.1016/j.neures.2006.06.003 [DOI] [PubMed] [Google Scholar]
- Tang F, Hartz AM, Bauer B (2017) Drug-resistant epilepsy: multiple hypotheses, few answers. Front Neurol 8:301. 10.3389/fneur.2017.00301 [DOI] [PMC free article] [PubMed] [Google Scholar]
- Thanabalasundaram G, Pieper C, Lischper M, Galla HJ (2010) Regulation of the Blood-Brain barrier integrity by pericytes via matrix metalloproteinases mediated activation of vascular endothelial growth factor in vitro. Brain Res 1347:1–10. 10.1016/j.brainres.2010.05.096 [DOI] [PubMed] [Google Scholar]
- Tomkins O, Shelef I, Kaizerman I, Eliushin A, Afawi Z, Misk A, Gidon M, Cohen A, Zumsteg D, Friedman A (2008) Blood-Brain barrier disruption in post-traumatic epilepsy. J Neurol Neurosurg Psychiatry 79:774–777. 10.1136/jnnp.2007.126425 [DOI] [PubMed] [Google Scholar]
- Ueda Y, Tsuru N (1995) Simultaneous monitoring of the seizure-related changes in extracellular glutamate and gamma-aminobutyric acid concentration in bilateral hippocampi following development of amygdaloid kindling. Epilepsy Res 20:213–219. 10.1016/0920-1211(94)00081-7 [DOI] [PubMed] [Google Scholar]
- Uva L, Librizzi L, Marchi N, Noe F, Bongiovanni R, Vezzani A, Janigro D, de Curtis M (2008) Acute induction of epileptiform discharges by pilocarpine in the in vitro isolated guinea-pig brain requires enhancement of Blood-Brain barrier permeability. Neuroscience 151:303–312. 10.1016/j.neuroscience.2007.10.037 [DOI] [PMC free article] [PubMed] [Google Scholar]
- van Vliet EA, da Costa Araújo S, Redeker S, van Schaik R, Aronica E, Gorter JA (2007) Blood-Brain barrier leakage may lead to progression of temporal lobe epilepsy. Brain 130:521–534. 10.1093/brain/awl318 [DOI] [PubMed] [Google Scholar]
- Vazana U, Veksler R, Pell GS, Prager O, Fassler M, Chassidim Y, Roth Y, Shahar H, Zangen A, Raccah R, Onesti E, Ceccanti M, Colonnese C, Santoro A, Salvati M, D'Elia A, Nucciarelli V, Inghilleri M, Friedman A (2016) Glutamate-mediated Blood-Brain barrier opening: implications for neuroprotection and drug delivery. J Neurosci 36:7727–7739. 10.1523/JNEUROSCI.0587-16.2016 [DOI] [PMC free article] [PubMed] [Google Scholar]
- Vezzani A, Granata T (2005) Brain inflammation in epilepsy: experimental and clinical evidence. Epilepsia 46:1724–1743. 10.1111/j.1528-1167.2005.00298.x [DOI] [PubMed] [Google Scholar]
- Wilson CL, Maidment NT, Shomer MH, Behnke EJ, Ackerson L, Fried I, Engel J Jr (1996) Comparison of seizure related amino acid release in human epileptic hippocampus versus a chronic, kainate rat model of hippocampal epilepsy. Epilepsy Res 26:245–254. 10.1016/S0920-1211(96)00057-5 [DOI] [PubMed] [Google Scholar]
- World Health Organization (2017) Epilepsy: fact sheet. Geneva: World Health Organization. [Google Scholar]
- Zeisberg M, Maeshima Y, Mosterman B, Kalluri R (2002) Renal fibrosis: extracellular matrix microenvironment regulates migratory behavior of activated tubular epithelial cells. Am J Pathol 160:2001–2008. 10.1016/S0002-9440(10)61150-9 [DOI] [PMC free article] [PubMed] [Google Scholar]
- Zeni P, Doepker E, Schulze Topphoff U, Huewel S, Tenenbaum T, Galla HJ (2007) MMPs contribute to TNF-alpha-induced alteration of the blood-cerebrospinal fluid barrier in vitro. Am J Physiol Cell Physiol 293:C855–C864. 10.1152/ajpcell.00470.2006 [DOI] [PubMed] [Google Scholar]
- Zhu HJ, Liu GQ (2004) Glutamate up-regulates P-glycoprotein expression in rat brain microvessel endothelial cells by an NMDA receptor-mediated mechanism. Life Sci 75:1313–1322. 10.1016/j.lfs.2004.02.027 [DOI] [PubMed] [Google Scholar]
- Zibell G, Unkrüer B, Pekcec A, Hartz AM, Bauer B, Miller DS, Potschka H (2009) Prevention of seizure-induced up-regulation of endothelial P-glycoprotein by COX-2 inhibition. Neuropharmacology 56:849–855. 10.1016/j.neuropharm.2009.01.009 [DOI] [PubMed] [Google Scholar]