Abstract
The aim of this study was to prepare diacylglycerol (DAG) by enzymatic glycerolysis of lard. The effects of reaction parameters such as lipase type, reaction temperature, enzyme amount, substrate molar ratio (lard/glycerol), reaction time, and magnetic stirring speed were investigated. Lipozyme RMIM was found to be a more active biocatalyst than Novozym 435, and the optimal reaction conditions were 14:100 (W/W) of enzyme to lard substrate ratio, 1:1 of lard to glycerol molar ratio, and 500 rpm magnetic stirring speed. The reaction mixture was first incubated at 65℃ for 2 h and then transferred to 45℃ for 8 h. At the optimum reaction conditions, the conversion rate of triacylglycerol (TAG) and the content of DAG in the reaction mixture reached 76.26% and 61.76%, respectively, and the DAG content in purified glycerolized lard was 82.03% by molecular distillation. The distribution of fatty acids and Fourier transform infrared spectra in glycerolized lard samples were similar to those in lard samples. The results revealed that enzymatic glycerolysis and molecular distillation can be used to prepare more highly purified DAG from lard.
Keywords: lard, glycerolysis, diacylglycerol, compositional characteristics
Introduction
Diacylglycerol [DAG, including 1, 2(2, 3)-DAG and 1, 3-DAG] is composed of glycerol esters in which two of the hydroxyl groups are esterified with fatty acids. DAG naturally present as trace components in different edible oils and fats (Lo et al., 2008). DAG has a similar digestibility and energy value with its corresponding triacylglycerol (TAG) (Flickinger and Matsuo, 2003). However, recent studies in humans and animals indicated that DAG, especially 1,3-DAG, in contrast to TAG, significantly suppressed abdominal and visceral fat accumulation, reduced body weight (Maki et al., 2002; Meng et al., 2004; Murase et al., 2002), and decreased postprandial serum TAG levels (Tada et al., 2001; Taguchi et al., 2000). These beneficial effects are possibly attributable to the difference in the metabolism of TAG and DAG (Kondo et al., 2003). Furthermore, the safety of DAG oil has been confirmed by a great deal of animal and human studies (Morita and Soni, 2009). DAG oil not only has nutritional benefits but also has an interesting physicalchemical property (Miklos et al., 2013). DAG exhibits surface activity with both hydrophobic and hydrophilic groups in molecular structure and has widespread use in the food industry as emulsifiers. In addition, DAG has a higher melting point compared to TAG, which can improve food texture (Miklos et al., 2011).
DAG can be produced by direct esterification, partial hydrolysis, or enzymatic/chemical glycerolysis of oil/fat with glycerol. In lipase-catalysed esterification, DAG can be produced through esterification of glycerol with free fatty acids (FFA), although the reaction requires high levels of FFA (Wang et al., 2011). Partial hydrolysis of TAG has a one-step reaction advantage. Nevertheless, a lower content of DAG is obtained and a substantial amount of FFA can be generated (Wang et al., 2011).
Chemical glycerolysis is commonly conducted in an inert atmosphere at a high temperature of 220-260℃. Inorganic alkalis such as KOH and NaOH were used as catalysts. Large energy consumption and dark-coloured product formation have been observed due to the high reaction temperature (Noureddini et al., 2004). Furthermore, heat-sensitive unsaturated fatty acids may be destroyed leading to the production of undesirable byproducts such as alkali metal salts (Pawongrat et al., 2007). Therefore, chemical glycerolysis is unattractive. Enzymatic glycerolysis consists of hydrolysis of the ester bond in the triglyceride, followed by esterification of FFA and glycerol in the presence of a 1,3-specific lipase (Kahveci et al., 2010; Lo et al., 2008). Enzymatic glycerolysis of fats and oils in a solvent free system in recent decades has attracted great attention. The reason being that toxic and expensive solvents were avoided. In addition, mild reaction conditions, lipase specificity, and negligible amounts of undesired by-products all contribute to the growing use of enzymatic glycerolysis (Xu et al., 1999; Zhong et al., 2010). Furthermore, the immobilized enzymes have the advantages of easy separation from products, recovery, and re-utilization, all of which overcome the disadvantage of the high cost of enzyme production.
Lard is cheap and plays an important role in the production of meat products because of its special flavour and texture. However, recently lard usage has been heavily diminished because of its high caloric value, abundance of saturated fatty acids, and low digestibility. The potential health benefits and physical-chemical properties of lard-based DAG may improve the use of lard in various foods (Miklos et al., 2011; Miklos et al., 2013; Miklos et al., 2014; Mora-Gallego et al., 2013). There are some reports regarding the production of DAG from plant oils (Awadallak et al., 2013; Singh and Mukhopadhyay, 2012; Wang et al., 2009), and to the best of our knowledge, there are few studies that provide comprehensive optimizing data on the production of lard-based DAG and little information concerning functional group analysis of lard-based DAG. Therefore, in the study we aimed to produce DAG from lard through enzymatic glycerolysis. The optimal conditions were investigated, the final product was purified by molecular distillation, and the acylglycerol compositions and functional groups were analysed.
Materials and Methods
Materials
Fresh pork backfat was obtained from the Beidahuang Meat Corporation (China). Lard was extracted by heating the backfat at 120℃ and stirring constantly. The liquid lard was filtered through four layers of cotton cloth to remove oil residues and subsequently solidified and stored at 4℃. Commercial immobilized lipases from Candida antarctica {Novozyme 435, lipase activity 10,000 propyl laurate units (PLU)/g} and Rhizomucor miehei (Lipozyme RMIM, lipase activity 275 Interesterase Units Novo (IUN)/ g) were obtained from Novozymes A/S (Denmark). Glycerol with a purity of more than 99.0% was purchased from the Tianjin Chemical Reagent Factory (China). The lipid standards including monoolein, 1,3-diolein, 1,2- dioleoyl-rac-glycerol and glyceryl trioleate for high performance liquid chromatography (HPLC) analysis were purchased from Sigma-Aldrich (USA). All chemicals and reagents used were either of analytical or HPLC grades.
Screening of lipases
Novozyme 435 and Lipozyme RMIM were used to evaluate their ability to produce DAG through the enzymatic glycerolysis of lard. The reaction mixture, containing a 1:1 molar ratio of lard to glycerol and 10:100 (W/W) of lipase to lard substrate ratio, was incubated at 65℃ for 2 h and then changed to 50℃ for 10 h at 400 rpm magnetic stirring speed. The acylglycerol content was analysed by HPLC.
Optimum enzymatic glycerolysis condition
Melted lard and glycerol with different molar ratios (3:1, 2:1, 1:1, 1:2, and 1:3) were mixed in a Florence flask on a rotary evaporator (RE-52AA, Yarong Biochemical Analysis Co., Ltd., China) at 82℃ with a vacuum pump. The vacuum was maintained at -50 kPa for 30 min to increase the miscibility of lard and glycerol. The mixture was then transferred to a conical flask and the enzyme was subsequently added to yield enzyme to lard substrate ratios (W/W) of 6:100, 8:100, 10:100, 12:100, 14:100, and 16:100. The magnetic stirring speed was set at 300, 400, 500, 600, 700, 800, and 900 rpm during the reaction. The reactant was first incubated at 65℃ for 2 h to sufficiently heat the reaction mixture. The temperature was then changed to 35, 40, 45, 50, 55, 60 and 65℃ for an additional 6, 7, 8, 10 and 24 h. After the reaction, the glycerolized lard was filtered to remove the enzyme and samples were collected. Immobilized lipase was then washed-out three times with 20 mL of acetone and dried at 37℃ for 3 h and was recycled for subsequent mass production (Stojanović et al., 2013). The conversion of TAG and the total DAG and 1,3-DAG content of the samples were analysed by HPLC. All experiments were replicated three times.
Scaled-up production and purification of DAG by molecular distillation
A scaled-up experiment was performed according to the above optimized reaction conditions to obtain glycerolized lard (GL). The optimal reaction conditions were 14:100 (W/W) of enzyme to lard substrate ratio, 1:1 of lard to glycerol molar ratio, and 500 rpm magnetic stirring speed. The reaction mixture, including 890 g melted lard (molecular weight calculated by glycerol tristearate), 92 g glycerol and 125 g Lipozyme RMIM, was first incubated at 65℃ for 2 h and then transferred to 45℃ for 8 h. To obtain a higher purity of DAG, the GL were purified by molecular distillation and labelled as purified glycerolized lard (PGL). The wiped film molecular distillation (SPE10, manufactured in Haiyuan biochemical equipment Co. Ltd., China) was used in two steps. The components of glycerol, FFA, and monoacylglycerol (MAG) in the light phase can be separated from the reaction mixture through the first step. The conditions for the distillation process were: feeding flow rate, 2 kg/h; evaporation temperature, 185℃; evaporator vacuum, 60 Pa; scraper speed, 350 rpm. After the first step of molecular distillation, the heavy phase with DAG and TAG was collected. The PGL, which had a higher content of DAG, was obtained by the second purification step. The conditions were: feeding flow rate, 2 kg/h; evaporation temperature, 255℃; evaporator vacuum, 25 Pa; scraper speed, 350 rpm. The GL and PGL compositions were analysed by thin-layer chromatography (TLC) and high performance liquid chromatography (HPLC).
Acylglycerol composition analysis
Thin-layer chromatography analysis
Qualitative and semi-quantitative analysis of GL and PGL were performed by TLC. A 20 cm × 20 cm plate with a 250 μm layer of silica gel GF 254 was activated by heating in an oven (100℃) for 30 min before use. The plate was developed using petroleum ether, diethyl ether, and acetic acid (80:20:2, by volume) as the mobile phase. The plate was removed from the solution when the front of the solvent reached approximately 15 cm away from the origin and the solvent was allowed to evaporate. Afterwards, the compounds were visualized by putting the plate in iodine saturated vapour for 10 min.
High performance liquid chromatography
The glycerolysis reaction mixture and molecular distillation production were analysed by HPLC. The samples were dissolved into mobile phase (n-hexane and isopropanol, 10:1 v:v) at a concentration of 45 mg/mL, followed by filtration through a 0.45 μm nylon membrane filter to remove impurities. The sample (10 μL) was then injected into a Promosil Silica (4.6 mm internal diameter, 250-mm length, and 5 μm particle size) column at a column temperature of 35 ℃ with a refractive index detector (Waters 2410). The flow rate was set at 1 mL/min (Wang et al., 2011). HPLC peaks of GL and PGL were confirmed by comparison of their retention times with reference standards. The conversion of TAG (percent) in samples was defined as reduced TAG content divided by the original TAG content and then multiplied by 100. The content of total DAG or 1,3-DAG (percent) in samples was expressed as a ratio of the amounts of DAG or 1,3-DAG to the total acylglycerols and then multiplied by 100.
Fatty acid analysis by gas chromatography/mass spectrometry
Fatty acids (FAs) of lard, GL and PGL were determined by their fatty acid methyl esters. Samples (200 mg) were dissolved in 4 mL of n-hexane and 0.8 mL of sodium methoxide regent (2 M) was added and then mixed for 1 min by a vortex mixer. Saturated sodium chloride (5 mL) was added to the mixture which was then shaken vigorously for at least 15 s. After sedimentation for 10 min, 1 μL of the clear supernatant was injected into the gas chromatography/mass spectrometer (GC-MS, Model TRACE MASS 2000). The GC was equipped with a fused silica capillary column (0.25 mm internal diameter, 30-m length, and 0.25 μm film thickness) and a flame ionization detector. The conditions were as follows: the oven temperature was initiated at 150℃ for 4 min the temperature was then increased to 210℃ at 15℃/min and to 230℃ at 30℃/ min. The two temperatures were maintained each for 5 min. The total analytical time was 25 min. The injection and detection temperatures were maintained at 250℃ and 230℃, respectively. The carrier gas (helium) flow rate was 1 mL/min. The MS was operated with an electron impact ionization energy of 70 eV. The source temperature was 230℃, the transmission line temperature was 250℃, and the scan range was from 50 to 550 (m/z). The fatty acids were identified by retention time and peak areas from digital libraries (Wiley 08/NIST 08). A purity and semblance degree greater than 900 was regarded as a positive result, and the content was expressed as a percentage of the total fatty acid content.
Iodine value analysis
The iodine value was determined by the method described by Toscano et al. (2012). Samples were dissolved in solvent and Wijs (iodine monochlordie) reagent was added. After one hour in the dark place, potassium iodide and water were added and free iodine was titrated with sodium thiosulfate solution and starch was acted as indicator. Results were expressed as grams of iodine absorbed by a 100 g sample.
Fourier transform infrared spectra qualitative analysis
Fourier transform infrared spectra (FTIR) of lard, GL and PGL were recorded by using a Perkin-Elmer Spectrum 100 (Perkin-Elmer Corp., USA). Different oil drops were placed directly on the zinc selenide (ZnSe) crystal plate of horizon attenuation total reflection. Spectra were collected at the mid-infrared region (4000-500 /cm) by taking 32 scans at a resolution of 8 /cm. The plate was carefully cleaned with n-hexane before the next sample was added.
Statistical analysis
Data were analysed using the General Linear Models procedure of the Statistix 8.1 software package (Analytical Software, USA). The significance of the main effects was determined by analysis of variance. The Tukey procedure was conducted to determine significant differences (p<0.05) among means.
Results and Discussion
Screening of lipases
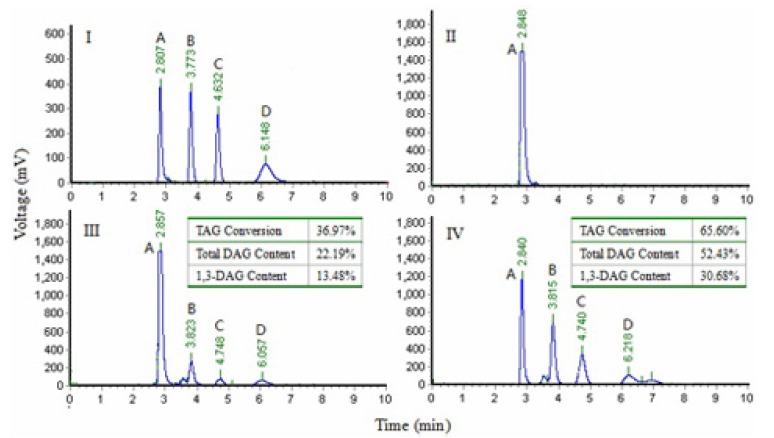
The effect of two immobilized enzymes on the conversion of TAG and resultant DAG content in the products of glycerolysis was presented in Fig. 1. The HPLC analysis results showed that Lipozyme RMIM and Novozym 435 caused similar reaction products by glycerolysis. However, Lipozyme RMIM displayed a higher TAG conversion and a higher production of DAG and 1,3-DAG from the glycerolysis reaction than Novozym 435, which may be because Lipozyme RMIM is an sn-1,3 selective lipase and Novozyme 435 is a non-specific lipase (Jin et al., 2011; Rosu et al., 1999). Therefore, Lipozyme RMIM was selected for the following studies.
Fig. 1. Chromatograms from the normal-phase high performance liquid chromatography separation of standard (I), lard (II), lard of Novozyme 435 glycerolysis (III) and lard of Lipozyme RMIM glycerolysis (IV).
A: triacylglycerol, B: 1,3-diacylglycerol, C: 1,2-diacylglycerol, D: monoacylglycerol.
Effect of reaction parameters on glycerolysis of lard
Effect of reaction temperature
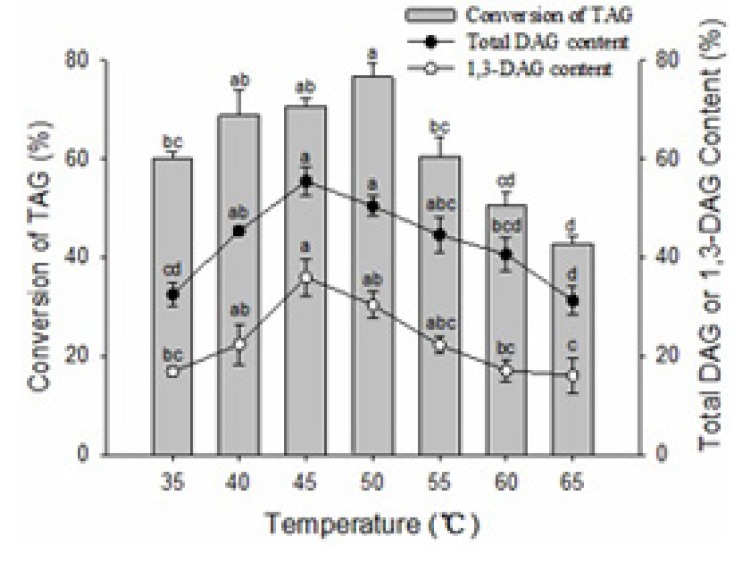
Temperature plays a very important role in the enzymatic glycerolysis reaction because of its influence on the reaction rate and enzyme activity. Experiments at seven different temperatures were performed and the highest temperature selected was fixed at 65℃. At the higher temperature, the rate of interaction between the substrates and the enzyme could be increased because of the higher enzyme affinity and the lower viscosity of the reaction mixture. However, a higher temperature could lead to enzyme denaturation. The lowest temperature chosen was 35℃, below which the stirring of the reaction mixture became difficult because of its solidification. The studies showed that temperature had a considerable influence on the conversion of TAG and the yield of DAG content (Fig. 2). The conversion of TAG and the total DAG content increased initially and then decreased with increased reaction temperature. The conversion of TAG in samples at 50℃ was significantly higher than that at 35, 55, 60 and 65℃ (p<0.05), which may be due to Lipozyme RMIM having a maximum activity at 50℃, below or above this temperature, enzymatic activity will decline. Hong et al. (2012) also reported 50℃ was selected as the best temperature for using of Lipozyme RMIM to synthesize capsiate analogs. The content of DAG and 1, 3-DAG in samples at 45℃ was significantly higher than that at 35, 60 and 65℃ (p<0.05), but there was no significant difference in samples at 40, 50 and 55℃ (p>0.05). Therefore, considering the relatively lower energy cost and higher content of DAG, the optimum temperature for glycerolysis was determined to be 45℃ for the subsequent studies.
Fig. 2. Effect of the reaction temperature on glycerolysis of lard.
The reaction mixture contained a 1:1 molar ratio of lard to glycerol and a 10:100 (W/W) ratio of Lipozyme RMIM to lard substrate. The mixture was incubated at 65℃ for 2 h and then changed to a different temperature for another 10 h at 400 rpm magnetic stirring speed. Error bars refer to the standard deviations obtained from triplicate sample analysis. Means in the same indexes with different letters (a-d) differ significantly (p<0.05).
Effect of enzyme amount
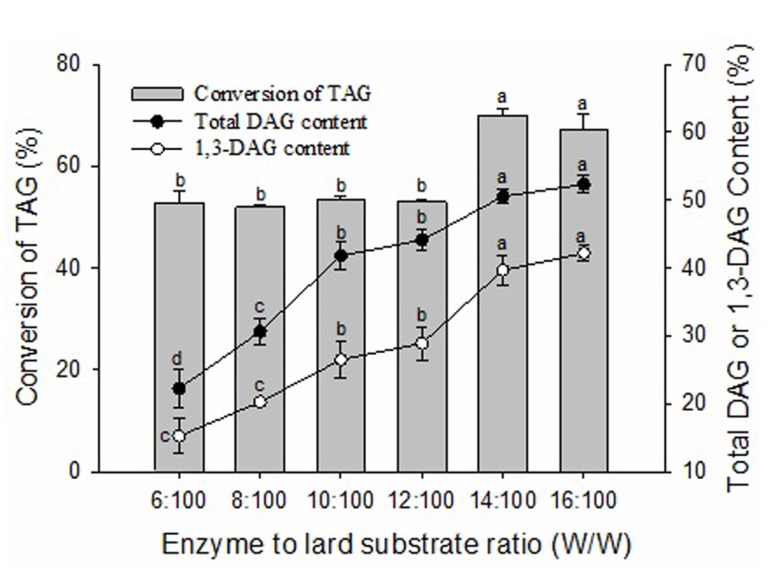
The conversion of TAG and the contents of DAG and 1,3-DAG were enhanced with increasing enzyme amount (Fig. 3). When the enzyme amount increased from 6:100 (W/W) of enzyme to lard substrate ratio to 14:100 (W/W), the conversion of TAG increased from 52.73% to 69.89% and the content of total DAG increased from 22.28% to 50.53% (p<0.05). The contents of total DAG and 1,3-DAG were not significantly increased (p>0.05) when the enzyme amount increased from 14:100 (W/W) to 16:100 (W/W) of enzyme to lard substrate ratio. This is likely due to saturation of catalytic activity when the addition of enzyme was more than 14:100 (W/W) of enzyme to lard substrate ratio. Some researchers have observed that a poor blend of the reaction mixtures can be caused by a high amount of enzyme in the glycerolysis reaction leading to limited mass transfer (Kristensen et al., 2005). Considering the efficiency of biocatalysts and the economization of enzyme, 14:100 (W/W) of enzyme to lard substrate ratio was selected for further experiments.
Fig. 3. Effect of enzyme to lard substrate ratio (W/W) on glycerolysis of lard.
The reaction mixture contained a 1:1 molar ratio of lard to glycerol and different Lipozyme RMIM to lard substrate ratios (W/W). The mixtures were incubated at 65℃ for 2 h and then transferred to 45℃ for 10 h at 400 rpm magnetic stirring speed. Error bars refer to the standard deviations obtained from triplicate sample analysis. Means in the same indexes with different letters (a-d) differ significantly (p<0.05).
Effect of lard to glycerol molar ratio
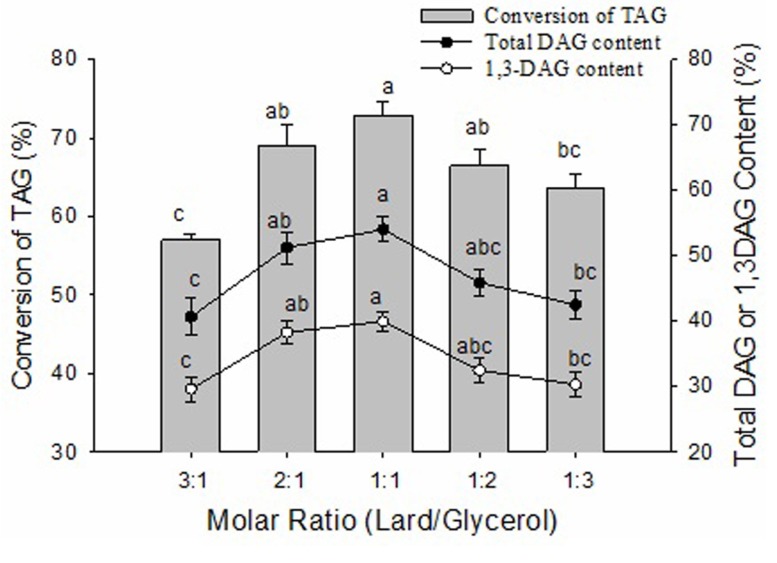
The substrate molar ratio of lard to glycerol was an important parameter in determining the chemical balance and reaction speed of the glycerolysis reaction. In theory, the stoichiometry of the glycerolysis reaction requires a glycerol to fat (oil) molar ratio 1:2. However, there was a deviation between the optimal values with the theoretical value in the ratio of reactants. The molar ratio of lard to glycerol was varied from 3:1 to 1:3 in order to study its effect on the conversion of TAG and the content of DAG. As shown in Fig. 4, with increasing glycerol concentration, the conversion of TAG and the contents of total DAG and 1,3-DAG showed an initial increase followed by a decreasing pattern, ultimately reaching their peaks at a substrate molar ratio of 1:1. The conversion of TAG, the content of total DAG and 1,3-DAG at a substrate molar ratio of 1:1 were significantly (p<0.05) higher than a substrate molar ratio of 3:1 and 1:3, and there were no significant differences (p>0.05) between substrate molar ratios of 2:1, 1:1 and 1:2. A lower glycerol concentration could lead to an incomplete glycerolysis reaction but a higher glycerol concentration could cause a higher viscosity of the reaction mixture and, in turn, considerable mass transfer resistance (Singh and Mukhopadhyay, 2012). Some researchers also showed that the high content of DAG was obtained under optimal conditions with a molar ratio of glycerol to oil. Lo et al. (2004) showed the optimal molar ratio of glycerol to triglyceride was 1:2 and DAG was the main product of glycerolysis. Eom et al. (2010) reported the molar ration of glycerol to tuna oil at 3:1 was the opimum for the production DAG.
Fig. 4. Effect of the molar ratio of lard to glycerol on glycerolysis of lard.
The reaction mixture contained different molar ratios of lard to glycerol and 14:100 (W/W) of Lipozyme RMIM to lard substrate ratio. The mixtures were incubated at 65℃ for 2 h and then changed to 45℃ for another 10 h at 400 rpm magnetic stirring speed. Error bars refer to the standard deviations obtained from triplicate sample analysis. Means in the same indexes with different letters (a-c) differ significantly (p<0.05).
Effect of reaction time
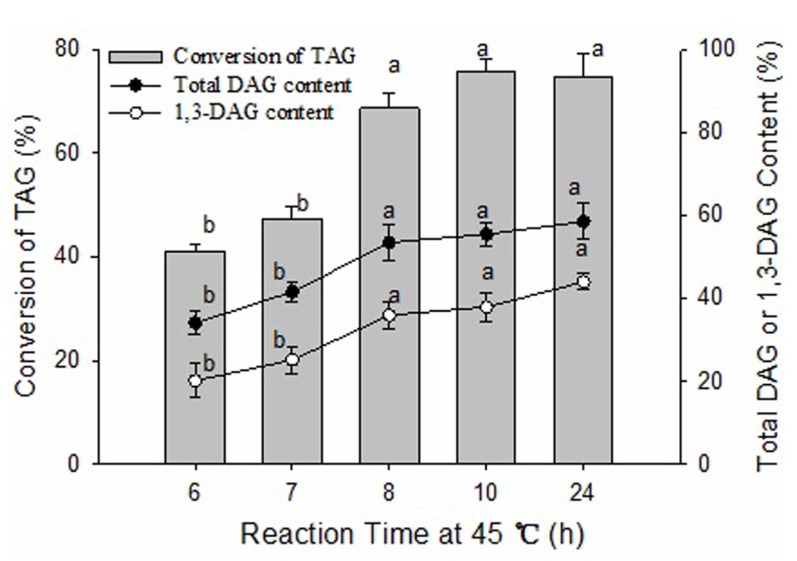
The effects of reaction time at 45℃ on the conversion of TAG and the content of DAG were investigated (Fig. 5). The conversion of TAG and the contents of total DAG and 1,3-DAG increased steadily with increasing reaction time until 8 h (p<0.05), and then did not significantly increase until 24 h (p>0.05). The conversion of TAG and the content of total DAG was 41.1% and 34.1% at 6 h, increased to 68.7% and 53.5% at 8 h, and then gradually increased to 74.9% and 58.5% at 24 h, respectively. These results indicated that the glycerolysis reaction reached dynamic equilibrium at 8 h, and then the type and content of products formed in the reversible reaction were essentially maintained constant with increasing time. Therefore, an 8 h glycerolysis reaction time at 45℃ was chosen for the subsequent experiments, which guaranteed the higher conversion of TAG and content of DAG and simultaneously saved energy.
Fig. 5. Effect of reaction time on glycerolysis of lard.
The reaction mixture contained a 1:1 molar ratio of lard to glycerol and 14:100 (W/W) of Lipozyme RMIM to lard substrate ratio. The mixture was incubated at 65℃ for 2 h and then changed to 45℃ for different times at 400 rpm magnetic stirring speed. Error bars refer to the standard deviations obtained from triplicate sample analysis. Means in the same indexes with different letters (a-b) differ significantly (p<0.05).
Effect of magnetic stirring speed
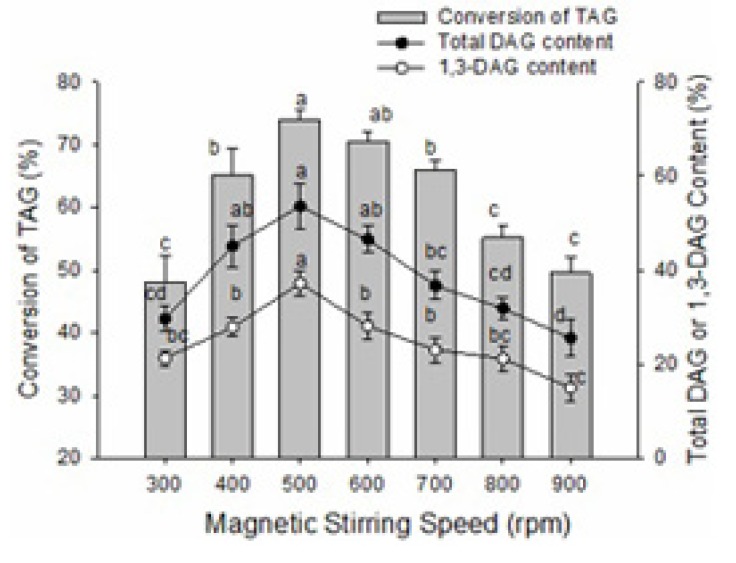
Magnetic stirring speed had a significant influence on the conversion of TAG and the content of DAG in the glycerolysis reaction of lard (Fig. 6). The conversion of TAG and the contents of total DAG and 1,3-DAG also showed a pattern of an initial increase following by a decrease; peaks were reached at 500 rpm. The first increases in the conversion of TAG and the content of DAG may be due to increased contact area of enzyme and substrate as well as improved catalytic efficiency at a certain stirring speed. However, high stirring speed can produce shear force in the process of mixing and damage the space conformation of the enzyme or make the enzyme bind to the wall of the reaction vessel out of solution, thus decreasing catalytic ability (Keng et al., 2008). To yield the highest conversion of TAG and content of DAG, stirring speed should be at 500 rpm during the reaction.
Fig. 6. Effect of magnetic stirring speed on the glycerolysis of lard.
The reaction mixture contained a 1:1 molar ratio of lard/glycerol and 14:100 (W/W) of Lipozyme RMIM to lard substrate ratio. The mixture was incubated at 65℃ for 2 h and then changed to 45℃ for 8 h at different magnetic stirring speeds. Error bars refer to the standard deviations obtained from triplicate sample analysis. Means in the same indexes with different letters (a-d) differ significantly (p<0.05).
Analysis of acylglycerol composition
Thin-layer chromatography analysis
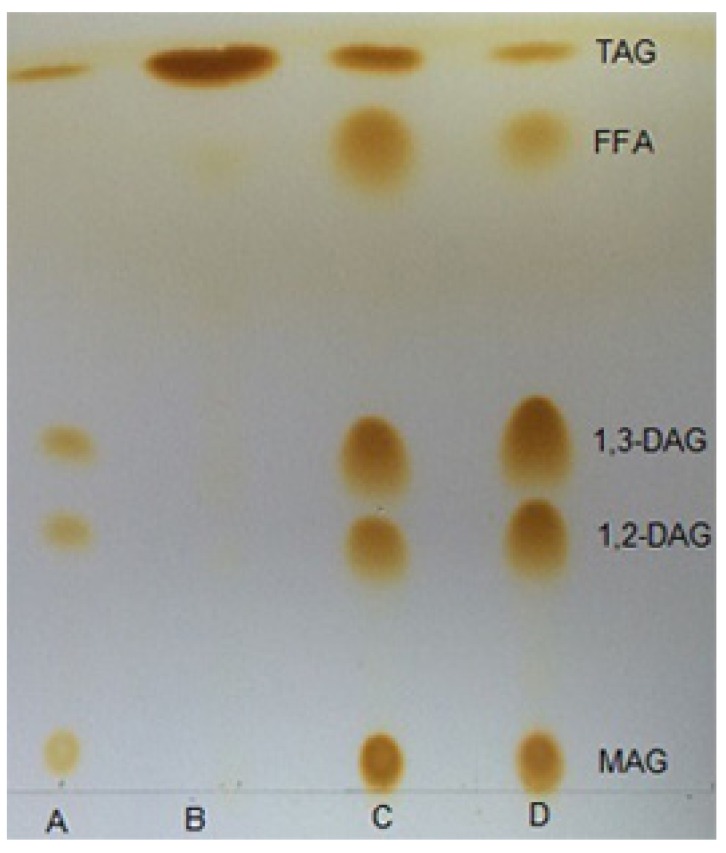
TLC is a widely used analytical method in the separation of neutral fat because it can separate positional isomers of partial acylglycerols and provide a rapid observational output (John Craven and Lencki, 2010). This was easily demonstrated by comparing a retention factor (Rf) on a TLC plate. As shown in Fig. 7, the migration sequence and Rf values of components in different reaction products were similar with the standard. MAG tended to be retained near the origin, whereas TAG eluted before DAG. There were obvious differences in TLC spot intensity between GL and PGL at the same concentration. The spot area and intensity of 1,3-DAG and 1,2-DAG in the PGL sample were larger and heavier than in the GL sample. In addition, the area of TAG in the PGL sample was smaller than that in the GL sample, which proved that molecular distillation treatment increased the DAG content in glycerolized lard.
Fig. 7. Thin-layer chromatography analysis of lard, glycerolized lard and purified glycerolized lard.
A, standard; B, lard; C, glycerolized lard; D, purified glycerolized lard. TAG, triacylglycerol; DAG, diacylglycerol; MAG, monoacylglycerol; FFA, free fat acid.
High performance liquid chromatography analysis
The acylglycerol profile of lard, GL, and PGL by HPLC analysis was shown in Table 1. Total DAG content in GL was significantly increased (61.76%, p<0.05), which corresponded with a significant decrease in TAG content (23.74%, p<0.05) after the glycerolysis reaction. Furthermore, Total DAG content in PGL increased to 82.03% and TAG content decreased to 9.12% by purification of glycerolized lard using molecular distillation. Therefore, molecular distillation is an effective method to obtain more highly purified DAG. However, Miklos et al.(2011) obtained DAG content greater than the result in the current study using molecular distillation after enzymatic glycerolysis, which might be because the vacuum pressure of industrial distillation equipment used in this study could not achieve low enough, the purification was not completely.
Table 1. Acylglycerol profile of lard, glycerolized lard and purified glycerolized lard (wt %).
| Acylglycerol profile | Lard | Glycerolized lard | Purified glycerolized lard |
|---|---|---|---|
| MAG | 0.0c | 14.50 ± 1.03a | 8.85 ± 0.69b |
| 1, 2-DAG | 0.0c | 21.73 ± 0.25b | 31.14 ± 0.32a |
| 1, 3-DAG | 0.0c | 40.03 ± 0.20b | 50.89 ± 0.19a |
| TAG | 100 ± 0.00a | 23.74 ± 0.02b | 9.12 ± 0.07c |
Means in the same row with different letters differ significantly (p<0.05). TAG, triacylglycerols; DAG, diacylglycerol; MAG, monoacylglycerol.
Analysis of fatty acids and iodine value
The main FAs and the iodine value of lard, GL and PGL were described in Table 2. The types of FAs were similar and the content of every FA was not significantly changed (p>0.05) before and after the reaction. Although there was a slight increase in total saturated fatty acids (SFAs) and a slight reduction in unsaturated fatty acids (USFAs), there was no significant difference (p>0.05) between lard, GL and PGL. The iodine value is a common index used to measure the degree of unsaturation in oil or fat. A decreased iodine value was observed in PGL, which may be due to the increased SFAs.
Table 2. The primary fatty acids and iodine values of lard, glycerolized lard and purified glycerolized lard.
| Lard Glycerolized lard | Purified glycerolized lard | Relative amount (%) | ||
|---|---|---|---|---|
| Fatty acid | C14:0 | 1.10 ± 0.03a | 1.17 ± 0.06a | 1.20 ± 0.06a |
| C16:1 | 1.79 ± 0.04a | 1.85 ± 0.07a | 1.92 ± 0.03a | |
| C16:0 | 23.97 ± 0.02a | 24.16 ± 0.02a | 24.60 ± 0.03a | |
| C18:2 | 8.03 ± 0.04a | 7.81 ± 0.09a | 7.75 ± 0.06a | |
| C18:1 | 48.09 ± 0.05a | 47.90 ± 0.09a | 47.64 ± 0.06a | |
| C18:0 | 12.95 ± 0.08a | 12.98 ± 0.03a | 13.05± 0.05a | |
| SFA | 38.02 | 38.31 | 38.85 | |
| USFA | 57.91 | 57.56 | 57.31 | |
| Iodine value | 55.50 ± 0.56a | 54.35 ± 034b | 53.45 ± 0.23b | |
Means in the same row with different letters differ significantly (p<0.05). SFA, saturated fatty acid; USFA, unsaturated fatty acid.
Fourier transform infrared spectra qualitative analysis
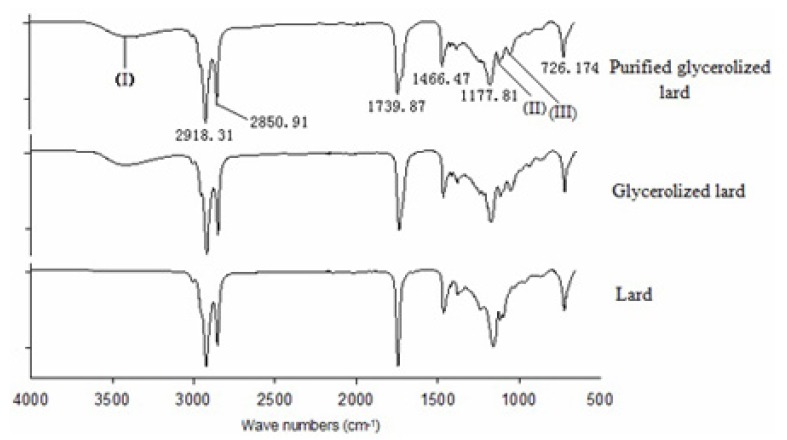
The FTIR spectra can clearly indicate structural organization and relevant functional groups in biological materials (Gani et al., 2017; Ng et al., 2014).The FTIR spectra of lard, GL and PGL were presented in Fig. 8. The main absorption bands appeared to be similar among the three types of sample. The main functional groups and corresponding wave numbers were as follows: symmetrical and asymmetrical stretching of -CH2 (2918 /cm and 2850 /cm), -C=O stretch (1739 /cm), -C-H in-plane flexural vibration (1466 /cm), -C-O stretch of the -C-O-C group (1177 /cm), -(CH2)4 swing vibration (726 /cm) (Lerma-García et al., 2010), these groups existed in lard, GL and PGL. Three peaks at 3399 /cm (I), 1117.78 /cm (II) and 1051.92 /cm (III) were observed in GL and PGL, but not in lard. The broad absorption peak at 3399 /cm (I) in GL and PGL indicated the intermolecular hydrogen bond O-H stretching vibration, which was attributed to the glycerol added in glycerolysis. Moreover, a slightly lower peak area of absorption bands at 3399 /cm was observed in PGL compared to GL, which was due to the glycerol in the PGL sample being removed by molecular distillation. The peaks at 1117.78 /cm (II) and 1051.92 /cm (III) indicate C-O stretch because GL and PGL contain an alcohol group. These results showed that enzymatic glycerolysis and the subsequent purification process will not change the components of lard and will not produce undesirable substances.
Fig. 8. FTIR spectra of lard, glycerolysis lard and purified glycerolized lard at frequency 4000-650 cm-1.
Conclusion
This research focused on producing a high DAG yield from lard by enzymatic glycerolysis. Lipozyme RMIM was found to be the most efficient biocatalyst. The conversion of TAG and the content of DAG depended strongly on the reaction conditions, and at optimal reaction conditions, the content of DAG reached 61.76% in GL and was further increased to 82.03% in PGL by molecular distillation. There were no obvious changes in the distribution of fatty acids and FTIR spectra between lard, GL and PGL. Results revealed that enzymatic glycerolysis combined with molecular distillation is a feasible approach to produce a higher purification of DAG from lard.
Acknowledgments
This study was funded by the Doctoral Research Fund Supporting Plan in Suihua University (grant no. SD2017001).
References
- Awadallak J. A., Voll F., Ribas M. C., Silva C. D., Filho L. C., Silva E. D. Enzymtic catalyzed palm oil hydrolysis under ultrasound irradiation: diacylglycerol synthesis. Ultrason. Sonochem. 2013;20:1002–1007. doi: 10.1016/j.ultsonch.2012.11.017. [DOI] [PubMed] [Google Scholar]
- Eom T. K., Kong C. S., Byun H. G., Jung W. K., Kim S. K. Lipase catalytic synthesis of diacylglycerol from tuna oil and its anti-obesity effect in C57BL/6J mice. Process Biochem. 2010;45:738–743. doi: 10.1016/j.procbio.2010.01.012. [DOI] [Google Scholar]
- Flickinger B. D., Matsuo N. Nutritional characteristics of DAG oil. Lipids. 2003;38:129–132. doi: 10.1007/s11745-003-1042-8. [DOI] [PubMed] [Google Scholar]
- Gani A., Ashwar B. A., Akhter G., Shah A., Wani I. A., Masoodi F A. Physico-chemical, structural, pasting and thermal properties of starches of fourteen himalayan rice cultivars. Int. J. Biol. Macromol. 2017;95:1101–1107. doi: 10.1016/j.ijbiomac.2016.10.100. [DOI] [PubMed] [Google Scholar]
- Hong S. I., Ma N., Kim I., Seo J. J., Kim I. W. Lipase-catalyzed synthesis of capsiate analog using vanillyl alcohol and conjugated linoleic acid under vacuum system. Process Biochem. 2012;47:2317–2322. doi: 10.1016/j.procbio.2012.09.011. [DOI] [Google Scholar]
- Jin j., Li D., Zhu X. M., Adhikari P., Lee K. T., Lee J. H. Production of diacylglycerols from glycerol monooleate and ethyl oleate through free and immobilized lipase-catalyzed consecutive reactions. New Biotechnol. 2011;28:190–195. doi: 10.1016/j.nbt.2010.10.005. [DOI] [PubMed] [Google Scholar]
- John Craven R., Lencki Robert W. Preparation of diacid 1,3-diacylglycerols. J. Am. Oil Chem. Soc. 2010;87:1281–1291. doi: 10.1007/s11746-010-1625-7. [DOI] [Google Scholar]
- Kahveci D., Guo Z., Ozcelik B., Xu X. B. Optimisation of enzymatic synthesis of diacylglycerols in binary medium systems containing ionic liquids. Food Chem. 2010;119:880–885. doi: 10.1016/j.foodchem.2009.07.040. [DOI] [Google Scholar]
- Keng P. S., Basri M., Ariff A. B., Abdul M. B., Abdul Rah- man R. N. Z., Salleh A. B. Scale-up synthesis of lipase-catalyzed palm esters in stirred-tank reactor. Bioresource Technol. 2008;99:6097–6104. doi: 10.1016/j.biortech.2007.12.049. [DOI] [PubMed] [Google Scholar]
- Kondo H., Hase T., Murase T., Tokimitsu I. Digestion and assimilation features of dietary DAG in the rat small intestine. Lipids. 2003;38:25–30. doi: 10.1007/s11745-003-1027-7. [DOI] [PubMed] [Google Scholar]
- Kristensen J. B., Xu X., Mu H. Process optimization using response surface design and pilot plant production of dietary diacylglycerols by lipase-catalyzed glycerolysis. J. Agr. Food Chem. 2005;53:7059–7066. doi: 10.1021/jf0507745. [DOI] [PubMed] [Google Scholar]
- Lerma-García M. J., Ramis-Ramos G., Herrero-Martínez J. M., Simó-Alfonso E. F. Authentication of extra virgin olive oils by Fourier-transform infrared spectroscopy. Food Chem. 2010;1:78–83. [Google Scholar]
- Lo S. K., Baharin B. S., Tan C. P., Lai O. M. Enzyme-catalyzed production and chemical composition of diacylglycerols from corn oil deodorizer distillate. Food Biotechnol. 2004;18:265–278. doi: 10.1081/FBT-200035014. [DOI] [Google Scholar]
- Lo S. K., Tan C. P., Long K., Yusoff M. S. A., Lai O. M. Diacylglycerol oil-properties, processes and products: A review. Food Bioprocess Tech. 2008;1:223–233. doi: 10.1007/s11947-007-0049-3. [DOI] [Google Scholar]
- Maki K. C., Davidson M. H., Tsushima R., Matsuo N., Tokimitsu I., Umporowicz D. M., Dicklin M. R., Foster G. S., Ingram K. A., Anderson B. D., Frost S. D., Bell M. Consumption of diacylglycerol oil as part of a reduced-energy diet enhances loss of body weight and fat in comparison with consumption of a triacylglycerol control oil. Am. J. Clin. Nutr. 2002;76:1230–1236. doi: 10.1093/ajcn/76.6.1230. [DOI] [PubMed] [Google Scholar]
- Meng X. H., Zou D. Y., Shi Z. P., Duan Z. Y., Mao Z. G. Dietary diacylglycerol prevents high-fat diet-induced lipid accumulation in rat liver and abdominal adipose tissue. Lipids. 2004;39:37–41. doi: 10.1007/s11745-004-1199-1. [DOI] [PubMed] [Google Scholar]
- Miklos R., Mora-Gallego H., Larsen F. H., Serra X., Cheong L.-Z., Xu X., Arnau J., Lametsch R. Influence of lipid type on water and fat mobility in fermented sausages studied by low-field NMR. Meat Sci. 2014;96:617–622. doi: 10.1016/j.meatsci.2013.08.025. [DOI] [PubMed] [Google Scholar]
- Miklos R., Xu X. B., Lametsch R. Application of pork fat diacylglycerols in meat emulsions. Meat Sci. 2011;87:202–205. doi: 10.1016/j.meatsci.2010.10.010. [DOI] [PubMed] [Google Scholar]
- Miklos R., Zhang H., Lametsch R., Xu X. Physicochemical properties of lard-based diacylglycerols in blends with lard. Food Chem. 2013;138:608–614. doi: 10.1016/j.foodchem.2012.10.070. [DOI] [PubMed] [Google Scholar]
- Mora-Gallego H., Serra X., Guàrdia M. D., Miklos R., Lametsch R., Arnau J. Effect of the type of fat on the physicochemical, instrumental and sensory characteristics of reduced fat non-acid fermented sausages. Meat Sci. 2013;93:668–674. doi: 10.1016/j.meatsci.2012.11.042. [DOI] [PubMed] [Google Scholar]
- Morita O., Soni M. G. Safety assessment of diacylglycerol oil as edible oil: a review of the published literature. Food Chem. Toxicol. 2009;47:9–21. doi: 10.1016/j.fct.2008.09.044. [DOI] [PubMed] [Google Scholar]
- Murase T., Aoki M., Wakisaka T., Hase T., Tokimitsu I. Anti-obesity effect of dietary diacylglycerol in C57 BL/6J mice: dietary diacylglycerol stimulates intestinal lipid metabolism. J. Lipid Res. 2002;43:1312–1319. [PubMed] [Google Scholar]
- Ng S. P., Lai O. M., Abas F., Lim H. K., Beh M. K., Ling T. C., Tan C.P. Compositional and thermal characteristics of palm olein-based diacylglycerol in blends with palm super olein. Food Res. Int. 2014;55:62–69. doi: 10.1016/j.foodres.2013.10.035. [DOI] [Google Scholar]
- Noureddini H., Harkey D. W., Gutsman M. R. A continuous process for the glycerolysis of soybean oil. J. Am. Oil Chem. Soc. 2004;81:203–207. doi: 10.1007/s11746-004-0882-y. [DOI] [Google Scholar]
- Pawongrat R., Xu X. B., H-Kittikun A. Synthesis of monoacylglycerol rich in polyunsaturated fatty acids from tuna oil with immobilized lipase AK. Food Chem. 2007;104:251–258. doi: 10.1016/j.foodchem.2006.11.036. [DOI] [Google Scholar]
- Rosu R., Yasui M., Iwasaki Y., Yamane T. Enzymatic synthesis of symmetrical 1,3-diacylglycerols by direct esterification of glycerol in solvent free system. J. Am. Oil Chem. Soc. 1999;76:839–843. doi: 10.1007/s11746-999-0074-7. [DOI] [Google Scholar]
- Singh A. K., Mukhopadhyay M. Olive oil glycerolysis with the immobilized lipase Candida Antarctica in a solvent free system. Grasas Aceites. 2012;63:202–208. doi: 10.3989/gya.094811. [DOI] [Google Scholar]
- Stojanović M. J., Velićković D., Dimitrijević A., Milosavić N., Knežević-Jugović Z., Bezbradica D. Lipase-catalyzed synthesis of ascorbyl oleate in acetone: Optimization of reaction conditions and lipase reusability. J. Oleo. Sci. 2013;62:591–603. doi: 10.5650/jos.62.591. [DOI] [PubMed] [Google Scholar]
- Tada N., Watanabe H., Matsuo N., Tokimitsu I., Okazaki M. Dynamics of postprandial remnant-like lipoprotein particles in serum after loading of diacylglycerols. Clin. Chim. Acta. 2001;311:109–117. doi: 10.1016/S0009-8981(01)00583-6. [DOI] [PubMed] [Google Scholar]
- Taguchi H., Watanabe H., Onizawa K., Nagao T., Gotoh N., Yasukawa T., Tsushima R., Shimasaki H., Itakura H. Double-blind controlled study on the effects of dietary diacylglycerol on postprandial serum and chylomicron triacylglycerol responses in healthy humans. J. Am. Coll. Nutr. 2000;19:789–796. doi: 10.1080/07315724.2000.10718079. [DOI] [PubMed] [Google Scholar]
- Toscano G., Riva G., Foppa Pedretti E., Duca D. Vegetable oil and fat viscosity forecast models based on iodine number and saponification number. Biomass Bioenerg. 2012;46:511–516. doi: 10.1016/j.biombioe.2012.07.009. [DOI] [Google Scholar]
- Wang L. L., Wang Y., Hu C. Y., Cao Q., Yang X. H., Zhao M. M. Preparation of diacylglycerol-enriched oil from free fatty acids using lecitase ultra-catalyzed esterification. J. Oil Fat Ind. 2011;88:1557–1565. [Google Scholar]
- Wang W. F., Li T., Ning Z. X., Wang Y. H., Yang B., Yang X. Q. Production of extremely pure diacylglycerol from soybean oil by lipase-catalyzed glycerolysis. Enzyme Microb. Tech. 2011;49:192–196. doi: 10.1016/j.enzmictec.2011.05.001. [DOI] [PubMed] [Google Scholar]
- Wang Y., Zhao M. M., OU S. Y., Xie L.Y., Tang S. Z. Preparation of a diacylglycerol-enriched soybean oil by phosphalipase A1 catalyzed hydrolysis. J. Mol. Catal. BEnzym. 2009;56:165–172. doi: 10.1016/j.molcatb.2008.07.008. [DOI] [Google Scholar]
- Xu X., Mu H., Skands A. R. H., Høy C. E., Adler-Nissen J. Parameters affecting diacylglycerol formation during the production of specific-structured lipids by lipase-catalyzed interesterification. J. Am. Oil Chem. Soc. 1999;76:175–181. doi: 10.1007/s11746-999-0215-z. [DOI] [Google Scholar]
- Zhong N. J., Li L., Xu X. B., Cheong L. Z., Zhao X. H., Li B. Production of diacylglycerols through low-temperature chemical glycerolysis. Food Chem. 2010;122:228–232. doi: 10.1016/j.foodchem.2010.02.067. [DOI] [Google Scholar]


