Abstract.
Breast cancer is the most frequently diagnosed cancer among women in the Western world. Thermography is a nonionizing, noninvasive, portable, and low-cost method that can be used in an outpatient clinic. It was tried as a tool to detect breast cancer tumors, however, it had too many false readings. Thermography has been extensively studied as a breast cancer detection tool but was not used as a treatment monitoring tool. The purpose of this study was to investigate the possibility of using thermal imaging as a feedback system to optimize radiation therapy. Patients were imaged with a thermal camera prior and throughout the radiotherapy sessions. At the end of the session, the images were analyzed for temporal vasculature changes through vessels segmentation image processing tools. Tumors that were not responsive to treatment were observed before the radiation therapy sessions were concluded. Assessing the efficacy of radiotherapy during treatment makes it possible to change the treatment regimen, dose, and radiation field during treatment as well as to individualize treatment schedules to optimize treatment effectiveness.
Keywords: thermal imaging, breast cancer, treatment monitoring, radiation therapy
1. Introduction
Breast cancer is the most frequently diagnosed cancer among women in the Western world.1 It can be detected by mammography, ultrasound (US), and magnetic resonance imaging (MRI). Positron emission tomography (PET) and X-ray CT scan can be used to evaluate systemic, metastatic disease. These modalities measure tumor size and location,1–3 but their use is limited by either their availability or cost (MRI and PET). Some involve ionizing radiation (mammography, CT, PET), and the sensitivity and specificity can be suboptimal (mammography, US).
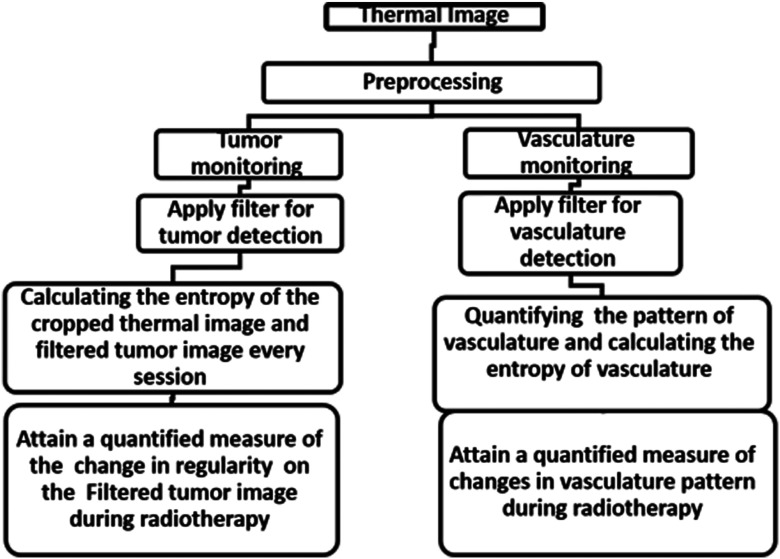
Thermography, which is a nonionizing, noninvasive, portable, and low-cost imaging modality, can be used potentially. Thermography is based on the detection of midinfrared radiation inertly emitted from the surface of a measured object.4 Any object with a temperature above the absolute zero degrees emits radiation from its surface. Thermography enables the recording of the temperature distribution of an object using the infrared radiation emitted by the surface of the object at wavelengths between 8 and .5 The human skin has a high emissivity of 0.98, thus the measured radiation can be converted directly into accurate temperature values. The high sensitivity of thermography to surface changes can be valuable for cancer treatment monitoring. Since malignant tumors are characterized by abnormal metabolic and perfusion rates,5 they are expected to show a different temperature distribution compared to the surrounding healthy tissue.6,7 Metabolic heat production is known to correlate with tumor growth,8,9 the more aggressive the tumor is, the more heat it produces.9–12 Therefore, a change in skin temperature map during treatment can be a measure of the tumor’s response to treatment. Thermography has been extensively studied as a breast cancer detection tool3,4,13–15 and was also investigated as a tool for early detection of mucositis in locally advanced head and neck cancer treated with chemoradiotherapy.16 The use of thermography to monitor treatment efficacy has yet to be evaluated. González17 showed that thermal camera with sensitivity of 100 mK can detect tumors with a diameter of 1 cm at a depth of 2 to 3 cm, and if the diameter of the tumor is bigger, it can be detected even deeper. In this study, we present a method for tumor and vasculature detection from a thermal image and propose a quantitative estimation of the changes in tumor and vasculature during radiotherapy. To the best of our knowledge, no other work demonstrates a visualization and quantification of tumor vasculature from a thermal image. The algorithm that we developed (Fig. 1) consists of four main steps:
Fig. 1.
The flowchart of the algorithm that we developed and reported in this study.
-
1.
Preprocessing,
-
2.
Filtering thermal images of tumors and vasculature (before treatment, after 15 Gy, after 30 Gy),
-
3.
Feature extraction, and
-
4.
Production of quantitative estimation of the changes in tumor regularity and vasculature shape during radiation therapy.
The first step consists of gray scale conversion, normalization of the image, and determination of the region of interest. In the second step, a filter that highlights the tumor and vasculature is applied. This filter was originally used to show vessels that have high contrast in angiography. However, we use this filter, as will be explained in this section, to identify blood vessels (long, narrow, hot objects) and blobs of heat (malignant tumors) in thermal images. In the third step, the change in regularity (as shown in the filtered images of the tumors) is calculated. In the filtered images of the vasculature, the changes in the vasculature’s shape are calculated. Finally, a quantitative measure of the change in the tumor’s regularity and the change in vasculature shape is produced.
2. Preprocessing Steps
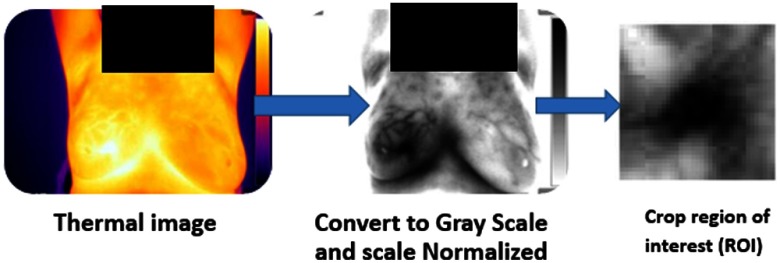
The preprocessing step includes (Fig. 2): (1) conversion of color image to gray scale and (2) setting a fixed temperature range of 7°C for all images. One can see physiological changes in the human tissue around 7°C. Entropy calculates the amount of uncertainty of a random variable. It is defined as follows:
| (1) |
Fig. 2.
Preprocessing steps explained on one of the thermal images taken in this study.
The probability density is needed for the calculation of the image entropy. This parameter is being estimated using a grayscale histogram. A fixed temperature range enables the comparison of the entropy shown in different images. The tumor area was cropped to enable focusing on the tumor’s change during radiotherapy.
3. Tumor and Vasculature Filtering and Monitoring
Frangi filter18 uses the eigenvectors of the Hessian matrix to compute the likelihood of an image region to contain vessels. As explained in Frangi et al. paper: when there is a significant difference between the two eigenvalues and of the Hessian matrix (one is low and the other is high), the object is tubular, and when there is no significant difference between the two eigenvalues, the object is blob-like. A blood vessel is an example of a tubular object.
Frangi defined the following parameter, which describes to what extent the object is either blob-like or tubular:
| (2) |
The more tubular the object is, the lower the value for this parameter.
An additional parameter used by Frangi is , where
| (3) |
The center of a blood vessel is a deep local minimum point when moving perpendicular to the main axis of the vessel. The second derivative in that direction is therefore high at such points, which yields a large value of . Therefore, ensures that we are in the center of the blood vessel.
Frangi et al. define a parameter called vesselness that aimed to emphasize the blood vessel in the image:
| (4) |
The constants and control the sensitivity of the filter.
The reason for setting to 0 when is negative because when the tubular object is brighter than its surroundings, and this is not the case with blood vessels. The smaller RB gets (we are in a tubular object) and the larger S gets (we are near the center of the object) then the value of the vesselness () increases. Note that depends on the width σ of the Gaussian (because the second derivatives at H depend on it).
Hence, the calculation of the parameters that construct needs to be performed for a series of σ values. We chose values suitable for small blood vessels.
Although the Frangi filter is designed to emphasize tubular structures, in thermal breast images, this filter can highlight both the tumor (which is generally blob-like) and the blood vessel network of the tumor (which is composed of tubular objects).
The tumor is characterized by a high temperature gradient (which means that its center is much warmer than its circumference), and therefore, it appears as a small bright blob showing a high and steep intensity change with the peak at its center. This leads to a high second derivative along the axes and hence to a high value of . Even though the value of RB for a tumor is not small (blob shape), the effect of yields a high value of vesselness and the tumor appears bright in the filtered image.
Each blob-like tumor contains a network of small tubular blood vessels. Enlarging the tumor (a “zoom” operation) enables us to observe the local temperature changes that characterize the blood vessels. This interpolation adapts the range of vessel widths addressed by the parameter to the value typical to tumor vasculature. Although is not as high as the value measured for the tumor before interpolation (now we have smaller and less steep intensity changes), the combined effect of RB and is sufficient for obtaining high vesselness values in the tubular structures (the blood vessels). In our case, enlarging the image by sevenfold allows the detection of the blood vessels.
4. Feature Extraction
Entropy characterizes the homogeneity of the image. The vasculature in tumors is disorderly compared to the structure in normal tissue.19
This may cause high entropy in the thermal image when compared to normal tissue. Tumors affect the homogeneity of a thermal image. Therefore, we investigate the possibility of measuring entropy to evaluate changes in the tumors.
In the feature extraction stage, entropy is calculated in the cropped thermal image of the tumor area as well as in the filtered tumor image.
After all the images of the patient have been filtered, we calculated the change in entropy in the image of the filtered tumor, as described in this equation:
| (5) |
4.1. Methods
Six women with breast cancer, who underwent radiation therapy breasts, at the Radiation Oncology unit in the Sheba Medical Center, Ramat-Gan, Israel, participated in this study. All patients underwent CT scans for three-dimensional treatment planning with both arms above the head on a breast board. Patients had stage IV breast cancer, with distant metastatic disease, and therefore never had surgery to remove the original breast tumor. All six women had viable tumor in the breast. They were intended to receive 45 Gy, divided into 15 fractions of 3 Gy/fraction. The treatments were administered 5 days a week, for 3 weeks in total, with no concomitant chemotherapy [hormonal therapy and Trastuzumab (Herceptin, Roche) were allowed]. The tumor’s diameter was bigger than 1 cm and the depth was less than 1 cm. Following IRB approval, the patients were offered to participate in this study and signed informed consent (ClinicalTrials.gov Identifier: NCT02776995). Demographic and treatment data (radiotherapy, chemotherapy, and hormonal therapy) were collected. Patients were monitored weekly throughout the period of radiotherapy, always before the radiotherapy session, and a day after the end of the previous radiation session by thermal cameras. In order to maintain fixed environmental conditions, the room temperature in the treatment room was set to 24°C to 26°C and the room humidity was 50% to 57%.
In addition, fluorescent lamps were turned off during image acquisition. The distance from the camera to the subject was 1 m.
The infrared cameras that were used are FLIR A35 for patient number 1 and FLIR A310 for patients 2 to 6. FLIR A35 has the following characteristics: frequency: 30 Hz, object temperature range of to 160°C, and thermal sensitivity: 50 mK. FLIR A310 has the following characteristics: frequency: 60 Hz, object temperature range of to , thermal sensitivity: 50 mK. The obtained thermal images were 8-bit gray level JPEG images containing (FLIR A35) or (FLIR A310). The entire gray level range (i.e., a dynamic range of 8 bits) was used in the analysis.
The thermal images were analyzed by the Frangi-based filter algorithm that we wrote and implemented with MATLAB software (Mathworks, Natick, Massachusetts).
A prolific network of blood vessels develops around tumors. Tumor blood vessels are irregular in their diameter with rather narrow tubes; the capillaries are sharply bent, winding, and branched with multiple dead ends.20
Apoptosis in tumor vasculature - endothelial cells leads to secondary death in tumor cells.21,22 Radiation-induced endothelial cell death is an extremely important factor affecting the efficacy of treatment.20,22 As far as we know there is currently no imaging modality that assesses the change in the vasculature during radiotherapy. In this study, we monitored the changes in the vasculature during RT.
4.2. Results
Patients’ age, stage, radiation protocol, concomitant, and medication are presented in Table 1.
Table 1.
Summary of the subjects’ parameters in this study.
| Patient No. | Age (years) | Stage | Total dose delivered (Gy) | Number of radiation fractions | Dose/fraction | Hormonal/immunotherapy during radiation |
|---|---|---|---|---|---|---|
| 1 | 54 | 4 | 45 | 15 | 3 | Trastuzumab |
| 2 | 62 | 4 | 45 | 15 | 3 | Exemestan |
| 3 | 68 | 4 | 45 | 15 | 3 | None |
| 4 | 37 | 4 | 45 | 15 | 3 | None |
| 5 | 50 | 4 | 45 | 15 | 3 | None |
| 6 | 38 | 4 | 45 | 15 | 3 | None |
5. Filtering and Entropy Calculation
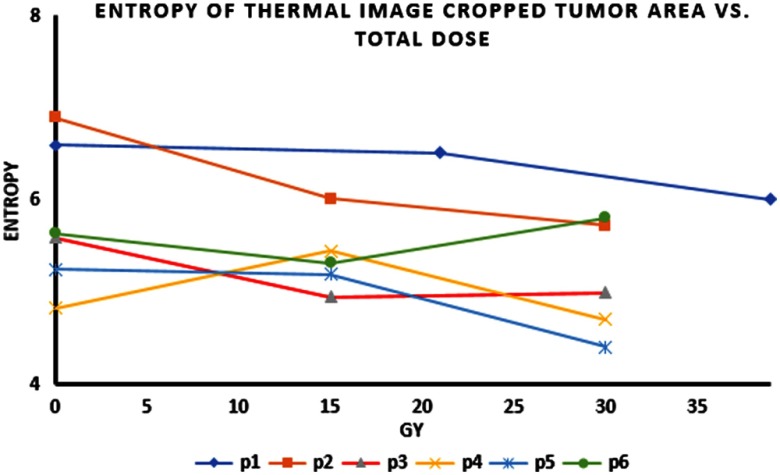
During radiation treatment, there was a reduction in entropy in the tumor areas in all patients. Figure 3 shows the entropy of the tumor areas during radiation therapy (as shown in the cropped thermal images).
Fig. 3.
Entropy of the thermal images (cropped tumor area) versus total applied dose as measured over night after the last radiation fraction.
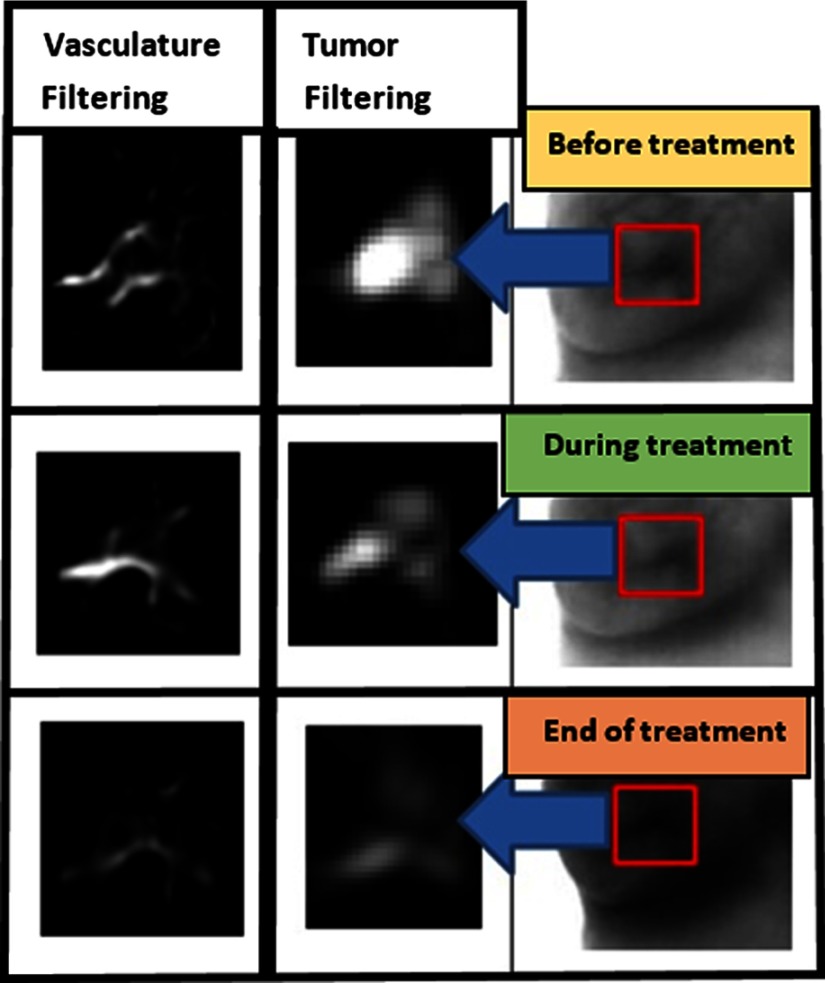
Figure 4 shows the thermal imaging of patient #1 before, during (21 Gy), and at the end of treatment (39 Gy). At the top of the thermal image, taken prior to the beginning of the treatment (after vasculature and tumor filtering), the tumor and vasculature are visualized. In the middle thermal image, taken during the radiotherapy (after 21 Gy), the vasculature and tumor are visibly reduced. In the thermal image at the bottom, taken at the end of treatment (after 39 Gy), a sharp decrease in size of the tumor and vasculature is evident.
Fig. 4.
Tumor and vasculature filtering from thermal image of patient #1 during radiation therapy.
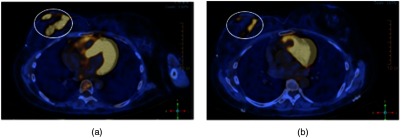
Figure 5(a) shows a CT-PET scan of patient #1 before radiation therapy. Figure 5(b) shows a CT-PET scan after the treatment. There is a reduction in the tumor avidity to 2-deoxy-2-[fluorine-18] fluoro-d-glucose documenting a treatment response.
Fig. 5.
(a) CT-PET scan of patient #1 before radiation therapy and (b) CT-PET scan after treatment. There is a reduction in the affinity to 2-deoxy-2-[fluorine-18] fluoro-d-glucose.
All images had the same gray scale. The last image in Fig. 4 was indeed darker due to heating of the breast during treatment. Radiotherapy involved irradiating the entire breast. This radiation caused inflammation, which in turn caused heating of the breast. The breast at the end of the treatment was therefore warmer than it was during earlier stages of the treatment. This appears as a darker breast in the grayscale image representing the end of the treatment (bottom image in Fig. 4).
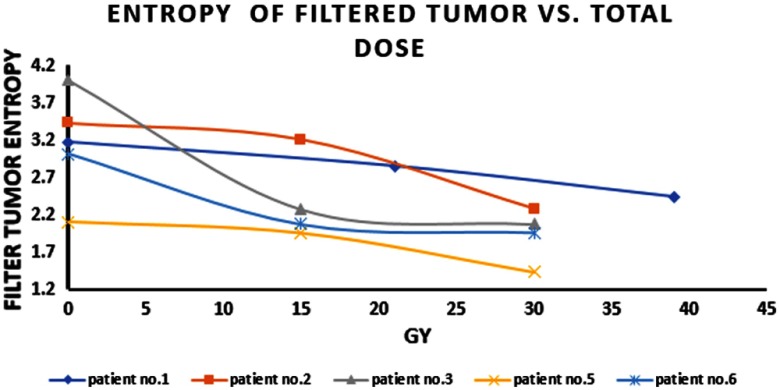
As shown in Fig. 6, the entropy of the filtered tumor image is reduced during radiotherapy. There is no data for patient #4, because her tumors were invading the skin with ulceration. In this case, Frangi filtering highlights the edges of the tumor on the skin and not the tumor or the vasculature.
Fig. 6.
Entropy of filtered tumor versus total dose.
6. Quantification of Vascular Shape Changes
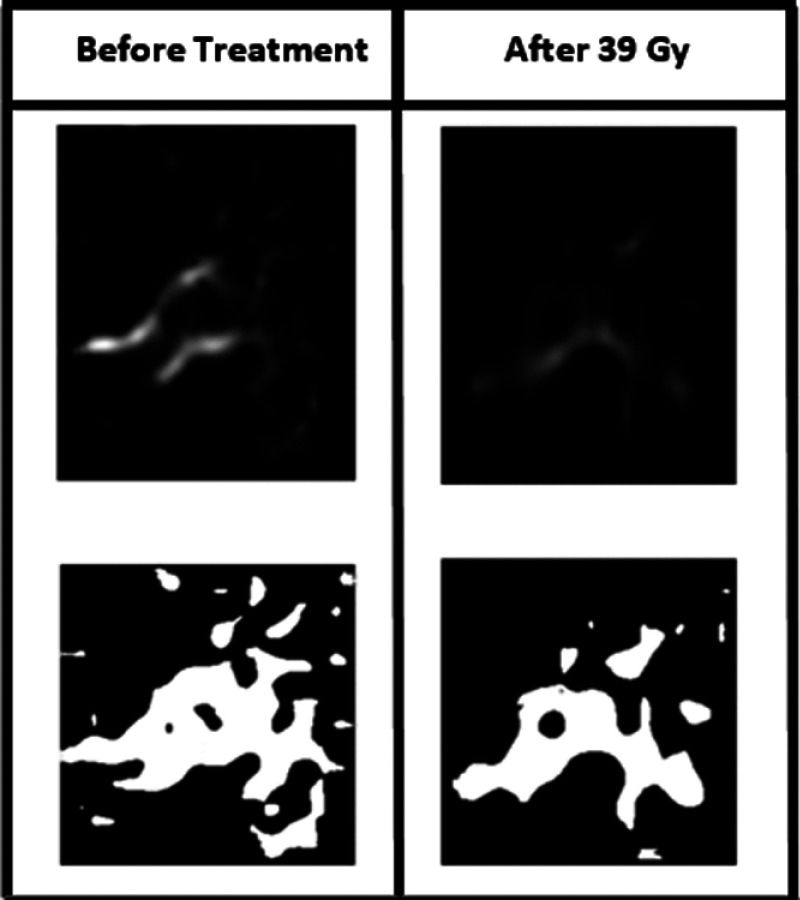
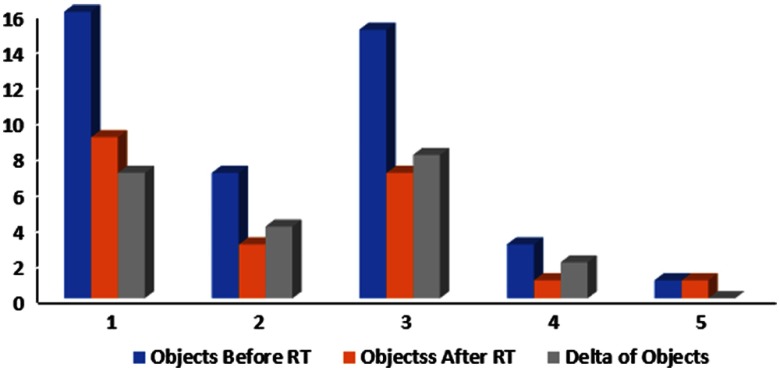
Using the filter, we were able to see the vascular network. In order to quantify the changes in the shape of the vascular network, we converted the image into a binary image, as shown in Fig. 7, and counted the number of objects. Figure 8 shows a diagram of the change in the number of objects during radiation therapy.
Fig. 7.
Conversion of the filtered vasculature image to binary image (before treatment and at the end treatment for patient #1).
Fig. 8.
Change in the number of objects in a binary image before and during treatment for all patients.
In order to find out whether there is a statistically significant difference between the starting values and ending values of the entropy and of the number of objects, a student’s -test was used. The obtained values were for the entropy of the tumor areas, for the entropy of the filtered tumor image, and for the number of objects.
Table 2 shows the changes in the percentage of the entropy, as calculated from the baseline image before treatment and the image after 30 Gy (patient #1 after 39 Gy).
Table 2.
Decrease in the entropy of filtered tumor images (%).
| Patient No. | Change in the entropy of filtered tumor image (%) |
|---|---|
| 1 | 23 |
| 2 | 29 |
| 3 | 48 |
| 4 | 26 |
| 5 | 35 |
6.1. Discussion
The proposed algorithm filters the tumor and vasculature from the thermal image to monitor tumor and vascular changes during treatment. Entropy characterizes the homogeneity of the image. The vasculature in tumors is disordered in comparison to the situation in normal tissue.19 We observed a decrease in entropy in the cropped thermal image during radiotherapy. Entropy reduction also appeared in the filtered tumor image during radiotherapy.
Vasculature of a tumor appears as a crab with many arms. In order to quantify the change in shape, we converted the image of vasculature to a binary image and counted the number of objects before and after RT. There was a reduction in the number of objects, thus a reduction in the number of vessels that supply nutrients to the tumor. The damage to the tumor’s vasculature is one of the most important factors in the response to radiotherapy.22 Apoptosis in tumor endothelial vasculature cells leads to secondary death in tumor cells.22 Our study demonstrates that the vascular changes that occur during treatment in the tumor area can be monitored and evaluated.
We propose in this study a thermography-based method for cancer treatment monitoring. We have developed a Frangi-based algorithm for tumor and vasculature and applied it to study the tumor response evaluation. The method can be very helpful in radiation planning, it helps avoiding unnecessary exposure to harmful ionizing radiation. It can potentially be used also for chemotherapy and immunotherapy treatments. Indeed, we are already planning larger studies to include those treatments. These studies will also include improved thermal imaging devices with multiple angles capturing as well as a real-time analysis.
Biographies
Merav Ben-David is a medical and radiation oncologist and is the head of the breast radiation unit at the Sheba Medical Center, Israel. She is a lecturer at the Sackler Medical School at the Tel Aviv University. She is involved and leading multiple clinical trials in the area of breast radiation and outcome, genetics and radiation, thermography, etc.
Israel Gannot received his PhD from Tel-Aviv University, in 1994. Between 1994 and 1997, he was a postdoctoral fellow at the FDA. He is a full professor at Tel-Aviv University and a research professor at Johns Hopkins University. He is a SPIE and AIMBE fellow. He is a former chair of the BME department at Tel-Aviv University. His field of research is biophotonics and theranostics. He is also a cofounder and CEO of optical diagnostics (instant bacteria detection instruments).
Biographies for the other authors are not available.
Disclosures
The authors have no relevant financial interests in this article and no potential conflicts of interest to disclose.
References
- 1.Nover A. B., et al. , “Modern breast cancer detection: a technological review,” Int. J. Biomed. Imaging 2009, 1–14 (2009).https://doi.org/10.1155/2009/902326 [DOI] [PMC free article] [PubMed] [Google Scholar]
- 2.Therasse P., et al. , “New guidelines to evaluate to response to treatment in solid tumors,” J. Natl. Cancer Inst. 92(3), 205–216 (2000).https://doi.org/10.1093/jnci/92.3.205 [DOI] [PubMed] [Google Scholar]
- 3.Agnelli J. P., Barrea A. A., Turner C. V., “Tumor location and parameter estimation by thermography,” Math. Comput. Modell. 53(7), 1527–1534 (2011).https://doi.org/10.1016/j.mcm.2010.04.003 [Google Scholar]
- 4.Diakides M., Bronzino J. D., Peterson D. R., Medical Infrared Imaging, 1st ed., CRC Press, Boca Raton, Florida: (2012). [Google Scholar]
- 5.Kennedy D. A., Lee T., Seely D., “A comparative review of thermography as a breast cancer screening technique,” Integr. Cancer Ther. 8(1), 9–16 (2009).https://doi.org/10.1177/1534735408326171 [DOI] [PubMed] [Google Scholar]
- 6.Macbeth R. A. L., Bekesi J. G., “Oxygen consumption and anaerobic glycolysis of human malignant and normal tissue,” Cancer Res. 22(2), 244 (1962). [PubMed] [Google Scholar]
- 7.Song C., et al. , “Thermographic assessment of tumor growth in mouse xenografts,” Int. J. Cancer 121(5), 1055–1058 (2007).https://doi.org/10.1002/(ISSN)1097-0215 [DOI] [PubMed] [Google Scholar]
- 8.Gautherie M., Gros C. M., “Breast thermography and cancer risk prediction,” Cancer 45(1), 51–56 (1980).https://doi.org/10.1002/(ISSN)1097-0142 [DOI] [PubMed] [Google Scholar]
- 9.Gautherie M., “Thermopathology of breast cancer: measurement and analysis of in vivo temperature and blood flow,” Ann. N. Y. Acad. Sci. 335(1 Thermal Chara), 383–415 (1980).https://doi.org/10.1111/nyas.1980.335.issue-1 [DOI] [PubMed] [Google Scholar]
- 10.Yahara T., et al. , “Relationship between microvessel density and thermographic hot areas in breast cancer,” Surg. Today 33(4), 243–248 (2003).https://doi.org/10.1007/s005950300055 [DOI] [PubMed] [Google Scholar]
- 11.Tepper M., et al. , “Thermographic investigation of tumor size, and its correlation to tumor relative temperature, in mice with transplantable solid breast carcinoma,” J. Biomed. Opt. 18(11), 111410 (2013).https://doi.org/10.1117/1.JBO.18.11.111410 [DOI] [PubMed] [Google Scholar]
- 12.Tepper M., Gannot I., “Monitoring tumor state from thermal images in animal and human models,” Med. Phys. 42(3), 1297–1306 (2015).https://doi.org/10.1118/1.4907967 [DOI] [PubMed] [Google Scholar]
- 13.Bronzino J. D., “Infrared imaging of the breast—an overview,” Chapter 25 in Biomedical Engineering Handbook—Biomedical Engineering Fundamentals, Amalu W. C., et al., Eds., 3rd ed., pp. 1–21, Taylor & Francis; (2006). [Google Scholar]
- 14.Fok S. C., Ng E. Y. K., Tai K., “Early detection and visualization of breast tumor with thermogram and neural network,” J. Mech. Med. Biol. 2(2), 185–195 (2002).https://doi.org/10.1142/S0219519402000344 [Google Scholar]
- 15.Mital M., Scott E. P., “Thermal detection of embedded tumors using infrared imaging,” J. Biomech. Eng. 129(1), 33 (2007).https://doi.org/10.1115/1.2401181 [DOI] [PubMed] [Google Scholar]
- 16.Cohen E. E. W., et al. , “Study of functional infrared imaging for early detection of mucositis in locally advanced head and neck cancer treated with chemoradiotherapy,” Oral Oncol. 49(10), 1025–1031 (2013).https://doi.org/10.1016/j.oraloncology.2013.07.009 [DOI] [PMC free article] [PubMed] [Google Scholar]
- 17.González F. J., “Thermal simulation of breast tumors,” Rev. Mex. Fis. E 53(4), 323–326 (2007). [Google Scholar]
- 18.Frangi A. F., “Three-dimensional model-based analysis of vascular and cardiac images,” PhD Dissertation, University Medical Center Utrecht, Utrecht, The Netherlands (2001). [Google Scholar]
- 19.Forster J. C., et al. , “A review of the development of tumor vasculature and its effects on the tumor microenvironment,” Hypoxia (Auckl) 5, 21–32 (2017).https://doi.org/10.2147/HP.S133231 [DOI] [PMC free article] [PubMed] [Google Scholar]
- 20.Jain R. K., Carmeliet P., “Angiogenesis in cancer and other diseases,” Nature 407(6801), 249–257 (2000).https://doi.org/10.1038/35025220 [DOI] [PubMed] [Google Scholar]
- 21.Park H. J., et al. , “Radiation-induced vascular damage in tumors: implications of vascular damage in ablative hypofractionated radiotherapy (SBRT and SRS),” Radiat. Res. 177(3), 311–327 (2012).https://doi.org/10.1667/RR2773.1 [DOI] [PubMed] [Google Scholar]
- 22.Garcia-Barros M., et al. , “Tumor response to radiotherapy regulated by endothelial cell apoptosis,” Science 300(5622), 1155–1159 (2003).https://doi.org/10.1126/science.1082504 [DOI] [PubMed] [Google Scholar]


