

Modulation of arogenate dehydratase in Arabidopsis causes changes in secondary metabolism, transient overaccumulation of starch, and lower photosynthetic electron transport rates.
Abstract
Arogenate dehydratase (ADT) catalyzes the final step of phenylalanine (Phe) biosynthesis. Previous work showed that ADT-deficient Arabidopsis (Arabidopsis thaliana) mutants had significantly reduced lignin contents, with stronger reductions in lines that had deficiencies in more ADT isoforms. Here, by analyzing Arabidopsis ADT mutants using our phenomics facility and ultra-performance liquid chromatography-mass spectrometry-based metabolomics, we describe the effects of the modulation of ADT on photosynthetic parameters and secondary metabolism. Our data indicate that a reduced carbon flux into Phe biosynthesis in ADT mutants impairs the consumption of photosynthetically produced ATP, leading to an increased ATP/ADP ratio, the overaccumulation of transitory starch, and lower electron transport rates. The effect on electron transport rates is caused by an increase in proton motive force across the thylakoid membrane that down-regulates photosystem II activity by the high-energy quenching mechanism. Furthermore, quantitation of secondary metabolites in ADT mutants revealed reduced flavonoid, phenylpropanoid, lignan, and glucosinolate contents, including glucosinolates that are not derived from aromatic amino acids, and significantly increased contents of putative galactolipids and apocarotenoids. Additionally, we used real-time atmospheric monitoring mass spectrometry to compare respiration and carbon fixation rates between the wild type and adt3/4/5/6, our most extreme ADT knockout mutant, which revealed no significant difference in both night- and day-adapted plants. Overall, these data reveal the profound effects of altered ADT activity and Phe metabolism on secondary metabolites and photosynthesis with implications for plant improvement.
Arogenate dehydratases (ADTs) catalyze the dehydrative decarboxylation of arogenate to Phe (Jung et al., 1986; Siehl and Conn, 1988; Cho et al., 2007) in the stroma of chloroplasts and plastids in vascular plants (Rippert et al., 2009). In terms of carbon allocation from photosynthesis, only a very small fraction of this Phe resides in proteins. Phe downstream metabolism is instead targeted largely toward generating substrates/precursors of lignin biopolymers and an enormous array of compounds that are predominantly phenylpropanoid/phenylpropanoid acetate metabolites, such as flavonoids (Supplemental Fig. S1; Corea et al., 2012).
Arabidopsis (Arabidopsis thaliana) has a six-member ADT gene family. However, it is not well understood (1) to what extent specific ADT genes are differentially regulated as to carbon allocation into distinct downstream metabolic branches and/or (2) what effect differential gene expression might have on metabolism overall, including upstream effects on photosynthesis capacity and source/sink relationships.
As shown previously, knockout mutants of the Arabidopsis ADT gene family were associated with different degrees of reduction of lignin content (Corea et al., 2012). These plant lines were grown under long-day conditions (16 h of light) from germination to maturation (8–10 weeks), which induced stem elongation (bolting) and lignification. From the eight knockout lines generated, single knockouts of ADT1 and ADT3 had no apparent impact on bolting stem lignin content, whereas the ADT4 knockout resulted in a slightly higher lignin stem content and the ADT5 knockout had decreased lignin stem content by ∼18%. The adt4/5 line displayed a further reduction in lignin content of ∼38%, as did the triple knockouts adt1/4/5 and adt3/4/5, which displayed ∼50% reductions. The quadruple knockout adt3/4/5/6 possessed the greatest magnitude of lignin reduction of ∼70% and was unable to maintain bolting stem structural integrity. The double mutant adt4/5 and the triple mutants adt1/4/5 and adt3/4/5 also displayed some visual evidence of bolting stem structural weakening.
Due to this important role in cell wall lignin biosynthesis, ADT is a potentially attractive target for metabolic engineering of lignin contents in plants (Corea et al., 2012). However, remodeling of plant metabolism by genetic tools has to take into account the fact that biochemical reactions in the cell are interconnected, meaning that the manipulation of one specific pathway can potentially have several systemic consequences. Understanding such interdependencies is essential for metabolic engineering approaches to, for example, improve traits of interests in crop plants and forestry species. To explore the consequences of ADT modulation, the effects on the reactions biochemically upstream of photosynthetic energy conversion and overall metabolism were examined in ADT mutants.
Here, we describe a high-throughput phenotyping system (phenomics; Puthiyaveetil et al., 2014; Tietz et al., 2015) that allowed us to monitor changes in photosynthetic performance and growth over almost the entire vegetative growth period of Arabidopsis wild-type and ADT knockout mutant plants. For photosynthesis, this high-throughput approach was based on non-invasive optical determination of key photosynthetic parameters derived from chlorophyll fluorescence measurements (Kramer et al., 2004; Baker, 2008; Brooks and Niyogi, 2011). Metabolomics analyses performed following photosynthetic parameter assessments (i.e. plants analyzed 44 days after sowing [DAS]), as well as later (70 DAS), focused on both targeted and non-targeted (polar) secondary metabolites using hyphenated liquid chromatography-high resolution mass spectrometry approaches. Real-time atmospheric monitoring-mass spectrometry (RTAM-MS) also was employed to evaluate net CO2 uptake rates. The significance of our findings is described below.
RESULTS
Selection of Growth Conditions
Arabidopsis is a facultative long-day plant; its flowering is delayed under short-day conditions (Haughn et al., 1995; Koornneef et al., 1998). In our previous studies, ADT knockout mutants (adt1, adt3, adt4, adt5, adt4/5, adt1/4/5, adt3/4/5, and adt3/4/5/6) and wild-type plants were grown under long-day conditions (16 h of light and 8 h of dark), with lignifying stems beginning to bolt by about 3 weeks (Corea et al., 2012).
For the photosynthetic studies described herein, plants were grown under short-day conditions (9 h of light), which are typically employed in Arabidopsis photosynthetic studies. That is, plants did not form inflorescence stems (Fig. 1A) within the study time frame, as this developmental stage is delayed under short-day conditions. The overall purpose here was to simultaneously study, in our phenomics facility, the effect of altered ADT activity on photosynthetic efficiency, plant growth parameters, and secondary metabolism. Photosynthetic and growth parameters were thus measured every 2 d. These measurements were complemented by the determination of starch content and other metabolomics analyses as well as the analysis of net CO2 uptake of plants at the completion of the phenomics analyses that were still in the vegetative growth phase.
Figure 1.

Layout of phenomics experiments and growth characteristics of Arabidopsis wild-type (WT) plants. A, Example of a block of nine plants representing the nine genotypes. It was assumed that the microclimate in this block is uniform. B, Examples of how individual blocks (numbered) are arranged in the phenomics facility. The numbers in B indicate the order of functional measurements. C, For this study, a total of four sets were averaged, leading to 40 plants per genotype. D, Example of false-color chlorophyll fluorescence images (Fo parameter) of the plants shown in A. E, Growth curve indicating plant size (for the wild type) as a function of DAS expressed as total leaf area deduced from chlorophyll images (see D); the latter was first measured when the plants were moved to the phenomics facility (i.e. 20 DAS). Data for the four examined data sets are depicted. F, The data from E were averaged and presented as means ± se. Photographs at right are examples of the different growth phases (indicated by blue arrows). Bar = 2 cm.
Establishing Phenomics Capability
Large-scale phenotyping of plants is an important emerging field in plant biology and agricultural research (Tester and Langridge, 2010; Araus and Cairns, 2014; Fahlgren et al., 2015). However, it is a challenge to ensure uniform environmental conditions over the entire growth facility, as small heterogeneities in microclimates often occur that lead to artificial differences in plant physiological responses. To minimize such potential differences, a block approach was applied that consisted of one wild-type and eight ADT mutant plants per block (Fig. 1A). In this way, data gained from the mutants can be normalized to the corresponding wild-type plant in the same block. Since the block size is small (26 × 26 cm), microclimate differences can be considered to have a negligible effect. Starting with the block arrangement, the entire phenomics facility was filled as shown in Figure 1B, thereby permitting each genotype to be measured in 12-fold replicates. To further enhance the statistical significance of comparisons between ADT mutants and the wild type, four independent sets of measurements were performed (Fig. 1C), creating 40 biological replicates per genotype. Furthermore, for the automated determination of physiological parameters from chlorophyll fluorescence data, areas belonging to the plant were separated from non-plant areas. This was readily achieved by thresholding chlorophyll fluorescence values (i.e. when the fluorescence intensity of a pixel is above a certain level, it counts as part of the plant). Accordingly, plant and nonplant areas can be separated seamlessly (Fig. 1D).
An advantage of noninvasive optical screening is that plants can be observed over long time periods without perturbing growth/development. Wild-type and ADT mutant plants were thus screened for over 4 weeks in the phenomics facility starting from 20 DAS (Fig. 1F), with plant size estimated as total pixel size that represents the projection of all plant leaves during the vegetative growth period studied (Fig. 1D). The growth curves of the four individual sets of plants (Fig. 1E) displayed quite high congruence that justified averaging the four sets (Fig. 1F). Additionally, the 4-week growth measurement in the phenomics facility (Fig. 1, E and F) covers almost the entire vegetative life span from young seedlings to mature plants, but prior to the onset of inflorescence stem growth. Since the photosynthetic phenotypes were most pronounced in the adt3/4/5/6 quadruple knockout relative to the wild type (Fig. 2A), we concentrated on functional analysis of this mutant for additional insights into effects on the photosynthetic apparatus. This is detailed in the next section.
Figure 2.

Comparison of growth characteristics and photosynthetic parameters in wild-type (WT) and adt3/4/5/6 plants. A, Growth curve indicating plant size as a function of DAS expressed as total leaf area deduced from chlorophyll images, as explained in Figure 1. Data are means ± se, with significant differences indicated by red stars (Student’s t test, P < 0.05). B, Linear electron transport expressed as the ΦII parameter. Data are means ± se calculated from the four measuring sets. C and D, qE (C) and 1-qL (D). Data are derived as in A. For details, see text. In B to D, histograms at right depict means ± se averaged over the entire measuring period, with significant differences indicated by red stars (Student’s t test; one star, P < 0.05; three stars, P < 0.001).
Phenomics Analysis with the adt3/4/5/6 Mutant
The consequences of impaired carbon flux into lignin and potentially other phenylpropanoid metabolites with regard to photosynthetic primary reactions are unknown. To address this, a comparison between adt3/4/5/6 and wild-type plants was performed, with total leaf areas plotted in Figure 2A. For young seedlings (20–30 DAS) and older plants (40–50 DAS) prior to inflorescence stem development, no significant differences in leaf growth were apparent between both lines. However, at midgrowth phase (30–40 DAS), where plants show the most rapid increase in biomass, adt3/4/5/6 plants displayed a somewhat diminished growth relative to wild-type plants (Fig. 2A, with statistically significant differences marked by red stars).
To further study the impact of ADT modulation on photosynthesis, a chlorophyll fluorescence analysis was conducted in parallel to the growth measurements. In this regard, the ΦII parameter measures the photochemical energy conversion efficiency of PSII and is a measure of linear photosynthetic electron flux (Genty et al., 1989; Kramer et al., 2004; Baker, 2008). ΦII is determined by two parameters: photoprotective high-energy quenching (qE) and the fraction of PSII reaction centers that are open (qL; Kramer et al., 2004; Baker, 2008). The latter is a measure of electron backpressure in the photosynthetic electron transport (PET) chain (expressed as the fraction of closed centers: 1-qL) and depends on the efficiency of NADPH + H+ consumption by downstream metabolic reactions (mainly the Calvin-Benson cycle). Over the measurement period, ΦII fluctuated randomly by about ±10% without a time-dependent trend (Fig. 2B), although ΦII tended to be slightly smaller for the adt3/4/5/6 line. This became statistically significant when ΦII was averaged over the entire measuring period (Fig. 2B, right). When these measurements were performed with plants at the end of the night period (night-adapted [NA] plants), essentially the same effect for ΦII was obtained for day-adapted (DA) plants (measured around noon), as shown in the histogram at right in Figure 2B.
The qE mechanism is induced by acidification of the thylakoid lumen that is caused by light-induced proton pumping of PSII and the cytochrome b6f complex (Ruban et al., 2012). As for ΦII, both qE and 1-qL fluctuated randomly over the measurement period (Fig. 2, C and D). Therefore, they were averaged over the entire time frame to identify significant changes (Fig. 2, C and D, right). Comparison of both parameters revealed that the reason for the lower ΦII in adt3/4/5/6 was an increased qE but not a change in redox status of the PET chain (no change in 1-qL). The higher qE in the mutant line is indicative of a higher ΔpH across thylakoid membranes. These data provisionally suggested that ATP, generated from ADP and inorganic phosphate (Pi) during photosynthesis, was less efficiently consumed by energy-dependent metabolic processes in adt3/4/5/6 (i.e. ΔpH increased because substrates for the ΔpH-consuming ATPase [ADP + Pi] became limiting due to inefficient consumption of ATP). Impairment in metabolizing ATP in adt3/4/5/6 would be in accordance with the observed overaccumulation of starch in the DA samples acting as an ATP sink in adt3/4/5/6 plants (Fig. 3A). This was supported further by measurements of ATP/ADP ratios (see “Materials and Methods”). For both the DA and NA light conditions, the ATP/ADP ratios for adt3/4/5/6 were higher compared with those in the wild type (0.77 and 0.6 for adt3/4/5/6 versus 0.62 and 0.52 for the wild type, respectively), which suggested restricted ATP consumption in adt3/4/5/6.
Figure 3.

Analysis of metabolites in wild-type (WT) and adt3/4/5/6 plants. A, Starch contents. B, Flavonoid contents. C, Phenylpropanoid contents. D, Lignan contents. E, Phenolic glucoside contents. All values are relative to the internal standard naringenin. Data are means ± se, collected for DA and NA plants. nd, Not detected.
PET and Electrochromic Shift Measurements
To characterize photosynthetic energy conversion in more detail, light saturation curves were recorded under laboratory conditions (Fig. 4). The measurements utilized NA leaves adapted to different light intensities with the dark-interval-relaxation kinetics (DIRK) method (for details, see “Materials and Methods”). The determination of qE requires a dark period after illumination that is impractical for measuring a light saturation curve (constant changes of light intensities). Therefore, the nonphotochemical quenching (NPQ) parameter was measured instead, this being dominated by the qE component (Baker, 2008). NPQ can be used as a proxy for qE (herein, for the sake of simplicity, the term NPQ will be used also if qE is measured). As expected, increasing light intensity led to reduction in ΦII (Fig. 4A) because of electron backpressure from the Calvin-Benson cycle (saturation of biochemical pathways) and down-regulation of PSII activity by NPQ. The ΦII values for the wild type and adt3/4/5/6 at 200 μmol quanta m–2 s–1 were between 0.35 and 0.4, which is in good agreement with the data collected for NA plants in the phenomics facility (∼0.32) for the same light intensity (Fig. 2B). Activation of NPQ with increasing light intensity was clearly observed (Fig. 4B). Comparing the wild type with adt3/4/5/6 showed a small decrease in ΦII (5%–10%) and a small increase in NPQ (5%–15%), mainly at moderate light intensities (120–300 μmol quanta m–2 s–1; i.e. approximately the light intensity of the 200 μmol quanta m–2 s−1 used in the phenomics facility). Plotting ΦII as a function of NPQ showed an almost linear correlation with no significant differences observed between the wild type and adt3/4/5/6 (Fig. 4C). This high congruence gave strong evidence that the sensitivity of linear electron transport flux on the NPQ mechanism was unchanged in adt3/4/5/6.
Figure 4.

Photosynthetic parameters of NA wild-type (WT) and adt3/4/5/6 plants in the laboratory. Measurements were performed using the DIRK approach (see “Materials and Methods”). A, ΦII. B, NPQ. C, Linear correlation between ΦII and NPQ. Data are means ± se, with significant differences indicated by red stars (Student’s t test, P < 0.05).
To understand why NPQ was higher in adt3/4/5/6, the proton motive force (PMF) across the thylakoid membrane was measured by employing electrochromic shift (ECS) measurements on intact leaves. The ECS measurement is a noninvasive optical absorption method that quantifies the magnitude of the light-generated PMF in thylakoid membranes (Bailleul et al., 2010), with an apparent peak absorption at 520 nm (Witt, 1979; Bailleul et al., 2010). For relative fast absorption measurements (faster than 1 s), the A520 is almost free of other signal components that could interfere. It was next measured in the DIRK measuring mode on NA plants. Typical measurements for different light intensities (ranging from 70 to 850 μmol quanta m–2 s–1) are shown in Figure 5A. The actual ECS signal for a given light intensity (ECS total) is given as the difference of absorption level in the light minus the level in the subsequent dark pulse (see the arrow in Fig. 5A, for 850 µmol quanta m–2 s–1). Figure 5B shows a statistical analysis of ECS amplitude as a function of light intensity. Increasing the latter led to higher ECS, because the rate of light-induced proton pumping by PSII and the cytochrome b6f complex increased. The ECS was saturated at around 400 μmol quanta m–2 s–1. Importantly, the ECS was higher in adt3/4/5/6 compared with wild-type leaves. Thus, the higher light-generated PMF in adt3/4/5/6 was most likely the reason for its elevated NPQ (Figs. 2C and 4B). The higher PMF in adt3/4/5/6 agrees with data described above that indicate restricted ATP consumption.
Figure 5.

Energization of thylakoid membranes measured by ECS. A, Examples of ECS kinetics for different light intensities (indicated by color-associated numbers in μmol quanta m–2 s–1). ECS relaxations from NA plants illuminated with the various light intensities were induced by a dark pulse (black bar). The arrow indicates the amplitude of ECS signal (ECS total). B, Dependency of total ECS signal on light intensity. Data are means ± se derived from seven measurements as shown in A. WT, Wild type.
Metabolomics of the Wild Type and ADT Mutants
Two sets of metabolomics analyses of the rosette leaves were carried out. The first set corresponded with the completion of the photosynthetic (phenomics) study at 44 DAS, whereas the second was at 70 DAS, when all plant lines were still in vegetative growth (i.e. they were not senescing).
Metabolic Analysis of Rosette Leaves (70 DAS)
Nine plants for all of the different lines were harvested for both DA and NA treatments 70 DAS. This was partly in order to establish whether, under short-day conditions, the different ADT knockout mutants displayed similar trends in terms of modulating (reducing) levels of soluble low-Mr phenylpropanoid/phenylpropanoid acetate metabolites, as noted previously for lignins when grown under long-day conditions (Corea et al., 2012). In addition, analyses of both DA and NA plant lines were aimed at determining specific changes that could potentially be affected by the circadian rhythm.
Non-targeted metabolomics analyses were first conducted. Using freely available computational tools (XCMS, CAMERA, DeviumWeb, and MeV; see “Materials and Methods”), ultra-performance liquid chromatography-quadrupole time of flight (UPLC-qTOF)-electrospray ionization chromatograms were processed for retention time correction and integration, resulting in ∼540 detected features (i.e. unique m/z versus retention time signals). Initially, we focused on comparing wild-type plants with adt3/4/5/6 plants, the latter being hypothesized to display the most dramatic effects on metabolism given the phenotype observed. In this comparison, we identified 304 and 250 features that were altered significantly (P ≤ 0.05, after normalization to the internal standard naringenin recoveries) following comparison of DA and NA plants, respectively. Supplemental Table S1 summarizes the features detected with corresponding statistical analysis for all individual features.
An initial global assessment of the metabolomics data also was performed using hierarchical clustering analysis (HCA) and partial least square discriminant analysis (PLSDA), after peak intensities were normalized to internal standard naringenin recoveries, centered, and standardized. This initial analysis was used for rapid visualization of overall metabolic effects and trends across the different ADT mutants and time of harvest (i.e. DA and NA plants) as well as for the selection of those metabolites most significantly affected by ADT modulation, thereby helping guide subsequent annotation efforts.
It was next instructive to establish (to the extent possible) the identities of significantly altered features. Accordingly, our experimental approach focused on the known polar secondary metabolites found in Arabidopsis. These included flavonoids, phenylpropanoids (i.e. sinapoyl esters and lignans), benzenoids, and glucosinolates (D’Auria and Gershenzon, 2005; Nakabayashi et al., 2009), as detected in chromatograms of leaf extracts (Supplemental Fig. S2). In this regard, compounds were identified either through the use of authentic standards or were annotated based on comparisons with the literature and/or public spectral libraries of known Arabidopsis metabolites (D’Auria and Gershenzon, 2005; Glauser et al., 2008; Nakabayashi et al., 2009; Matsuda et al., 2010). In addition, a third group of features was provisionally annotated in terms of putative chemical class (Sumner et al., 2007), but their structures were not unambiguously determined (Supplemental Table S1).
In the wild type, six flavonoids, some of the most characteristic and abundant metabolites in Arabidopsis (Veit and Pauli, 1999; Saito et al., 2013), were detected. These consisted of four kaempferol glycosides (kaempferol-3-glucoside-7-rhamnoside, kaempferol-3-glucoside-2ʹʹ-rhamnoside-7-rhamnoside, kaempferol-3-glucoside-2ʹʹ-glucoside-7-rhamnoside, and kaempferol-3,7-dirhamnoside) and two quercetin derivatives (quercetin-3-glucoside-7-rhamnoside and quercetin-3-glucoside-2ʹʹ-rhamnoside-7-rhamnoside; Supplemental Fig. S3A; Table I).
Table I. Pairwise comparison of metabolites, both identified and those with putative annotations, that have significantly altered amounts between wild-type and adt3/4/5/6 plants.
| Feature | m/z | Retention Time | Calculated Mass | Errora | Ion | Annotation | Annotation Levelb | Category | Pairwise: Wild Type Versus adt3/4/5/6 (NA) |
Pairwise: Wild Type Versus adt3/4/5/6 (DA) |
||||
|---|---|---|---|---|---|---|---|---|---|---|---|---|---|---|
| –logP10 | Fold | Higher/Lower | –logP10 | Fold | Higher/Lower | |||||||||
| min | ppm | |||||||||||||
| M545T1236 | 545.2598 | 20.59 | 545.2598 | 0.07 | [M+FA–H]– | sn2-O-(Di-nor-oxophytodienoyl)-monogalactosyl monoglyceride | 2 | Galactolipids | 1.65 | 2.0 | H | 1.65 | 2.0 | H |
| M735T1343 | 735.3439 | 22.38 | 735.3439 | 0.07 | [M+FA–H]– | sn1-O-(12-Oxophytodienoyl)-digalactosyl monoglyceride | 2 | Galactolipids | 1.86 | 2.1 | H | 1.86 | 2.1 | H |
| M573T1455 | 573.2911 | 24.24 | 573.2911 | 0.14 | [M+FA–H]– | sn1-O-(12-Oxophytodienoyl)-monogalactosyl monoglyceride | 2 | Galactolipids | 1.79 | 2.3 | H | 1.79 | 2.3 | H |
| M755T575 | 755.2030 | 9.59 | 755.2035 | 0.62 | [M–H]– | Quercetin-3-glucoside-2′′-rhamnoside-7-rhamnoside | 1 | Flavonoids | 1.61 | 2.0 | L | 2.59 | 2.1 | L |
| M739T610 | 739.2084 | 10.16 | 739.2086 | 0.25 | [M–H]– | Kaempferol-3-glucoside-2′′-rhamnoside-7-rhamnoside | 1 | Flavonoids | 3.27 | 1.8 | L | 3.47 | 1.4 | L |
| M609T658 | 609.1455 | 10.97 | 609.1456 | 0.10 | [M–H]– | Quercetin-3-glucoside-7-rhamnoside | 1 | Flavonoids | 2.11 | 3.2 | L | 2.84 | 3.0 | L |
| M755T689 | 755.2033 | 11.49 | 755.2035 | 0.31 | [M–H]– | Kaempferol-3-glucoside-2′′-glucoside-7-rhamnoside | 2 | Flavonoids | 1.77 | 1.2 | L | 3.11 | 1.7 | L |
| M593T713 | 593.1506 | 11.89 | 593.1506 | 0.04 | [M–H]– | Kaempferol-3-glucoside-7-rhamnoside | 1 | Flavonoids | 3.96 | 2.5 | L | 4.68 | 1.9 | L |
| M577T777 | 577.1559 | 12.95 | 577.1557 | 0.22 | [M–H]– | Kaempferol-3,7-dirhamnoside | 1 | Flavonoids | 3.65 | 1.4 | L | 4.44 | 1.3 | L |
| M387T485 | 387.1294 | 8.09 | 387.1291 | 0.60 | [M+FA–H]– | Coniferin | 1 | Phenylpropanoids | 4.28 | 2.8 | L | 2.41 | 2.9 | L |
| M385T589 | 385.1132 | 9.81 | 385.1135 | 0.71 | [M–H]– | Sinapic acid glucoside | 1 | Phenylpropanoids | 3.06 | 4.8 | L | |||
| M325T669 | 325.0559 | 11.14 | 325.0560 | 0.26 | [M–H]– | 5-Hydroxyferuloyl malate | 3 | Phenylpropanoids | 2.66 | 12.2 | L | 2.73 | 8.9 | L |
| M339T796 | 339.0718 | 13.27 | 339.0716 | 0.46 | [M–H]– | Sinapic acid malate ester | 2 | Phenylpropanoids | 2.61 | 1.3 | L | |||
| M339T808 | 339.0717 | 13.47 | 339.0716 | 0.41 | [M–H]– | Sinapoyl malate | 1 | Phenylpropanoids | 1.42 | 1.3 | L | 2.34 | 1.3 | L |
| M591T907 | 591.1708 | 15.11 | 591.1714 | 0.90 | [M–H]– | 1,2-Di-O-sinapoyl-β-d-Glc | 3 | Phenylpropanoids | 3.40 | 5.1 | L | 2.23 | 6.2 | L |
| M583T596 | 583.2030 | 9.94 | 583.2037 | 0.51 | [M+FA–H]– | Dimeric coniferyl alcohol hexoside | 3 | Lignan glucosides | 3.60 | 2.1 | L | 5.14 | 2.4 | L |
| M681T654 | 681.2390 | 10.90 | 681.2395 | 0.71 | [M–H]– | Pinoresinol-4,4′-di-O-β-d-glucoside | 1 | Lignan glucosides | 2.73 | 1.8 | L | 2.65 | 1.7 | L |
| M521T720 | 521.2021 | 11.99 | 521.2023 | 0.36 | [M–H]– | Dimeric coniferyl alcohol hexoside | 3 | Lignan glucosides | 5.78 | 3.3 | L | 3.65 | 2.3 | L |
| M521T765 | 521.2023 | 12.75 | 521.2023 | 0.12 | [M–H]– | Dimeric coniferyl alcohol hexoside | 3 | Lignan glucosides | 4.80 | 3.6 | L | 3.39 | 3.4 | L |
| M565T767 | 565.1921 | 12.78 | 565.1921 | 0.09 | [M+FA–H]– | Dimeric coniferyl alcohol hexoside | 3 | Lignan glucosides | 5.04 | 2.7 | L | 4.25 | 2.2 | L |
| M519T836 | 519.1867 | 13.93 | 519.1866 | 0.11 | [M–H]– | Pinoresinol-4-O-β-d-glucoside | 1 | Lignan glucosides | 4.94 | 3.1 | L | 5.33 | 2.8 | L |
| M285T462 | 285.0613 | 7.70 | 285.0610 | 0.79 | [M–H]– | Dihydroxybenzoic acid-O-pentoside | 3 | Phenolic glucosides | 1.95 | 1.3 | L | 2.54 | 1.6 | L |
| M299T502 | 299.0770 | 8.37 | 299.0767 | 0.97 | [M–H]– | Hydroxybenzoic acid-4-O-β-d-glucopyranoside | 3 | Phenolic glucosides | 1.77 | 2.0 | L | 1.45 | 2.4 | L |
| M285T513 | 285.0610 | 8.54 | 285.0610 | 0.23 | [M–H]– | Dihydroxybenzoic acid-O-pentoside | 3 | Phenolic glucosides | 1.42 | 3.0 | L | 1.81 | 2.8 | L |
| M422T137 | 422.0249 | 2.28 | 422.0249 | 0.13 | [M–H]– | Glucoiberin | 3 | Glucosinolates | 4.75 | 2.6 | L | |||
| M436T221 | 436.0407 | 3.69 | 436.0406 | 0.21 | [M–H]– | Glucoraphanin | 1 | Glucosinolates | 3.69 | 2.2 | L | 1.39 | 1.8 | L |
| M450T275 | 450.0562 | 4.59 | 450.0562 | 0.07 | [M–H]– | Glucoalyssin | 2 | Glucosinolates | 1.65 | 1.9 | L | 1.65 | 1.5 | L |
| M464T335 | 464.0708 | 5.58 | 464.0719 | 2.35 | [M–H]– | Glucohesperalin | 2 | Glucosinolates | 2.16 | 2.3 | L | 2.32 | 2.5 | L |
| M478T418 | 478.0874 | 6.96 | 478.0875 | 0.32 | [M–H]– | Glucoibarin | 3 | Glucosinolates | 2.50 | 2.3 | L | 1.77 | 1.9 | L |
| M463T497 | 463.0477 | 8.29 | 463.0481 | 0.97 | [M–H]– | 4-Hydroxyglucobrassicin | 3 | Glucosinolates | 3.17 | 2.2 | L | |||
| M447T498 | 447.0533 | 8.31 | 447.0532 | 0.31 | [M–H]– | Glucobrassicin | 3 | Glucosinolates | 1.83 | 1.4 | L | |||
| M492T520 | 492.1032 | 8.66 | 492.1032 | 0.09 | [M–H]– | Glucohirsutin | 2 | Glucosinolates | 2.58 | 2.6 | L | |||
| M422T569 | 422.0578 | 9.48 | 422.0579 | 0.37 | [M–H]– | Gluconasturtiin | 1 | Glucosinolates | 4.84 | 4.5 | L | 2.84 | 4.2 | L |
| M402T662 | 402.0889 | 11.03 | 402.0892 | 0.91 | [M–H]– | Hexyl glucosinolate | 2 | Glucosinolates | 1.78 | 1.9 | L | |||
| M477T728 | 477.0637 | 12.13 | 477.0638 | 0.19 | [M–H]– | 1-Methoxyglucobrassicin | 1 | Glucosinolates | 1.61 | 2.1 | L | |||
Error is calculated as follows:  . Calculated mass and m/z only show the data to the nearest four decimal points, whereas the error is calculated based on the actual data obtained.
Annotation level according to Sumner et al. (2007): 1, identified compounds with authentic standards; 2, compounds with putative annotations based on spectral similarity with spectral libraries; and 3, compound classes with putative annotations (i.e. compounds not fully characterized/identified). Empty cells indicate where metabolites were not detected under these conditions.
Another abundant metabolite class in Arabidopsis extracts was the glucosinolates (Brown et al., 2003). These included the known Phe-derived gluconasturtiin (2-phenethylglucosinolate), three indole-derived glucosinolates (4-hydroxyglucobrassicin, 1-methoxyglucobrassicin and glucobrassicin), and seven aliphatic glucosinolates (glucoiberin, glucoraphanin, glucoalyssin, glucohesperalin, glucoibarin, glucohirsutin, and hexyl glucosinolate or 4-methylpentyl glucosinolate; Supplemental Fig. S3B; Table I).
The extracts also contained several other known phenylpropanoid-derived metabolites, corresponding to monomeric or dimeric (lignan) phenylpropanoid metabolites (D’Auria and Gershenzon, 2005; Seneviratne et al., 2015). The former included three known malate-containing compounds (5-hydroxyferuloyl malate, sinapic acid malate ester, and sinapoyl malate) as well as three glycosides (coniferin, 1,2-di-O-sinapoyl-β-d-Glc, and sinapic acid glucoside; Supplemental Fig. S3C). The dimeric phenylpropanoids (lignans) included two known pinoresinol derivatives (pinoresinol-4,4ʹ-di-O-β-d-glucoside and pinoresinol-4-O-β-d-glucoside; Supplemental Fig. S3D; Seneviratne et al., 2015); however, there were four other putative lignans detected (Table I; Supplemental Tables S1 and S2). These were generically annotated as lignan glucosides (Table I), but with no precise structure being determined due to the lack of sufficient material for unambiguous structure determination.
Three putative galactolipids also were detected. These were annotated previously in Arabidopsis (Glauser et al., 2008), based on comparison of high-resolution tandem mass spectrometry (MS/MS) spectra, as sn1-O-(12-oxophytodienoyl)-monogalactosyl monoglyceride, sn1-O-(12-oxophytodienoyl)-digalactosyl monoglyceride, and sn2-O-(di-nor-oxophytodienoyl)-monogalactosyl monoglyceride (Supplemental Fig. S3E; Table I).
Finally, three putative phenolic glucosides were detected, including one hydroxybenzoic acid glucopyranoside and two isomers of dihydroxybenzoic acid-O-pentoside (Table I).
Quadruple, Triple, and Double ADT Knockouts
Statistical comparison of individual metabolite levels in adt3/4/5/6, the most greatly affected mutant line, versus the wild type can be found in Table I. For the flavonoids mentioned above, significant changes in levels were observed in adt3/4/5/6, with reductions of ∼40% and ∼30% in NA and DA plants compared with wild-type plants. Compared with levels in the wild type, the adt1/4/5 and adt3/4/5 triple knockouts also had very similar flavonoid reductions of ∼40% and ∼26% in NA and DA plants, whereas the double knockout adt4/5 had smaller flavonoid reductions of ∼17% (Fig. 6A). By comparison, under these growth conditions, the flavonoid reduction levels in adt3/4/5/6 were just over half of those observed for long-day-grown plant lines.
Figure 6.

Metabolite contents in DA and NA wild-type (WT) and ADT mutant plants. A, Flavonoids. B, Phenylpropanoids. C, Lignan glucosides. D, Phenolic glucosides. E, Glucosinolates. F, Gluconasturtiin. G, Putative galactolipids. All values are relative to the internal standard naringenin. *, 0.01 < P ≤ 0.05; **, P ≤ 0.01.
Monomeric phenylpropanoid and lignan contents followed somewhat comparable trends, with multiple ADT knockouts having the most pronounced effects (Fig. 6, B and C, respectively). For the monomeric phenylpropanoids, their amounts in triple and quadruple knockouts were reduced by ∼25% and ∼20% in NA and DA plants, respectively, relative to that in the wild type. A slightly lesser effect (i.e. a reduction of ∼12%) was observed in adt4/5. Lignans displayed a similar pattern, with highest reductions in triple and quadruple knockout lines, reaching reductions of ∼64% to 68% and ∼58% to 67% in NA and DA plants, respectively. In adt4/5, slightly lower reductions of ∼58% were observed for NA plants and 55% for DA plants.
Significant differences were observed in levels of other metabolite classes not derived directly from Phe. Putative phenolic glucoside levels were reduced significantly (Fig. 6D), reaching reductions of ∼31% and ∼44% for NA and DA adt3/4/5/6 plants, respectively, relative to that in the wild type. In addition, the triple knockout adt1/4/5 had reductions of ∼21% and ∼40% for NA and DA plants, respectively, whereas adt3/4/5 displayed reductions of ∼35% for both NA and DA plants. The double knockout adt4/5 had a somewhat smaller reduction in phenolic glucosides of ∼28%.
Another striking observation was with the levels of the 11 glucosinolates that were detected at significantly lower levels in ADT knockouts relative to the wild type (Fig. 6, E and F). Of these, the reduction in levels of gluconasturtiin (Fig. 6F) could be anticipated, since it is partly derived from Phe (Underhill, 1968). Indeed, its levels were very much affected, reaching reductions of ∼77% in both NA and DA adt3/4/5/6 plants. The triple knockout adt3/4/5 also had ∼77% and ∼58% reductions in NA and DA plants, respectively, whereas adt1/4/5 had ∼65% and ∼70% reductions, relative to the wild type. The double knockout adt4/5 additionally displayed some levels of reduction, albeit to a slightly lesser extent, with reductions of ∼54% and ∼60% in NA and DA plants, respectively.
Although less pronounced, significant overall reductions in the levels of all other glucosinolates also were detected (Fig. 6E), with ∼39% and ∼42% reductions in adt3/4/5/6 NA and DA plants and ∼36%/∼31%, and ∼27%/∼16% reductions in adt1/4/5 and adt3/4/5 NA and DA plants, respectively. The double mutant adt4/5 displayed a reduction of ∼37% in total glucosinolate in DA plants, but no significant reduction (∼6%) was observed in NA plants (Fig. 6E).
We also detected several metabolites with significantly higher levels in ADT-deficient plant lines. Of these, we annotated three putative galactolipids that were presumed to be abundant in the thylakoid membrane and that could be related to altered photosynthetic parameters (Kobayashi et al., 2013). The relative amounts of these compounds displayed a clear circadian rhythm pattern (i.e. barely detectable in DA plants versus significantly higher contents in NA plants; Fig. 6G). Besides that, their contents in NA plants also were affected significantly by changes in ADT, with levels increasing further from single to multiple knockouts. Of these, the most markedly altered were those in adt3/4/5/6 plants, where the amounts detected were approximately double the content observed in wild-type plants.
Single Knockouts
While multiple knockout lines had the most dramatic effects in reductions in levels of most metabolites detected, the single knockouts had differing effects for different metabolite classes. For combined total flavonoid levels (also for each individually), adt1 had the most pronounced reductions in comparison with the wild type (∼30% change [P = 0.016] and ∼20% [P = 0.006] in NA and DA plants, respectively) of the various single knockout lines (Fig. 6A; Supplemental Table S1). Monomeric phenylpropanoid levels followed the same trend somewhat, with the adt1 line also having highest reductions in comparison with the wild type (∼30% [P = 0.003] and ∼10% [P = 0.02] in NA and DA plants, respectively; Fig. 6B; Supplemental Table S1). Lignan content, however, was not affected significantly in any single knockout line in comparison with wild-type plants (Fig. 6C; Supplemental Table S1).
In contrast, phenolic glucoside levels in single knockouts were reduced more significantly in adt4 and adt5 plants in comparison with wild-type plants, with ∼35% (P = 0.01) and 25% (P = 0.02) reductions, respectively, in NA plants and ∼28% (P = 0.05 for adt4 plants and P = 0.03 for adt5 plants) reductions in DA plants (Fig. 6D; Supplemental Table S1). While in the adt1 plants, no significant differences were observed in phenolic glucoside contents in NA plants, the DA plants had a significant (P = 0.014) level of reduction (∼40%). On the other hand, adt3 plant lines were not significantly different from the wild type.
Glucosinolate levels in NA plants were mainly significantly different in the comparison of adt4 and adt5 with wild-type lines, with reductions of ∼36% (P = 0.0001) and 26% (P = 0.02), whereas the corresponding DA plants had greater reductions of ∼52% (P = 0.01) and ∼47% (P = 0.03), respectively (Fig. 6E; Supplemental Table S1).
Finally, for putative galactolipid levels, the adt4 line potentially had the second highest increase among all lines relative to wild-type levels (∼60%), although this was not statistically significant due to the variability observed (P = 0.115; Fig. 6G; Supplemental Table S1).
A group of molecules with masses consistent with molecular structures having 19 carbon atoms and eight oxygen atoms also were detected at higher levels in ADT knockouts relative to the wild type. We provisionally postulate that they belong to the apocarotenoid metabolite class (Matsunami et al., 2009) and perhaps may have a direct relationship with the photosynthetic effects observed (i.e. given carotenoid roles in light harvesting and photoprotection, as hormones and growth regulators, and in other environmental interactions; Ruiz-Sola and Rodríguez-Concepción, 2012). The unequivocal annotation of these compounds requires a complete structural characterization that was not possible here due to their low abundance.
Metabolic Analysis of Rosette Leaves (44 DAS)
The analysis of leaves of DA wild-type and adt3/4/5/6 plants, harvested 44 DAS, showed comparable trends to those at 70 DAS. When compared with DA wild-type plants, DA adt3/4/5/6 plants at 44 DAS showed significant (P < 0.01) decreases in levels of the lignan glucosides M565T765, M521T765, and M519T836 (for compound names, see Table I) by ∼34%, 63%, and 57%, respectively; the corresponding DA plants at 70 DAS had ∼58 to ∼67% reductions. We also detected reduced levels of the monomeric phenylpropanoids M385T589, M339T796, and M339T808 by ∼40%, 24%, and 18%, respectively, but the first with P < 0.05 only; DA plants at 70 DAS had ∼20% reductions. Flavonoids were decreased slightly in amounts: M739T610 and M593T713 by ∼7% and ∼17%, respectively, compared with ∼30% in DA plants at 70 DAS. As before, we observed increases in the levels of putative galactolipids (M545T1236, M735T1343, and M573T1455 by ∼25%, 24%, and 13%, respectively), which correspond favorably to those in DA plants at 70 DAS.
RTAM-MS of CO2
From our starch measurements, we discovered that starch accumulation in adt3/4/5/6 was higher in DA plants than in the wild type (Fig. 3A), and this was inversely correlated to linear electron flux (Fig. 7). Thus, we further investigated whether there was also a significant difference in respiration rate of net carbon fixation in relation to the different starch levels observed. To do this, we measured CO2 absorption and release rates in adt3/4/5/6 and wild-type plants with large starch reserves (DA) or in plants depleted of starch (NA). A real-time atmospheric mass spectrometer was used to measure CO2 levels of wild-type and adt3/4/5/6 plants under both DA and NA conditions. The DA and NA plants were then subjected to a period of dark or light in order to observe whether there was a differential rate of respiration or carbon fixation between the wild type and adt3/4/5/6.
Figure 7.

Relationship between starch content and ΦII in wild-type (WT) and ADT mutant plants. A, Starch content (red outlined bars, right axis) and ΦII (gray bars) of the various genotypes. The red horizontal line indicates wild-type values for comparison. B, Linear correlation between starch content and ΦII. All data are means ± se.
Figure 8 shows the median CO2 levels fixed by wild-type and adt3/4/5/6 plants under NA and DA conditions. For NA plants, the wild type and adt3/4/5/6, when exposed initially to light, presumably begin to fix CO2, but this initial rate of CO2 uptake appears to not yet be at a level to offset night time respiration rates. These measurements occurred 50 min after the light change, and all photosynthetic and respiration machinery may not be fully switched over yet between light and dark conditions, which could explain the negative CO2 uptake. Whereas adt3/4/5/6 plants seemed to have a higher CO2 uptake rate than wild-type plants at the time point measured, a Student’s t test performed between the two groups of measurements indicated no significant difference (P = 0.20). In plants that have high levels of accumulated starch (DA conditions) and that are subjected to the dark when respiration pathways would dominate, there appeared to be a higher rate of respiration in adt3/4/5/6 compared with the wild type, but this increased rate also was not statistically significant.
Figure 8.

CO2 levels in wild-type (WT) and adt3/4/5/6 plants following the depletion (NA) or accumulation (DA) of starch reserves. Measurements were made after a steady-state adjustment period of 50 min in the dark (for DA plants) and 50 min in the light (for NA plants). Data are means ± se. No significant differences exist between wild-type and adt3/4/5/6 values (Student’s t test, P = 0.194 and 0.993 for the NA and DA data sets, respectively).
DISCUSSION
Plant Growth/Development, Photosynthetic Performance, ATP, and Carbon Sinks
Our high-throughput phenomics platform (Figs. 1 and 2) allowed the detection of small but significant changes in physiological parameters and photosynthetic performance. The analysis of PET showed significantly decreased rates for linear electron flux, measured as ΦII, in the ADT mutants relative to the wild-type plants (Figs. 2B and 4A). Detailed analysis of this PET reduction revealed that it resulted from an elevated qE (Figs. 2C and 4B), which causes heat dissipation of the harvested sunlight no longer available for photosynthesis. Further analyses indicated that the increased qE in adt3/4/5/6 resulted from a higher ΔpH across the thylakoid membrane, as measured by ECS (Fig. 5B).
Our data also indicated that transitory starch in chloroplasts could serve, at least in part, as an alternative carbon sink in ADT-deficient plants. That is, in the adt3/4/5/6 knockout, the starch content was increased by more than 60% in DA plants and all other knockouts also had elevated starch contents even after 70 DAS (Fig. 7A). Furthermore, comparing starch contents (Fig. 3A) with secondary metabolite data (Fig. 3, B–E) revealed an inverse relationship that provisionally suggested the redirection of fixed carbon from phenylpropanoid metabolites into starch. Yet, the growth curve for adt3/4/5/6 (Fig. 2A) also indicated that additional carbon used from transitory starch reserves in the night was not utilized to increase plant growth in the mutant. In fact, growth was retarded slightly in the quadruple mutant as compared with wild-type plants. This could be interpreted as an indication that the excess carbon/energy (i.e. by reduced metabolism into phenylpropanoid metabolites/lignins) was not used for enhanced plant growth. Indeed, the carbon stored was transitory, as the starch was fully metabolized when photosynthesis was shut down in the NA period (Fig. 3A, left). Where this catabolized fixed carbon ends up is currently unknown.
A potential direct connection between secondary metabolism produced by carbon processing through ADT and photosynthesis is ATP. Metabolic pathways leading to lignin and other phenylpropanoids utilize considerable amounts of ATP (Lewis and Yamamoto, 1989). It is not clear, however, whether this ATP comes from respiration, photosynthesis, or both. Yet, with the ADT-catalyzed conversion of arogenate to Phe being localized in the chloroplast, it is possible that ATP produced by photosynthetic light reactions makes a major contribution. Increased starch content is in line with an expected reduction in the putative ATP consumption in ADT knockouts (i.e. since starch synthesis requires ATP; Geigenberger et al., 2005). Thus, it seems that the transient accumulation of starch could be related to the diminished level of ATP required for phenylpropanoid metabolism and lignin biosynthesis in ADT knockouts.
The photosynthetic performance measurements of adt3/4/5/6 also indicated that starch synthesis only partly compensated for the reduced demand for ATP consumption. This became apparent by analyzing the correlation between starch contents and linear electron transport (measured as ΦII) for the wild type and all ADT knockouts (Fig. 7B). Higher starch accumulation in the different knockouts was accompanied by a lower linear photosynthetic electron flux. This suggests a limited consumption of extra ATP produced in the mutants by the formation of transitory starch with feedback to electron transport by an increased PMF (Fig. 5). The quadruple mutant, though, still has higher ATP levels, as indicated by elevated ΔpH that leads to higher qE and lower electron flux and the elevated ATP/ADP ratio. In this way, reduced phenylpropanoid biosynthesis can be envisaged to have two interconnected consequences for photosynthesis: (1) reduced consumption of fixed carbon by the Calvin-Benson cycle, leading to an increase in transitory starch; and (2) lowered consumption of ATP, leading to slightly lower electron transport rates via an increase in the feedback regulation of qE.
Metabolomics
As anticipated, some of the most marked effects observed at the end of the photosynthetic measurement period were the reductions in levels of metabolites derived directly from Phe (i.e. flavonoids, monomeric phenylpropanoids, and lignans). In contrast, the levels of the phytohormones salicylic acid and jasmonic acid were below detection limits under the conditions employed (data not shown). For those metabolite classes detected, the largest reductions were observed in the multiple ADT knockout mutants, whereas the smallest reductions were associated with single knockouts (i.e. adt1, adt3, adt4, and adt5).
More specifically, in the quadruple knockout adt3/4/5/6, levels of the Phe-derived lignans (Figs. 3D and 6C) and gluconasturtiin (Fig. 6F) were most affected (∼67% and ∼77% reductions, respectively), which was comparable to the lignin content reductions of ∼70% in adt3/4/5/6 plants under long-day growth/development (Corea et al., 2012). By contrast, compared with those in the wild type, Phe-derived flavonoid (Figs. 3B and 6A) and phenolic glucoside (Figs. 3E and 6D), as well as overall glucosinolate (Fig. 6E), levels in adt3/4/5/6 were reduced by only ∼30% to ∼45%, and those of phenylpropanoids (Figs. 3C and 6B) were reduced by only by 25%.
Nevertheless, under short-day growth conditions, the knockout of individual ADT genes led to somewhat different outcomes than those observed for lignin contents in long-day-grown plants (Corea et al., 2012). Specifically, the adt1 knockout displayed the greatest reduction in levels of metabolites derived directly from Phe, especially for monomeric phenylpropanoids and flavonoids. Conversely, lignin contents under long-day growth/development were reduced the most in adt5, whereas there was no detectable effect on lignin contents in adt1 plants (Corea et al., 2012). Additionally, glucosinolate levels were most reduced in adt4 (Fig. 6E), whereas they had no reduction in lignin contents (Corea et al., 2012). These data apparently suggest quite a distinct role in metabolic pathway carbon allocation and could indicate a specific role for ADT4 in, for example, gluconasturtiin biosynthesis.
Although the reduction in Phe-derived gluconasturtiin content described above was expected, the reductions in the levels of other glucosinolates were striking. That is, partial blockage of Phe biosynthesis also led to reduced levels of glucosinolates that are biosynthetically independent of Phe. This pleiotropic effect (i.e. when one gene influences two or more seemingly unrelated phenotypic traits) is nevertheless consistent with previous research suggesting possible cross talk between glucosinolate and phenylpropanoid biosynthetic pathways (Hemm et al., 2003; Kim et al., 2015; Mach, 2015). Furthermore, this class of Brassicaceae metabolites (Matthäus and Luftmann, 2000), characteristic of Arabidopsis, is used as defense compounds and has long been linked directly to responses to wounding and insect herbivory. Their effectiveness is due to the release of toxic isothiocyanates (Grubb and Abel, 2006; Halkier and Gershenzon, 2006; Beekwilder et al., 2008). Clearly, a reduction in the levels of both phenylpropanoids and glucosinolates could potentially lessen overall chemical defenses of ADT-deficient plants, thus causing negative effects regarding fitness.
Lastly, the global metabolomics analysis of leaf tissue extracts from the various ADT mutants and the wild type, initially used for the selection of metabolites of interest, is revisited by focusing on the annotated compounds among the hundreds of significantly altered features (Supplemental Table S1). HCA (Fig. 9A) and PLSDA (Fig. 9B) analyses can be presented in a form that provides a comprehensive view of the data, clearly illustrating the trends observed. In this regard, HCA groups features that are based on trends across samples, with above-average features in red and below-average features in green. In Figure 9A, we can clearly observe two main groups of opposite behavior, namely those that accumulate to lower levels in ADT knockout lines and those that accumulate to higher amounts. The first and largest group contains flavonoids, phenylpropanoids, lignans, phenolic glucosides, and glucosinolates. The second group consists of the putative apocarotenoid compounds that are present in higher amounts in the knockout lines and the putative galactolipids, with the latter subject to a pronounced circadian rhythm effect (Fig. 6G). The PLSDA analysis simplifies multiple variables (features) into two orthogonal components that clearly distinguish between the wild type and adt3/4/5/6 and between DA and NA plants (Fig. 9B). In this analysis, we can see not only separation of the different groups of samples but, with the overlaid loadings for the different annotated metabolites, we can also rapidly visualize those metabolites that are characteristic of the different lines and harvest times. The strongest effect is in the separation of the wild type and adt3/4/5/6, with the Phe-derived compounds, phenolic glucosides, and glucosinolates being characteristic of the wild type and galactolipids and putative apocarotenoids associated with adt3/4/5/6.
Figure 9.

Metabolite profiling in the wild type (WT) and ADT mutants. A, Metabolite heat map generated using MeV version 4.8 from data normalized using naringenin as an internal standard and transformed to have zero mean and unit variance. The heat map displays major trends observed in the levels of annotated metabolites, with clustering based on feature intensity patterns across samples. B, PLSDA analysis of wild-type and adt3/4/5/6 DA and NA plants based on annotated metabolites, with clear separation of sample groups and time of harvest. The loadings show those metabolic features that are more characteristic of the sample groups.
Carbon Fixation and Respiration Rates
Our data show higher levels of starch accumulation but do not show significantly higher rates of carbon fixation in Arabidopsis plants with compromised ADT activity. This corroborates the additional observation that we do not see overall significant biomass differences between wild-type and adt3/4/5/6 plants. Photorespiration is typically thought of as a mechanism for a plant to mitigate the accidental fixation of oxygen instead of CO2. Our data (Fig. 8), however, show no significant difference in the rates of overall CO2 release between the wild type and adt3/4/5/6. Since we only detected the overall net release of CO2 from the plant, we cannot determine whether this CO2 came from respiration or photorespiration. Future RTAM-MS focusing on oxygen uptake flux analysis, such as using 18O2, may be an interesting extension of this study to see if any utilization of starch accumulation results in significant variations in photorespiration rates in the wild type compared with adt3/4/5/6.
CONCLUSION
Our high-throughput phenomics approach allowed us to visualize small changes in photosynthetic and growth performance in ADT knockouts. The data established that reduced metabolism through Phe, leading to reductions in the levels of various phenylpropanoids and other metabolites, has a moderate impact on PET that is most likely caused by impaired recycling of ADP + Pi.
Additionally, the metabolomic analysis significantly increased our understanding of the effects of ADT modulation in Arabidopsis, as partial blockage of this crucial biosynthetic pathway has significant and widespread metabolic effects. We established significant reductions in the contents of several phenylpropanoid-derived metabolites, including flavonoids, lignans, and glucosinolates, at both harvesting points (44 and 70 DAS). Our metabolomic analysis also revealed a number of systemic pleiotropic effects of the genetic manipulations. These effects included reductions in glucosinolate and phenolic glucoside contents, with related increases in the levels of putative galactolipids and apocarotenoids.
The small impairment of photosynthetic energy conversion, however, indicates that the metabolic engineering of lignin biosynthesis and phenylpropanoid metabolism demonstrated here could be a viable strategy to improve, for example, biofuel crops. Examples exist where only small changes in photosynthetic performance visible under controlled greenhouse conditions translate to much more pronounced effects in field-grown plants (Lawson et al., 2012). A good example is the PsbS knockout mutant (impaired in qE) that displays a similar electron transport rate in the laboratory but significantly reduced fitness under field conditions (Külheim et al., 2002). Thus, the small changes measured in this study may have greater effects in field conditions. This highlights the need in future studies to assess changes in physiological parameters under both greenhouse and field conditions and to determine to what extent, if any, plant fitness is compromised. The results of this study show that engineering one pathway alone may not be sufficient to improve certain traits. In particular, further improvements of ATP consumption can be a follow-up approach to make ADT mutants an interesting model for the improvement of, for example, biofuel conversion efficiencies.
MATERIALS AND METHODS
Chemicals
Optima-grade water, acetonitrile, and formic acid were purchased from Fisher Scientific. Quercetin-3-glucoside-7-rhamnoside, quercetin-3-glucoside-2ʹʹ-rhamnoside-7-rhamnoside, kaempferol-3-glucoside-7-rhamnoside, kaempferol-3-glucoside-2ʹʹ-rhamnoside-7-rhamnoside, kaempferol-3,7-dirhamnoside, coniferin, sinapic acid glucoside, sinapoyl malate, pinoresinol-4,4ʹ-di-O-β-d-glucoside, and pinoresinol-4-O-β-d-glucoside were isolated and identified by comparison with authentic standards isolated previously by our group. The glucosinolates glucoraphanin, gluconasturtiin, and 1-methoxyglucobrassicin were identified by comparison with authentic standards kindly provided by Dr. Daniel Giddings Vassão.
Plant Growth and Measurements in the Phenomics Facility
Wild-type Arabidopsis (Arabidopsis thaliana ecotype Columbia) and mutants (adt1, adt3, adt4, adt5, adt4/5, adt1/4/5, adt3/4/5, and adt3/4/5/6, generated as described [Corea et al., 2012]) were sown and grown in a growth chamber for 20 d and then moved to the phenomics facility. Plants were grown in eight to 12 blocks in four independent sets (Fig. 1, A–C), with each set having a randomized arrangement of genotypes per block. They were monitored in the phenomics facility for 15 to 30 d after being transferred. Both chambers utilized a 9-h photoperiod at 200 μmol quanta m–2 s–1 illumination, with daily temperatures of 23°C/21°C (light/dark). Measurements were performed daily, once in the middle of the photoperiod (day) and once in the middle of the dark period (night). Measurements were taken by utilizing a movable camera unit, the Fluorcam XYZ (PSI). This instrument is a mobile, programmable fluorescence imaging robot capable of moving throughout the growth chamber on a gantry, performing automated measurements utilizing blue (455 nm) and red (618 nm) LEDs to excite fluorescence, with a light intensity of 200 μmol quanta m2 s–1. Fluorescence was captured by a Fluorcam 2701 LU camera equipped with a fluorescence filter. The software then automatically calculates and exports many parameters, such as Fv/Fm (maximum quantum efficiency of PSII photochemistry), ΦII, NPQ, qE, and qL (fraction of open PSII reaction centers; i.e. with reduced primary quinone acceptor QA) according to the following formulae:
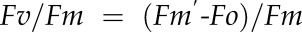
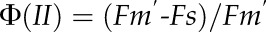


where Fm and Fm′ are maximal fluorescence from NA and DA leaf, respectively; Fm′′ is the maximal fluorescence in the dark after illumination; Fo and Fo′ are minimal fluorescence from NA and DA leaf, respectively; and Fs is steady-state fluorescence emission from DA leaf.
DA measurements of photosynthetic parameters were done at the middle of the light period. The camera carrier moved over the plants with carrier lights on that matches the light intensity in the growth room. Thus, plants were illuminated all the time. For the NA samples, we used a standard protocol of 3 min that includes Fm measurements. After 3 min of illumination, photosynthetic parameters do not change significantly (i.e. a steady state is reached).
Measurements in the Flash Spectrometer
Flash spectrometry measurements were performed in a laboratory setting on wild-type and knockout plants grown in the phenomics facility and harvested 6 weeks after sowing. Plants were adapted to each of the six different light intensities of 70, 120, 200, 300, 500, and 850 μmol quanta m–2 s–1 and then measured using a DIRK approach. DIRK is used to quantify steady-state electron fluxes through photosynthesis in light-adapted samples by analyzing the kinetics of the relaxation of spectroscopic signals (Sacksteder and Kramer, 2000). This relaxation of spectroscopic signals occurs during short dark intervals that are achieved by shuttering off the actinic light (Sacksteder and Kramer, 2000).
Minimum fluorescence was determined for 2 s at 2 μmol quanta m–2 s–1, and Fm and Fm′ were determined with a 0.6-s light pulse at 2,000 μmol quanta m–2 s–1. The photosynthetic parameters ΦII and NPQ were calculated as above.
For ECS measurements, plants were preilluminated for 10 min at 100 μmol quanta m–2 s–1 and then adapted for 2 min to six light intensities (70, 120, 200, 300, 500, and 850 μmol quanta m–2 s–1). For each light intensity, the ECS was measured as absorption change at 520 nm (Witt, 1979; Bailleul et al., 2010). The maximal ECS amplitude (reflecting the maximal PFM) was determined as the difference of the 520-nm absorption signal in the light minus the 520-nm signal in the subsequent dark pulse (arrow in Fig. 5A). This was repeated for all light intensities (Fig. 5). ECS measurements were tested in the direction of increasing light intensity followed directly by decreasing light intensities. As no hysteresis effect was apparent between both directions, measurements were performed with decreasing light intensities for all genotypes.
ATP and ADP Determination
Wild-type and adt3/4/5/6 mutant plants were dark adapted overnight or taken from the phenomics facility after 6 h of illumination. Ten leaf discs (with 45.6 mm2 surface area) were harvested from DA and NA plants, pooled in one e-cup, and shock frozen immediately in liquid N2. Each harvested and frozen plant material was homogenized in the TissueLyserII (Qiagen) before the addition of 200 μL of ATP or ADP buffer of the ATP/ADP calorimetric assay kit (BioVision). Samples were individually sonicated with a Sonicator Microtip (Sonicator S 4000; Branso) for 3 × 30 s (at 30–50 J) to ensure complete extraction of the aqueous phase from the leaf discs. After centrifugation, an aliquot (30 μL) of each supernatant was added to 40 μL of ATP or ADP buffer and mixed with 50 μL of the reaction mix from either the ATP or ADP kit. The reaction mix contained either the ATP or ADP probe, ATP or ADP converter, and ATP or ADP developer (BioVision). After 30 min of incubation at room temperature in the dark, each absorption was measured at 570 and 600 nm to account for the chlorophyll signal. Subtraction of the chlorophyll signal at 600 nm led to the corrected absorption value at 570 nm that was used for the calculation of ADP or ATP amount (nmol) using the respective ADP or ATP calibration curve. The calibration curve for ATP was generated using 0, 0.5, 1, 1.5, and 2 nmol final concentration of the ATP standard. The calibration curve for ADP was generated using 0, 0.5, 1, 1.5, 2, 4, 6, and 8 nmol final concentration of the ADP standard. Data were averaged from six to eight biological replicates per genotype.
Plant Harvesting and Metabolite Extraction
Two sets of Arabidopsis plants were subjected to metabolomics analyses, one at 44 DAS and the second at 70 DAS, where, in each case, leaf tissues from nine individual plants of each genotype were collected, at the end of the light (DA) and dark (NA) periods, respectively, and frozen immediately in liquid nitrogen. Samples were then freeze dried and kept at −80°C until subjected to solvent extraction. Freeze-dried samples were weighed (∼14–23 mg) and individually ground to fine powder using the TissueLyserII (Qiagen) for 30 s at a frequency of 30 Hz. Methanol:water (70:30, v/v) containing 0.05 mm naringenin (Aldrich) as an internal standard was individually added at a ratio of 1 mL to 50 mg of tissue powder. Samples were vortexed for a few seconds, sonicated at room temperature for 10 min, vortexed again, and finally centrifuged at 16,000g (4°C for 15 min). Supernatants were individually transferred to 1.5-mL screw-cap glass vials and stored at −80°C until analysis. The pellets in each case also were stored at −80°C prior to starch analysis.
UPLC-qTOF-MS Analysis
Metabolite analyses were performed using a Waters Acquity Ultra Performance LC system (Waters) equipped with a photodiode array eλ detector (Waters) and coupled to a Xevo G2 QTOF mass spectrometer (Waters MS Technologies) using MassLynx (version 4.1) software. Separation of metabolites was performed using a BEH C18 column (Waters; 100 × 2.1 mm i.d., 1.7 µm particle size). The mobile phase consisted of 0.1% (v/v) formic acid in water (phase A) and 0.1% (v/v) formic acid in acetonitrile (phase B). The linear gradient program was as follows: 100% A over 0.5 min, 0% to 45% (v/v) B over 25 min, 45% to 100% (v/v) B over 1 min, held at 100% B for a further 3.5 min, then returned to the initial conditions (100% A) in 0.5 min, followed by reconditioning at 100% A for 10 min. The flow rate was 0.2 mL min−1, with column temperature kept at 25°C and samples at 5°C. Spectra were recorded between 200 and 500 nm with a resolution of 1.2 nm. The masses of eluted compounds were detected using an electrospray ionization source in the negative ion mode. The following settings were applied: capillary voltage at 2.2 kV, cone voltage at 20 eV, and collision energy at 6 and 30 eV; argon was used as the collision gas. For LC-MS/MS analyses (Supplemental Table S2), 5- to 50-, 30-, and 30- to 60-eV collision energies were used. The m/z range was 50 to 1,000 D. The mass spectrometer was calibrated using sodium formate, and Leu enkephalin was employed as the lock mass. The injection volume was 2 μL for LC-MS analysis and 4 μL for LC-MS/MS.
Metabolomics Data Processing
Chromatograms obtained from UPLC-photodiode array-qTOF-MS analysis were inspected visually in MassLynx software (Waters) with obvious outliers excluded. In order to conduct subsequent data processing, .RAW data files were converted to NetCDF using MassLynx’s Databridge software. NetCDF files were then processed in RStudio (version 0.9.332) using the package XCMS (Smith et al., 2006; https://xcmsonline.scripps.edu) for feature (unique mass/retention time signals, MxxxTxxx) detection and retention time correction, followed by the CAMERA package (Kuhl et al., 2012; https://bioconductor.org/packages/release/bioc/html/CAMERA.html) for features grouping together and for partial annotation. XCMS-based feature detection and integration were performed using the Centwave method (Tautenhahn et al., 2008) with the following parameters: prefilter = c(0,0), snthr = 2, ppm = 15, peakwidth = c(5,20), and nSlaves = 4. Retention time correction was performed twice via the obiwarp method with the following parameters: bw = 2, minfrac = 0.5, mzwid = 0.015, and plottype = c(‘deviation’). The CAMERA package was used with the following parameters: perfwhm = 0.6 and groupCorr, findIsotopes, and findAdducts with polarity = ‘negative’.
Pairwise comparison in XCMS was conducted after setting the two groups, one including all wild-type samples (both DA and NA) and one including all mutant line samples (both DA and NA). After initial XCMS and CAMERA processing, TSV and CSV files generated were combined and further analyzed manually (Supplemental Table S1). Feature lists were normalized to the internal standard naringenin (integrated in XCMS results as feature M271T1196, Rt 19.93, m/z 271.0608 [calculated 271.0606 for C15H11O5]) for statistical analysis. Comparisons between the wild type and adt3/4/5/6 (either from DA or NA plants) were performed separately for the selection of statistically significant features subjected to annotation efforts. Box plots were made using Excel with the following results obtained: P value (−log10 [P]) and fold change for pairwise comparison between the wild type and each ADT mutant (NA and DA) and for NA versus DA in the wild type and each ADT mutant (Supplemental Table S1). For HCA and PLSDA, data were transformed to zero mean and unit variance. The annotated features (after the removal of isotopes, adducts, and fragments) were imported to MeV version 4.8 and subsequently clustered using the following settings for hierarchical clustering: tree selection = gene tree, ordering optimization = optimize gene leaf order, distance metric selection = optimize gene leaf order, linkage method selection = average linkage clustering. PLSDA of NA_wild type, DA_wild type, NA_adt3/4/5/6, and DA_adt3/4/5/6 was performed using DeviumWeb (version 0.4; Grapov, 2014).
Metabolite Identification and Annotation
Information obtained from computational processing was used as a starting point for manual peak identification. Metabolites were then identified by comparison with standard compounds of their retention time, UV spectra, and MS/MS fragmentation. Other metabolites were putatively annotated using the following two approaches: (1) putative molecular formulae calculated from accurate mass and isotopic pattern recognition were used to screen the Metlin (https://metlin.scripps.edu/index.php) and SciFinder Scholar (SciFinder Scholar 20##, https://scifinder.cas.org/scifinder/login.jsf) metabolite databases as well as other sources, including KEGG (http://www.genome.jp/kegg/pathway.html) and the Plant Metabolic Network (http://www.plantcyc.org/) databases; and (2) MS/MS fragmentation of metabolites (Supplemental Table S2) was compared with candidate molecules found in databases (ReSpect for Phytochemicals [http://spectra.psc.riken.jp/] and Massbank [http://www.massbank.jp/]) and verified with earlier literature, especially for metabolites reported previously in Arabidopsis.
Starch Quantification
Following the extract preparation for metabolomic analyses above, the corresponding pellets were individually subjected to starch quantification. Each pellet sample was next washed three times with 1 mL of ethanol: water (80:20, v/v) with sonication at room temperature, followed by centrifugation at 16,000g, with solvent discarded. A 0.2 n potassium hydroxide solution in water was then added to each sample at a ratio of 1 mL to 40 mg of sample (i.e. the freeze-dried plant material, prior to metabolite extraction), and gelatinization was conducted at 85°C for 45 min. After cooling down to room temperature, acetic acid (1 n) was added for neutralization at a ratio of 0.2 mL to 40 mg of sample (as above), and samples were individually vortexed and centrifuged at 16,000g and 25°C for 15 min. Amyloglucosidase solution (A-1602; Sigma) was prepared at 100 units mL–1, and digestion proceeded by adding the solution (40 μL) to each supernatant (60 μL) and incubating for 15 min at 60°C in a shaking water bath. Acetonitrile (100 μL) was added immediately to each sample after digestion. Finally, samples were vortexed and centrifuged at 16,000g at 4°C for 15 min. Supernatants (180 μL) and 10 mg mL–1 Xyl solution (20 μL) were transferred into screw-cap glass vials and analyzed.
Released Glc was quantified using an HPLC device (2695; Waters) coupled to an evaporative light-scattering detector (2424; Waters) equipped with a Supercosil LC-NH column (250 × 4.6 mm i.d., 5 µm; Supelco). The mobile phase consisted of acetonitrile: water (75:25, v/v), the flow rate was 0.5 mL min−1, with nebulizer temperature of 70°C and N2 pressure at 50 p.s.i. The injection volume was 5 μL. Xyl in each sample solution was used as an internal standard. By using isocratic elution, Xyl and Glc were resolved and eluted at 11.2 and 13.6 min, respectively. A control recovery test was performed using starch standard powder (S5296; Sigma), giving 100% ± 10% recovery. Calibration curves for Glc exhibited good polynomial expression, with correlation coefficients of 0.9993 (0.125–0.5 mg mL–1) to 0.9985 (0.5–1.5 mg mL–1). A standard solution containing 1 mg mL–1 Xyl and 0 to 2 mg mL–1 Glc was used (5-μL injection volume) to monitor the evaporative light-scattering detection reproducibility throughout the runs.
RTAM-MS of CO2
Wild-type and adt3/4/5/6 plants (56 DAS) were placed in an in-house-built isolation/exposure chamber (Supplemental Fig. S4) and were sealed. The chamber was made of clear polycarbonate for light penetration and was modified with three Swagelock connection ports in the lid to allow air flow in and to control air/gas flow to a vacuum or to a Shimadzu QP2010 single quad mass spectrometer with an electron-impact source for analysis. NA plants were kept in the dark for 12 h to consume all starch reserves, and DA plants were kept in the light for 12 h within an environmental growth chamber to allow for starch accumulation. A flow rate of 200 mL min–1 was used to initially purge the chamber and to maintain a constant atmospheric CO2 level throughout each plant acclimation period. The mass spectrometer was calibrated by running a series of volumetrically prepared CO2 standards. Data acquisition began with the analysis of just the room air CO2 concentration for 15 min, then a valve was switched and the plants that had acclimated for 12 h in either the light (DA) or dark (NA) were analyzed by measuring the air that passes around the plant and that enters the mass spectrometer. The flow rate of this analysis was set at 2 mL min–1 CO2 concentration and was monitored over 30 min to allow the CO2 concentration measurement to stabilize and arrive at a steady state. The average concentration at the last 5 min of the 30-min period was used to calculate the total CO2 concentration of the air plus what was released or fixed by the plant. Then, the light was either turned on for the NA plants or turned off for the DA plants, and the CO2 concentration was allowed to stabilize and reach a steady state for another 50 min. The last 5 min of this period was used to determine the CO2 released or absorbed under light or dark conditions in plants depleted of starch (NA) or in which starch accumulated (DA). After analysis, the aboveground portion of the plant was dried and weighed to normalize the measurements to dry weight. Plantless pots with soil also were evaluated under the same conditions. CO2 levels attributed to release from the soil and room atmosphere were subtracted from the experimental CO2 measurements to obtain the levels attributed to just the plant.
Accession Numbers
Accession numbers are as follows: At1g11790 (ADT1), At3g07630 (ADT2), At2g27820 (ADT3), At3g44720 (ADT4), At5g22630 (ADT5), and At1g08250 (ADT6).
Supplemental Data
The following supplemental materials are available.
Supplemental Figure S1. Simplified schematic representation of metabolic pathways and their downstream relationship to photosynthetic carbon fixation.
Supplemental Figure S2. Representative total ion content chromatograms of Arabidopsis wild-type leaf extracts obtained under the conditions described in “Materials and Methods.”
Supplemental Figure S3. Structures of identified/putative metabolites.
Supplemental Figure S4. Environmental exposure/isolation chamber for real-time atmospheric monitoring of plants.
Supplemental Table S1. Excel file containing complete data set and statistical analysis of annotated features.
Supplemental Table S2. MS/MS data for annotated metabolites.
Acknowledgments
We thank Dr. Daniel Giddings Vassão (Max Planck Institute for Chemical Ecology) for providing glucoraphanin, gluconasturtiin, and 1-methoxyglucobrassicin standards and Magnus Wood for plant growth in the phenomics facility. A portion of this research was performed using EMSL, a Department of Energy Office of Science User Facility sponsored by the Office of Biological and Environmental Research.
Footnotes
This work was supported by the Chemical Sciences, Geosciences, and Biosciences Division, U.S. Department of Energy, Office of Basic Energy Sciences (DE-FG-0397ER20259), the National Aeronautics and Space Administration (NNX15AG56G), and the USDA National Institute of Food and Agriculture (2011-68005-30416).
Articles can be viewed without a subscription.
References
- Araus JL, Cairns JE (2014) Field high-throughput phenotyping: the new crop breeding frontier. Trends Plant Sci 19: 52–61 [DOI] [PubMed] [Google Scholar]
- Bailleul B, Cardol P, Breyton C, Finazzi G (2010) Electrochromism: a useful probe to study algal photosynthesis. Photosynth Res 106: 179–189 [DOI] [PubMed] [Google Scholar]
- Baker NR. (2008) Chlorophyll fluorescence: a probe of photosynthesis in vivo. Annu Rev Plant Biol 59: 89–113 [DOI] [PubMed] [Google Scholar]
- Beekwilder J, van Leeuwen W, van Dam NM, Bertossi M, Grandi V, Mizzi L, Soloviev M, Szabados L, Molthoff JW, Schipper B, et al. (2008) The impact of the absence of aliphatic glucosinolates on insect herbivory in Arabidopsis. PLoS ONE 3: e2068. [DOI] [PMC free article] [PubMed] [Google Scholar]
- Brooks MD, Niyogi KK (2011) Use of a pulse-amplitude modulated chlorophyll fluorometer to study the efficiency of photosynthesis in Arabidopsis plants. Methods Mol Biol 775: 299–310 [DOI] [PubMed] [Google Scholar]
- Brown PD, Tokuhisa JG, Reichelt M, Gershenzon J (2003) Variation of glucosinolate accumulation among different organs and developmental stages of Arabidopsis thaliana. Phytochemistry 62: 471–481 [DOI] [PubMed] [Google Scholar]
- Cho MH, Corea ORA, Yang H, Bedgar DL, Laskar DD, Anterola AM, Moog-Anterola FA, Hood RL, Kohalmi SE, Bernards MA, et al. (2007) Phenylalanine biosynthesis in Arabidopsis thaliana: identification and characterization of arogenate dehydratases. J Biol Chem 282: 30827–30835 [DOI] [PubMed] [Google Scholar]
- Corea ORA, Ki C, Cardenas CL, Kim SJ, Brewer SE, Patten AM, Davin LB, Lewis NG (2012) Arogenate dehydratase isoenzymes profoundly and differentially modulate carbon flux into lignins. J Biol Chem 287: 11446–11459 [DOI] [PMC free article] [PubMed] [Google Scholar]
- D’Auria JC, Gershenzon J (2005) The secondary metabolism of Arabidopsis thaliana: growing like a weed. Curr Opin Plant Biol 8: 308–316 [DOI] [PubMed] [Google Scholar]
- Fahlgren N, Gehan MA, Baxter I (2015) Lights, camera, action: high-throughput plant phenotyping is ready for a close-up. Curr Opin Plant Biol 24: 93–99 [DOI] [PubMed] [Google Scholar]
- Geigenberger P, Kolbe A, Tiessen A (2005) Redox regulation of carbon storage and partitioning in response to light and sugars. J Exp Bot 56: 1469–1479 [DOI] [PubMed] [Google Scholar]
- Genty B, Briantais JM, Baker NR (1989) The relationship between the quantum yield of photosynthetic electron transport and quenching of chlorophyll fluorescence. Biochim Biophys Acta 990: 87–92 [Google Scholar]
- Glauser G, Grata E, Rudaz S, Wolfender JL (2008) High-resolution profiling of oxylipin-containing galactolipids in Arabidopsis extracts by ultra-performance liquid chromatography/time-of-flight mass spectrometry. Rapid Commun Mass Spectrom 22: 3154–3160 [DOI] [PubMed] [Google Scholar]
- Grapov D. (2014) DeviumWeb: dynamic multivariate data analysis and visualization platform, version 0.4 (1/25/2015).
- Grubb CD, Abel S (2006) Glucosinolate metabolism and its control. Trends Plant Sci 11: 89–100 [DOI] [PubMed] [Google Scholar]
- Halkier BA, Gershenzon J (2006) Biology and biochemistry of glucosinolates. Annu Rev Plant Biol 57: 303–333 [DOI] [PubMed] [Google Scholar]
- Haughn GW, Schultz EA, Martinez-Zapater JM (1995) The regulation of flowering in Arabidopsis thaliana: meristems, morphogenesis, and mutants. Can J Bot 73: 959–981 [Google Scholar]
- Hemm MR, Ruegger MO, Chapple C (2003) The Arabidopsis ref2 mutant is defective in the gene encoding CYP83A1 and shows both phenylpropanoid and glucosinolate phenotypes. Plant Cell 15: 179–194 [DOI] [PMC free article] [PubMed] [Google Scholar]
- Jung E, Zamir LO, Jensen RA (1986) Chloroplasts of higher plants synthesize L-phenylalanine via L-arogenate. Proc Natl Acad Sci USA 83: 7231–7235 [DOI] [PMC free article] [PubMed] [Google Scholar]
- Kim JI, Dolan WL, Anderson NA, Chapple C (2015) Indole glucosinolate biosynthesis limits phenylpropanoid accumulation in Arabidopsis thaliana. Plant Cell 27: 1529–1546 [DOI] [PMC free article] [PubMed] [Google Scholar]
- Kobayashi K, Narise T, Sonoike K, Hashimoto H, Sato N, Kondo M, Nishimura M, Sato M, Toyooka K, Sugimoto K, et al. (2013) Role of galactolipid biosynthesis in coordinated development of photosynthetic complexes and thylakoid membranes during chloroplast biogenesis in Arabidopsis. Plant J 73: 250–261 [DOI] [PubMed] [Google Scholar]
- Koornneef M, Alonso-Blanco C, Peeters AJM, Soppe W (1998) Genetic control of flowering time in Arabidopsis. Annu Rev Plant Physiol Plant Mol Biol 49: 345–370 [DOI] [PubMed] [Google Scholar]
- Kramer DM, Johnson G, Kiirats O, Edwards GE (2004) New fluorescence parameters for the determination of QA redox state and excitation energy fluxes. Photosynth Res 79: 209–218 [DOI] [PubMed] [Google Scholar]
- Kuhl C, Tautenhahn R, Böttcher C, Larson TR, Neumann S (2012) CAMERA: an integrated strategy for compound spectra extraction and annotation of liquid chromatography/mass spectrometry data sets. Anal Chem 84: 283–289 [DOI] [PMC free article] [PubMed] [Google Scholar]
- Külheim C, Ågren J, Jansson S (2002) Rapid regulation of light harvesting and plant fitness in the field. Science 297: 91–93 [DOI] [PubMed] [Google Scholar]
- Lawson T, Kramer DM, Raines CA (2012) Improving yield by exploiting mechanisms underlying natural variation of photosynthesis. Curr Opin Biotechnol 23: 215–220 [DOI] [PubMed] [Google Scholar]
- Lewis NG, Yamamoto E (1989) Tannins: their place in plant metabolism. In Hemingway RW, Karchesy JJ, eds, Chemistry and Significance of Condensed Tannins. Plenum Press, New York, NY, pp 23–46 [Google Scholar]
- Mach J. (2015) Metabolic crosstalk: interactions between the phenylpropanoid and glucosinolate pathways in Arabidopsis. Plant Cell 27: 1367. [DOI] [PMC free article] [PubMed] [Google Scholar]
- Matsuda F, Hirai MY, Sasaki E, Akiyama K, Yonekura-Sakakibara K, Provart NJ, Sakurai T, Shimada Y, Saito K (2010) AtMetExpress development: a phytochemical atlas of Arabidopsis development. Plant Physiol 152: 566–578 [DOI] [PMC free article] [PubMed] [Google Scholar]
- Matsunami K, Otsuka H, Kondo K, Shinzato T, Kawahata M, Yamaguchi K, Takeda Y (2009) Absolute configuration of (+)-pinoresinol 4-O-[6′′-O-galloyl]-β-D-glucopyranoside, macarangiosides E, and F isolated from the leaves of Macaranga tanarius. Phytochemistry 70: 1277–1285 [DOI] [PubMed] [Google Scholar]
- Matthäus B, Luftmann H (2000) Glucosinolates in members of the family Brassicaceae: separation and identification by LC/ESI-MS-MS. J Agric Food Chem 48: 2234–2239 [DOI] [PubMed] [Google Scholar]
- Nakabayashi R, Kusano M, Kobayashi M, Tohge T, Yonekura-Sakakibara K, Kogure N, Yamazaki M, Kitajima M, Saito K, Takayama H (2009) Metabolomics-oriented isolation and structure elucidation of 37 compounds including two anthocyanins from Arabidopsis thaliana. Phytochemistry 70: 1017–1029 [DOI] [PubMed] [Google Scholar]
- Puthiyaveetil S, Woodiwiss T, Knoerdel R, Zia A, Wood M, Hoehner R, Kirchhoff H (2014) Significance of the photosystem II core phosphatase PBCP for plant viability and protein repair in thylakoid membranes. Plant Cell Physiol 55: 1245–1254 [DOI] [PMC free article] [PubMed] [Google Scholar]
- Rippert P, Puyaubert J, Grisollet D, Derrier L, Matringe M (2009) Tyrosine and phenylalanine are synthesized within the plastids in Arabidopsis. Plant Physiol 149: 1251–1260 [DOI] [PMC free article] [PubMed] [Google Scholar]
- Ruban AV, Johnson MP, Duffy CDP (2012) The photoprotective molecular switch in the photosystem II antenna. Biochim Biophys Acta 1817: 167–181 [DOI] [PubMed] [Google Scholar]
- Ruiz-Sola MÁ, Rodríguez-Concepción M (2012) Carotenoid biosynthesis in Arabidopsis: a colorful pathway. The Arabidopsis Book 10: e0158, [DOI] [PMC free article] [PubMed] [Google Scholar]
- Sacksteder CA, Kramer DM (2000) Dark-interval relaxation kinetics (DIRK) of absorbance changes as a quantitative probe of steady-state electron transfer. Photosynth Res 66: 145–158 [DOI] [PubMed] [Google Scholar]
- Saito K, Yonekura-Sakakibara K, Nakabayashi R, Higashi Y, Yamazaki M, Tohge T, Fernie AR (2013) The flavonoid biosynthetic pathway in Arabidopsis: structural and genetic diversity. Plant Physiol Biochem 72: 21–34 [DOI] [PubMed] [Google Scholar]
- Seneviratne HK, Dalisay DS, Kim KW, Moinuddin SGA, Yang H, Hartshorn CM, Davin LB, Lewis NG (2015) Non-host disease resistance response in pea (Pisum sativum) pods: biochemical function of DRR206 and phytoalexin pathway localization. Phytochemistry 113: 140–148 [DOI] [PubMed] [Google Scholar]
- Siehl DL, Conn EE (1988) Kinetic and regulatory properties of arogenate dehydratase in seedlings of Sorghum bicolor (L.) Moench. Arch Biochem Biophys 260: 822–829 [DOI] [PubMed] [Google Scholar]
- Smith CA, Want EJ, O’Maille G, Abagyan R, Siuzdak G (2006) XCMS: processing mass spectrometry data for metabolite profiling using nonlinear peak alignment, matching, and identification. Anal Chem 78: 779–787 [DOI] [PubMed] [Google Scholar]
- Sumner LW, Amberg A, Barrett D, Beale MH, Beger R, Daykin CA, Fan TWM, Fiehn O, Goodacre R, Griffin JL, et al. (2007) Proposed minimum reporting standards for chemical analysis. Chemical Analysis Working Group (CAWG) Metabolomics Standards Initiative (MSI). Metabolomics 3: 211–221 [DOI] [PMC free article] [PubMed] [Google Scholar]
- Tautenhahn R, Böttcher C, Neumann S (2008) Highly sensitive feature detection for high resolution LC/MS. BMC Bioinformatics 9: 504. [DOI] [PMC free article] [PubMed] [Google Scholar]
- Tester M, Langridge P (2010) Breeding technologies to increase crop production in a changing world. Science 327: 818–822 [DOI] [PubMed] [Google Scholar]
- Tietz S, Puthiyaveetil S, Enlow HM, Yarbrough R, Wood M, Semchonok DA, Lowry T, Li Z, Jahns P, Boekema EJ, et al. (2015) Functional implications of photosystem II crystal formation in photosynthetic membranes. J Biol Chem 290: 14091–14106 [DOI] [PMC free article] [PubMed] [Google Scholar]
- Underhill EW. (1968) Biosynthesis of mustard oil glucosides: 3-benzylmalic acid, a precursor of 2-amino-4-phenylbutyric acid and of gluconasturtiin. Can J Biochem 46: 401–405 [DOI] [PubMed] [Google Scholar]
- Veit M, Pauli GF (1999) Major flavonoids from Arabidopsis thaliana leaves. J Nat Prod 62: 1301–1303 [DOI] [PubMed] [Google Scholar]
- Witt HT. (1979) Energy conversion in the functional membrane of photosynthesis: analysis by light pulse and electric pulse methods. The central role of the electric field. Biochim Biophys Acta 505: 355–427 [DOI] [PubMed] [Google Scholar]