Abstract
Nutrient and gas exchange between mother and fetus occurs at the interface of the maternal intervillous blood and the vast villous capillary network that makes up much of the parenchyma of the human placenta. The distal villous capillary network is the terminus of the fetal blood supply after several generations of branching of vessels extending out from the umbilical cord. This network has a contiguous cellular sheath, the syncytial trophoblast barrier layer, which prevents mixing of fetal blood and the maternal blood in which it is continuously bathed. Insults to the integrity of the placental capillary network, occurring in disorders such as maternal diabetes, hypertension and obesity, have consequences that present serious health risks for the fetus, infant, and adult. To better define the structural effects of these insults, a protocol was developed for this study that captures capillary network structure on the order of 1 - 2 mm3 wherein one can investigate its topological features in its full complexity. To accomplish this, clusters of terminal villi from placenta are dissected, and the trophoblast layer and the capillary endothelia are immunolabeled. These samples are then clarified with a new tissue clearing process which makes it possible to acquire confocal image stacks to z- depths of ~1 mm. The three-dimensional renderings of these stacks are then processed and analyzed to generate basic capillary network measures such as volume, number of capillary branches, and capillary branch end points, as validation of the suitability of this approach for capillary network characterization.
Keywords: Developmental Biology, Issue 133, 3D-rendering, Clearing, CLARITY, Placenta, Confocal microscopy, Villous, Immunolabeling, Networks
Introduction
Our understanding of the developing placenta and its pathologies is, in large measure, limited to inferred spatial relationships between adjacent villi and contained capillaries derived from histological sections. In this study, we have addressed this issue by developing the means to generate three-dimensional (3D) renderings of human placental capillary networks that are suitable for analyses of capillary network features (e.g. branching, solidity). To do this we have combined immunofluorescent staining with two commercial tissue clearing products, Visikol-1 and Visikol-2 (referred to below as Solution-1 and Solution-2).
The human placenta is a vast complex of blood vessels located at the interface between the mother's intervillous blood and the developing fetus. Extending out from its insertion into the chorionic plate, the umbilical cord branches into a network of arteries and veins that ramify to cover the chorionic surface with an elaborate vascular network. Their ends then penetrate down into the interior or depth of the placental disk where they undergo several more branching generations and end in the terminal villi and their contained capillary networks, the site of the exchange of gases, nutrients, and metabolic waste between fetal and maternal blood.
Insults to the placental capillary network during development have lasting consequences for the health of the fetus, newborn infant and the emergent adult 1,2,3. In view of pregnancy-related pathologies such as miscarriage, intrauterine growth restriction, pre-eclampsia and maternal diabetes 4,5,6 there is a high value placed on developing methods of measurement and characterization of placental villous capillary networks. A major roadblock is that placental vascular networks encompass a broad range of scale. The surface vascular networks can be as great as 4-5 mm in diameter. The terminal villous capillaries are on the order of 10 -20 µm in diameter; the placenta contains over 300 km of blood vessels 7. At present, there are few easy to use and rapid techniques that can capture these extremes of vessel scale. To date, only a small number of villi can be rendered by microscopy. For example, Jirkovska et al. focused on the placental villus at term, combining confocal microscopy with serial optical sections at 1 µm intervals obtained from 120 µm thick sections; no data on the number of samples studied nor statistics were provided 8. Capillary structures were identified, and contours of villi and capillaries were hand-drawn, with tracings exported for image analysis. While the authors discuss the implications of their findings for the "growing villous vascular network", such conclusions are problematic when only "term" (36+ week gestational age) tissue is studied. Similarly, Mayo et al. and Pearce et al. relied on the tissue of the same age, for their simulations of blood flow and oxygen transfer, but their analyses were limited to only a few term, terminal villi 9,10. Stereology has also been applied to the study of the structure of villous vessels. But again, the focus has generally been on later pregnancies delivering liveborn infants with one or more pregnancy complications 11,12.
Until recently, confocal microscopy was limited to imaging to tissue depths of 100-200 µm because of absorption of the excitation and emission of the fluorescence by the overlying tissue 13 . Though tissue clearing and 3D histology have been widely described in the literature and there are numerous methods for tissue clearing many are unsuitable for use with tissues in general, as they irreversibly damage cellular morphology through the hyperhydration of proteins or removal of lipids. Therefore, it is not possible to validate that these results are indicative of the tissue itself and not artifacts from processing whereas our tissue clearing process is a reversible technique that is able to validate against traditional histology. Tissue clearing generally involves one of three major approaches: 1) uniform matching of the refractive index (RI) of tissue components by submersion in RI matching solutions, which removes the cumulative light scattering caused from lensing due to continuous fluctuation of low RI (cytosol) and high RI (protein/lipids) constituents; 2) removing lipid components by way of embedding into hydrogel and utilizing electrophoresis/diffusion to remove lipid components; 3) expansion/denaturation of protein structure to allow increased penetration of solvents to encourage uniformity of RI 13. While these approaches can render tissues transparent and allow for 3D representations of biomarkers to be generated, these 3D representations are of questionable clinical value as it is challenging to determine if these images are indicative of tissue properties or of the tissue clearing process. On the other hand, since our tissue clearing is reversible standard histological and/or immunohistochemistry can be applied to the same tissue to evaluate whether the alterations are clinically significant.
This study presents an analysis of 47 distal villous samples obtained from a total of 23 clinically normal and electively terminated pregnancies between 9-23 completed weeks' gestation and two full-term normal deliveries. Immunofluorescence labeling of trophoblast and endothelia has enabled a quantitative and automated analysis of changes in the villous vascular networks and their complexity.
With this protocol, we isolated and analyzed terminal villi and their capillary networks on a scale not possible previously. This approach, when applied to villous and capillary network development across gestation will identify those properties that are the foundation for the birth of a healthy child. When applied to studies of complicated pregnancies, it will also clarify when and how the placental pathologies modify the villous trees and the capillary networks they sheath, and how these impinge on fetal well-being.
Protocol
This protocol follows the guidelines of New York State Institute for Basic Research in Developmental Disabilities human research ethics committee.
1. Villous Tree Dissection
Rinse formalin fixed placenta tissue with phosphate buffed saline (PBS)14 to remove the formalin and place in a Petri dish on the stage of a dissection microscope. Use scalpel and fine forceps to tease the placenta tissue apart to locate villous trees (white threadlike branching structures). Dissect out pieces of villus tree (several mm long) and transfer the tissue to a micro-tube containing ~1 mL PBS.
2. Immunofluorescent Staining
With a pipette, remove the PBS and replace with fresh PBS. Let stand for 10 min with occasional swirling. Repeat once more. NOTE: This step and all further steps are done at room temperature except the primary antibody incubation.
Using a pipette, remove and replace the PBS with PBS +0.1% Triton-X100 + 2% goat serum (PBS-T-GS) to permeabilize the tissue and block non-specific binding of secondary antibodies. Incubate for 30 min.
- Replace the PBS-T-GS with PBS containing 2% goat serum, both mouse monoclonal anti-CK7 and rabbit anti-CK7.
- Incubate tissue overnight at 4 °C.
- Remove the remaining antibodies by washing with PBS-GS for 10 minutes with occasional swirling.
- Remove the PBS-GS and replace with PBS-GS containing both goat anti-mouse IgG coupled with a green emitting (520 nm) fluorophore and goat anti-rabbit IgG coupled an infrared emitting (652 nm) fluorophore.
- Remove the antibodies by repeating step 2.1.
- Store the immunolabeled tissue at room temperature in the dark.
3. Clarification of the Tissue
Wash the samples 3 times with PBS at 10 minute intervals.
Dehydrate the tissue by removing the PBS with a pipette and replacing it with 50% ethanol (methanol may be used as well). Incubate for 10 min. Replace with fresh 50% ethanol and incubate for 10 min. Repeat this once more for a total of 3 incubations. Repeat incubations with 70%. Then replace with 100% ethanol and incubate for 15 minutes (alternatively methanol may be used).
With a fine-tipped forceps, transfer tissue to a fresh micro-tube containing ~ 1 mL Solution-1 for 4 h.
With fine-tipped forceps, transfer tissue to a fresh micro-tube containing Solution-2 for ~ 4 h. NOTE: When stored in the dark, the immunofluorescence is stable at room temperature for at least 6 months.
Do not mix with any aqueous solution, (e.g. mounting medium) as the clearing will lost.
4. Mounting for Microscopy
Do not mount the tissue between a standard glass slide and a coverslip as the tissue is soft and easily deformed.
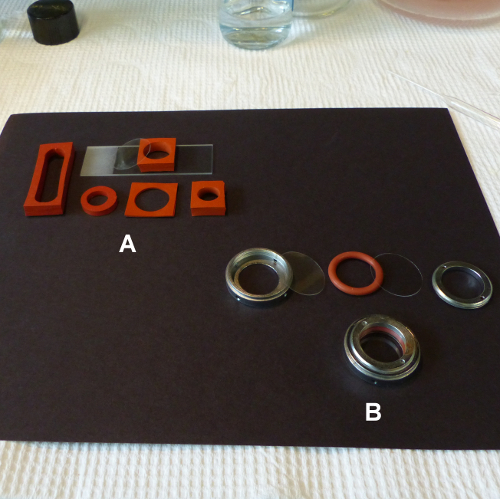
- Refer to Figure 5B and mount the tissue in a Sykes-Moore chamber as follows;
- With fine-tipped forceps place a 25-mm round coverslip in the chamber base.
- With a fine-tipped forceps place the rubber gasket in the base on the coverslip.
- With a pipette place a drop (~40 µL) of Solution-2 in the center of the coverslip.
- With the fine-tipped forceps transfer a piece tissue from Solution-2 to the drop in the center of the coverslip.
- Place a second coverslip on the top of the gasket.
- Thread the locking ring into the top of the base compressing the coverslips and gasket until firm. NOTE: Be careful not to over-tighten or the coverslip will shatter.
- Insert a 22-gauge needle into a port on the base and through the gasket.
- Fill a 3-mL syringe with ~ 1.5 mL of Solution-2.
- Mount a 25-gauge needle on the syringe.
- Insert the syringe needle into the opposite port and through the gasket.
- Ensure that the air in the chamber is venting through the other 25-gauge needle, gently inject solution-2and fill the chamber.
- Remove the needle and syringe and place the chamber on a large glass slide on the confocal microscope stage.
- Alternatively, cut custom wells out of PDMS silicone sheets.
- With scissors cut a 25.4 × 25.4 mm2 piece from the PDMS sheet.
- With a scalpel cut ~ 12.7 × 12.7 mm2 well in the piece.
- Press the piece firmly onto a microscope slide.
- Fill the well to the top with Solution-2.
- Transfer the tissue piece from the micro-tube to the center of the well.
- With fine-tipped forceps place a coverslip on the top of the well such that the bottom of the coverslip is wetted with Solution-2.
- Mount the Sykes Moore Chamber assembly with the tissue on the confocal microscope stage.
5. Confocal Microscopy
Bring the tissue in the chamber into focus with a 10x objective.
Move the microscope stage up and down through the focal plane to measure the distance between the top and bottom of the tissue.
Move the stage in 2.5 µm steps to collect a confocal image file containing a set of images through the tissue from top to bottom.
6. Reversing the Clearing
Reverse the clearing by transferring the tissue to a micro-tube containing > 20x the volume of 100% ethanol. At 1 h intervals replace with 70% ethanol, then 50% ethanol and finally PBS. Store at 4 °C in the dark. NOTE: Now process the tissue for standard paraffin embedding, sectioning and histological or immuno-histochemical staining.
7. Deconvolution
NOTE: For the following steps, software Commands, Tabs and drop-down menus are italicized.
Start the deconvolution software and open the image file.
- Enter parameters listed in the 'Summary' window.
- For 'Spacings' enter the voxel x, y, and z dimensions in µm.
- For each color channel, select the fluorescent dye used for the immunostaining from the drop-down menu.
- For the 'Modality', select Laser Scanning Confocal from the drop-down menu.
- For the 'Objective Lens', select 10x from the drop-down menu.
- For the 'Immersion Medium', select Air from the drop-down menu.
- Click on the 'Apply' button.
Click on the 'Deconvolution' tab.
Click on '3D Deconvolution' in the drop-down menu.
In the '3D -Deconvolution' window insure that the settings are: 1) Adaptive PSF Blind, 2) Theoretical PSF, 3) Use (Default Adaptive PSF, 10 iterations, Medium noise), 4) Base Name.
Click on the 'green Check button' to start the program.
When finished, repeat steps 7.3 -7.6 to restart the program. When finished restart it for third and last time.
In the 'Data Manager' window, click on the file prefixed with "10-10-10-".
Click on the 'File' tab, then click on 'Save As'.
In the 'Save As' window select '8bit unsigned integer' from the 'Data Type' drop-down menu and click on Save.
8. Image Processing
- Start Fiji software.
- Click on 'File', click on 'Open' and select the Deconvolved image file and click on the 'Open' button in the 'Open' window.
- Click on 'Image/Color/Split channels' and convert the three-color image file into three new files containing only one color. Save the red image file that contains the immunolabeled villous capillary image set. Delete the green and blue image files.
- Subtract the background fluorescence from the red image file with: 'Process/Subtract background'.
- In the drop-down menu set Rolling ball radius to 10 pixels.
- Leave the 4 menu options unchecked and click 'OK'.
- Click 'Yes' on the Process Stack menu.
- Remove inherent tissue fluorescence (autofluorescence) by opening the 'Image/Adjust/Brightness-Contrast' menu and adjusting the minimum, maximum, brightness and contrast settings. Be careful not to remove any of the capillary immunofluorescence.
- Minimize remaining irrelevant fluorescence by opening the 'Image/Adjust/Threshold' menu and adjusting the sliders such that the capillary immunofluorescence is highlighted. Check the 'Dark background' box and click on 'Apply'. On the 'convert to binary drop-down' menu check the 'Black background' box and click on 'OK'. Save the black and white (binary) image file for analyses below.
9. Analysis
- Object Counting and Skeletonization.
- Select the binary image file created in Step 8.1.8.
- Click on 'Analyze/3D OC Options' and check only 'Volume' and 'Store results …' boxes in the drop-down menu. Insure that the 'Show numbers' box is unchecked. Click on the 'OK' button.
- Click on 'Analyze/3D Objects Counter'. In the drop-down menu, set 'Size Filter: Min.' to 5000. Insure that the 'Exclude objects on edges' box is unchecked. Check that the 'Objects, Statistics' and 'Summary' boxes are checked. Click on the 'OK' button. NOTE: This may take several minutes depending on file size and computer configuration.
- Save the Statistics table and the Objects map file.
- Select the Objects map file. Click on 'Plugins/Skeleton/Skeletonize 2D-3D' to skeletonize the capillary network in the binary file. Click on 'File/Save as'. Select 'Tiff…' in the drop-down menu. In the Save as TIFF window add "Skel-" to object map file name and click on the 'Save' button.
- Click on 'Analyze/Skeleton/Analyze Skeleton 2D-3D'. In the drop-down menu accept the default settings and click on the 'OK' button. Save the Branch 'information' table, the 'Results' table, and two output files (Skel-Objects-labeled -skeletons and Tagged skeleton).
Representative Results
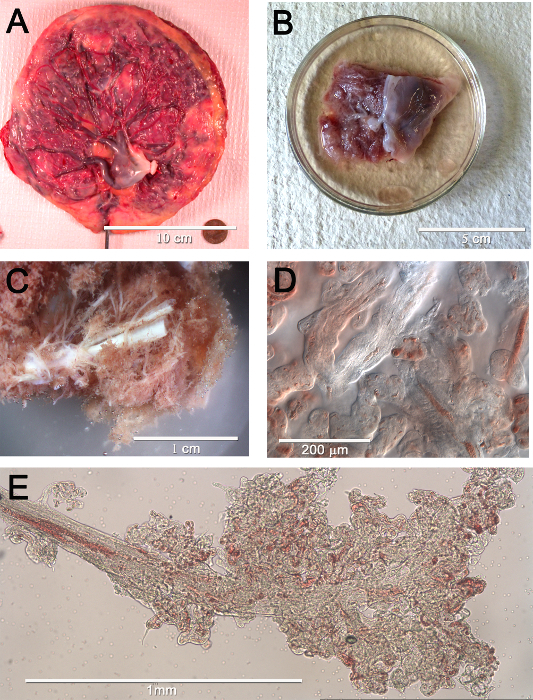
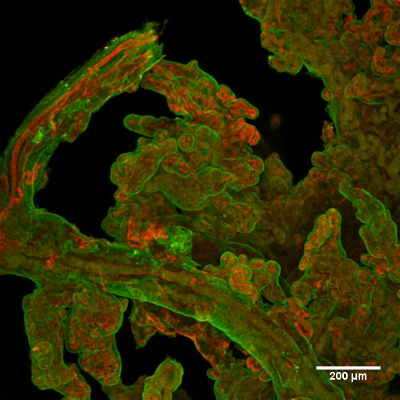
The generated 3D renderings of the capillaries in clusters of terminal villi in human placenta from 8 weeks gestational age to term delivery were counted as individual clusters and skeletonized for network analysis. The functional units of the placenta (Figure 1A) are the villus trees that are an extension of surface vessels where they have penetrated the placenta parenchyma (Figure 1B, and enlarged in 1C). Pieces of the distal portion of a dissected tree (Figure1D and 1E) were then immunolabeled to show the villus trophoblast layer and its capillaries (Figure 2). Crucial for the 3D rendering was the ability to use this system of clearing tissue.
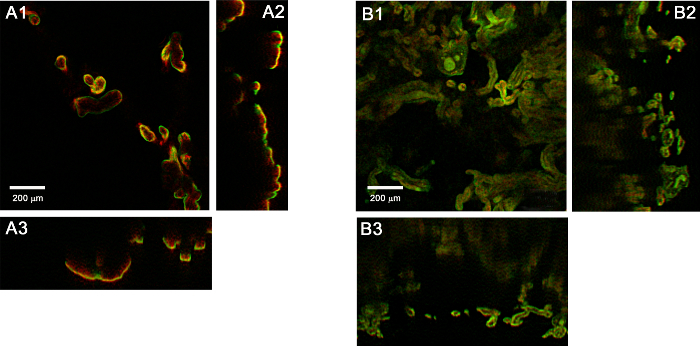
With the confocal system used for this study, immunofluorescence from uncleared tissue can only be acquired at depths of ~100 µm or less (Figure 3A). At deeper depths, it is absorbed by the overlying tissue. In contrast, the cleared tissue (Figure 3B) allows for imaging to a much deeper depth.
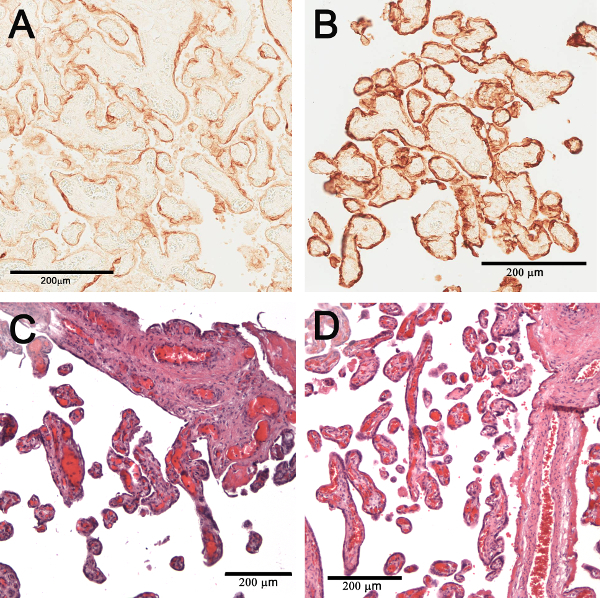
The cleared tissue can be returned to its uncleared state by doing the dehydration steps in reverse and returning it to PBS. To validate this reversal, the uncleared tissue was imbedded in paraffin, sectioned and immunohistochemically stained with CK7 (Figure 4A) or histologically stained with hematoxylin-eosin (H&E) (Figure 4C). In both cases, the staining of the "uncleared" tissue was comparable to conventional sections stained with CK7 (Figure 4B or H&E (Figure 4D) validating that clearing did not significantly alter the tissue.
Because of their size, mounting of the tissue samples on a standard microscope slide with a coverslip resulted in unacceptable flattening. This can be overcome by using either Sykes Moore Chambers that accommodate pieces up to 4 mm deep (Figure 5B), or chambers of varying sizes and depths made by punching out wells in silicone rubber sheeting (Figure 5A).
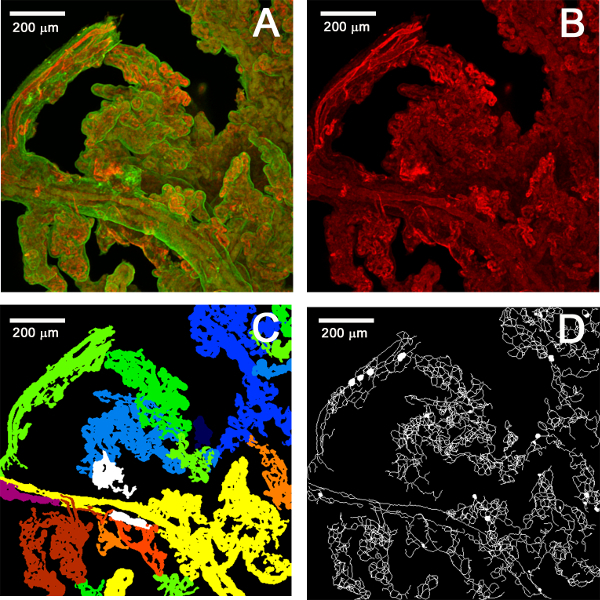
The 3D renderings of the confocal stacks (Figure 6A) were used to separate the capillary networks, (Figure 6B) identify the villus clusters (objects, Figure 6C), count the villus clusters and skeletonize the capillary networks (Figure 6D). Animated 3D renderings of these are included in the animated /Video/Figures list.
Our ability to usefully image to depths of ~1 mm is seen in the 3D renderings shown in the four mp4 files (see the Supplementary Materials). The image set used had a volume of 1.47 mm3 (the 10x objective field width squared times the z-depth or 1.25 mm2 × 0.94 mm). The mp4 files show that the original immunostained villous tissue is distributed throughout the entire depth of the volume (original.mp4), as was the similarly distributed villous capillary tissue (red.mp4), the corresponding capillary objects from the object counting analysis (objects.mp4) and their skeletonized networks (skeleton.mp4). This volume and tissue distribution are typical for our confocal image sets. For example, the z-depths for the image sets used for Figure 7 are 0.95 mm for 8 weeks, 1.045 mm for 14 weeks, 1.242 mm for 17 weeks, 1.092 mm for 22 weeks and 0.94 mm for the term (the field width is the same for all).
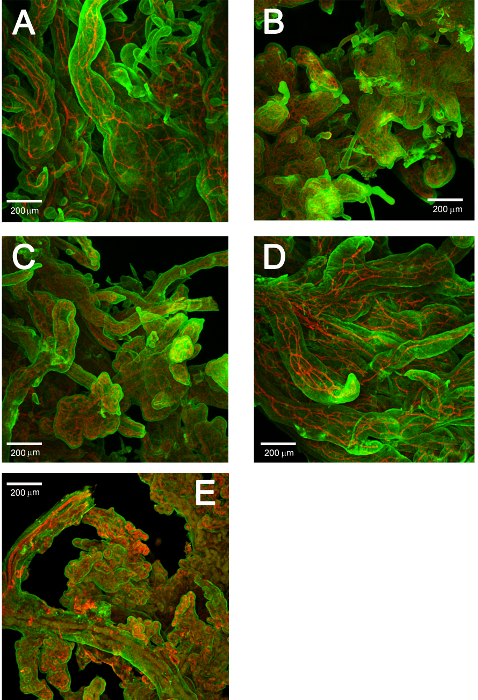
The results in Table 1 demonstrate the suitability of applying network analyses to the 3D renderings of villus vascular networks. Altogether this study analyzed the villus capillary networks of 47 image stacks containing ~900 villus clusters in samples ranging from 8 to 36 weeks' gestational age. Figure 7 demonstrates how the vessel networks change across gestational age. Each stack contained a set of ~400 images encompassing a Z-depth of ~1000 µm. The results are summarized in Table 1. The volumes are the average total volume of the villus clusters in the stack. The 3 other columns show the results for three network measures obtained for the skeletonized objects. These are simple, basic measures and could easily be expanded into more comprehensive and complex measures.
Figure 1. Macroscopic to microscopic views of human placental vascular networks. (A) Surface view of the chorionic plate of a normal human placenta. It shows the network of surface vessels radiating out from the umbilical cord insertion. (B) A piece of placenta to be used for dissection. The chorionic plate is to the right and underlying placenta parenchyma is on the left with the villus trees (white tubes) and the rosy, densely packed terminal villi. (C) An enlarged view of (B) highlighting the white villus trees. (D) A 20x image of a few terminal villi and their capillaries. (E) The distal portion of a villus tree where it terminates in the clusters of terminal villi. Some of the capillaries containing fetal erythrocytes are visible. Please click here to view a larger version of this figure.
Figure 2. Typical example of immunolabeled placental villi. The outer trophoblast layer is in green and (interior) capillaries are in red. Please click here to view a larger version of this figure.
Figure 3. Orthogonal (xy [1], xz [2], yz [3]) views of placenta tissue. (A) Before and (B) after clearing. Please click here to view a larger version of this figure.
Figure 4. Comparison staining of conventional tissue sections and reverse cleared tissue. Conventional immunohistochemical staining of a section of term placenta tissue with CK7 (A). CK7 stained tissue after the clearing was reversed (B). Conventional histological staining of a placenta section with H&E (C). H&E staining immunohistochemically after clearing is reversed (D). Please click here to view a larger version of this figure.
Figure 5. Two options for mounting tissue for confocal microscopy. (A) Silicone rubber sheet (B) Sykes Moore chamber. Please click here to view a larger version of this figure.
Figure 6. Maximum projections of the processing and analysis of confocal image stacks. (A) Original confocal image set. (B) Separated red channel. (C) Map of counted objects. (D) Skeletonized objects. Please click here to view a larger version of this figure.
Figure 7. Representative maximum projections of confocal stacks acquired at several gestational ages. (A) 8 weeks, (B) 14 weeks, (C) 17 weeks, (D) 22 weeks and (E) 36 weeks Please click here to view a larger version of this figure.
| GA (weeks) | Mean Volume (mm^3) | Std. dev. Volume (mm^3) | Mean Branches | Std. dev. Branches | Mean Branches/ mm^3 | Std. dev. Branches/mm^3 | Mean Branch Length (mm) | Std. dev. Branch Length (mm) |
| 8 | 0.00059 | 0.0125 | 113.44 | 192.74 | 304321.3 | 15465.9 | 0.0451 | 0.0178 |
| 10 | 0.00074 | 0.016 | 182.09 | 349.61 | 346849 | 21884.81 | 0.0325 | 0.0132 |
| 12 | 0.00103 | 0.044 | 226.56 | 788.53 | 306438.7 | 17924.66 | 0.0434 | 0.0835 |
| 14 | 0.00108 | 0.0219 | 233.59 | 430.54 | 344598.1 | 19680.42 | 0.031 | 0.016 |
| 16 | 0.00065 | 0.0106 | 180.81 | 265.26 | 392412 | 25007.06 | 0.0271 | 0.0049 |
| 18 | 0.00056 | 0.0124 | 154.43 | 313.7 | 355264 | 25370.6 | 0.0283 | 0.0041 |
| 22 | 0.00089 | 0.0229 | 161.95 | 494.21 | 290176 | 21602.3 | 0.0383 | 0.013 |
Table 1. Representative results of the network analysis of cleared villus samples at different gestational ages. The table shows the averages of volume, number of branches, branches per unit volume and branch length for cleared villus samples at gestational ages of 8 through 22 weeks gestation.
Supplementary Materials: Animated/Video Figures showing 3D renderings of the confocal stacks in Figure 6. 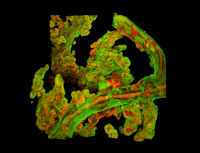 A. Original confocal stack. (Original.mp4). Please click here to view this video. (Right-click to download.)
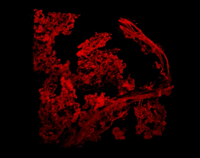 B. Separated Red Channel (Red.mp4) Please click here to view this video. (Right-click to download.)
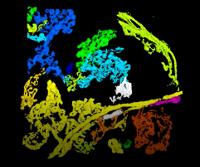 C. Identified Objects (Objects.mp4) Please click here to view this video. (Right-click to download.)
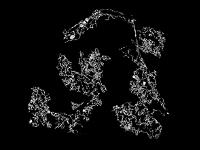 D. Skeletonized objects (Skeleton.mp4) Please click here to view this video. (Right-click to download.)
Discussion
The Institutional Review Board approved the collection of placental villous tissues for formalin fixation from electively terminated pregnancies. Before the procedures were performed, a brief review of the medical record noted maternal age, parity, and confirmed the absence of any underlying medical (e.g., hypertension, diabetes, and lupus) or fetal (structural or chromosomal anomalies, abnormal growth) was performed. The data sheet and any collected specimens were labeled only with a Study ID. Thus, all the specimens were de-identified before departing the operating suite. Villi were collected by a trained observer (CMS); decidua and chorionic plate were removed, and only free floating villous clumps were collected.
When clearing tissues with solvent-based techniques, there are several important considerations. Firstly, tissues must be sufficiently dehydrated to clear, so tissues must be washed through a gradient of ethanol (or methanol) to 100%. When using ethanol, it is critical to use "dry reagent-grade ethanol, which contains no water. It is also important to use a sufficient volume of dehydrating solution at each step; approximately 10-20x volume of tissue is required for successful dehydration. Incomplete dehydration of tissues will result in a cloudy appearance after clearing. Another important consideration is the concentration of the antibody utilized for staining. The excessive antibody can cause non-specific binding and incomplete penetration into tissues due to the blocking of diffusion channels. A less than sufficient concentration of antibody will result in incomplete staining as the antibody is exhausted before reaching the center of the tissue. Antibody concentration should be optimized on smaller pieces of tissue before scaling up to large samples. Although there is very little auto-fluorescence in fresh unfixed placenta it can be a significant problem in fixed tissues, especially after extended periods in fixative. At excessive levels, autofluorescence can mask fluorescent signals with the background. While prominent at 488 and 543 nm, it is much lower at higher wavelengths like 633 nm. The best way to avoid autofluorescence is to perform all steps at room temperature or below.
Placenta is a very soft, open tissue in that all the villus capillaries are separated from maternal blood space by the thin trophoblast membrane. Thus, the penetration of antibodies and the tissue clearing solutions are relatively rapid and are optimal with overnight incubation. Application of the protocol to solid tissues such as brain, kidney will require significantly longer incubation times that must be determined empirically.
Although the ability to unclear cleared tissue and stain it with standard histological procedures has allowed us to validate the clearing process it is limited in that it is not yet possible to match a stained section of uncleared tissue with its corresponding "slice" in the confocal image set. This correspondence will be needed if we are to be able to relate specific capillary network changes found in the 3D renderings with their counterparts in standard histological sections.
In this application, the tissue clearing process is limited to z-depths of ~1 mm beyond which the absorption of the excitation and emission increases until they are completely lost. This can be partially compensated for with the Fiji plugin Stack Contrast Adjustment. This loss is part due to the 12-year-old confocal system and the air objectives that were used for imaging. The air objectives that were used for imaging have a RI mismatch with the high RI of Solution-2 (RI = 1.52) which causes a loss in imaging depth. Any of the many currently available systems (conventional, light sheet microscopy, two-photon imaging could provide significantly improved z-depths, image quality and range of immunofluorescence and management of autofluorescence when combined with higher RI matched dipping objectives.
All the stacks were collected with a 10x objective (NA= 0.30, working distance (WD) = 16 mm) which put no constraints on the sample sizes. A 20x objective was occasionally used with a WD of 1 mm. At magnifications higher than this the WD diminishes such that it precludes volumes larger than a single villus.
This protocol now enables the collection of image sets with volumes that are 5-10 folds higher than previously obtainable. At this scale, the collective vascular networking of hundreds of terminal villi can be investigated.
This in turn will lead new and improved models of such critical features as inter- and intravillous oxygen diffusion based on intracapillary geometry as done previously in 2D in routine histology samples at 10-20x 15 and others have done in much smaller samples 8,16. Moreover, the stacks generated using this protocol should aid in modeling the intervillous geometry. At the level of the samples used in this study, intervillous flow is too slow to be visualized by Doppler or other techniques. However, whether intervillous geometry allows a uniform exposure of every villous surface (and its subjacent capillaries) to maternal flow or whether a too sparse or too crowded intervillous space renders maternal-fetal transfer less efficient is yet to be examined.
In the future, this protocol will be used to better define the development of placental vasculature during development and to determine trajectories of vascular network changes across normal gestation. Then these trajectories may be measured in pathologic pregnancies to provide information on when in gestation pregnancy complications begin to impact placental distal villous vascularization, and how those deviations alter function.
Disclosures
The authors have nothing to disclose.
Acknowledgments
This work was supported by the New York State Office for People with Developmental Disabilities and Placental Analytics LLC, New Rochelle, NY.
References
- Thornburg KL, Kolahi K, Pierce M, Valent A, Drake R, Louey S. Biological features of placental programming. Placenta. 2016;48:47–53. doi: 10.1016/j.placenta.2016.10.012. Suppl 1. [DOI] [PMC free article] [PubMed] [Google Scholar]
- Misra DP, Salafia CM, Charles AK, Miller RK. Birth weights smaller or larger than the placenta predict BMI and blood pressure at age 7 years. J Dev Orig Health Dis. 2010;1(2):123–130. doi: 10.1017/S2040174410000139. [DOI] [PubMed] [Google Scholar]
- Burton GJ, Fowden AL, Thornburg KL. Placental Origins of Chronic Disease. Physiol Rev. 2016;96(4):1509–1565. doi: 10.1152/physrev.00029.2015. [DOI] [PMC free article] [PubMed] [Google Scholar]
- Srinivasan AP, Omprakash BOP, Lavanya K, Subbulakshmi Murugesan P, Kandaswamy S. A prospective study of villous capillary lesions in complicated pregnancies. J Pregnancy. 2014;2014:193925. doi: 10.1155/2014/193925. [DOI] [PMC free article] [PubMed] [Google Scholar]
- Jones CJP, Desoye G. A new possible function for placental pericytes. Cells Tissues Organs. 2011;194(1):76–84. doi: 10.1159/000322394. [DOI] [PubMed] [Google Scholar]
- Maly A, Goshen G, Sela J, Pinelis A, Stark M, Maly B. Histomorphometric study of placental villi vascular volume in toxemia and diabetes. Hum Pathol. 2005;36(10):1074–1079. doi: 10.1016/j.humpath.2005.07.021. [DOI] [PubMed] [Google Scholar]
- Ellery PM, Cindrova-Davies T, Jauniaux E, Ferguson-Smith AC, Burton GJ. Evidence for transcriptional activity in the syncytiotrophoblast of the human placenta. Placenta. 2009;30(4):329–334. doi: 10.1016/j.placenta.2009.01.002. [DOI] [PMC free article] [PubMed] [Google Scholar]
- Jirkovská M, Kubínová L, Janáček J, Kaláb J. 3-D study of vessels in peripheral placental villi. Image Anal Stereol. 2011;26(3):165–168. [Google Scholar]
- Pearce P, et al. Image-Based Modeling of Blood Flow and Oxygen Transfer in Feto-Placental Capillaries. PLOS ONE. 2016;11(10):0165369. doi: 10.1371/journal.pone.0165369. [DOI] [PMC free article] [PubMed] [Google Scholar]
- Plitman Mayo R, Olsthoorn J, Charnock-Jones DS, Burton GJ, Oyen ML. Computational modeling of the structure-function relationship in human placental terminal villi. J Biomech. 2016;49(16):3780–3787. doi: 10.1016/j.jbiomech.2016.10.001. [DOI] [PubMed] [Google Scholar]
- Mayhew TM. A stereological perspective on placental morphology in normal and complicated pregnancies. J Anat. 2009;215(1):77–90. doi: 10.1111/j.1469-7580.2008.00994.x. [DOI] [PMC free article] [PubMed] [Google Scholar]
- Teasdale F. Gestational changes in the functional structure of the human placenta in relation to fetal growth: a morphometric study. Am J Obstet Gynecol. 1980;137(5):560–568. doi: 10.1016/0002-9378(80)90696-1. [DOI] [PubMed] [Google Scholar]
- Richardson DS, Lichtman JW. Clarifying Tissue Clearing. Cell. 2015;162(2):246–257. doi: 10.1016/j.cell.2015.06.067. [DOI] [PMC free article] [PubMed] [Google Scholar]
- Dulbecco R, Vogt M. Plaque formation and isolation of pure lines with poliomyelitis viruses. J Exp Med. 1954;99(2):167–182. doi: 10.1084/jem.99.2.167. [DOI] [PMC free article] [PubMed] [Google Scholar]
- Gill JS, Salafia CM, Grebenkov D, Vvedensky DD. Modeling oxygen transport in human placental terminal villi. J Theor Biol. 2011;291:33–41. doi: 10.1016/j.jtbi.2011.09.008. [DOI] [PubMed] [Google Scholar]
- Plitman Mayo R, Charnock-Jones DS, Burton GJ, Oyen ML. Three-dimensional modeling of human placental terminal villi. Placenta. 2016;43:54–60. doi: 10.1016/j.placenta.2016.05.001. [DOI] [PubMed] [Google Scholar]


