Abstract
This study uses MedPAR data to characterize trends in use of skilled nursing facilities (SNFs) and inpatient rehabilitation facilities (IRFs) after acute care hospitalizations and trends in hospital and SNF/IRF lengths of stay among Medicare beneficiaries.
Since Medicare’s adoption of the inpatient prospective payment system in 1983, hospitals have sought ways to reduce costs, resulting in a decrease in hospital length of stay and an increase in the use of institutional post–acute care, making it a major Medicare expenditure. Since the Affordable Care Act passed in 2010, Medicare has implemented payment reforms designed to make hospitals and clinicians accountable for the cost and quality of care delivered. Examples include the Hospital Readmissions Reduction Program (implemented in 2012), accountable care organizations (2012), and bundled payments (2013). How these payment reforms affect the use of post–acute care is unknown. The expense of post–acute care may diminish its use under cost-containment incentives. Alternatively, pressure to reduce costs by reducing unnecessary readmissions may encourage its use. Our objective was to document recent trends in use of institutional post–acute care (including the 2 most common sites: skilled nursing facilities [SNFs] and inpatient rehabilitation facilities [IRFs]) and, simultaneously, hospital and post–acute care length of stay.
Methods
We used the 100% MedPAR file to identify Medicare beneficiaries discharged alive from an acute care hospital between January 2000 and December 2015 (n = 199 069 327), excluding discharges younger than 65 years or discharged to hospice (n = 39 036 324 or 19.6%), enrolled in Medicare Advantage (n = 20 250 852 or 10.2%), or discharged to institutional settings other than SNF or IRF (eg, psychiatric hospital; n = 1 808 518 or 0.9%). We identified each discharge’s first posthospitalization destination (home vs institutional post–acute care) and the number of days in the hospital and post–acute care. We used multivariable regression to predict risk-adjusted annual outcomes adjusted for age, sex, race, and 31 Elixhauser comorbidities. We tested for the statistical significance of differences over time using t tests (2-tailed with an α of .05). All analyses were performed using Stata (StataCorp), version 15. This study was approved by the institutional review board of the University of Pennsylvania with a waiver of informed consent.
Results
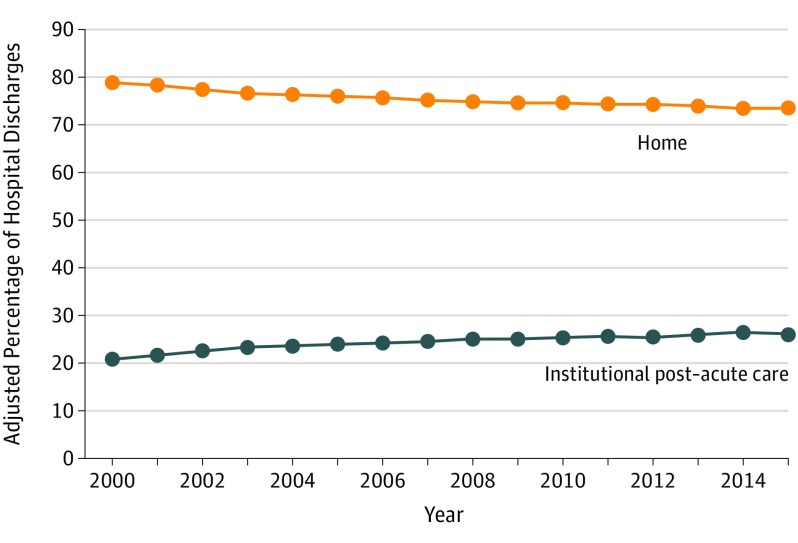
Among 137 973 633 hospital discharges, 20.3% were discharged to SNFs and 3.7% were discharged to IRFs. The adjusted percentage of hospital discharges to post–acute care increased from 21.0% in 2000 to 26.3% in 2015 (increase of 5.36 percentage points [95% CI, 5.32 to 5.40]; P <.001), whereas the adjusted percentage of discharges home decreased from 79.0% in 2000 to 73.6% in 2015 (decrease of 5.36 percentage points [95% CI ,−5.40 to −5.32]; P <.001) (Figure 1).
Figure 1. Proportion of Medicare Beneficiaries Discharged to Institutional Post–Acute Care vs Discharged Home.
Estimates are adjusted for patient age, sex, race, and Elixhauser comorbidities. The median number of hospital discharges to home per year was 6 664 718 (interquartile range [IQR], 5 768 018-7 367 173) and the median number of discharges to post–acute care per year was 2 151 959 (IQR, 1 978 709-2 199 801).
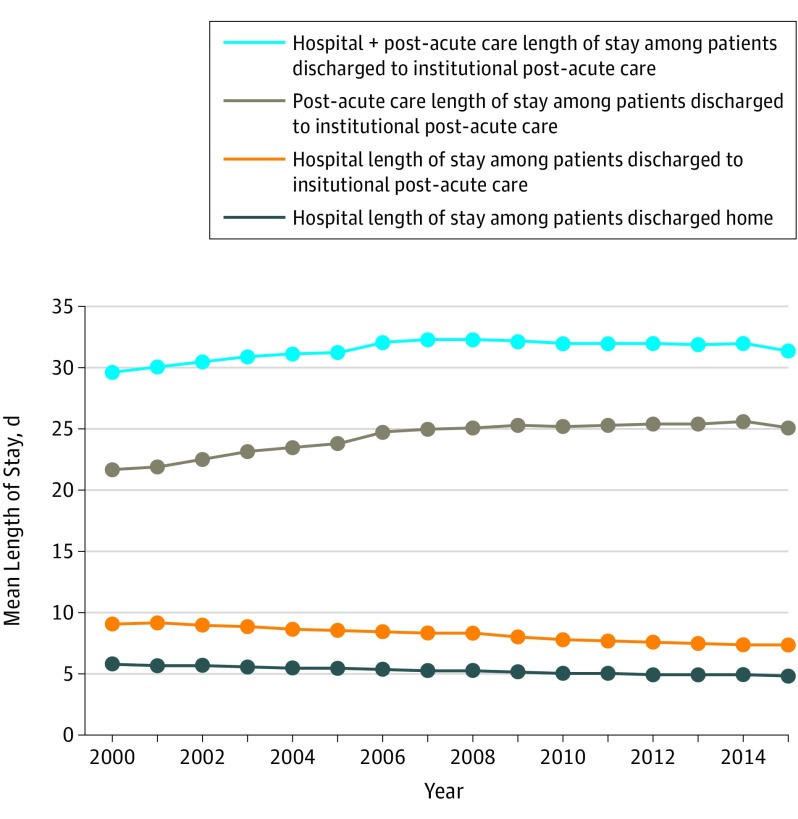
Among patients discharged to post–acute care, hospital length of stay decreased from 9.0 days in 2000 to 7.3 days in 2015 (decrease of 1.70 days [95% CI, −1.71 to −1.69]; P <.001) (Figure 2). Among patients discharged home, hospital stays decreased from 5.7 days in 2000 to 4.8 days in 2015 (decrease of −0.91 days [95% CI, −0.92 to −0.91]; P <.001). At the same time, length of stay in post–acute care increased from 21.7 days in 2000 to 25.7 days in 2014 (increase of 3.98 days [95% CI, 3.93 to 4.02]; P < .001) and then decreased to 25.1 days in 2015 (decrease of 0.54 days [95% CI, 0.50 to 0.59]; P < .001).
Figure 2. Mean Length of Stay in the Hospital, in Post–Acute Care, and in the Combination of Hospital Plus Post–Acute Care.
Estimates are adjusted for patient age, sex, race, and Elixhauser comorbidities. The median number of hospital discharges to home per year was 6 664 718 (interquartile range [IQR], 5 768 018-7 367 173) and the median number of discharges to post–acute care per year was 2 151 959 (IQR, 1 978 709-2 199 801).
Discussion
The use of institutional post–acute care increased between 2000 and 2015 and was accompanied by increasing length of post–acute care stays through 2014. These trends did not appear to change when payment reform was implemented under the Affordable Care Act. SNFs (which accounted for 85% of institutional post–acute care) are paid per diem and thus may have strong incentives to maintain longer lengths of stay. This study was limited by the exclusion of Medicare Advantage enrollees. If policy incentives are to effectively reduce SNF length of stay, they might need to align SNF payment with the goal of reducing SNF use.
It is uncertain whether the use of post–acute care benefits patients. Despite its proliferation, there is little evidence that post–acute care improves key patient outcomes—preventing rehospitalizations or improving functional recovery. Further investigating how post–acute care affects patient outcomes is essential.
Section Editor: Jody W. Zylke, MD, Deputy Editor.
References
- 1.Burke RE, Juarez-Colunga E, Levy C, Prochazka AV, Coleman EA, Ginde AA. Rise of post–acute care facilities as a discharge destination of US hospitalizations. JAMA Intern Med. 2015;175(2):295-296. [DOI] [PubMed] [Google Scholar]
- 2.MedPAC Data Book: Health Care Spending and the Medicare Program. Washington, DC: Medicare Payment Advisory Commission; 2017. [Google Scholar]
- 3.Mechanic R. Post–acute care—the next frontier for controlling Medicare spending. N Engl J Med. 2014;370(8):692-694. [DOI] [PubMed] [Google Scholar]
- 4.Dummit LA, Kahvecioglu D, Marrufo G, et al. Association between hospital participation in a medicare bundled payment initiative and payments and quality outcomes for lower extremity joint replacement episodes. JAMA. 2016;316(12):1267-1278. [DOI] [PubMed] [Google Scholar]
- 5.Centers for Medicare & Medicaid Services MedPAR RIF. https://www.resdac.org/cms-data/files/medpar-rif. Accessed February 9, 2018.


