Abstract
The LSL-KrasG12D/+; LSL-Trp53R172H/+; Pdx-1-Cre (KPC) mouse model represents an established and frequently used transgenic model to evaluate novel therapies in pancreatic cancer. Tumor onset is variable in the KPC model between 8 weeks and several months. Therefore, non-invasive imaging tools are required to screen for tumor onset and monitor for response to treatment. To address this issue, different approaches have emerged over the last years. High resolution ultrasound has major advantages such as non-invasiveness, fast session times and a high image resolution without radiation exposure. However, ultrasound in mice is not trivial and sufficient anatomical knowledge and practical skills are required to successfully perform high resolution ultrasound in preclinical pancreatic cancer models. With the following article, a detailed hands-on guide for abdominal ultrasound in murine models with a particular focus on endogenous pancreatic cancer models is presented. Furthermore, a summary of common mistakes and how to avoid them is provided.
Keywords: Cancer Research, Issue 134, KPC mouse model, high-resolution ultrasound, pancreatic ductal adenocarcinoma, pancreas, cancer, tumor quantification, preclinical trial
Introduction
Genetically engineered mouse models have gained an increasing importance in cancer research due to their ability to closely recapitulate the complex nature of human carcinogenesis1,2,3. One of the most frequently used models to study pancreatic cancer development, progression and therapeutic response is characterized by an activating mutation in the Kras oncogene combined with an inactivation of the tumor suppressor p534. This LSL-KrasG12D/+; LSL-Trp53R172H/+; Pdx-1-Cre (KPC) mouse model mimics the step-wise progression from pre-invasive pancreatic intraepithelial neoplasia (PanIN) lesions to invasive carcinoma. Phenotypically, nearly all mice develop PDAC within the first six months after birth. However, compared to transplanted models, the KPC model reveals a highly variable tumor onset from 8 weeks to several months4. Once pancreatic tumors reach a certain size (5-9 mm in diameter), tumor growth accelerates rapidly and mice will have to be enrolled in preclinical trials5. Therefore, the exact detection of tumor onset and tumor size is an essential prerequisite for preclinical study logistics and therapy monitoring. In general, several approaches like magnetic resonance imaging (MRI)6, computed tomography scanning7,8,9 or high resolution ultrasound can be employed to conduct tumor screening and therapy10. Each technique has its advantages and drawbacks. Although MRI-or computed tomography (CT) -imaging allows high resolution data acquisition as well as accurate volume calculation, prolonged examination time under general sedation, and very expensive equipment is required, and does not permit frequent scanning over a long period of time. In contrast, small animal ultrasonography is an established method that can be employed to screen for abdominal pathologies in mice11. Advantages of this imaging method are short scanning times, high resolution, and the possibility to use doppler ultrasound or contrast enhanced ultrasound (CEUS) to visualize perfusion of organs in parallel. However, anatomical knowledge, 3D imagination and thorough practical training are required for correct image interpretation.
In the following article, a detailed protocol for utilizing high resolution ultrasound in the KPC model is provided. Furthermore, standard ultrasound images are depicted and labelled with organ structures to facilitate orientation for the investigator.
Protocol
This protocol is in accordance with the animal care guidelines at the University Medical Centre Goettingen, Germany (33.9-42502-04-15/2056). Depending on specific requirements of individual animal review boards, some of the protocol steps could be modified accordingly.
1. Abdominal Palpation of KPC Mice
- To avoid unnecessary ultrasound scans, palpate the mouse abdomen to identify mice which might possibly bear an intraabdominal lesion and should subsequently undergo abdominal ultrasound.
- Perform abdominal palpation weekly starting from 8 weeks of age in the KPC mouse model. High resolution ultrasound can also be applied in transplanted tumor models (e.g., orthotopics) or other genetically engineered mouse models. NOTE: Depending on tumor kinetics and study goal (prevention study, therapeutic intervention study), detection of very small tumors (1-2 mm) is feasible to monitor tumor onset before tumors can be palpated.
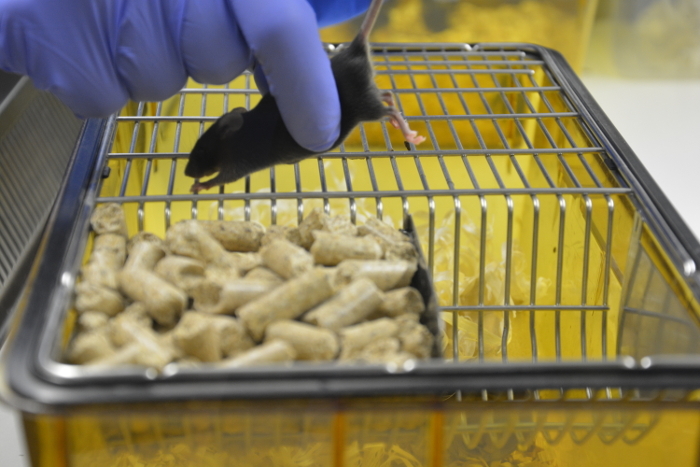
Place the mouse on the cage grid and gently lift the mouse by the tail and palpate the abdomen by gently going up and down with index and thumb of the non-fixing hand (Figure 1).
If the mouse tolerates soft palpation, proceed by slowly increasing the pressure. A larger resistance can easily be detected in the upper and lower abdomen. Sometimes, hard feces can be mistakenly interpreted as a tumor mass.
2. Preparation of Work Space
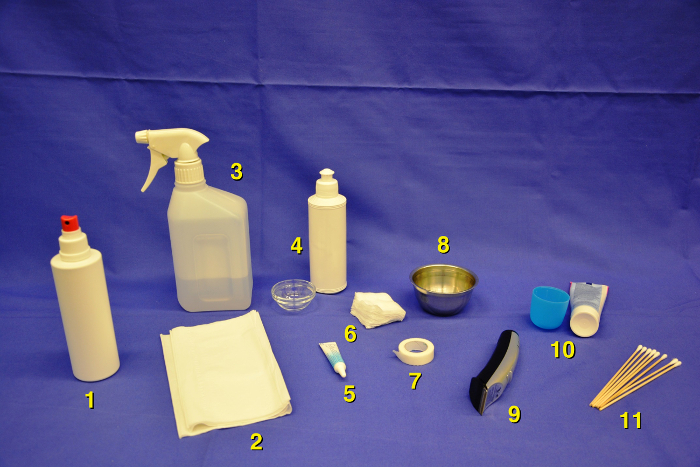
Provide space for at least three different work units: pre-scan area, scanning stage and recovery cage. Required material are depicted in Figure 2.
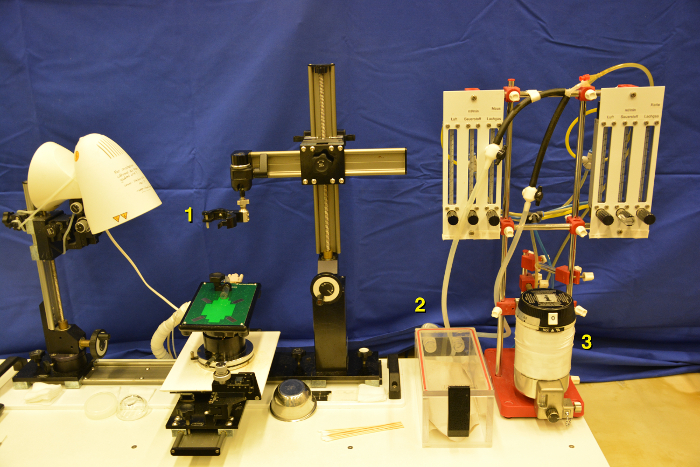
Clean the main working plate (for example with 70% Ethanol) and switch on the heating platform prior to scanning (Figure 3). Make sure that the target temperature of 38-40 °C is reached before the first mouse is transferred.
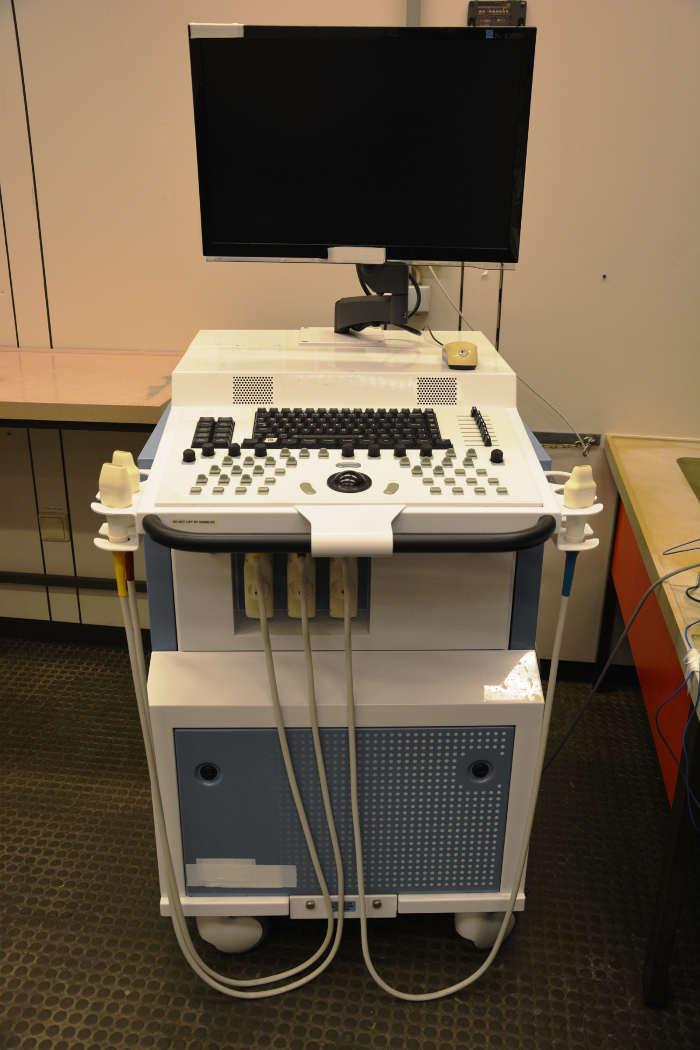
Switch on the ultrasound machine and create a new folder for the acquired data (Figure 4). The B-mode setting is applied for abdominal imaging. Further, ensure the abdominal transducer is plugged in the active port of the machine. Fix the transducer head at the top of the working stage by using the transducer mounting system.
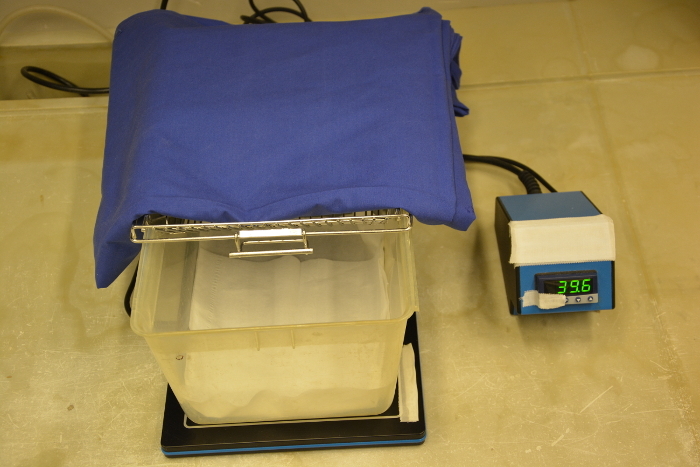
Prepare a recovery cage on a heating plate or thermal mat (or use heating lamp) to ensure post-procedural thermoregulation and speedy recovery of scanned mice. Put a thin layer of tissue as cushion at the bottom of this cage to avoid aspiration of bedding with the risk of suffocation (Figure 5).
3. Inhalation Anesthesia
- Proceed by putting a mouse into the induction chamber. Open the valve for gas carrier flow (1 L/min oxygen or air) and set the isoflurane concentration to 4% allowing a slowly increasing saturation of the induction chamber. Make sure that proper isoflurane scavenging (passive or active filtering) is in place. After about 2-4 min the mouse will usually be under deep sedation.
- Maintain sedation by administering 2% isoflurane through the nose cone on the working stage.
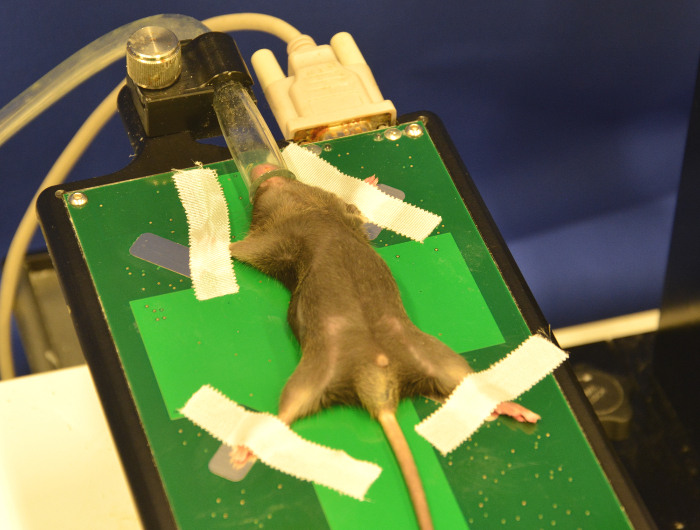
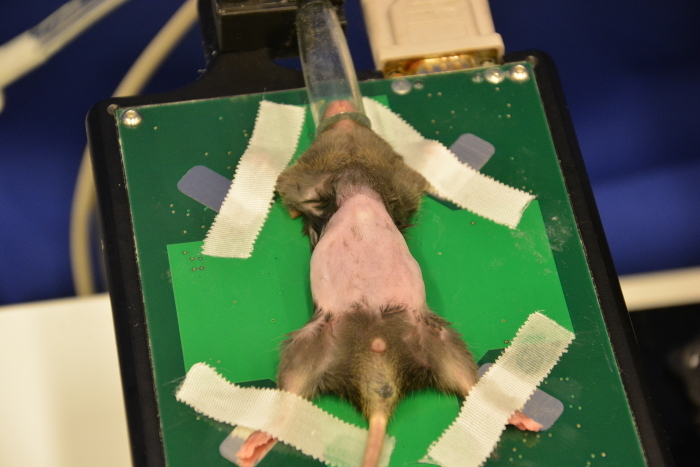
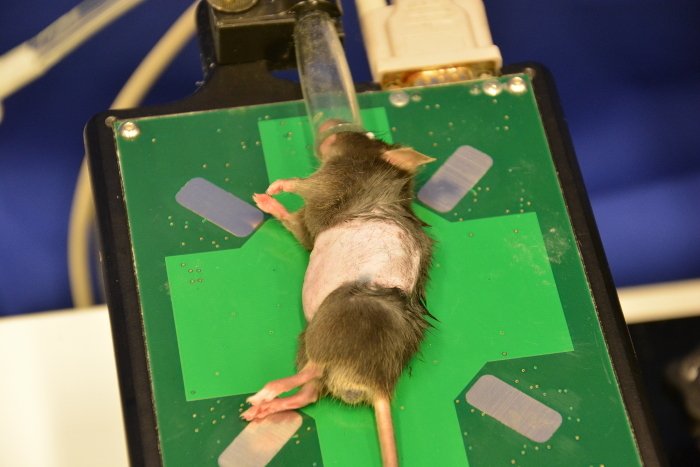
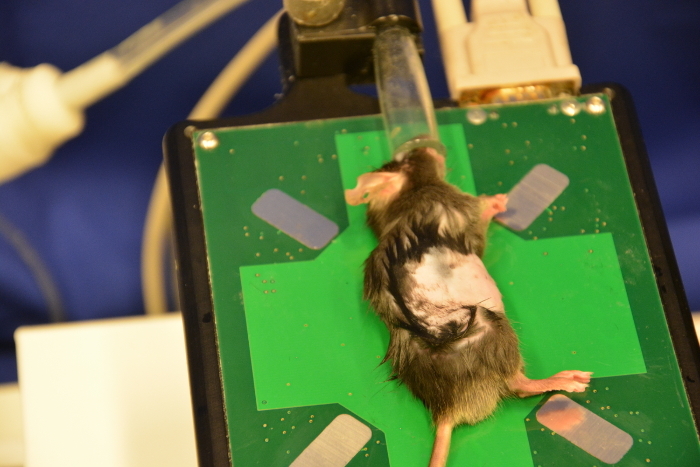
Carefully transfer the animal from the induction chamber to the working stage. Check the nose cone for a constant gas flow. Put the mouse snout in the nose cone of the anesthesia line outlet. The regular position for the initial scanning is supine position. The mouse can also be placed on its right or left side to improve visibility of pancreatic head or tail tumors (Figure 6).
Although abdominal ultrasound is not painful per se, perform the foot pinch test as an indicator for a pain free condition and deep anesthetic state. If the mouse is still active or actively moving around, retransfer the animal back in the induction chamber for repeated and prolonged induction.
Use eye protection ointment to prevent corneal injuries due to fluid loss.
During anesthesia, use a monitoring system. However, ECG and rectal temperature is not regularly used for abdominal ultrasound scanning. Importantly, mice lose the ability to thermoregulate under anesthesia. Therefore, closely observe clinical signs for hypothermia or respiratory distress such as gasping or apnea. If any symptom is obvious stop isoflurane and place the mouse in the recovery cage immediately.
4. Ultrasound Settings
Switch on the ultrasound system as described by manufacturer`s instructions. Make sure the primary setting is put on general imaging with the abdominal package activated. Usually B-Mode-imaging is used for data acquisition as a standard.
Achieve optimized image quality with following parameters: frequency 40 MHz, 2D-gain 25-30 dB, image depth 10 mm, image width 10 mm, 3 focal zones with center between 3-6 mm.
5. Mouse Preparation
Fix the upper and lower extremity using adhesive tape. Be as careful as possible to avoid any injury to the animal due to fixation (Figure 7).
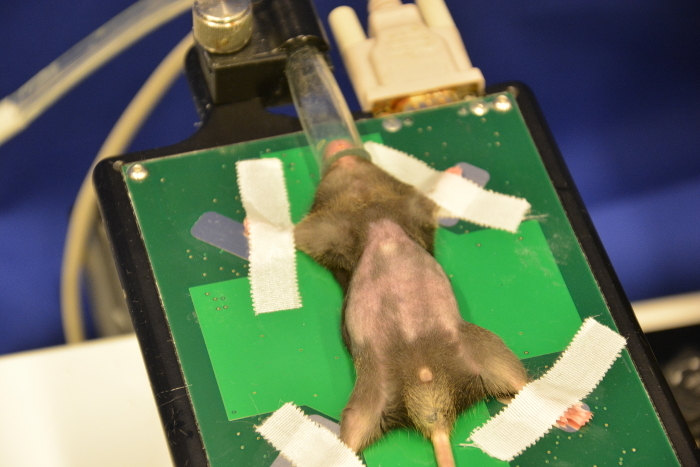
Remove all abdominal fur using electronic pet clippers. Due to the fur texture, start from the lower abdomen up to the ribcage. Take care at the processus xiphoideus to avoid skin injuries in this area. NOTE: Mouse fur reflects ultrasound waves and decreases visibility.
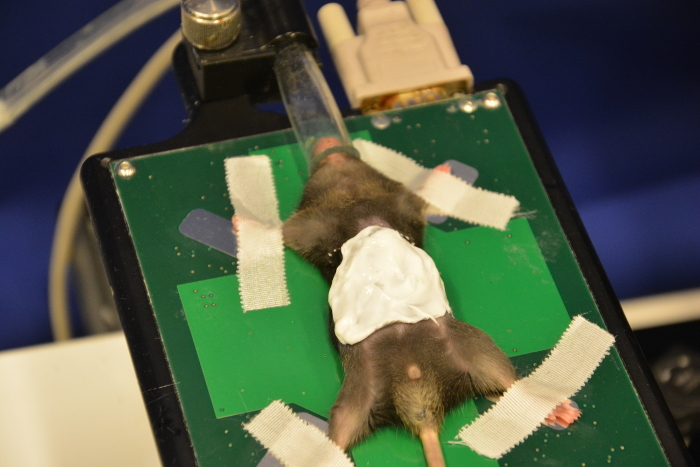
Use depilatory cream to perform an optimized skin preparation and complete removal of fur. Administer a thin layer of cream onto the shaved abdomen using cotton tips (Figure 8). Remove the cream (after 30 s or later depending on the cream used) with dry tissues followed by plenty of water to completely remove all remnants (Figure 9, Figure 10, Figure 11). Cream remnants could cause skin and mucosa irritations after the ultrasound and may thus affect the health.
To ensure adequate scanning conditions apply plenty of ultrasound gel onto the abdomen (Figure 12). Usually, warm ultrasound gel is used in order to minimize hypothermia for the mouse.
Manually apply a thin layer of ultrasound gel on the transducer head. Perform a test by touching on the transducer end with the notch. At the screen a signal at the left upper side can be seen if the transducer is correctly positioned.
6. Abdominal Ultrasound
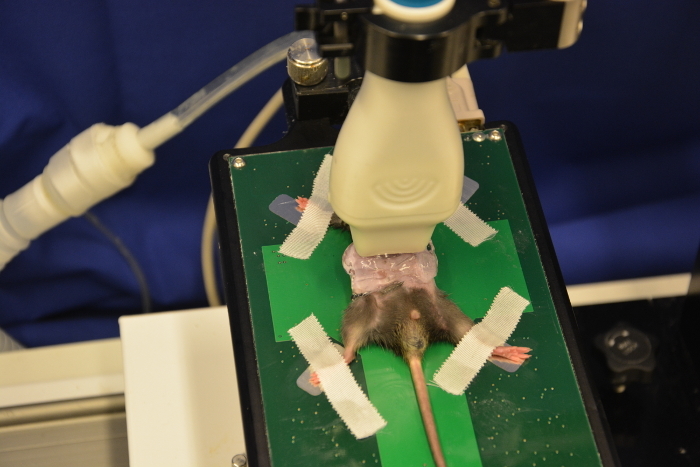
Adjust the transducer onto the abdomen using firm pressure. Heavy compression of the mouse abdomen may lead to respiratory or circulatory impairment and should be avoided.
Scan up and down. Adjust the frame of the working platform and the wheels for x-axis and y-axis.
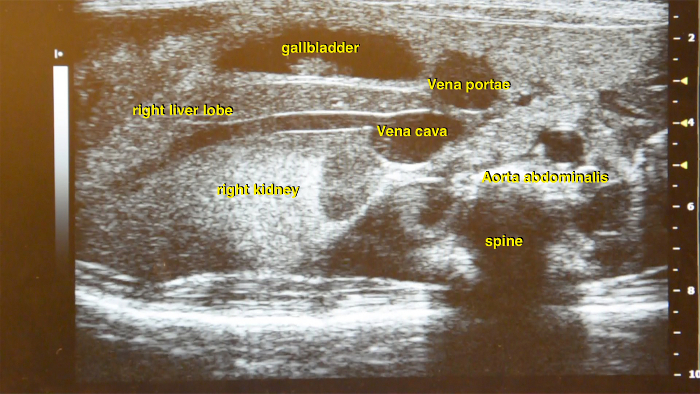
As the first step identify both kidneys. Usually they appear as hyperechogenic homogenous structures in the lower abdomen. The connected vena renalis can be easily found which further leads to the vena cava inferior (Figure 13).
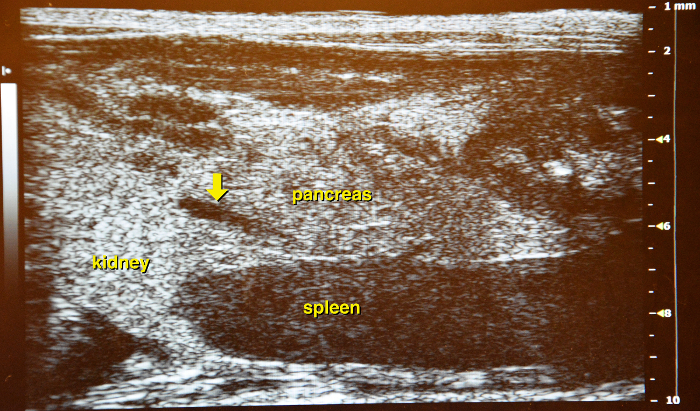
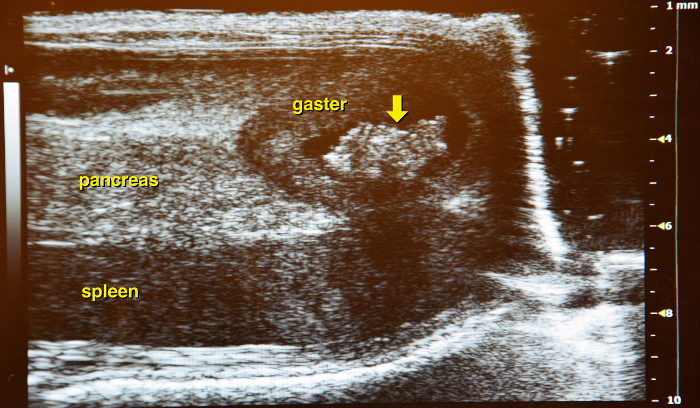
Use the vena lienalis serves as landmark vessel for the pancreas. Attempt to distinguish between vena renalis and vena lienalis. Upon detection of the vena lienalis the pancreas can be exactly localized. The normal pancreas is rather a membrane spread through the abdominal cavity than a solid structure (Figure 14 and Figure 15).
7. Pancreatic Tumor Detection and Volume Evaluation
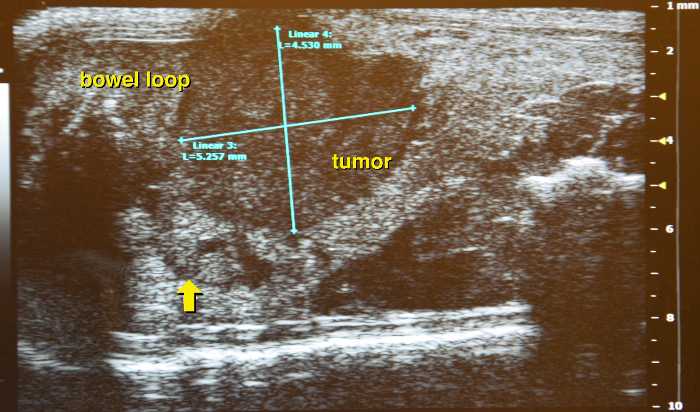
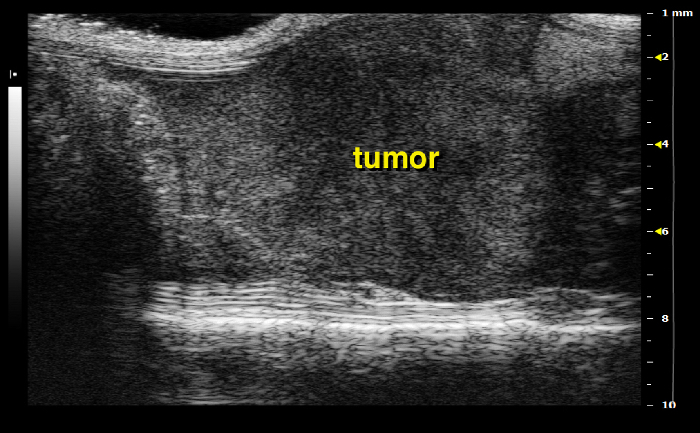
Identify pancreatic lesions from all surrounding structures. They generally appear as hypoechoic inhomogeneous round or elongated tissue masses (Figure 16). The tumor is usually firm and can hardly be compressed by the scan head. Note, from time to time it might be tricky to clearly distinguish between a tumor and a small bowel loop. Pay attention to the bowel peristalsis that should not be observed in pancreatic tumors.
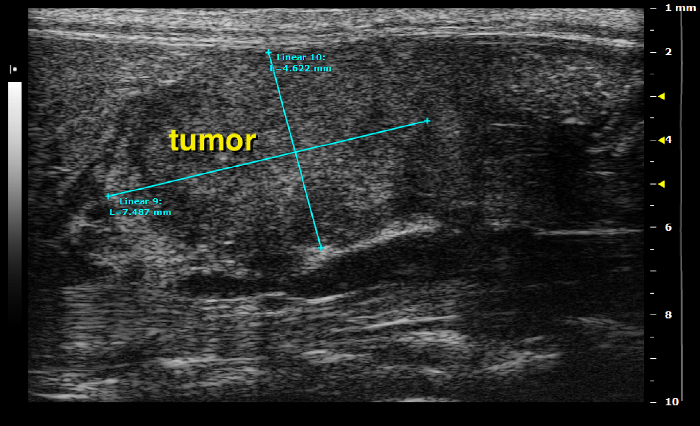
Upon tumor detection screen up and down to get an impression of the total size and measure the largest diameter by using the ultrasound caliper. Once a suitable image is found, freeze the screen and use the measure tool to precisely determine the tumor size. Note, for later use it will be important to differentiate whether a tumor is localized in the tail, body or head of the pancreas.
Before changing back to live mode, make sure to save pictures to record the work. Note, while freezing the image it might happen that the adjustment wheel is released, and the ultrasound probe is even more pressed to the mouse abdomen. Therefore, fix the adjustment of the compression before changing the mode to freeze.
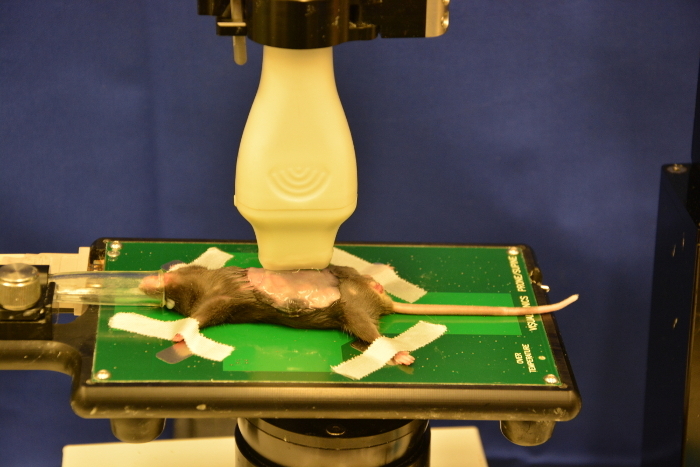
After finishing the measurement of the first plane either rotate the scan head by 90° in longitudinal position (Figure 17), or turn the mouse to its side, to detect the tumors' longitudinal expansion. Some tumors may require changing the position of the mouse for adequate visibility. For pancreatic tail tumors, the mouse can be placed on its right side (Figure 10 and Figure 19), for pancreatic head tumors on its left side (Figure 11 and Figure 20).
8. Quantification of Tumor Volume
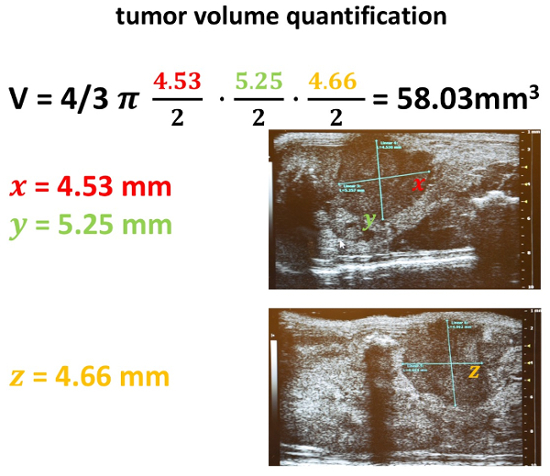
Note: One major aim of all efforts is the correct determination of tumor volume. Although there are several techniques available a calculation method including the formula of an ellipsoid is preferred at the University Medical Center Goettingen.
Equipped with all three previously obtained diameters, calculate the approximate volume of the corresponding tumor (Figure 21).
Alternatively, use a motor system of the scan head to perform an automated scan of the tumor region with subsequent volume calculation and 3-D-reconstruction.
9. Recovery
After the scanning, carefully remove all adhesive tape and carefully remove all ultrasound gel with dry tissue.
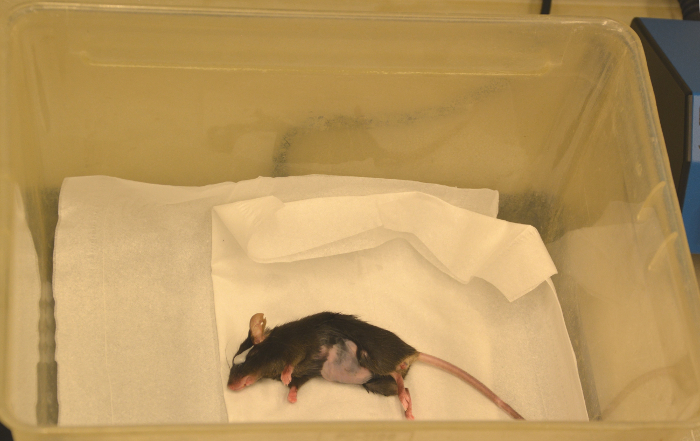
Carefully transfer the mouse into the recovery cage ( Figure 21). Avoid any covering tissue at the mouse´s face that might cause respiratory impairment. A side position for recovery should be preferred.
Representative Results
Ultrasound imaging is a versatile and non-invasive technique that is used to address several issues in murine models of human diseases. Compared to all other imaging approaches major advantages are high-throughput, cost efficiency, short acquisition time and real-time imaging. However, this tool needs expertise to generate accurate, high quality images. Particularly in the case of unwanted artefacts at least some experience with ultrasound imaging in general is very helpful. In relation to pancreatic cancer this tool allows to determine tumor onset, progression and response to therapy. Furthermore, by measurement of different diameters it allows an exact quantification of the tumor volume over time. This study demonstrates and describes in detail how to use high resolution ultrasound imaging as a screening tool for pancreatic cancer in genetically engineered mouse models.
Figure 1: Abdominal palpation. Fixing hand gently pulls up tail while non-fixing hand starts procedure by gently moving up and down. Please click here to view a larger version of this figure.
Figure 2: Pre-scanning area with overview of all needed items. skin disinfection (1), gauze sponges (2), 70% isopropanol (3), ultrasound gel with glass bowel (4), ophthalmic ointment (5), tissue wipes (6), medical tape (7), water container (8), pet clippers (9) depilatory cream with small container (10), cotton tips to apply eye ointment or ultrasound gel (11). Please click here to view a larger version of this figure.
Figure 3: Scanning area with Isoflurane vaporizer. Working stage with adjustable probe holder (1), induction chamber (2) including isoflurane vaporizer (3). Please click here to view a larger version of this figure.
Figure 4: Ultrasound device. The ultrasound system is supplied with three ultrasound probes and corresponding ports. Keyboard and PC mouse are included in the system. Please click here to view a larger version of this figure.
Figure 5: Recovery cage. The bottom of the cage is prepared with thin tissue and pre-heated to allow for sufficient heating after the scanning procedure. The temperature is shown in Celsius (C°). Please click here to view a larger version of this figure.
Figure 6: Fixed mouse on working stage. The mouse is placed in a supine position on the working stage. Please click here to view a larger version of this figure.
Figure 7: Shaved mouse after using pet clippers. The abdominal fur is cut, but smaller parts of hair persist which regularly cause artefacts. Please click here to view a larger version of this figure.
Figure 8: Use of depilatory cream. Administer a thin layer of depilatory cream on the shaved region of the abdomen. Please click here to view a larger version of this figure.
Figure 9: Completely shaved abdomen of a mouse. Plenty of water is used to rinse off all cream remnants, only a complete removal of fur allows an optimal scanning procedure. Please click here to view a larger version of this figure.
Figure 10: Right side of mouse. Optimal orientation for scanning pancreatic tail tumors. Please click here to view a larger version of this figure.
Figure 11: Left side of mouse. Optimal orientation for scanning pancreatic head tumors. Please click here to view a larger version of this figure.
Figure 12: Ultrasound probe on mouse abdomen. To prevent any injury to the mouse do not use too much pressure. Please click here to view a larger version of this figure.
Figure 13: Ultrasound image of the right abdominal part. Main vessel structures such as abdominal aorta and vena cava inferior are located in close proximity to the kidney and liver. Please click here to view a larger version of this figure.
Figure 14: Ultrasound image of the left abdominal part. Between left kidney and spleen the membranous structure of the pancreas is located, as a landmark, the vena lienalis is running through the organ (yellow arrow) and can be used as a guiding structure. Please click here to view a larger version of this figure.
Figure 15: Border of the pancreas. The stomach (with contents) marks the left border of the pancreas (yellow arrow). Please click here to view a larger version of this figure.
Figure 16: Identifying pancreatic tumor. Supine position with a hypodense appearing round pancreatic tumor, arrow indicates the border of the surrounding normal tissue. Please click here to view a larger version of this figure.
Figure 17: Longitudinal position. Determining the length of the pancreatic tumor. Please click here to view a larger version of this figure.
Figure 18: Longitudinal scan of pancreatic tumor. Interference caused by air filled duodenum. Please click here to view a larger version of this figure.
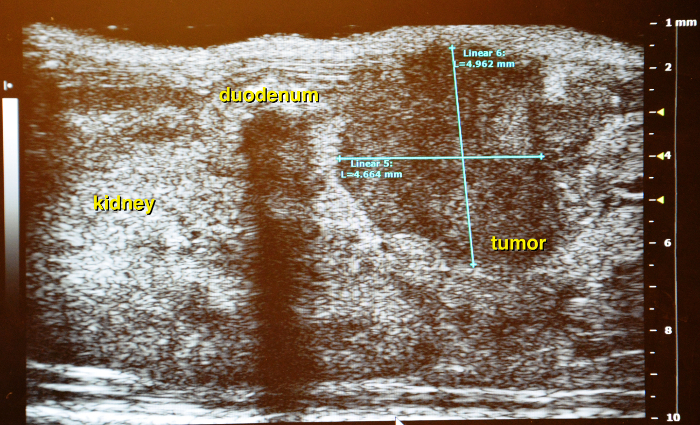
Figure 19: Right side of the mouse: pancreatic tail tumor Please click here to view a larger version of this figure.
Figure 20: Left side of the mouse: pancreatic head tumor Please click here to view a larger version of this figure.
Figure 21: Tumor volume quantification. After acquisition of all three diameters in the previously indicated two scanning positions, a volume calculation is performed. Therefore, the formula of an ellipsoid is used: 4/3 π a/2* b/2* c/2. Please click here to view a larger version of this figure.
Figure 22: Recovery. After scanning the animal is transferred to a heating plate until fully recovered, notice the white eye ointment at the mouse`s eye. Please click here to view a larger version of this figure.
Discussion
With this protocol, a detailed description for quantifying pancreatic tumors using high-resolution abdominal ultrasound imaging in genetically engineered mouse models is provided. Recently, Sastra et al. published a detailed description how to quantify pancreatic tumors in mouse models, but no visualized instructions about the preparation and handling as prerequisite for all further steps were shown11. The overall goal of this manuscript is to provide a comprehensive visual guide for high-resolution ultrasound in mice.
Although we focus our description on endogenous pancreatic tumors in genetically engineered mice, this method can also be used for orthotopic transplantation models. For orthotopic models, even very small tumors up to 1-2 mm can be detected abdominally to investigate the take rate and tumor onset. As abdominal palpation can be subjective and difficult to reproduce, ultrasound screening can also be applied without prior palpation in the KPC model to detect the onset of very small pancreatic tumors. Furthermore, abdominal structures such as small bowel loops filled with air may be superimposed. In this regard, it might be helpful to change the position of the animal on the working stage. Most tumors can be visualized in a supine position; however, some tumors may only be detected when the mouse is placed on its left side (pancreatic head tumors) or right side (pancreatic tail tumors). Thus, an adequate positioning of the mouse is critical to increase efficient visibility.
Insufficient visibility of abdominal organs or anatomical variability might occur. To increase visibility and resolution of the ultrasound images, brightness and contrast settings as well as the focus should be altered accordingly. Image artefacts might be due to defective/wrong probe, incomplete removal of mouse fur, insufficient amounts of ultrasound gel or insufficient contact pressure of the probe with the mouse abdomen. Furthermore, slightly tilting the probe may also considerably improve visibility.
Furthermore, tumor growth kinetics can be monitored longitudinally by small animal ultrasound. Major advantages of the technique include low costs (given the availability of an ultrasound machine), no radiation exposure, short scanning time, and thus little strain for mice. Especially in light of longitudinal cancer studies, repeated scanning is easy to perform and puts little strain on the animals without the need of lengthy periods of sedation or anesthesia that is necessary for small animal CT or MRI scans.
Since technical advances with more powerful ultrasound systems are currently being developed with improved resolution and increasingly automated image optimization tools, small animal, high resolution ultrasound will be used more often in various preclinical disciplines in the future. Critical steps within the protocol include correct mouse preparation and positioning, as well as correct identification of abdominal organs and vessels.
High resolution ultrasound is a valuable tool for the detection and quantification of pancreatic tumors in genetically engineered and orthotopic mouse models. Compared to other established imagining techniques this ultrasound-based method combines fast session times and cost efficiency. Since the correct acquisition and interpretation of ultrasound images requires proper hands-on training and experience this video protocol serves as a detailed guideline for all aspects in pancreatic cancer models.
Disclosures
The authors have nothing to disclose.
Acknowledgments
This research was supported by the Deutsche Krebshilfe (Max Eder Group to AN: 110972), a DGVS doctoral thesis scholarship (to SMB), and an Else-Kröner-Fresenius-Foundation scholarship (to RGG) at the University Medical Center Goettingen. We thank Jutta Blumberg and Ulrike Wegner for expert technical assistance. We also thank all animal technicians at the animal facility of the University Medical Center Goettingen for mouse keeping. All experiments were performed according to German animal welfare regulations.
References
- Kersten K, de Visser KE, van Miltenburg MH, Jonkers J. Genetically engineered mouse models in oncology research and cancer medicine. EMBO Molecular Medicine. 2017;9(2):137–153. doi: 10.15252/emmm.201606857. [DOI] [PMC free article] [PubMed] [Google Scholar]
- Olive KP, Politi K. Translational therapeutics in genetically engineered mouse models of cancer. 2. Cold Spring Harbor; 2014. pp. 131–143. [DOI] [PubMed] [Google Scholar]
- Westphalen CB, Olive KP. Genetically engineered mouse models of pancreatic cancer. The Cancer Journal. 2012;18(6):502–510. doi: 10.1097/PPO.0b013e31827ab4c4. [DOI] [PMC free article] [PubMed] [Google Scholar]
- Hingorani SR, et al. Trp53R172H and KrasG12D cooperate to promote chromosomal instability and widely metastatic pancreatic ductal adenocarcinoma in mice. Cancer Cell. 2005;7(5):469–483. doi: 10.1016/j.ccr.2005.04.023. [DOI] [PubMed] [Google Scholar]
- Frese KK, et al. nab-Paclitaxel potentiates gemcitabine activity by reducing cytidine deaminase levels in a mouse model of pancreatic cancer. Cancer Discovery. 2012;2(3):260–269. doi: 10.1158/2159-8290.CD-11-0242. [DOI] [PMC free article] [PubMed] [Google Scholar]
- Paredes JL, et al. A non-invasive method of quantifying pancreatic volume in mice using micro-MRI. PLoS One. 2014;9(3):e92263. doi: 10.1371/journal.pone.0092263. [DOI] [PMC free article] [PubMed] [Google Scholar]
- Boj SF, et al. Organoid models of human and mouse ductal pancreatic cancer. Cell. 2015;160(1-2):324–338. doi: 10.1016/j.cell.2014.12.021. [DOI] [PMC free article] [PubMed] [Google Scholar]
- Aung W, et al. Immunotargeting of Integrin alpha6beta4 for Single-Photon Emission Computed Tomography and Near-Infrared Fluorescence Imaging in a Pancreatic Cancer Model. Molecular Imaging. 2016;15 doi: 10.1177/1536012115624917. [DOI] [PMC free article] [PubMed] [Google Scholar]
- Akladios CY, et al. Contribution of microCT structural imaging to preclinical evaluation of hepatocellular carcinoma chemotherapeutics on orthotopic graft in ACI rats. Bulletin du Cancer. 2011;98(2):120–132. doi: 10.1684/bdc.2011.1303. [DOI] [PubMed] [Google Scholar]
- Neesse A, et al. CTGF antagonism with mAb FG-3019 enhances chemotherapy response without increasing drug delivery in murine ductal pancreas cancer. Proceedings of the National Academy of Science USA. 2013;110(30):12325–12330. doi: 10.1073/pnas.1300415110. [DOI] [PMC free article] [PubMed] [Google Scholar]
- Sastra SA, Olive KP. Quantification of murine pancreatic tumors by high-resolution ultrasound. Methods in Molecular Biology. 2013;980:249–266. doi: 10.1007/978-1-62703-287-2_13. [DOI] [PMC free article] [PubMed] [Google Scholar]


