

Abstract
Transposable elements can drive genome evolution, but their enhanced activity is detrimental to the host and therefore must be tightly regulated1. The piwi-interacting small RNAs (piRNAs) pathway is critically important for transposable element regulation, by inducing transcriptional silencing or post-transcriptional decay of mRNAs2. Here, we show that piRNAs and piRNA biogenesis components regulate pre-mRNA splicing of P transposable element transcripts in vivo, leading to the production of the non-transposase-encoding mature mRNA isoform in germ cells. Unexpectedly, we show that the piRNA pathway components do not act to reduce P-element transposon transcript levels during P-M hybrid dysgenesis, a syndrome that affects germline development in Drosophila3,4. Instead, splicing regulation is mechanistically achieved in concert with piRNA-mediated changes to repressive chromatin states, and relies on the function of the Piwi-piRNA complex proteins Asterix/Gtsf15–7 and Panoramix/Silencio8,9, as well as Heterochromatin Protein 1a (Su(var)205/HP1a). Furthermore, we show that this machinery, together with the piRNA Flamenco cluster10, not only controls the accumulation of Gypsy retrotransposon transcripts11 but also regulates splicing of Gypsy mRNAs in cultured ovarian somatic cells, a process required for the production of infectious particles that can lead to heritable transposition events12,13. Our findings identify splicing regulation as a new role and essential function for the Piwi pathway in protecting the genome against transposon mobility, and provide a model system for studying the role of chromatin structure in modulating alternative splicing during development.
Hybrid dysgenesis is a syndrome that affects progeny in a non-reciprocal fashion, being normally restricted to the offspring of crosses in which males carry transposable elements but which females lack (Fig. 1a)3,14. In Drosophila, the dysgenic traits triggered by the P-element DNA transposon (Fig. 1b)4 are restricted to the germline and include chromosomal rearrangements, high rates of mutation, and sterility3. The impairment is most prominent when hybrids are grown at higher temperatures, with adult dysgenic females being completely sterile at 29°C (Fig. 1c)15. Despite the severe phenotypes, little is known about the development of germ cells during P-M dysgenesis. To address this, we characterized germline development in the progeny obtained from reciprocal crosses between w1118 (P-element-devoid strain) and Harwich (P-element-containing strain) at 29°C. In non-dysgenic progeny, germline development progressed normally throughout embryonic and larval stages (Fig. 1d,e), leading to fertile adults (Fig. 1c). While the development of dysgenic germline cells was not disturbed during embryogenesis, germ cells decreased in number during early larval stages, leading to animals with no germ cells by late larval stages (Fig. 1d,e). These results indicate that the detrimental effects elicited by P-element activity are triggered early on during primordial germ cell (PGC) development in dysgenic progeny, leading to premature germ cell death.
Figure 1. P-element DNA transposon splicing is regulated in germ cells during hybrid dysgenesis.
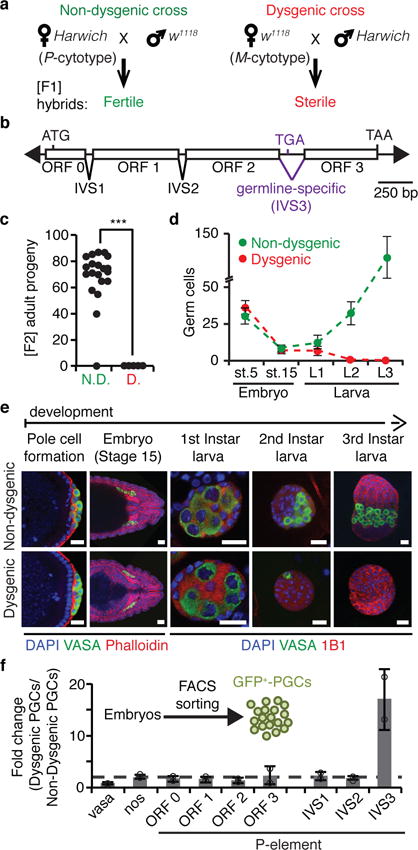
a, P-M hybrid dysgenesis crossing scheme. P-cytotype designates animals containing P-elements, and M-cytotype those lacking them. Harwich strain contains P-element while w1118 strain does not. b, Diagram of P-element DNA transposon. Arrowheads represent terminal inverted repeats; boxes, exons (ORF0-3); inverted triangles, introns (IVS1-3); ATG, start codon; TGA and TAA, stop codons. c, Fertility of non-dysgenic (N.D.) and dysgenic (D.) flies as measured by the number of [F2] adult progeny originated from single [F1] female crosses. (n=20 independent crosses). ***p < 0.0001 (Mann–Whitney–Wilcoxon test). d, Number of germ cells during embryonic and larval stages in non-dysgenic (green) and dysgenic (red) [F1] progeny. Dots represent means ± standard deviation. Stage 5 (st.5): complete germ cell count; Stage 15 (st.15) and later stages: germ cell count/gonad. Embryo st.5 (n=28 embryos); embryo st.15 (n>30 gonads); larva L1 (n>10 gonads); larva L2 (n=7 gonads); larva L3 (n>10 gonads). e, Representative confocal images of germ cell development in non-dysgenic and dysgenic progeny during embryonic and larval stages. Embryos and larvae were stained for: Vasa (germ cells, green); DAPI (DNA, blue); Phalloidin (F-Actin, red; embryo stages); 1B1 (somatic cells and spectrosomes, red; larval stages). Pole cell formation, ~1.5h After Egg Laying (AEL); Embryo Stage 15: 10-12h AEL; First Instar larva: 22-48h AEL; Second Instar larva: 48-72h AEL; Third Instar larva: 72-120h AEL. Scale bars, 20 μM. Experiments were repeated three or more times with similar results. f, RT-qPCR analysis on FACS-sorted primordial germ cells (GFP+-PGCs) from 4- to 20-hours-old embryos generated from reciprocal crosses between w1118 and Harwich. Results are represented as means of fold changes in dysgenic GFP+-PGCs in relation to non-dysgenic GFP+-PGCs ± standard deviation (n=2 independent biological replicate experiments).
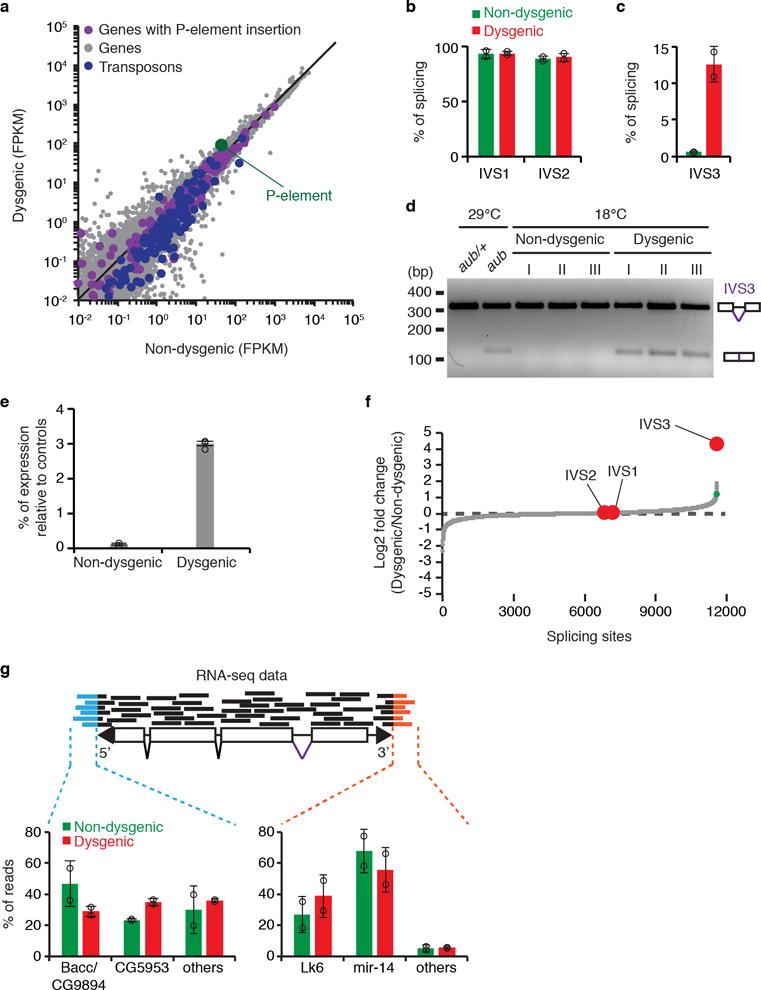
Maternally deposited small RNAs cognate to the P-element are thought to provide the ‘P-cytotype’ by conferring the transgenerationally inherited ability to protect developing germ cells against P-elements16. Small RNA-based transposon regulation is typically mediated either by transcriptional silencing or post-transcriptional clearance of mRNAs, both of which result in a decrease in transposon mRNA accumulation2. To understand how maternally provided small RNAs control P-elements in germ cells, we focused our analysis on embryonic PGCs sorted from 4- to 20-hours-old embryos generated from reciprocal crosses between w1118 and Harwich. Surprisingly, the accumulation of P-element RNA as measured by quantitative RT-PCR (RT-qPCR) showed no significant change in dysgenic PGCs when compared to non-dysgenic PGCs (ORF0-3; Fig. 1f). This indicates that ‘P-cytotype’ small RNAs exert their function by means other than regulating P-element mRNA levels.
P-element activity relies on production of a functional P-element transposase protein, the expression of which requires pre-mRNA splicing of three introns (IVS1-3; Fig. 1b)17. To analyze P-element RNA splicing in germ cells during hybrid dysgenesis, we designed primers that specifically anneal to spliced mRNA transcripts. The accumulation of spliced forms for the first two introns (IVS1 and IVS2) did not show significant changes in dysgenic PGCs when compared to non-dysgenic PGCs. By contrast, the accumulation of spliced transcripts for the third intron (IVS3) was substantially increased in dysgenic germ cells (Fig. 1f). Given that the overall accumulation of P-element mRNA showed no changes, our results indicate that the maternally provided ‘P-cytotype’ can negatively regulate P-element IVS3 splicing and therefore inhibits the production of functional P-transposase in germ cells.
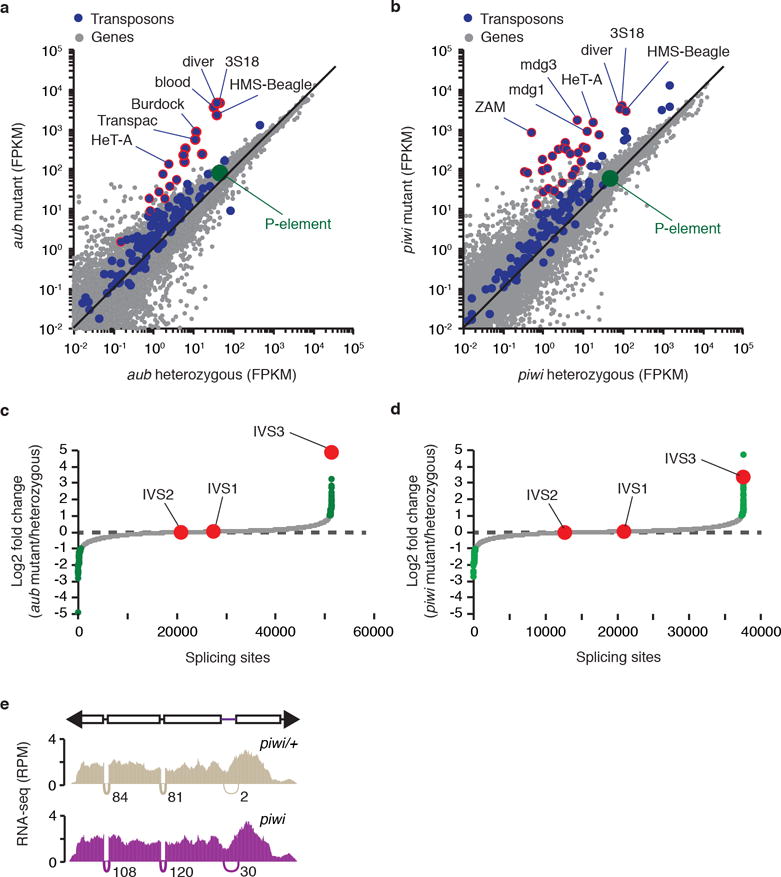
Analysis of publically available small RNA sequencing data from 0- to 2-hours-old embryos laid by Harwich females16 indicated that two classes of small RNAs cognate to the P-element are maternally-transmitted: small interfering RNAs (siRNAs, 20-22nt long) and piRNAs (23-29nt long; Extended data Fig. 1). To test the role of distinct small RNA populations on P-element expression, we analyzed mutants uniquely affecting each small RNA biogenesis pathway in the Harwich background. Mutations disrupting siRNA biogenesis components Dicer-2 (dcr2) and Argonaute 2 (Ago2), or mutations ablating components of the piRNA biogenesis pathway, such as the Argonautes piwi, aubergine (aub), and Argonaute 3 (ago3), as well as the RNA helicase vasa (vas) and spindle E (spnE), did not affect P-element mRNA accumulation in adult ovaries as measured by RT-qPCR (ORF0-3; Fig. 2a). However, mutations disrupting piRNA biogenesis, and not the siRNA pathway, led to a strong and specific increase in the accumulation of IVS3 spliced mRNAs (Fig. 2a,b). RNA sequencing (RNA-seq) analysis on poly (A)-selected RNAs from aub and piwi mutant adult ovaries confirmed the specific effect on IVS3 splicing (Fig. 2c–e; Extended data Fig. 2a–e). To examine transposon expression in tissue, we performed RNA Fluorescent In Situ Hybridization (FISH) using probes specific for the P-element and for the Burdock retrotransposon, a classic target of the germline piRNA pathway6. In mutants affecting piRNA biogenesis, increased abundance of Burdock RNA was readily observed in germline tissues, with most of the signal accumulating close to the oocyte (Fig. 2f). By contrast, we did not detect a difference in P-element RNA FISH signal in piRNA biogenesis mutants compared to control. Nuclear RNA foci observed in nurse cells were of similar intensity and number regardless of the genotype, and cytoplasmic signal showed no detectable difference. Therefore, our results indicate that in germ cells, piRNAs modulate specifically IVS3 splicing. This regulation is reminiscent of the well-documented mechanism that restricts P-element activity to germline tissues, which involves the expression of a host-encoded RNA binding repressor protein that negatively regulates IVS3 splicing in somatic tissues17.
Figure 2. piRNAs, but not siRNAs, modulate P-element splicing in germ cells.
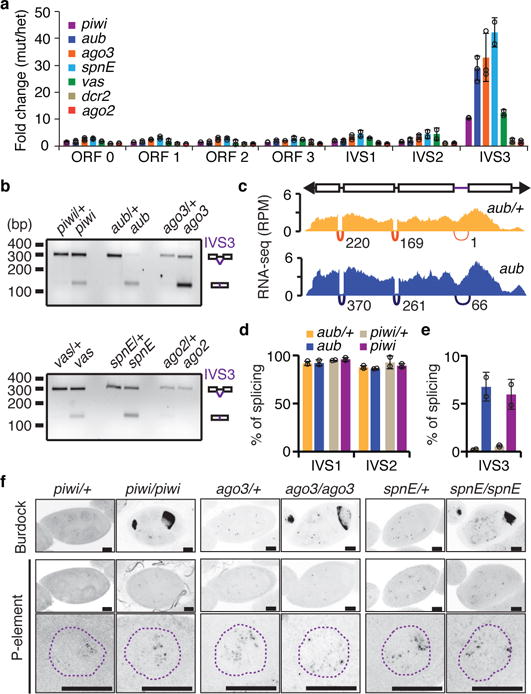
All analyses were performed in a Harwich background. a, RT-qPCR analysis on piRNA- (piwi, aub, ago3, spnE, and vas) and siRNA-biogenesis (dcr2 and ago2) mutant adult ovaries. Results are presented as means of fold changes in mutants in relation to respective heterozygote ± standard deviation (n>=2 independent biological replicate experiments). b, Ethidium bromide-stained gel displaying RT-PCR reactions with primers flanking the P-element IVS3 intron in piRNA- and siRNA-biogenesis mutants. Size scale in base pairs (bp) is presented for each gel. Experiments were repeated two times with similar results. For gel source data, see Supplementary Figure 1. c, Density plots for normalized strand-specific mRNA steady-state levels (measured by RNA-seq and represented as reads per million, RPM) over consensus P-element sequence (top diagram) in aub/+ heterozygous (yellow, top plot) and aub mutant (blue, bottom plot) adult ovaries. The number and position of split-reads (represented by arcs that connect exons) observed for IVS1, IVS2, and IVS3 splicing junctions is shown below each density plot. Experiments were repeated two times with similar results. d-e, Percentage of splicing for P-element IVS1, IVS2 (d), and IVS3 (e). Splicing was quantified using RNA-seq analysis in aub/+ heterozygous (yellow), aub mutant (blue), piwi/+ heterozygous (beige), and piwi mutant (purple) adult ovaries. Percentage of splicing was calculated as the number of split-reads for each splicing junction normalized to the total number of reads mapping to the same junction. Results are represented as means ± standard deviation (n=2 independent biological replicate experiments). f, Representative confocal projections of RNA-FISH signal (grayscale) showing the accumulation of sense RNA for Burdock and P-element transposons in heterozygous and mutant egg chambers. Bottom panels depict projections of representative nurse cell nuclei (purple dotted line) for the same genotypes. Scale bars, 20 μM. Experiments were repeated two or more times with similar results.
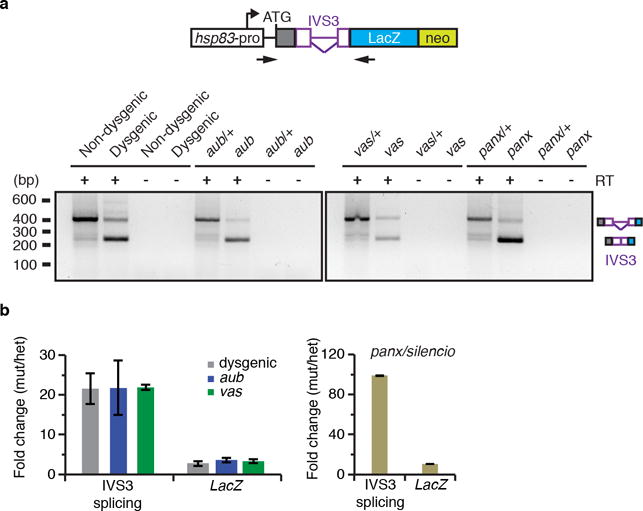
In somatic tissues, P-element alternative splicing regulation is mediated by the assembly of a splicing repressor complex on an exonic splicing silencer (ESS) element directly upstream of IVS317–19. To test whether the P-element IVS3 and flanking exon sequences were sufficient to trigger the piRNA-mediated splicing regulation in germ cells, we used a transgenic reporter system for IVS3 splicing in which a heterologous promoter (hsp83) drives the expression of an IVS3-lacZ-neo fusion mRNA specifically in the germline (Fig. 3a)20. Using RT-qPCR, we analyzed the F1 progeny from reciprocal crosses between w1118 and Harwich flies in the presence of the hsp83-IVS3-lacZ-neo reporter (to avoid developmental defects, F1 progeny were raised at 18°C; for details see methods). The fraction of spliced mRNAs produced from the transgenic reporter was substantially increased in dysgenic compared to non-dysgenic adult ovaries (Fig. 3b; Extended data Fig. 3), in agreement with previously reported results20. Most importantly, genetic experiments confirmed that the repression of IVS3 splicing in germ cells relies on piRNA biogenesis, as the splicing repression observed with this reporter in non-dysgenic progeny was specifically abolished in adult ovaries of aub and vas mutants (Fig. 3c; Extended data Fig. 3).
Figure 3. piRNA-mediated chromatin changes regulate P-element splicing.
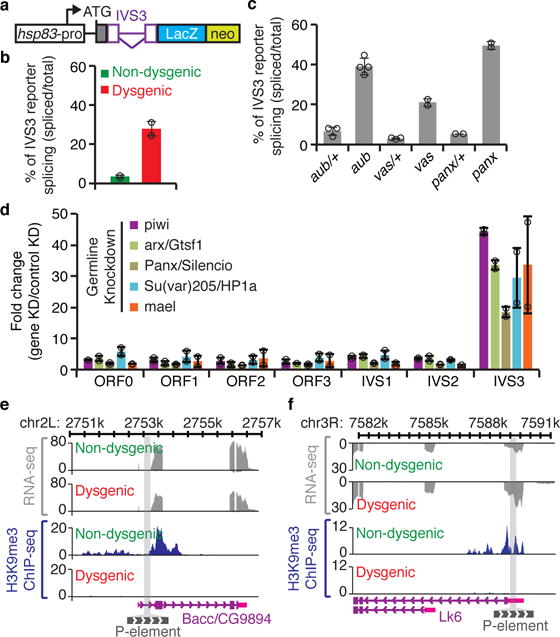
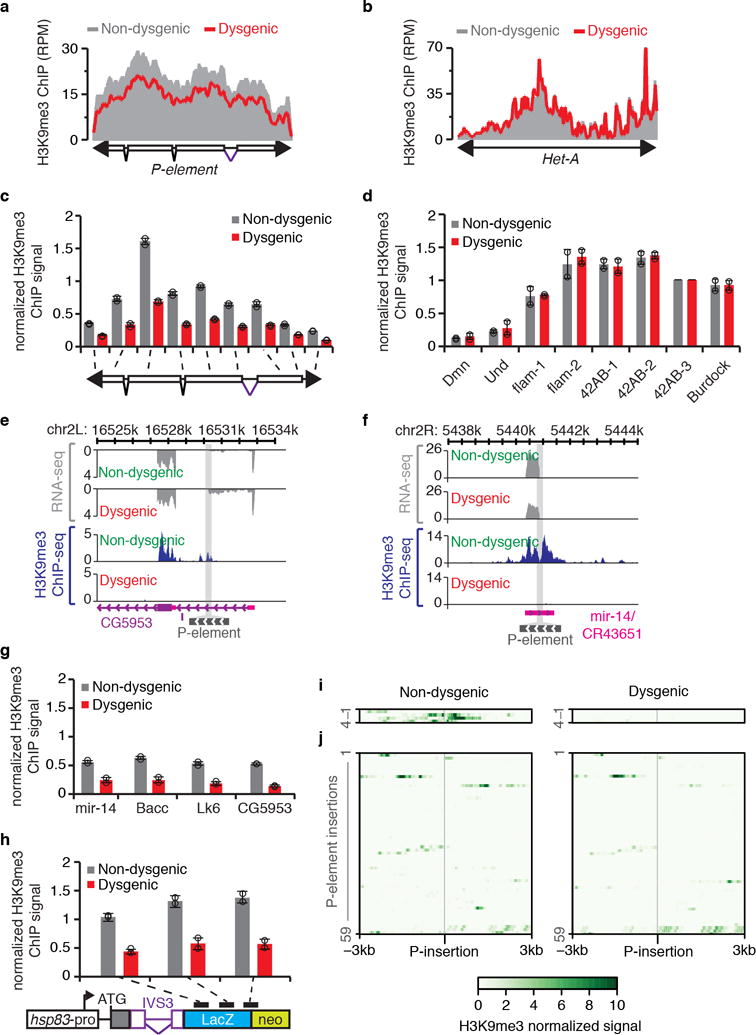
a, Diagram of IVS3 transgenic reporter20: white box, germline-specific hsp83 promoter; ATG, codon start; gray box, nuclear localization signal; purple, P-element fragment containing IVS3 (inverted triangle) and exonic flanking sequences (boxes); blue box, LacZ; green box, neo. b, RT-qPCR analysis using adult ovaries of [F1] progeny originated from reciprocal crosses between Harwich strain and w1118 flies carrying the IVS3 reporter. Bars represent the percentage of spliced IVS3 reporter transgenic transcripts, determined by the ratio between IVS3 spliced transgenic RNA (quantified using primers that specifically anneal to spliced transgenic transcripts) and total IVS3 reporter transgenic mRNA (quantified using primers that anneal within the LacZ coding sequence). Results are presented as means of spliced transgenic RNA (percentage) ± standard deviation (n=2 independent biological replicate experiments). c, RT-qPCR analysis in aub/+ heterozygous, aub mutant, vas/+ heterozygous, vas mutant, panx/+ heterozygous, and panx mutant, carrying the transgenic IVS3 reporter. All experiments were performed in a Harwich background (n>=2 independent biological replicate experiments). Results are represented as in (b). d, RT-qPCR analysis on adult ovaries of germline knockdowns (KD) targeting piRNA pathway components involved in chromatin targeting (piwi, arx/Gstf1, Panx/Silencio, Su(var)205/HP1a, and mael). Results are presented as means of fold changes in germline KDs in relation to controls (white or mCherry germline KDs) ± standard deviation. All analyses were performed in a Harwich background (n>=2 independent biological replicate experiments). e-f, Genome browser view of two of the P-element insertions showing transcriptional activity. Normalized RNA-seq and H3K9me3 ChIP signals are presented in gray and blue, respectively. The gray bar crossing the plots represents P-element chromosomal insertion site. Annotation is at bottom: purple boxes, coding exons; pink boxes, untranslated regions (UTR); purple lines, introns; gray box, P-element insertion. View showing P-element insertion into Bacc/CG9894 (e) and Lk6 (f) genes.
Mechanistically, piRNA-mediated splicing regulation may be achieved through direct action of piRNA-complexes on target pre-mRNAs carrying the IVS3 sequence or indirectly by piRNA-mediated changes in chromatin states. Piwi-interacting proteins such as Asterix/Gtsf1 (Arx) and Panoramix/Silencio (Panx) are dispensable for piRNA biogenesis but are essential for establishing piwi-mediated chromatin changes, possibly by acting as a scaffold to recruit histone modifying enzymes and chromatin-binding proteins to target loci8,9. To test the role of these chromatin regulators on P-element splicing, we performed germline-specific RNAi knockdown experiments in the Harwich background. Similar to what was observed for the piRNA biogenesis components (Fig. 2), germline knockdown of Arx and Panx showed no change in P-element RNA accumulation, but a strong and specific effect on IVS3 splicing in adult ovaries (Fig. 3d). The same pattern on IVS3 splicing was observed in the germline knockdown of the Heterochromatin Protein 1a/Su(var)205 (HP1a) and Maelstrom (Mael; Fig. 3d), both of which act downstream of Piwi-mediated targeting to modulate chromatin structure21,22. The same genetic requirement for Panx for IVS3 splicing control was also confirmed when using the transgenic IVS3 splicing reporter (Fig. 3c; Extended data Fig. 3), further indicating that piwi-mediated chromatin changes at the target locus play a role in IVS3 splicing regulation. At target loci, Piwi-complexes are known to mediate the deposition of the classic heterochromatin mark histone H3 lysine 9 trimethylation (H3K9me3)22. To directly assess the effect of piRNA-targeting on P-element chromatin marks, we performed H3K9me3 chromatin immunoprecipitation on adult ovaries followed by sequencing (ChIP-seq) or quantitative PCR on the progeny from reciprocal crosses between w1118 and Harwich (to avoid developmental defects, ChIP was performed on F1 progeny raised at 18°C; for details see methods). This analysis revealed a significant and specific loss of global H3K9me3 levels over P-element insertions in dysgenic progeny when compared to non-dysgenic progeny (Extended data Fig. 4a–d).
To analyze the chromatin structure at individual P-element insertions, we used DNA-seq data to identify all euchromatic insertions in the Harwich strain (Supplementary Table 1; Extended data Fig. 5) and RNA-seq analysis to define transcriptionally active insertions (Extended data Fig. 6). At transcriptionally active P-element euchromatic insertions, spreading of H3K9me3 into the flanking genomic regions was readily observed in non-dysgenic progeny, but was completely absent in dysgenic offspring (Fig. 3e,f; Extended data Fig. 4e–g). Similarly, a significant loss of H3K9me3 modification levels was also observed over the IVS3 transgenic reporter in dysgenic progeny when compared to non-dysgenic progeny (Extended data Fig. 4h). Interestingly, euchromatic insertions with no evidence of transcriptional activity were devoid of H3K9me3 signal in both non-dysgenic and dysgenic crosses (Extended data Fig. 4i–j), providing further evidence for a model initially suggested in yeast23 and more recently proposed for Drosophila and mammals, in which H3K9me3 deposition by piRNA-complexes would require transcription of the target loci22,24. Mechanistically different from the well-described somatic repression, our results uncovered the existence of an unexpected piRNA-mediated, chromatin-based mechanism regulating IVS3 alternative splicing in germ cells (see also Supplementary Note 1).
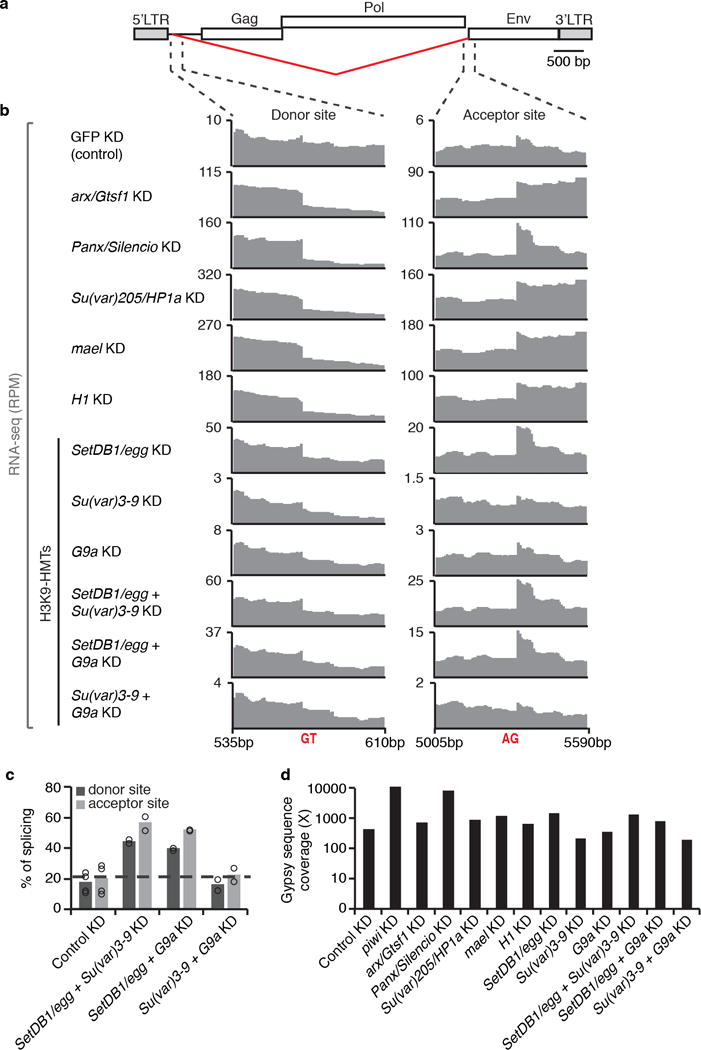
To expand our analysis, we searched the literature for other cases of transposon splicing regulation. Drosophila Gypsy elements are retrotransposons that have retrovirus-like, infective capacity due to their Envelope (Env) protein (Fig. 4a)12,13. These elements are expressed in somatic ovarian cells, where they are regulated by the flamenco locus10, a well-known piRNA cluster that is a soma-specific source of anti-sense piRNAs cognate to Gypsy11. Interestingly, it has been shown that mutations in flamenco not only elicited the accumulation of Gypsy RNA, but also modulated pre-mRNA splicing, favoring the production of the Env protein mRNA and therefore germline infection10. To test whether the piRNA pathway, in addition to its role in regulating the accumulation of Gypsy RNA11, is also responsible for modulating the splicing of Gypsy elements in somatic tissues, we analyzed publically available RNA sequencing data from poly (A)-selected RNAs extracted from Ovarian Somatic Cell (OSC) in vitro cultures7,9,25. Our analysis indicates that piwi knockdown was sufficient to modulate Gypsy splicing, favoring the accumulation of env-encoding mRNA (Fig. 4b,c). In agreement with a chromatin-mediated regulation of alternative splicing, RNAi depletion of Arx, Panx, HP1a, Mael, as well as knockdown of the histone linker H1 was sufficient to favor Gypsy splicing, recapitulating the effect caused by Piwi depletion (Fig. 4c; Extended data Fig. 7). Interestingly, this was also the case for the H3K9 methyltransferase Setdb1, but not for the H3K9 methyltransferases Su(var)3-9 and G9a, indicating specific genetic requirements (Fig. 4c; Extended data Fig. 7). Taken together, our results indicate that the piRNA pathway, through its role in mediating changes in chromatin states, regulates the splicing of transposon pre-mRNAs in both somatic and germline tissues.
Figure 4. piRNA-mediated chromatin targeting machinery modulates splicing of the Gypsy retrotransposon in Ovarian Somatic Cells (OSC).

a, Diagram of Gypsy retrotransposon: gray boxes, long terminal repeats; white boxes, coding sequences; red inverted triangle, splicing that generates env mRNA. b, RNA-seq signal (RPM) at the Gypsy splicing donor and acceptor sites in representative control (GFP KD) and piwi KD conditions. Raw data sets from Sienski et al, 2015. Experiments were repeated three times with similar results. c, Percentage of splicing for Gypsy splicing donor and acceptor sites as determined by RNA-seq analysis performed in OSC cells KDs of piRNA machinery components. Bars represent the number of split-reads for the env splicing donor and acceptor junctions normalized to the total number of sense Gypsy reads mapping to the same junction. Results are represented as means. With the exception arx/Gst1, Su(var)205/HP1a, mael, and H17,25, experiments were repeated two or more times. Raw data sets from Ohtani et al, 20137; Sienski et al, 20159; Iwasaki et al, 201625.
Using P-M hybrid dysgenesis as a model, we have uncovered splicing regulation elicited by chromatin changes as a previously unknown mechanism by which the piRNA pathway protects the genome against the detrimental effects of transposon activity. Splicing control at piRNA-target loci is likely to be mechanistically different from what has been observed for germline piRNA clusters given the low enrichment of the HP1-homolog Rhino (HP1D) protein, which is required for piRNA cluster RNA processing26, over the endogenous P-element insertions in the Harwich genome or over the transgenic IVS3 splicing reporter in non-dysgenic and dysgenic progeny (as measured by ChIP-qPCR; extended data Figure 8). Because small RNA-based systems leading to chromatin mark changes at target loci are pervasive in eukaryotes23, we expect this new type of targeted regulation to be of significance in settings far beyond the scope of the piRNA pathway and Drosophila. Indeed, small RNA-guided DNA methylation over the LINE retrotransposon Karma was recently shown to modulate alternative splicing in oil palm, disrupting nearby gene expression and ultimately affecting crop yield27. In this context, small RNA-based control of chromatin structure may be critically important in genomes with a high content of intronic transposon insertions, such as the human genome, by providing a mechanism to suppress exonization of repeat elements28. While the means by which piRNA-mediated changes in chromatin states could regulate alternative splicing remains to be determined, it is tempting to speculate that piRNA pathway components do so by co-transcriptionally modulating interactions between RNA polymerase II and the spliceosome29,30.
Methods
No statistical methods were used to predetermine sample size. Experiments were neither intentionally randomized nor intentionally ordered. Investigators were not blinded to allocation during experiments and outcome assessment.
Drosophila stocks, genetics, and husbandry
Drosophila melanogaster stocks used: w1118 (R. Lehmann); Harwich (Bloomington Drosophila Stock Center, BDSC# 4264); w;; Pnos::egfp-moe::nos-3’UTR31, w;; hsp83-IVS3-LacZ-neo/TM3 Sb20, w;; nos-GAL4::VP1632, P{UAS-Dcr-2.D}1 w1118 (BDSC# 24646), w1118; piwi1/CyO, w+ (BDSC# 43637), w1118; piwi2/CyO, w+ (BDSC# 43319), w1118; aubQC42 cn1 bw1/CyO, P{sevRas1.V12}FK1 (BDSC# 4968), aubHN2 cn1 bw1/CyO (gift from P. Macdonald), bw1; st1 ago3t2/TM6B, bw1; st1 ago3t3/TM6B (gifts from P. Zamore), ru1 st1 spn-E1 e1 ca1/TM3 Sb1 Ser1 (BDSC# 3327), w;; FRT82B spn-E100.37 e1/TM3 Sb (R. Lehmann), vasPH165/CyO33, w1118; Df(2L)osp29, AdhUF osp29 pr1 cn1/CyO, P{sevRas1.V12}FK1 (BDSC# 3078), w1118; CG9754[m1-9]/CyO (VDRC# v313502; Panx/Silencio mutant from J. Brennecke9), w1118; CG9754[m3-4]/CyO (VDRC# v313500; Panx/Silencio mutant from J. Brennecke9), wm4h;; ago2414/TM6b (gift from R. Carthew), w1118;; Df(3L)BSC558/TM6c Sb (BDSC# 25120), dcr2L811fsX, P{GMR-w.IR}; Df(2R)BSC45/CyO (gifts from E. Lai), aub-shRNA (Vienna Drosophila Resource Center, VDRC# v313413), piwi-dsRNA (VDRC# v101658), arx/Gtsf1-dsRNA (VDRC# v40408), Panx/Silencio-dsRNA (VDRC# v102702), mael-dsRNA (VDRC# v100907), Su(var)205/HP1a-shRNA (BDSC# 36792), white-dsRNA (dsRNA control, VDRC# v30033), mCherry-shRNA (shRNA control, BDSC# 35785).
Lab-strain chromosomes carrying mutations and transgenes of interest were individually transferred to the Harwich background through a series of backcrosses. The genotypes of the resulting Harwich-derived stocks, which are characterized by single chromosome permutations, are listed in Supplementary Table 2. Prior to further use, the ability of the Harwich-derived stocks to induce dysgenic ovarian phenotype in [F1] progeny was confirmed by dysgenesis testcrosses using five w1118 females and five males from each of the Harwich-derived stocks. Testcrosses were performed at 29°C on standard medium in at least two biological replicates. Ovary phenotype in [F1] progeny was scored after dissection and results are summarized in Supplementary Table 2.
For the fertility test described in Figure 1c, non-dysgenic and dysgenic [F1] progeny females were individually mated to two w1118 males. Parental flies were discarded after 3 days of mating, and number of [F2] adult progeny was assessed 12 days after that. All other crosses are described in Supplementary Table 3 and were performed in at least two biological replicates. Germline RNAi knockdowns using UAS-dsRNA lines were performed in the presence of the P{UAS-Dcr-2.D}1 transgene, as previously described21. Unless stated otherwise, all crosses were performed at 29°C on standard medium and experiments were performed with 3- to 5-day-old adult female flies. ChIP-seq, RNA-seq analysis, and IVS3 transgenic reporter analysis with [F1] progeny originated from reciprocal crosses between w1118 and Harwich were performed at 18°C to minimize confounding effects derived from dysgenesis-induced developmental defects. Unlike dysgenesis-triggered developmental defects, which are only observed in flies grown in temperatures >25°C15, P-element splicing regulation is not temperature-sensitive as verified by RT-PCR, RT-qPCR, and RNA-seq analyses performed at 18°C (Extended data Figure 6).
Immunofluorescence
Hand-devitellinized embryos and dissected larval ovaries were immunostained as previously described34,35. Samples were mounted in Vectashield® media containing DAPI (Vector Laboratories). Primary antibodies: rabbit anti-Vasa serum (1:5000, R Lehmann) and mouse anti-1B1 (1:20, DSHB). Alexa Fluor 488- (Life Technologies) and Cy3-conjugated (Jackson Immunoresearch) secondary antibodies were used at a 1:500 dilution. Phalloidin-TRITC (Sigma) was used at 1:250 (from 20μM stock). Fluorescent images were acquired with Plan-Apochromat 20×/NA0.8 and Plan-Apochromat 40×/NA1.4 (oil immersion) objectives on a Zeiss LSM 780 confocal microscope.
RNA FISH
RNA FISH was performed as previously described36. Custom Stellaris® RNA FISH Probes were designed using the Stellaris® RNA FISH Probe Designer (Biosearch Technologies) and labeled with CALFluor590 and Quasar670 to detect consensus P-element (GenBank X06779:996..3902) and Burdock (GenBank U89994) sense mRNA sequences, respectively. FISH probes are composed of 20-nt-long oligo pools, as listed in Supplementary Table 4. Fluorescent images were acquired with a Plan-Apochromat 40×/NA1.4 (oil immersion) objective on a Zeiss LSM 780 confocal microscope.
FACS sorting of PGCs
GFP+-PGCs were isolated from 4h- to 20h-old embryos by FACS as previously described37. Reciprocal crosses to obtain non-dysgenic and dysgenic embryos were performed with stocks carrying the Pnos::egfp-moe::nos-3’UTR transgene31, as described in Supplementary Table 3. GFP+-PGCs were FACS sorted (MoFlo cell sorter) into Trizol reagent for subsequent RNA extraction.
RNA isolation and analyses
Total RNA from FACS sorted germ cells or dissected adult ovaries was isolated using Trizol reagent (Invitrogen) and quantified by Qubit (Invitrogen). Contaminating DNA was removed using RQ1 DNAse (Promega). Reverse transcription was performed using random primers and SuperScript III Reverse Transcriptase (Invitrogen). Transcript levels were assessed by quantitative PCR (qPCR) using LightCycler® 480 SYBR Green I Master 2× (Roche) in a Roche LightCycler® 480 machine. Results were normalized to the mean value obtained for three control genes (CG7939 [Rp49, also known as RpL32]; CG8187; CG8269 [Dmn]) with invariant expression in a range of tissues and developmental stages, as previously described38. For splicing analysis on gel, PCR reactions were performed in RT-qPCR-normalized cDNA to non-saturating conditions (exponential phase) using LightCycler® 480 SYBR Green I Master 2× (Roche) and a Roche LightCycler® 480 machine, and PCR products were separated in an ethidium bromide-stained, 2.5% agarose gel. Note that this is not a quantitative analysis, as amplification of smaller DNA fragments may be disproportionally favored in PCR reactions targeting fragments of different length. All primers are listed in Supplementary Table 5.
Poly(A)-selected RNA-sequencing (RNA-seq) analysis was performed on 2.5μg of RNA purified from adult ovaries using the NEBNext® Poly(A) mRNA Magnetic Isolation Module and the NEBNext® Ultra™ Directional RNA Library Prep Kit for Illumina®. Libraries were multiplexed using the NEBNext® Multiplex Oligos for Illumina® and sequenced in paired-end, 100-nt-long reads on an Illumina HiSeq 2500.
PCR on genomic DNA
Genomic DNA was extracted from w1118 and Harwich pools containing 20 adult female flies each, using the DNeasy Blood & Tissue kit (QIAGEN) and following manufacturer’s protocol for insects. PCR was conducted on 2ng of total DNA using Q5 Hot Start High-Fidelity DNA Polymerase (NEB). PCR products were separated in an ethidium bromide-stained, 1% agarose gel. To structurally characterize P-element insertions, PCR products were purified using the QIAquick PCR purification kit (QIAGEN) and sequenced using traditional Sanger sequencing. Primers are listed in Supplementary Table 5.
ChIP
ChIP was performed as previously described39, using 100-200 dissected adult ovaries as starting material and the anti-H3K9me3 (Abcam, ab8898) or the anti-rhino40 (guinea pig; kind gift from W. Theurkauf) antibody. Prior to immunoprecipitation, 5% of sonicated chromatin was separated to serve as ‘input’. After reverse-crosslinking, immunoprecipitated (IP) and input DNA was extracted using QIAquick PCR Purification Kit (QIAGEN) and used for qPCR reactions as previously described or library preparation for sequencing. ChIP-qPCR results were normalized to the input and compared with signal at the 42AB locus. Primers used for ChIP-qPCR are listed in Supplementary Table 5. For ChIP-seq, IP and input libraries were prepared using NEBNext® Ultra™ II DNA Library Prep Kit for Illumina®. Libraries were multiplexed using the NEBNext® Multiplex Oligos for Illumina® and sequenced in paired-end, 50-nt-long reads on an Illumina HiSeq 2500. ChIP experiments were performed in two biological replicates. qPCR measurements were performed in at least two technical replicates on each sample.
Computational analysis
Small RNA analysis
Small RNA reads extracted from the NCBI Gene Expression Omnibus (GEO) database accession number GSE1308116 were mapped to the consensus P-element sequence, as previously described11.
RNA-seq analysis
Paired-end (100-nt-long reads) RNA-seq data generated in this study were mapped to the Drosophila melanogaster genome (dm3) and the FlyBase and Repbase transposon consensus database using the piPipes package (version 1.5.0; https://github.com/bowhan/piPipes), following the RNA-seq pipeline as previously described41. Briefly, libraries were first aligned to ribosomal RNA using Bowtie242. Non-rRNA reads were then mapped to the transcriptome and transposon consensus using Bowtie2, and transcript abundance was quantified using eXpress43. Analyses were performed with two samples, each with two biological replicates, using the piPipes RNA-seq dual-library mode41.
Genome-wide analysis of differentially spliced mRNAs was performed using the Junction Usage Model (JUM) package44,45 (https://github.com/qqwang-berkeley/JUM; version 1.3.2) with default parameters and following the JUM manual. Briefly, RNA-seq data were mapped to the Drosophila genome (dm3) using STAR46 in two-pass mode, following instructions in the STAR manual (https://github.com/alexdobin/STAR). STAR output is then used by JUM to construct statistical models and to quantify splicing from raw counts mapped to each identified junction44. Each comparison was performed with two samples, each with two biological replicates. Junctions showing >2-fold changes between samples and with p-adjusted<0.05 were considered as differentially spliced. JUM analysis was performed using a minimal of five mapping reads as a filter for valid junctions.
Splicing of P-element and Gypsy transposons was defined manually according to the method used in the JUM package44. To do so, RNA-seq data was initially analyzed on the Galaxy web-based platform (www.usegalaxy.org)47. After the removal of Illumina adaptors and other low quality sequences using the ‘Trim Galore!’ package, stranded RNA-seq data were mapped to consensus P-element (GenBank X06779:996..3902) and Gypsy (Genbank M12927) sequences using TopHat48, allowing for up to 3 mismatches. To calculate percentage of splicing, TopHat output was used to define the number of split-reads mapping to a junction (N1), as well as the number of non-split-reads fully and uniquely contained within the interval surrounding the same exon-intron junction (N2). This interval is centered of the exon-intron boundary and its size is defined based on the length of RNA-seq, where size is equal to [2× length of RNA-seq reads] minus 4. Percentage of ‘splicing in’ is then defined by the (N1/(N1+N2)) ratio multiplied by 100. Fold changes are calculated based on percentage of splicing values. Quality of split-read alignments was visually inspected using IGV browser (version 2.3.77)49, and low-quality alignments containing <3 nucleotides overlapping one side of the splice junction were discarded. For P-element splicing analysis, biological replicates generated in this study were individually analyzed and used to calculate average of percentage of splicing and standard deviation. For Gypsy analysis, raw RNA-seq data sets from OSC cells were retrieved from GEO database, accession numbers GSE470067, GSE740979, and GSE8143425. Given the distance between Gypsy env donor and acceptor sites (4982bp), percentage of splicing for each exon-intron boundary was individually calculated as described above. Data obtained for the same tested conditions were pooled whenever possible.
Analysis of transcriptionally active P-element insertions was performed on the Galaxy web-based platform using RNA-seq data from non-dysgenic and dysgenic progeny and previously described method to identify non-reference transposon insertions using split-reads50. Briefly, paired-end RNA-seq data (100-nt long reads) were mapped to the Drosophila genome (dm3) using Bowtie2. Next, unmapped reads were aligned to the P-element consensus sequence using Bowtie2, with –sensitive-local settings to obtain soft clip alignments. Reads with <20 nt mapping to P-element extremities were removed, and the remaining reads were then treated to remove all P-element-derived sequences and mapped to the Drosophila genome (dm3) using USCS genome Browser BLAT Search (http://genome.ucsc.edu/cgi-bin/hgBlat). The number of RNA-seq split-reads mapping to a given locus in relation to total number of split-reads (excluding singletons) was used to determine the relative expression of individual insertions.
ChIP-seq analysis
ChIP-seq analysis was performed on the Galaxy web-based platform following previously described methods41. Briefly, Illumina adaptors and other low quality sequences were removed using the ‘Trim Galore!’ package. ChIP-seq input and IP filtered data were mapped to the Drosophila genome (dm3) and transposon consensus sequences using Bowtie2, using the -k = 1 parameter. For the Drosophila genome, peak calling and signal normalization (Poisson p-value [ppois] correction) was performed using MACS251. Heatmaps were generated using SeqPlots, using default parameters (http://przemol.github.io/seqplots/). For transposon consensus sequences, input-corrected H3K9me3 occupancy was normalized to the total number of genome-mapped aligned reads and represented as reads per million (RPM).
DNA-seq analysis
Identification of P-element insertions in the Harwich strain was performed using the input data from ChIP-seq and the Genome-seq pipeline provided in the piPipes package41, as previously described52. Briefly, genomic sequencing data were first mapped to the Drosophila genome (dm3) using BWA53. Then, using the consensus P-element sequence (GenBank X06779:996..3902) as template, TEMP54 was used to locate P-element insertions in the genome. This analysis was individually performed in four independent repeats, provided by two biological replicates of each progeny originated from reciprocal crosses between w1118 (P-element-devoid strain) and Harwich. Shared insertions identified in all four experiments were used to reconstruct the set of P-element euchromatic insertion existing in the Harwich strain (Supplementary Table 1). Euchromatic coordinates were obtained from Sienski et al, 201222.
Data availability
Sequencing data generated during the current study are available in the NCBI Gene Expression Omnibus repository under accession number GSE103582.
Extended Data
Extended data Figure 1. Size distribution of small RNAs matching to P-elements in small RNA libraries obtained from Harwich ovaries (orange) or from 0-2h old embryos laid by Harwich females (purple).
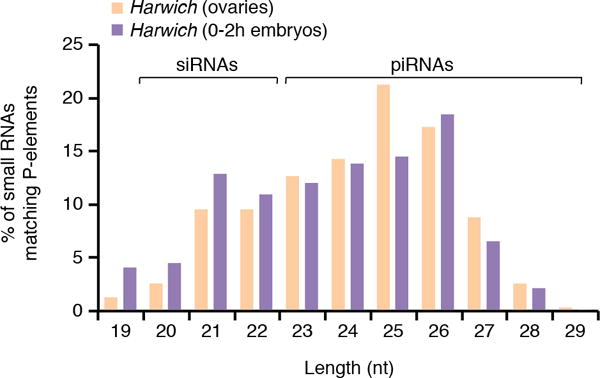
Analysis was performed on data originally published in Brennecke et al, 200816. siRNA (20-22nt long) and piRNA (23-29nt long) populations are indicated.
Extended data Figure 2. P-element mRNA steady-state levels do not change in piRNA mutants in comparison to respective heterozygous.
a-b, Scatterplots showing the expression of genes (gray dots) and transposons (blue dots), as measured by RNA-seq analysis (expressed in fragments per kilobase per million fragments, FPKM, log10), in aub/+ heterozygous vs. aub mutant adult ovaries (a) and piwi/+ heterozygous vs. piwi mutant adult ovaries (b) comparisons. P-element expression is shown in green. Transposons with RNA abundance changes >10-fold are outlined in red. Experiments were repeated two times with similar results. c-d, Genome-wide analysis of splicing changes in aub/+ heterozygous vs. aub mutant adult ovaries (c) and piwi/+ heterozygous vs. piwi mutant adult ovaries (d) comparisons. Quantification of splicing changes was performed using RNA-seq data and the JUM method44,45. Results are expressed as log2 fold changes in splicing (mutant/heterozygous). Gray dots represent individual splice junctions identified, sorted by fold change values. Green dots represent splice junctions with statistically significant changes in heterozygous vs. mutant comparisons (adjust p-value < 0.05). Fold changes for P-element splice junctions (IVS1, IVS2, and IVS3) are presented in red. Note that ~70% of genic splice junctions showing statistically significant changes in mutant comparisons (green dots) are located in the same chromosome as the inducing mutations (2nd chromosome), and may be due to genetic background differences. e, Density plots for normalized strand-specific mRNA steady-state levels (measured by RNA-seq and represented as reads per million, RPM) over consensus P-element sequence (top diagram) in piwi/+ heterozygous (beige, top plot) and piwi mutant (purple, bottom plot) adult ovaries. The number and position of split-reads (represented by arcs that connect exons) observed for IVS1, IVS2, and IVS3 splicing junctions is shown below each density plot. Experiments were repeated two times with similar results.
Extended data Figure 3. ‘P-cytotype’ as well as piRNA pathway components involved in piRNA biogenesis and targeting regulate the splicing of the IVS3 transgenic reporter in vivo.
a. Ethidium bromide-stained gel displaying RT-PCR reactions with primers flanking the transgenic reporter IVS3 intron. Analysis was performed with adult ovaries of non-dysgenics and dysgenic flies grown at 18°C, or with adult ovaries of heterozygous and mutants for the piRNA components aub, vas, and Panx/Silencio. Mutant analyses were performed in a Harwich background, at 29°C. Size scale in base pairs (bp) is presented for each gel. Control reactions omitting Reverse Transcriptse (RT-) are also presented. Diagram of IVS3 transgenic reporter (as in Figure 3a) and primers (arrows) used in RT-PCR reactions are depicted in the top of the ethidium bromide-stained gel. Experiments were repeated two or more times with similar results. For gel source data, see Supplementary Figure 1. b. RT-qPCR analysis using adult ovaries of [F1] progeny carrying the IVS3 reporter, probing spliced (IVS3 splicing, quantified using primers that specifically anneal to spliced transgenic transcripts) and total (LacZ, quantified using primers that anneal within the LacZ coding sequence) IVS3 reporter transgenic mRNA levels. [F1] progeny was originated either from reciprocal crosses between Harwich strain and w1118 flies, or in aub/+ heterozygous, aub mutant, vas/+ heterozygous, vas mutant, panx/+ heterozygous, and panx mutant. Results are presented as mean-fold changes in the mutants (or in dysgenic) in relation to the respective heterozygous siblings (or non-dysgenic) ± standard deviation (n>=2 independent biological replicate experiments).
Extended data Figure 4. Loss of H3K9me3 in dysgenic progeny is restricted to transcriptionally active P-elements.
a-b, Density plots for normalized H3K9me3 ChIP-seq signals (represented as reads per million, RPM) over consensus P-element (a) and Het-A (b) sequences in non-dysgenic (grays) and dysgenic (red) progeny. Experiments were performed with adult ovaries of flies grown at 18°C. Experiments were repeated two times with similar results. c-d, H3K9me3 ChIP-qPCR analysis on P-element (c) and controls (d) in non-dysgenic (grays) and dysgenic (red) progeny. Bars represent means of H3K9me3 signal, normalized to a control genomic region in the 42AB locus (42AB-3), ± standard deviation (n=2 independent biological replicate experiments). d, Und and Dmn are negative controls. e-f, Genome browser view of two of the P-element insertions showing transcriptional activity. Normalized RNA-seq and H3K9me3 ChIP signals are presented in gray and blue, respectively. Gray bar crossing the plots represents P-element insertion site. Chromosome coordinates are at top. Annotation is at bottom: purple boxes, coding exons; pink boxes, untranslated regions (UTR); purple lines, introns; gray box, P-element insertion. View showing P-element insertion into CG5953 (e) and mir-14/CR43651 (f) genes. Experiments were repeated two times with similar results. g-h, ChIP-qPCR analysis on sequences flanking transcriptionally active P-element insertions (g) and on the IVS3 transgenic reporter (h) in non-dysgenic (grays) and dysgenic (red) progeny. Bars represent means of H3K9me3 signal, normalized to a control genomic region in the 42AB locus (42AB-3), ± standard deviation (n=2 independent biological replicate experiments). h, Diagram of IVS3 transgenic reporter is presented below the graph. Black rectangles indicate regions probed by ChIP-qPCR. i-j, Heatmaps depicting normalized H3K9me3 levels obtained by ChIP-seq analysis within the 6kb flanking P-element insertions in non-dysgenic (left panels) and dysgenic (right panels) progeny. Experiments were repeated two times with similar results. i, 4 P-element insertions with evidence of transcriptional activity. j, 59 P-element insertions with no evidence of transcriptional activity. All experiments were performed with ovaries of adult progeny from non-dysgenic and dysgenic crosses grown at 18°C.
Extended data Figure 5. Characterization of euchromatic P-element insertion in Harwich strain.
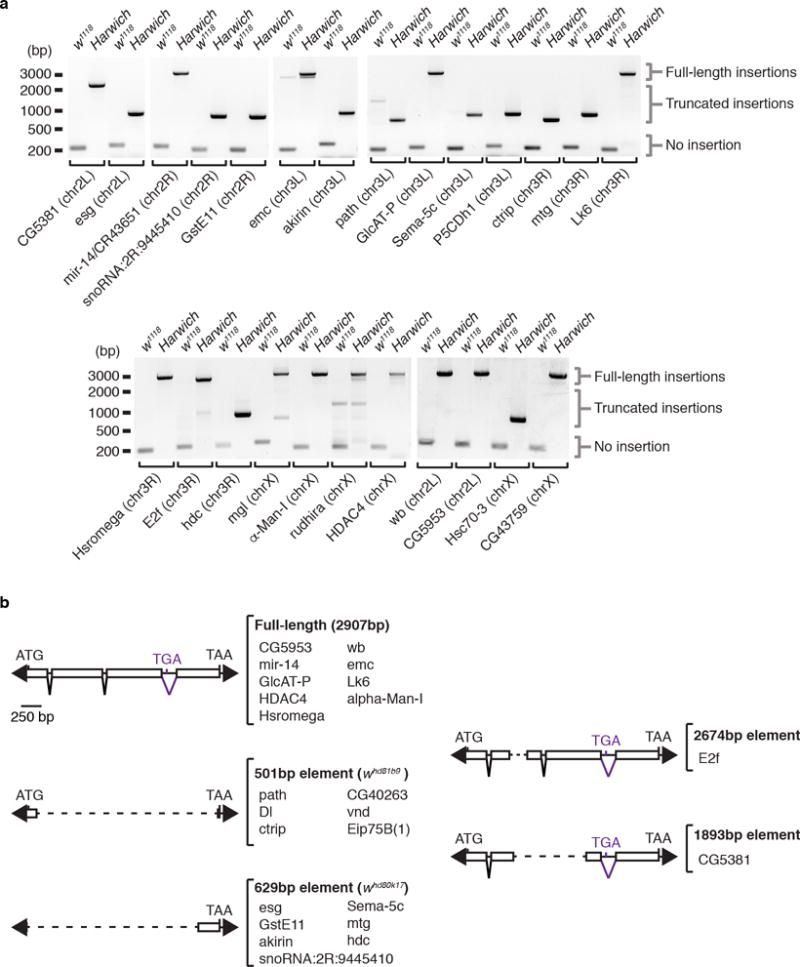
a, Ethidium bromide-stained gels displaying genomic PCR reactions with 25 primer sets flanking P-element insertions uncovered by DNA-seq analysis. PCR reactions were performed with genomic DNA extract from w1118 and Harwich pools containing 20 adult females each. Size scale in base pairs (bp) is presented on the right side of each gel. Amplicon sizes representing absence (no insertion) or presence (truncated or full-length elements) of P-element insertion are indicated on the left of each gel. Targeted insertion and chromosome localization is displayed in the bottom of each gel. Experiments were repeated two times with similar results. For gel source data, see Supplementary Figure 1. b, Schematic representation of five structurally different elements regrouping 24 P-element insertions characterized by DNA sequencing in the Harwich strain. Elements size, as well as a list of respective insertions is indicated on the right of each diagram. Arrowheads represent terminal inverted repeats; boxes, exons; inverted triangles, introns; ATG, start codon; TGA and TAA, stop codons. Dashed lines represent internal deletions.
Extended data Figure 6. Analysis of P-element expression and splicing in adult ovaries of non-dysgenic and dysgenic progeny grown at 18°C.
a, Scatterplot showing the expression of genes (gray dots) and transposons (blue dots), as measured by RNA-seq analysis (expressed in fragments per kilobase per million fragments, FPKM, log10), in adult ovaries of non-dysgenic vs. dysgenic progeny grown at 18°C. P-element expression is shown in green. Genes containing P-element insertion in Harwich strain are depicted in purple. b-c, Percentage of splicing for P-element IVS1, IVS2 (b), and IVS3 (c) splicing junctions as determined by RNA-seq analysis in non-dysgenic (green) and dysgenic (red) adult ovaries. Bars represent percentage of splicing, calculated as the number of split-reads for each splicing junction normalized to the total number of reads mapping to the same junction. Results are represented as means ± standard deviation (n=2 independent biological replicate experiments). d, Ethidium bromide-stained gel displaying RT-PCR reactions with primers flanking the P-element IVS3 intron in adult ovaries of non-dysgenic and dysgenic progeny grown at 18°C, as well as aub/+ heterozygous and aub mutant grown at 29°C. Size scale in base pairs (bp) is presented for each gel. As shown, experiments were repeated three times with similar results. For gel source data, see Supplementary Figure 1. e, RT-qPCR analysis testing accumulation of IVS3 spliced mRNA on non-dysgenic and dysgenic progeny (ovaries) grown at 18°C. Results are expressed as means of percentage of expression relative to controls ± standard deviation (n=3 independent biological replicate experiments). f, Genome-wide analysis of splicing changes in in adult ovaries of non-dysgenic vs. dysgenic progeny grown at 18°C. Quantification of splicing changes was performed using RNA-seq data and the JUM method44,45. Results are expressed as log2 fold changes in splicing (dysgenic/non-dysgenic). Gray dots represent individual splice junctions identified, sorted by fold change values. Green dots represent splice junctions with statistically significant changes in heterozygous vs. mutant comparisons (adjust p-value < 0.05). Fold changes for P-element splice junctions (IVS1, IVS2, and IVS3) are presented in red. g, Analysis of RNA-seq data obtained from non-dysgenic (green) and dysgenic (red) progeny (adult ovaries) to identify transcriptionally active P-element insertions. Reads partially mapping to the P-element extremities were subsequently mapped to the Drosophila genome. Results are expressed as percentage of reads mapping to a given genomic location in relation to total reads. Bars represent means ± standard deviation (n=2 independent biological replicate experiments). All experiments were performed with ovaries of adult progeny from non-dysgenic and dysgenic crosses grown at 18°C.
Extended data Figure 7. Analysis of Gypsy splicing in OSC cells.
a, Diagram of Gypsy retrotransposon, as in Figure 4a. b, RNA-seq signal (RPM) at the Gypsy splicing donor and acceptor sites in representative control (GFP KD) and KDs of arx/Gst1, Panx/Silencio, Su(var)205/HP1a, mael, histone H1, SetDB1/egg, Su(var)3-9, G9a. Data for double KDs of SetDB1/egg + Su(var)3-9, SetDB1/egg + G9a, and Su(var)3-9 + G9a are also shown. With the exception arx/Gst1, Su(var)205/HP1a, mael, and H17,25, experiments were repeated two times with similar results. c, Percentage of splicing for Gypsy donor and acceptor splicing sites as determined by RNA-seq analysis performed in OSC cells double KDs of H3K9 methyltransferases. Bars represent the number of split-reads for the env donor and acceptor splicing junctions normalized to the total number of sense Gypsy reads mapping to the same junction. Results are represented as means. Experiments were repeated two times with similar results. d, Coverage of Gypsy consensus sequence by RNA-seq data. Coverage was calculated as: [number of reads matching Gypsy consensus sequence × read length in nucleotides]/Length of consensus Gypsy sequence in nucleotides (7469nt). Raw data sets from Ohtani et al, 20137; Sienski et al, 20159; Iwasaki et al, 201625.
Extended data Figure 8. rhino ChIP-qPCR analysis in adult ovaries of non-dysgenic and dysgenic progeny grown at 18°C.
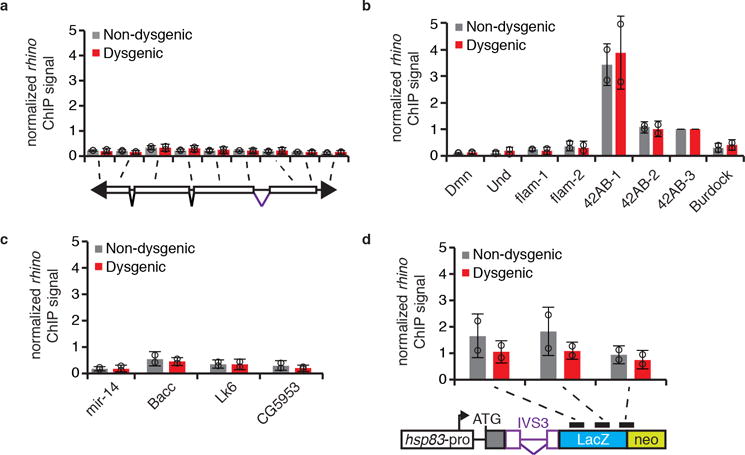
rhino ChIP-qPCR analysis on P-element (a), controls (b), sequences flanking transcriptionally active P-insertions in the Harwich strain (c), and transgenic IVS3 splicing reporter (d) in non-dysgenic (grays) and dysgenic (red) progeny. Bars represent means of Rhino signal, normalized to a control genomic region in the 42AB locus (42AB-3), ± standard deviation (n=2 independent biological replicate experiments). b, Dmn, Und, and flam are negative controls; 42AB is a positive control. d, Diagram of transgenic IVS3 splicing reporter is presented below the graph. Black rectangles indicate regions probed by ChIP-qPCR. All experiments were performed with ovaries of adult progeny from non-dysgenic and dysgenic crosses grown at 18°C.
Supplementary Material
Acknowledgments
We thank A. Zamparini and J. Seifert for early discussions and assistance with developmental analysis; L. Barton for assistance with PGC sorting; T. Treck for advice on RNA FISH; R. Sachidanandam for small RNA analysis assistance; J. Brennecke, P. Andersen, and F. Roudier for advice on ChIP; A. Pelisson for early discussions; W. Theurkauf for antibody reagent; Q. Wang for assistance with JUM analysis; P. Macdonald, R. Carthew, E. Lai, P. Zamore, the Vienna Drosophila Resource Center, and the Bloomington Drosophila Stock Center for fly reagents; the NYUMC Genome Technology Center and the NYUMC Cytometry Center, supported by NIH P30CA016087, for sequencing and cell sorting support. FKT was supported by EMBO and HFSP fellowships and CDM by a HHWF fellowship. RL is supported by NIH R37HD41900 and is an HHMI investigator. DR is supported by NIH R35-118121-02 and NIH R01-097352.
Footnotes
Author Contributions F.K.T and R.L. conceived the idea. F.K.T., R.L., and D.R. designed the experiments. F.K.T. and M.O. performed the experiments, with the help of C.D.M. and R.C.. F.K.T., R.L., and D.R. wrote the manuscript with input from all authors.
Author Information The authors declare no competing financial interests. Readers are welcome to comment on the online version of the paper.
References
- 1.Slotkin RK, Martienssen R. Transposable elements and the epigenetic regulation of the genome. Nat Rev Genet. 2007;8:272–285. doi: 10.1038/nrg2072. [DOI] [PubMed] [Google Scholar]
- 2.Czech B, Hannon GJ. One Loop to Rule Them All: The Ping-Pong Cycle and piRNA-Guided Silencing. Trends Biochem Sci. 2016;41:324–337. doi: 10.1016/j.tibs.2015.12.008. [DOI] [PMC free article] [PubMed] [Google Scholar]
- 3.Kidwell MG, Kidwell JF, Sved JA. Hybrid Dysgenesis in DROSOPHILA MELANOGASTER: A Syndrome of Aberrant Traits Including Mutation, Sterility and Male Recombination. Genetics. 1977;86:813–833. doi: 10.1093/genetics/86.4.813. [DOI] [PMC free article] [PubMed] [Google Scholar]
- 4.Bingham PM, Kidwell MG, Rubin GM. The molecular basis of P-M hybrid dysgenesis: the role of the P element, a P-strain-specific transposon family. Cell. 1982;29:995–1004. doi: 10.1016/0092-8674(82)90463-9. [DOI] [PubMed] [Google Scholar]
- 5.Muerdter F, et al. A genome-wide RNAi screen draws a genetic framework for transposon control and primary piRNA biogenesis in Drosophila. Mol Cell. 2013;50:736–748. doi: 10.1016/j.molcel.2013.04.006. [DOI] [PMC free article] [PubMed] [Google Scholar]
- 6.Dönertas D, Sienski G, Brennecke J. Drosophila Gtsf1 is an essential component of the Piwi-mediated transcriptional silencing complex. Genes Dev. 2013;27:1693–1705. doi: 10.1101/gad.221150.113. [DOI] [PMC free article] [PubMed] [Google Scholar]
- 7.Ohtani H, et al. DmGTSF1 is necessary for Piwi-piRISC-mediated transcriptional transposon silencing in the Drosophila ovary. Genes Dev. 2013;27:1656–1661. doi: 10.1101/gad.221515.113. [DOI] [PMC free article] [PubMed] [Google Scholar]
- 8.Yu Y, et al. Panoramix enforces piRNA-dependent cotranscriptional silencing. Science. 2015;350:339–342. doi: 10.1126/science.aab0700. [DOI] [PMC free article] [PubMed] [Google Scholar]
- 9.Sienski G, et al. Silencio/CG9754 connects the Piwi-piRNA complex to the cellular heterochromatin machinery. Genes Dev. 2015;29:2258–2271. doi: 10.1101/gad.271908.115. [DOI] [PMC free article] [PubMed] [Google Scholar]
- 10.Pélisson A, et al. Gypsy transposition correlates with the production of a retroviral envelope-like protein under the tissue-specific control of the Drosophila flamenco gene. EMBO J. 1994;13:4401–4411. doi: 10.1002/j.1460-2075.1994.tb06760.x. [DOI] [PMC free article] [PubMed] [Google Scholar]
- 11.Brennecke J, et al. Discrete Small RNA-Generating Loci as Master Regulators of Transposon Activity in Drosophila. Cell. 2007;128:1089–1103. doi: 10.1016/j.cell.2007.01.043. [DOI] [PubMed] [Google Scholar]
- 12.Lécher P, Bucheton A, Pélisson A. Expression of the Drosophila retrovirus gypsy as ultrastructurally detectable particles in the ovaries of flies carrying a permissive flamenco allele. J Gen Virol. 1997;78(Pt 9):2379–2388. doi: 10.1099/0022-1317-78-9-2379. [DOI] [PubMed] [Google Scholar]
- 13.Song SU, Kurkulos M, Boeke JD, Corces VG. Infection of the germ line by retroviral particles produced in the follicle cells: a possible mechanism for the mobilization of the gypsy retroelement of Drosophila. Development. 1997;124:2789–2798. doi: 10.1242/dev.124.14.2789. [DOI] [PubMed] [Google Scholar]
- 14.Malone CD, Lehmann R, Teixeira FK. The cellular basis of hybrid dysgenesis and Stellate regulation in Drosophila. Curr Opin Genet Dev. 2015;34:88–94. doi: 10.1016/j.gde.2015.09.003. [DOI] [PMC free article] [PubMed] [Google Scholar]
- 15.Kidwell MG, Novy JB. Hybrid Dysgenesis in DROSOPHILA MELANOGASTER: Sterility Resulting from Gonadal Dysgenesis in the P-M System. Genetics. 1979;92:1127–1140. doi: 10.1093/genetics/92.4.1127. [DOI] [PMC free article] [PubMed] [Google Scholar]
- 16.Brennecke J, et al. An epigenetic role for maternally inherited piRNAs in transposon silencing. Science. 2008;322:1387–1392. doi: 10.1126/science.1165171. [DOI] [PMC free article] [PubMed] [Google Scholar]
- 17.Majumdar S, Rio DC. P Transposable Elements in Drosophila and other Eukaryotic Organisms. Microbiology Spectrum. 2015;3 doi: 10.1128/microbiolspec.MDNA3-0004-2014. MDNA3–0004–2014. [DOI] [PMC free article] [PubMed] [Google Scholar]
- 18.Siebel CW, Fresco LD, Rio DC. The mechanism of somatic inhibition of Drosophila P-element pre-mRNA splicing: multiprotein complexes at an exon pseudo-5′ splice site control U1 snRNP binding. Genes Dev. 1992;6:1386–1401. doi: 10.1101/gad.6.8.1386. [DOI] [PubMed] [Google Scholar]
- 19.Siebel C, Rio D. Regulated splicing of the Drosophila P transposable element third intron in vitro: somatic repression. Science. 1990;248:1200–1208. doi: 10.1126/science.2161558. [DOI] [PubMed] [Google Scholar]
- 20.Roche SE, Schiff M, Rio DC. P-element repressor autoregulation involves germ-line transcriptional repression and reduction of third intron splicing. Genes Dev. 1995;9:1278–1288. doi: 10.1101/gad.9.10.1278. [DOI] [PubMed] [Google Scholar]
- 21.Wang SH, Elgin SCR. Drosophila Piwi functions downstream of piRNA production mediating a chromatin-based transposon silencing mechanism in female germ line. Proc Natl Acad Sci USA. 2011;108:21164–21169. doi: 10.1073/pnas.1107892109. [DOI] [PMC free article] [PubMed] [Google Scholar]
- 22.Sienski G, Dönertas D, Brennecke J. Transcriptional Silencing of Transposons by Piwi and Maelstrom and Its Impact on Chromatin State and Gene Expression. Cell. 2012;151:964–980. doi: 10.1016/j.cell.2012.10.040. [DOI] [PMC free article] [PubMed] [Google Scholar]
- 23.Holoch D, Moazed D. RNA-mediated epigenetic regulation of gene expression. Nat Rev Genet. 2015;16:71–84. doi: 10.1038/nrg3863. [DOI] [PMC free article] [PubMed] [Google Scholar]
- 24.Pezic D, Manakov SA, Sachidanandam R, Aravin AA. piRNA pathway targets active LINE1 elements to establish the repressive H3K9me3 mark in germ cells. Genes Dev. 2014;28:1410–1428. doi: 10.1101/gad.240895.114. [DOI] [PMC free article] [PubMed] [Google Scholar]
- 25.Iwasaki YW, et al. Piwi Modulates Chromatin Accessibility by Regulating Multiple Factors Including Histone H1 to Repress Transposons. Mol Cell. 2016;63:408–419. doi: 10.1016/j.molcel.2016.06.008. [DOI] [PubMed] [Google Scholar]
- 26.Zhang Z, et al. The HP1 homolog rhino anchors a nuclear complex that suppresses piRNA precursor splicing. Cell. 2014;157:1353–1363. doi: 10.1016/j.cell.2014.04.030. [DOI] [PMC free article] [PubMed] [Google Scholar]
- 27.Ong-Abdullah M, et al. Loss of Karma transposon methylation underlies the mantled somaclonal variant of oil palm. Nature. 2015;525:533–537. doi: 10.1038/nature15365. [DOI] [PMC free article] [PubMed] [Google Scholar]
- 28.Zarnack K, et al. Direct competition between hnRNP C and U2AF65 protects the transcriptome from the exonization of Alu elements. Cell. 2013;152:453–466. doi: 10.1016/j.cell.2012.12.023. [DOI] [PMC free article] [PubMed] [Google Scholar]
- 29.Naftelberg S, Schor IE, Ast G, Kornblihtt AR. Regulation of alternative splicing through coupling with transcription and chromatin structure. Annu Rev Biochem. 2015;84:165–198. doi: 10.1146/annurev-biochem-060614-034242. [DOI] [PubMed] [Google Scholar]
- 30.Nojima T, et al. Mammalian NET-Seq Reveals Genome-wide Nascent Transcription Coupled to RNA Processing. Cell. 2015;161:526–540. doi: 10.1016/j.cell.2015.03.027. [DOI] [PMC free article] [PubMed] [Google Scholar]
- 31.Sano H, Renault AD, Lehmann R. Control of lateral migration and germ cell elimination by the Drosophila melanogaster lipid phosphate phosphatases Wunen and Wunen 2. J Cell Biol. 2005;171:675–683. doi: 10.1083/jcb.200506038. [DOI] [PMC free article] [PubMed] [Google Scholar]
- 32.Van Doren M, Williamson AL, Lehmann R. Regulation of zygotic gene expression in Drosophila primordial germ cells. Curr Biol. 1998;8:243–246. doi: 10.1016/s0960-9822(98)70091-0. [DOI] [PubMed] [Google Scholar]
- 33.Styhler S, Nakamura A, Swan A, Suter B, Lasko P. vasa is required for GURKEN accumulation in the oocyte, and is involved in oocyte differentiation and germline cyst development. Development. 1998;125:1569–1578. doi: 10.1242/dev.125.9.1569. [DOI] [PubMed] [Google Scholar]
- 34.Seifert JRK, Lehmann R. Drosophila primordial germ cell migration requires epithelial remodeling of the endoderm. Development. 2012;139:2101–2106. doi: 10.1242/dev.078949. [DOI] [PMC free article] [PubMed] [Google Scholar]
- 35.Maimon I, Gilboa L. Dissection and staining of Drosophila larval ovaries. J Vis Exp. 2011 doi: 10.3791/2537. [DOI] [PMC free article] [PubMed] [Google Scholar]
- 36.Trcek T, et al. Drosophila germ granules are structured and contain homotypic mRNA clusters. Nat Commun. 2015;6:7962. doi: 10.1038/ncomms8962. [DOI] [PMC free article] [PubMed] [Google Scholar]
- 37.Ricardo S, Lehmann R. An ABC transporter controls export of a Drosophila germ cell attractant. Science. 2009;323:943–946. doi: 10.1126/science.1166239. [DOI] [PMC free article] [PubMed] [Google Scholar]
- 38.Teixeira FK, et al. ATP synthase promotes germ cell differentiation independent of oxidative phosphorylation. Nat Cell Biol. 2015;17:689–696. doi: 10.1038/ncb3165. [DOI] [PMC free article] [PubMed] [Google Scholar]
- 39.Rozhkov NV, Hammell M, Hannon GJ. Multiple roles for Piwi in silencing Drosophila transposons. Genes Dev. 2013;27:400–412. doi: 10.1101/gad.209767.112. [DOI] [PMC free article] [PubMed] [Google Scholar]
- 40.Klattenhoff C, et al. The Drosophila HP1 homolog Rhino is required for transposon silencing and piRNA production by dual-strand clusters. Cell. 2009;138:1137–1149. doi: 10.1016/j.cell.2009.07.014. [DOI] [PMC free article] [PubMed] [Google Scholar]
- 41.Han BW, Wang W, Zamore PD, Weng Z. piPipes: a set of pipelines for piRNA and transposon analysis via small RNA-seq, RNA-seq, degradome- and CAGE-seq, ChIP-seq and genomic DNA sequencing. Bioinformatics. 2015;31:593–595. doi: 10.1093/bioinformatics/btu647. [DOI] [PMC free article] [PubMed] [Google Scholar]
- 42.Langmead B, Salzberg SL. Fast gapped-read alignment with Bowtie 2. Nat Methods. 2012;9:357–359. doi: 10.1038/nmeth.1923. [DOI] [PMC free article] [PubMed] [Google Scholar]
- 43.Roberts A, Pachter L. Streaming fragment assignment for real-time analysis of sequencing experiments. Nat Methods. 2013;10:71–73. doi: 10.1038/nmeth.2251. [DOI] [PMC free article] [PubMed] [Google Scholar]
- 44.Wang Q, Rio D. The Junction Usage Model (JUM): A method for comprehensive annotation-free differential analysis of tissue-specific global alternative pre-mRNA splicing patterns. 2017 doi: 10.1101/116863. [DOI] [Google Scholar]
- 45.Wang Q, et al. The PSI-U1 snRNP interaction regulates male mating behavior in Drosophila. Proc Natl Acad Sci USA. 2016;113:5269–5274. doi: 10.1073/pnas.1600936113. [DOI] [PMC free article] [PubMed] [Google Scholar]
- 46.Dobin A, et al. STAR: ultrafast universal RNA-seq aligner. Bioinformatics. 2013;29:15–21. doi: 10.1093/bioinformatics/bts635. [DOI] [PMC free article] [PubMed] [Google Scholar]
- 47.Afgan E, et al. The Galaxy platform for accessible, reproducible and collaborative biomedical analyses: 2016 update. Nucleic Acids Res. 2016;44:W3–W10. doi: 10.1093/nar/gkw343. [DOI] [PMC free article] [PubMed] [Google Scholar]
- 48.Kim D, et al. TopHat2: accurate alignment of transcriptomes in the presence of insertions, deletions and gene fusions. Genome Biol. 2013;14:R36. doi: 10.1186/gb-2013-14-4-r36. [DOI] [PMC free article] [PubMed] [Google Scholar]
- 49.Robinson JT, et al. Integrative genomics viewer. Nat Biotechnol. 2011;29:24–26. doi: 10.1038/nbt.1754. [DOI] [PMC free article] [PubMed] [Google Scholar]
- 50.Quadrana L, et al. The Arabidopsis thaliana mobilome and its impact at the species level. Elife. 2016;5:6919. doi: 10.7554/eLife.15716. [DOI] [PMC free article] [PubMed] [Google Scholar]
- 51.Zhang Y, et al. Model-based analysis of ChIP-Seq (MACS) Genome Biol. 2008;9:R137. doi: 10.1186/gb-2008-9-9-r137. [DOI] [PMC free article] [PubMed] [Google Scholar]
- 52.Khurana JS, et al. Adaptation to P element transposon invasion in Drosophila melanogaster. Cell. 2011;147:1551–1563. doi: 10.1016/j.cell.2011.11.042. [DOI] [PMC free article] [PubMed] [Google Scholar]
- 53.Li H, Durbin R. Fast and accurate short read alignment with Burrows-Wheeler transform. Bioinformatics. 2009;25:1754–1760. doi: 10.1093/bioinformatics/btp324. [DOI] [PMC free article] [PubMed] [Google Scholar]
- 54.Zhuang J, Wang J, Theurkauf W, Weng Z. TEMP: a computational method for analyzing transposable element polymorphism in populations. Nucleic Acids Res. 2014;42:6826–6838. doi: 10.1093/nar/gku323. [DOI] [PMC free article] [PubMed] [Google Scholar]
Associated Data
This section collects any data citations, data availability statements, or supplementary materials included in this article.
Supplementary Materials
Data Availability Statement
Sequencing data generated during the current study are available in the NCBI Gene Expression Omnibus repository under accession number GSE103582.