

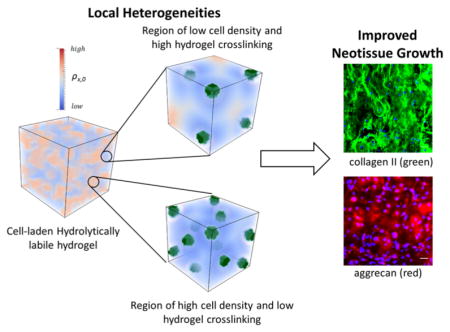
Abstract
Hydrolytically degradable poly(ethylene glycol) (PEG) hydrogels are promising platforms for cell encapsulation and tissue engineering. However, hydrolysis leads to bulk degradation and a decrease in hydrogel mechanical integrity. Despite these challenges, hydrolytically degradable hydrogels have supported macroscopic neotissue growth. The goal of this study was to combine experimental methods with a multiscale mathematical model to analyze hydrogel degradation concomitant with neocartilage growth in PEG hydrogels. Primary bovine chondrocytes were encapsulated at increasing densities (50, 100, and 150 million cells/mL of precursor solution) in a radical-mediated photoclickable hydrogel formed from 8-arm PEG-co-caprolactone end-capped with norbornene and cross-linked with PEG dithiol. Two observations were made in the experimental system: (1) the cell distribution was not uniform and cell clustering was evident, which increased with increasing cell density and (2) a significant decrease in the initial hydrogel compressive modulus was observed with increasing cell concentration. By introducing heterogeneities in the form of cell clusters and spatial variations in the network structure around cells, the mathematical model explained the drop in initial modulus and captured the experimentally observed spatial evolution of ECM and the construct modulus as a function of cell density and culture time. Overall, increasing cell density led to improved ECM formation, ECM connectivity, and overall modulus. This study strongly points to the importance of heterogeneities within a cell-laden hydrogel in retaining mechanical integrity as the construct transitions from hydrogel to neotissue.
Keywords: chondrocytes, poly(ethylene glycol), cartilage tissue engineering, hydrolytic degradation
Graphical Abstract
INTRODUCTION
Synthetic hydrogels designed with cross-links that are susceptible to hydrolysis are promising for tissue engineering.1 The use of synthetic precursors enables hydrogels to be formed with highly reproducible and controllable macroscopic properties. Furthermore, the choice of chemistry for the hydrolytically labile linker provides control over the degradation kinetics.2,3 Thus, a wide range of mechanical properties (e.g., moduli of 1 to 1000 kPa) and degradation profiles (e.g., spanning days to months) can be achieved. As such, hydrolytically labile hydrogels have been investigated for a range of tissue engineering applications including cartilage,4–7 bone,8–10 tendon and ligament,11,12 neural,13 and smooth muscle and vascular.14,15
One of the challenges of using synthetic hydrogels for cell encapsulation and tissue engineering is that the mesh size (ca. one to tens of nanometers) of the polymer network is much smaller than the size of many extracellular matrix (ECM) molecules that make up tissues. For example, mature collagen fibers can reach ca. one to tens of thousands of nanometers in length.16,17 Thus, degradation is necessary to achieve macroscopic tissue growth. The highly water-swollen nature of the hydrogel leads to bulk degradation and consequently an exponential decrease in cross-link density with time.18,19 However, a point is reached at which a sufficient number of cross-links has been cleaved and the hydrogel transitions from a cross-linked polymer to a water-soluble branched polymer, a phenomenon referred to as reverse gelation.19,20 Although the mesh size increases as cross-links are broken during degradation, it is still too small even at reverse gelation to enable the large ECM molecules, like collagen fibers, to diffuse through the network and deposit.21 As a result, reverse gelation must occur simultaneously with ECM macroscopic growth in order to achieve a seamless transition from hydrogel to neotissue and prevent loss of mechanical integrity. This requirement is particularly challenging given the inherent variability in tissue synthesis capabilities by cells as a function of donor (e.g., donor age, cell type, etc.).
Despite these challenges, hydrolytically degradable hydrogels with encapsulated cells have yielded a macroscopic engineered tissue,4,10 suggesting an important underlying phenomenon that is important to their success. A previous study reported polymer network heterogeneities at the micrometer-scale when cartilage cells (i.e., chondrocytes) were encapsulated in poly(ethylene glycol) hydrogels formed by radical mediated chain polymerization.22 This finding was evident by the observation of large spatial variations in cell deformation, which arise due to spatial variations in the polymer network structure, despite a uniform macroscopic deformation applied to the hydrogel. The spatial variation in cell deformation has also been shown to be dependent on the type of radical polymerization.23 Although the exact mechanism that contributed to the macroscopic heterogeneities of the network was not identified, another study reported that cells during encapsulation are capable of reacting with propagating radicals24 and thus can quench these radicals to locally inhibit polymerization. This process reduces the effective cross-linking of the hydrogel immediately around cells. Collectively, these findings point to the existence of network heterogeneities in cell-laden hydrogels that result in spatial variations of the hydrogel cross-link density due to cellular interactions with propagating radicals. Such heterogeneities in cross-linking may help explain why hydrolytically degradable hydrogels have, in some cases, promoted neotissue growth. A better understanding of the role of network heterogeneity on macroscopic tissue growth is, however, needed.
The goal of this study was to combine experimental approaches with computational models to identify spatial heterogeneities that form in a cell-laden hydrogel and investigate their impact on macroscopic tissue evolution. We employed a recently developed mathematical model that describes the coupled phenomena of hydrogel degradation and ECM elaboration by encapsulated cells25,26 to identify spatial heterogeneities. For the experimental approach, we chose a hydrolytically degradable and photoclickable poly-(ethylene glycol) (PEG) hydrogel (Figure 1) that we recently described and demonstrated its promise in cartilage tissue engineering leading to macroscopic cartilage-like tissue growth.4 In the work herein, cell density was varied as a means to investigate how cell proximity combined with local network heterogeneities impact ECM growth during hydrogel degradation. Chondrocytes and their associated cartilaginous ECM, which is rich in collagen, was used as a model system. Using a combined experimental and computational approach, we provide evidence for the importance of local heterogeneities in the form of spatial variations in network structure and in cell cluster formation. The latter is defined as regions of increased local cell density where cells are located in close proximity relative to the overall cell distribution. The presence of these heterogeneities enabled macroscopic ECM elaboration while minimizing loss of mechanical integrity of the evolving construct. This new insight may offer novel approaches to introduce heterogeneities into hydrogels which lead to spatial variations in hydrogel degradation and thus may overcome some of the challenges with using hydrolytically degradable hydrogels for cell encapsulation and tissue engineering.
Figure 1.

(A) PEG-CAP-NB is reacted with (B) PEGdSH in the presence of photoinitiator and UV light to form a (C) cross-linked hydrogel (an ideal network is shown). (D) This network undergoes hydrolysis to form soluble degradation products.
MATERIALS AND METHODS
Macromer Synthesis
Macromers of 8-arm PEG-caprolactone functionalized with norbornene (PEG-CAP-NB) (Figure 1A) were synthesized in a two-step process using protocols adapted from Bryant et al.27 Briefly, 8-arm PEG-hexaglycerol (20 kDa, JenKem Technology, Allen, TX) was reacted with 1.5 molar excess ε-caprolactone using tin(II) ethylhexanoate as the ring opening catalyst. The reaction was carried out at 140 °C for 6 h under vacuum. The intermediate product PEG-CAP was recovered by precipitation in ice-cold diethyl ether. PEG-CAP was reacted overnight at room temperature under argon with N,N′-diisopropylcarbodiimide (10 molar excess), 4-dimethylaminopyridine (1 molar excess), pyridine (10 molar excess), and 5-norbornene-2-carboxylic acid (10 molar excess) in dichloromethane. The final product, PEG-CAP-NB, was purified through filtration over activated carbon and precipitated in diethyl ether. The precipitate was dried and dissolved in a minimal amount of chloroform. The solution was washed twice in a glycine buffer and once in a brine solution. The purified product was recovered via precipitation in diethyl ether, lyophilized, and confirmed by 1H nuclear magnetic resonance spectroscopy. The number of caprolactones per PEG arm was determined to be on average 1.26 by comparing the peak area for the methylene protons in the caprolactone (δ = 2.25–2.4 ppm) to the peak area of the methylene protons in PEG (δ = 3.25–3.9 ppm). Norbornene conjugation was determined to be 65% by comparing the peak area of the vinyl protons (δ = 5.9–6.25 ppm) to the methylene protons in PEG.
Chondrocyte Isolation
Chondrocytes were harvested from bovine articular cartilage from the femoral patellar groove and femoral condyles of a 1–3 week old calf (Research 87, Marlborough, MA). Cartilage slices were rinsed in phosphate-buffered saline (PBS) supplemented with 50 U/mL penicillin and 50 μg/mL streptomycin (P/S), 0.5 μg/mL fungizone, and 20 μg/mL gentamicin (Invitrogen, Carlsbad, CA). Cartilage slices were digested for 15–17 h at 37 °C in 600 U/mL collagenase type II (Worthington Biochemical, Lakewood, NJ) in Dulbecco’s Modified Eagle Medium (DMEM) (Invitrogen, Carlsbad, CA) with 5% fetal bovine serum (FBS) (Atlanta Biologicals, Lawrenceville, GA). The cartilage digest was filtered through a 100 μm cell strainer (Falcon, Corning, NY) and collagenase was inactivated with 0.02% ethylenediaminetetraacetic acid in PBS (Invitrogen, Carlsbad, CA). Chondrocytes were recovered and washed in PBS by several centrifugation steps and resuspended in PBS with antibiotics. Cell viability was >70% postdigestion as determined using the Trypan Blue exclusion assay (Invitrogen, Carlsbad, CA).
Chondrocyte Encapsulation and Culture
PEG-CAP-NB was solublilized in PBS 1 day before cell encapsulation and stored at 4 °C to minimize hydrolysis. A precursor solution was prepared with 10% (g/g) PEG-CAP-NB, PEG dithiol (Figure 1B) (PEGdSH 1 kDa, 1:1 moles of thiol to norbornene, Sigma-Aldrich, St. Louis, MO), and 0.05% (g/g) photoinitiator (Irgacure 2959, Ciba Specialty Chemicals, Tarrytown, NY) in PBS. Freshly isolated chondrocytes were combined with the precursor solution at 50, 100, or 150 million cells/mL precursor solution. Cell-laden PEG-CAP hydrogels were formed by photopolymerization with UV light (352 nm, 6 mW/cm2) for 7 min (Figure 1C). Hydrogels were rinsed in PBS with antibiotics and then cultured in 4.5 mL of chondrocyte growth medium (DMEM supplemented with 10% FBS, 50 U/mL P/50 μg/mL S, 0.5 μg/mL fungizone, 20 μg/mL gentamicin, 10 mM HEPES buffer, 0.1 M MEM-NEAA, 0.4 mM L-proline, 4 mM GlutaGro, 110 mg/L sodium pyruvate, and 50 mg/mL L-ascorbic acid) at 37 °C and 5% CO2 in a humid environment. The medium was changed every 2–3 d.
Hydrogel Construct Characterization
Cell viability was assessed with the LIVE/DEAD assay (Invitrogen, Carlsbad, CA) at 0, 4, and 12 weeks on constructs (n = 2) per experimental condition. Constructs were cut in half and images were acquired from different regions of a cross section within the constructs at 100× using a confocal laser scanning microscope (Zeiss LSM 5 Pascal). The other half of each construct was used for immunohistochemistry as described below. At week 0 (i.e., 24 h postencapsulation), 4, and 12, hydrogels were assessed for compressive modulus (n = 3). The diameter and height of the hydrogels were recorded. Hydrogels were compressed to 15% strain at a rate of 0.5 mm/min (MTS Synergie 100, 10 N). The compressive modulus was measured by estimating the slope of the linear region of stress–strain curves from 10 to 15% strain.
Biochemical Analysis
The same constructs processed for compression tests were subsequently analyzed for biochemical content (n = 3). The lyophilized hydrogels were homogenized using a TissueLyser and enzymatically digested in 0.125 mg/mL papain for 18 h at 60 °C. The DNA content was determined using Hoechst 33258 (Polysciences, Inc. Warrington, PA).28 Cell number was determined based on DNA content, assuming 7.7 pg of DNA per chondrocyte.28 The dimethyl methylene blue (DMMB, Sigma-Aldrich St. Louis, MO) colorimetric assay was used to measure the amount of sulfated glycosaminoglycans (sGAGs).29 Total collagen content was assessed using the hydroxyproline assay and assuming a 10% hydroxyproline content in collagen.30 Bovine cartilage explants were also analyzed for biochemical and DNA content.
Immunohistochemistry
At weeks 0 (24 h postencapsulation), 4, and 12 half constructs were harvested for immunohistochemical analysis (IHC) (n = 2). Constructs were fixed overnight in 4% paraformaldehyde at 4 °C and transferred to 30% sucrose in PBS for 2–3 d. Samples were embedded in TissueTek OCT compound (Sakura Finetek USA, Torrance, CA) and frozen in isopentane and liquid nitrogen. Sections (10 μm) were obtained from the center of the construct (the cut side) with a Leica CM1850 cryostat (Leica Microsystems Inc., Buffalo Grove, IL). Sections were stained with primary antibodies for collagen II (1:50, C7510-21C, US Biologicals, Swampscott, MA) and aggrecan (1:100, ab3778, Abcam). Prior to antibody treatment, sections underwent antigen retrieval (Retrievagen A, BD Biosciences, San Jose, CA) and were treated with 200 U hyaluronidase (Sigma-Aldrich, St. Louis, MO) (for anticollagen II and antiaggrecan), or 3.4 mU keratanase I (MP Biomedical, Solon, OH), and 10 mU chondroitinase-ABC (Sigma-Aldrich) (for antiaggrecan) for 1 h at 37 °C. After primary antibody treatment, sections were treated with either AlexaFluor 488 or 546 conjugated secondary antibodies (Invitrogen, Carlsbad, CA) for collagen II and aggrecan, respectively. Cell nuclei were counterstained with DAPI (Invitrogen). Stained sections were mounted with Fluoromount-G (Southern Biotech, Birmingham, AL) and imaged via laser scanning confocal microscopy at 100x and 400x. Sections receiving no primary antibody treatment served as negative controls.
Modeling
Since the global growth process and local degradation around cells occur at different length-scales (millimeter and micrometer, respectively), we adopted a hierarchical multiscale approach31 that follows three steps (Figure 2). At the submicro level, the model describes the hydrogel properties (i.e., cross-linking density and mechanical properties) that evolve over time as the hydrogel degrades. At the microlevel, the construct is described by representative volume elements (RVEs) containing a finite number of cells embedded in a hydrogel whose cross-link density (ρx) can vary with distance (x) and time (t) such that ρx(x,t). Diffusion of ECM molecules depends on hydrogel cross-linking. At the macro level, large populations of cells are considered as well as their effect on the evolution of mechanical properties that result from hydrogel degradation and ECM growth.
Figure 2.

A hierarchical multiscale computational approach of a cell-laden hydrogel. The submicroscale is represented by the hydrogel. The microscale is represented by a finite number of cells embedded in a hydrogel whose cross-link density varies according to its distance from the cell. The macroscale is represented by a macroscopic hydrogel construct for which cell density is located at a macroscopic point xi and is represented by a heterogeneous function f(x).
The model at the submicroscale was used to describe hydrogel properties as a function of space and time resulting from hydrogel degradation. The polymer network undergoes hydrolytic degradation of ester bonds that flank the ends of each crosslink. Hydrogel degradation continues until it reaches reverse gelation, the point at which a sufficient number of cross-links has been cleaved such that the hydrogel transitions from a solid polymer network to highly branched soluble polymer chains. The critical cross-link density, ρc, is defined as the cross-link density when the hydrogel reaches reverse gelation. The value of ρc was determined experimentally by degrading PEG-CAP hydrogels in chondrocyte growth medium, but in the absence of cells. The cross-link density immediately prior to reverse gelation was determined from the experimental measurements of mass swelling ratio, density of the polymer and solvent, and the compressive modulus, which relate to cross-link density through Flory–Rehner and rubber elasticity theories32 following methods described by Akalp et al.33
The mechanics of the hydrogel construct, which comprises the hydrogel and deposited ECM are dictated by two mechanisms. First, the degradation of the gel which is assumed to follow a pseudo-first-order kinetics such that
| (1) |
where k is a pseudo-first-order reaction rate constant for hydrolysis. While, polycaprolactone has been shown to degrade by enzymes (e.g., esterases and lipases34), we have observed no appreciable influence of the culture medium4 or medium conditioned by chondrocytes on hydrogel degradation (unpublished data). Therefore, hydrolysis is considered to be the primary mechanism of degradation. When the hydrogel reaches reverse gelation (ρc), the hydrogel is no longer cross-linked. The kinetic constant was determined experimentally by fitting the degradation of PEG-CAP gels (as described above for determining ρc) to an exponential decay function. Second, the diffusion of cell-secreted ECM molecules occurs at the cell membrane and is modeled with the classical reaction–diffusion equation
| (2) |
where cm is the unlinked fluid-like ECM concentration, Dm is the diffusion constant and Sm = kmcm is the rate of linkage of ECM molecules depending linearly on cm. The constant km is calculated to fit the model prediction and experimental observations. The rate of production of ECM at the cell surface is described in terms of the flux, Jm, which is assumed to behave homeostatically as , and applied as boundary a condition for solving eq 2. The deposition of solid-like linked ECM is given by ∂c̄/∂t = Sm, where c̄ is the concentration of linked ECM.
To model diffusion of newly synthesized and secreted ECM molecules, several assumptions were made. We only consider the main two cartilage ECM molecules, aggrecan and collagen type II, which make up the majority of the ECM of cartilage. Because these two ECM macromolecules are quite large (collagen type II has been reported to be 20 000 nm35 and full length aggrecan has been reported to be up to 400 nm36) relative to the mesh size of the hydrogel (ca., 10–100 nm), their diffusion will be restricted to the space immediately surrounding the cell.17 The diffusivity of the ECM molecules, Dm, vanishes to zero when the hydrogel is intact. Once the hydrogel cross-link density reaches the critical cross-linking density at reverse gelation (i.e., ρx ≤ ρc), diffusion of the ECM molecules occurs and is assumed to follow diffusion in the swelling solvent (i.e., culture medium, which is assumed to have similar properties to water) at 37 °C estimated by the Stokes–Einstein relationship.
Solving the above linear equations with standard finite element techniques in the RVE, it is possible to evaluate the mechanical properties, represented by the Young’s modulus, E, of any point in the microscale domain. The modulus is determined through the knowledge of the cross-link density and ECM concentration. At any point in the microscale domain, the modulus of the construct comprises one of the following: the polymer network, the ECM, or the encapsulated cells. The three components are assumed to be noninterpenetrating; that is, each point is made up of only one component. At small strains, the stress–strain relationship for each component can be generalized from rubber elasticity as
| (3) |
where σi is the stress tensor, εi is the strain tensor, 1 is the identity tensor, Ei is the Young’s modulus, ν is the Poisson’s ratio, R is the gas constant, and T is the temperature. The Poisson’s ratio for the polymer network was assumed to be close to 0.5 for elastic materials.37 The Poisson’s ratio for cartilage ECM is taken as 0.22.38,39 The modulus of the polymer network was estimated from the rubber elasticity theory40 assuming a linear elastic model described by
| (4) |
This relationship has been used to relate the mechanical properties to cross-link density for similar PEG hydrogels.41 The chondrocytes are also treated as incompressible components with an elastic modulus of ~0.6 kPa.42 The modulus of ECM is assumed to be linearly proportional to the concentration of linked ECM molecules that form a solid 3D network, EECM ∝ c̄. We assume that the ECM and chondrocytes follow linear elastic behavior when under small strains and quasi-static loading.
At the microscale, RVEs are used to model local hydrogel degradation as well as synthesis, transport, and deposition of ECM molecules. The model is based on a multiphasic mixture formulation43 that predicts the evolution of hydrogel mechanical properties as a function of hydrogel degradation and the diffusion and deposition of ECM. Using computational homogenization techniques44 that consist of computing the overall compressive stress on the RVE resulting from a compressive strain of 10%, it is possible to calculate the effective Young’s modulus of the construct at different times during the hydrogel degradation–tissue growth process. The overall stress of the RVE derived from homogenization methods45,46 is given as
| (5) |
where V̄ and S̄ are the volume and boundary surface of the RVE, and i and j can take values 1, 2, and 3 to represent different directions. The vector x is the position vector and τ is the traction vector at the boundary surface of the RVE. The modulus of the RVE is given by
| (6) |
where and are the average uniaxial compressive stress and strain on the RVE in the direction of loading (direction 1). Boundary conditions are applied on the RVE to produce an overall compressive strain of in the direction of loading while it is unrestrained in the other two normal directions (directions 2 and 3).
To further examine the evolution of the construct at the macroscale, we build a macroscopic RVE for which the cell density located at a macroscopic point x is represented by a heterogeneous function f(x) a priori determined by a cell cluster analysis on microscopy images stained for live cells (see Hydrogel Construct Characterization section). This was done by counting the number of cells in a rectangular window, small enough to capture local variations in cell distribution, that is traversed over the entire image to obtain the spatial distribution of cell density f(x) in the construct. On the basis of this analysis from multiple images that are from different regions in a construct, regions of relative increased cell density (local maxima) were identified and are herein referred to as cell clusters. The average distance of cells from the center point of the dense region is said to be the cluster size. Using a simple model, the cell clusters and their distribution were characterized using a cluster fraction, which is defined by the average cluster area and number of clusters per unit area of the image, and the cell area fraction within the cluster (fc) and the background regions (fb). A cluster map was generated from each representative microscopy image of live cells. The 2D cluster maps were translated to 3D by adjusting the number of cell clusters, cluster cell population proportionally based on the size and shape of the cluster and thickness of the section in the microscopy image. Clusters were randomly placed within the matrix for each cell density, and the cluster shapes were randomly generated corresponding to the average cluster volume using a self-avoiding random walk algorithm.47 Thus, the function f(x), together with the mapping determined at the microscale, enables us to follow the time evolution of each point in the construct through the function E(x,t) = E(f(x),t). As shown in Figure 2 (macrolevel), a finite-element analysis is then performed to compute the macroscopic secant modulus of the construct using a computational homogenization procedure similar to that introduced at the microscale.
Statistics
Mechanical and biochemical data are presented as the mean with standard deviation (n = 3) or in a dot plot. One-way ANOVA with cell density as the factor was performed for the initial construct characterization at Week 0. Two-way ANOVA was performed in Minitab 17 for modulus and biochemical data with cell density and culture time as the factors. Modeling data are presented as the mean with standard deviation from three simulations.
RESULTS
Chondrocyte Encapsulation and Network Heterogeneities
The experimental system consisted of primary bovine chondrocytes that were encapsulated in a photoclickable and hydrolytically susceptible hydrogel based on PEG-CAP chemistry. Three cell densities were investigated at 50 million (M), 100 M, and 150 M cells per milliliter of precursor solution prior to encapsulation, which are referred to herein as low, medium, and high cell density, respectively. The cell-laden hydrogels were characterized one-day postencapsulation. Viable cells were evident, although some dead cells were also present (Figure 3A). All cell densities exhibited heterogeneous cell distribution with the higher cell densities presenting denser regions of cells. Cell number was determined based on DNA content and the number of cells that were encapsulated with each cell seeding density increased proportionally as expected (Figure 3B). The compressive modulus of the hydrogel in the absence of cells was determined to be 46 kPa, but was lower for the cell-laden hydrogels and decreased (p < 0.0001) with increasing cell density (Figure 3C).
Figure 3.

(A) Representative confocal microscopy images of cell viability one-day after encapsulation in PEG-CAP hydrogels for seeding densities of 50, 100, and 150 million chondrocytes per volume (mL) of precursor solution. Live cells fluoresce green; dead cells fluoresce red; scale bar = 50 μm. (B) Cell number measured through DNA content one-day after encapsulation for seeding densities of 50, 100, and 150 million chondrocytes per volume (mL) of precursor solution. (C) The initial compressive modulus of cell-laden PEG-CAP hydrogel one-day after encapsulation for seeding densities of 0, 50, 100, and 150 million chondrocytes/mL of precursor solution.
The computational model was initially used to describe the hydrogel with encapsulated cells, but prior to hydrogel degradation and ECM deposition. The model parameters (Table 1) included the modulus of the hydrogel, which was assumed to be 46 kPa, as measured experimentally, and the modulus of a chondrocyte, which was assumed to be ~0.6 kPa.42 To capture the experimentally observed spatial heterogeneities in cell distribution, cell clusters were introduced into the computational model (parameters listed in Table 2). At the microscale, the volume fraction of cells (f) can vary where regions have high cell concentration, which are referred to as clusters, and other regions have low cell concentration, which are referred to as background. Herein, cell clusters are defined by local regions of increased cell density f identified by a local cell density map from live cell microscopy images (Figure 4A). Once characterized, 3D simulations were carried out where the clusters were randomly placed in 3D. Representative simulations show cluster size and distribution for each cell density case (Figure 4B). In addition, representative simulations showing the cellular distribution in the background and in the cluster regions are also shown. At the macroscopic scale, regions of high cell density (i.e., a cell cluster) and similar regions of low cell density (i.e., background) are captured in the model. With increasing cell concentration, the clusters were denser (i.e., high local cell density) though the proximity of clusters was not affected by cell seeding density. The experimentally determined initial modulus of the acellular hydrogel was used in the model for the hydrogel modulus. Accounting for spatial heterogeneities in cell distribution and the presence of cells, the computational model predicted the macroscopic compressive modulus of the cell-laden hydrogels with increasing cell density (Figure 4C). A decrease (p < 0.0001) in the modulus with increasing cell concentration was observed, but not to the same extent that was observed experimentally. For example, in the high cell density condition, the model predicted a ~5% drop compared to ~80% drop that was observed experimentally.
Table 1.
Model Parameters
| parameter | definition | value | units | source | |
|---|---|---|---|---|---|
| E0 | initial hydrogel modulus | 46.5 | kPa | experiment | |
| Ecell | cell modulus | 0.6 | kPa | literature40 | |
| ρc | critical cross-link density | 0.0009 | mol/L | experiment | |
| k | degradation rate constant | 0.066 | day−1 | experiment | |
| rcell | cell radius | 5 | μm | literature22 | |
| cm,0 | ECM homeostatic concentration | 1.5 × 10⁻³ | M | experiment | |
| rm | hydrodynamic radius of ECM molecules | >200 | nm | literature34 | |
|
|
diffusion of ECM molecules in pure solvent | 1.7 × 10⁻⁸ | mm2/s | Stokes-Einstein | |
|
|
ECM production rate | 5.2 × 10⁻¹⁷ | mol/cell/day | experiment |
Figure 4.

(A) Top Row: Representative confocal microscopy images of only live cells (green) in hydrogels with encapsulated chondrocytes at low (50 M cells/mL), medium (100 M cells/mL), and high (150 M cells/mL) cell seeding densities, which were used in the cluster analysis. The microscopy images are the same images in Figure 2A, but with only live cells depicted. Scale bar = 50 μm. Bottom Row: 2D simulation results showing representative cluster mapping for each of the three different cell densities. For illustrative purposes, clusters were defined as groups of at least 5 cells within a certain distance of each other. (B) Top/bottom rows: Representative volume elements for microscale background and clustered cell densities, respectively, for low, medium, and high cell seeding densities showing the cross-link density gradient. Cells are shown in green. Middle row: Macroscale constructs with a heterogeneous distribution of cell volume fraction. (C) Modeling results (gray bars) of the initial macroscopic compressive modulus (E0) assuming the hydrogel constructs act as a composite material with the presence of cell clusters and the experimentally determined initial compressive modulus (black squares). Error bars represent standard deviation for the model (n = 5) and experiments (n = 3).
To investigate heterogeneities that result from a spatial variation in cross-link density surrounding the encapsulated cells, we introduce into the model the parameter, Rd (Figure 5A). Rd is defined as the distance between the outer surface of the cell membrane, where cross-link density is zero, and the location at which the cross-link density equals 99% of the initial cross-link density (i.e., that of the initial hydrogel in the absence of cells). For simplicity, we report Rd/Rc where Rc is the radius of a cell. In other words, a value of Rd/Rc = 5 indicates a distance that is 5× the cell radius or 25 μm. We adopted a simple empirical relationship to describe cross-link density as a function of distance (x) from the cell surface:
| (7) |
Figure 5.

(A) Schematic of Rd. The radius Rd is defined as the zone where the hydrogel cross-link density is reduced due to the cell’s interaction with radicals. As such, Rd controls the cross-link density at a distance x from the cell surface. (B) The effect of Rd on the spatial variation in hydrogel cross-link density between two cells. Two cases are shown for a low local cell volume fraction (f = 0.05) and a high local cell volume fraction (f = 0.20) for varying values of Rd. Results from 3D simulations for f = 0.05 and f = 0.20 are shown for the two cases for Rd/Rc = 7 where cells (green) are embedded within a hydrogel. The spatial variation in cross-link density (ρx) is shown decreasing from red (equivalent to the bulk cross-link density) to blue (equivalent to the reverse gelation point). The distance between cells (dcell) varies based on the volume fraction and was 3.43 and 1.42 μm for f = 0.05 and f = 0.20, respectively. (C) Simulation results are shown for the macroscopic compressive modulus for the two cases of cell volume fraction as a function of Rd/Rc. The modulus is normalized to the modulus at Rd = 0. The black line represents f = 0.05 and the gray line represents f = 0.20. Simulation data are presented as mean with standard deviation for n = 3. (D) Simulations for the initial compressive modulus of low, medium, and high cell seeding density are shown as a function of Rd/Rc. An Rd/Rc of 27 was selected based on minimizing the error between simulations and experiments (black squares). Data are presented as a mean with standard deviation (n = 3). (E) The initial compressive modulus for each seeding density for both the experiments (white bars) and simulations with Rd/Rc = 27 (gray bars). Experimental and modeling data are presented as mean with standard deviation (n = 3).
To illustrate the effect of Rd on the spatial variation of hydrogel cross-link density using our model, two macroscopic volume fraction of cells were investigated, f = 0.05 and f = 0.20, and over a range of Rd/Rc values from 0 to 27. The normalized cross-link density (i.e., ρx/ρx,0) was determined as a function of distance from one cell to another (denoted by dcell) (Figure 5B). With increasing cell volume fraction, dcell decreases. Several key observations can be made. For an Rd of zero, the normalized cross-link density is uniform and at a value of 1 across the entire distance between two cells, regardless of the volume fraction of cells. With increasing Rd, the cross-link density varies across the distance between two cells. When the Rd of two cells overlaps, the maximum cross-link density is lower than the initial cross-link density of bulk hydrogel. With a higher volume fraction of cells where cells are closer together, the maximum cross-link density between two cells is even lower for the same Rd due a more pronounced overlap in Rd. Accounting for spatial heterogeneities in cell distribution and the presence of cells (as described above), the macroscopic compressive modulus of the hydrogel was determined for varying values of Rd (Figure 5C). The compressive modulus decreased with increasing Rd and decreased even to a greater extent for higher values of f. Using the model with both cell clusters and the presence of an Rd, we sought to estimate a value of Rd for the experimental PEG-CAP hydrogel system. Since the same hydrogel formulation, encapsulation conditions, and cell source were used in all three cell density conditions, the value of Rd is expected to be similar regardless of cell concentration. The cell cluster size and distribution determined above for each cell density was used. Simulations were run with varying values of Rd. A plot of modulus versus Rd was overlaid with the experimental modulus (Figure 5D). Each simulation was run with a randomly generated cluster distribution resulting in variations between each simulation. A value of 27 was estimated for Rd/Rc or an Rd of 135 μm for the constructs. The experimental modulus and the computationally determined modulus with an Rd/Rc of 27 are also shown in Figure 5E. The experimentally determined modulus shown in Figure 5E is the same as in Figure 4C.
Tissue Deposition in Chondrocyte-Laden Hydrogels
Cell-laden hydrogels for each cell density were cultured up to 12 weeks and assessed for compressive modulus, cellular content, and biochemical content (Figure 6 with results from a two-way ANOVA reported in Table 3). The compressive modulus varied (p = 0.001) with time and was moderately affected (p = 0.1) by cell density. There was interaction (p = 0.01) between time and cell density. For example, the modulus for the low cell density condition dropped (p = 0.14) slightly at week 4, but then increased (p = 0.007) by week 12. On the contrary for the high cell density case, the modulus increased (p = 0.01) with time. DNA content did not vary (p = 0.86) with time, but was affected (p < 0.001) by cell density, as expected. The sulfated glycosaminoglycan (sGAG) content increased (p < 0.001) with time and was moderately affected (p = 0.08) by cell density. By week 12, the high cell density condition had the highest sGAG content. When normalized to DNA, sGAG was affected (p = 0.053) by cell density and affected (p < 0.001) by time with the highest sGAG content in the high cell density condition at week 12. Total collagen content increased (p < 0.001) with time and was moderately affected (p = 0.08) by cell density. By week 12, the high cell density condition had the highest total content. When normalized to DNA, cell density was no longer a factor in total collagen content. In general, there was minimal interaction between cell density and time for sGAG and collagen and when normalized to DNA.
Figure 6.

Characterization of the cell-laden hydrogel constructs as a function of culture time for (A) compressive modulus, (B) DNA content, (C) sulfated glycosaminoglycan (sGAG) content per construct, (D) sGAG per DNA, (E) total collagen content per construct, and (F) total collagen content per DNA for low (50 M cells/mL) (○), medium (100 M cells/mL) (□), and high (150 M cells/mL) (◇) density. Dot plots are shown for individual repeats and the horizontal line represents the mean. The corresponding ANOVA results are shown in Table 3.
Table 3.
Statistical Analysis of Cell-Laden Hydrogels in Culture
| measurement | factor | DOF | SS | MS | F | p |
|---|---|---|---|---|---|---|
| modulus | cell density | 2 | 850 | 430 | 2.6 | 0.1 |
| time | 2 | 3800 | 1900 | 12 | 0.001 | |
| cell density × time | 4 | 2800 | 700 | 4.3 | 0.015 | |
| DNA | cell density | 2 | 1200 | 580 | 12 | <0.001 |
| time | 2 | 15 | 7.6 | 0.16 | 0.86 | |
| cell density × time | 4 | 860 | 210 | 4.4 | 0.011 | |
| sGAGs | cell density | 2 | 2.0 × 1005 | 1.0 × 1005 | 2.9 | 0.084 |
| time | 2 | 1.1 × 1006 | 5.7 × 1005 | 16 | <0.001 | |
| cell density × time | 4 | 2.0 × 1005 | 5.0 × 1004 | 1.4 | 0.27 | |
| sGAGs/DNA | cell density | 2 | 100 | 51 | 3.5 | 0.052 |
| time | 2 | 1700 | 860 | 59 | <0.001 | |
| cell density × time | 4 | 59 | 15 | 1 | 0.43 | |
| total collagen | cell density | 2 | 2.8 × 1005 | 1.4 × 1005 | 2.9 | 0.082 |
| time | 2 | 4.4 × 1006 | 2.2 × 1006 | 46 | <0.001 | |
| cell density × time | 4 | 1.1 × 1006 | 2.8 × 1005 | 5.8 | 0.004 | |
| total collagen/DNA | cell density | 2 | 2 | 0.98 | 0.08 | 0.92 |
| time | 2 | 6300 | 3200 | 260 | <0.001 | |
| cell density × time | 4 | 150 | 37 | 3 | 0.46 |
The quality and spatial organization of the newly deposited ECM was assessed by immunohistochemistry for aggrecan and collagen II (Figure 7), the two major ECM molecules that makeup cartilage. Aggrecan and collagen II were detected as early as one-day postencapsulation (referred to as week 0) and both ECM molecules were present throughout the 12 week culture period for all hydrogel conditions regardless of cell density. In all cell density conditions, the ECM was localized to the pericellular space at day 1 (week 0). In the low cell density hydrogel (Figure 7A) at week 4, the spatial distribution of ECM differed between constructs showing either ECM restricted to the pericellular space or interconnected ECM between adjacent cells. By week 12, an ECM had formed across the entire construct. In the medium cell density (Figure 7B) and high cell density (Figure 7C) conditions, the ECM by week 4 was interconnected and present throughout all constructs. Similar results were observed at week 12.
Figure 7.

Representative confocal microscopy images of immunohistological sections stained for collagen II and aggrecan after 1 day (i.e., week 0), week 4, or week 12 of culture for hydrogel with low (A), medium (B), and high (C) cell densities. Nuclei are stained with DAPI (blue). Scale bar = 20 μm.
Computational Modeling of Hydrogel Degradation and ECM Growth
The computational model was then used to describe the cross-link density, ECM accumulation in the hydrogel and compressive modulus as a function of culture time up to 30 days (Figure 8), at which point the hydrogel had degraded. The model used the cluster analysis described above for each of the three cell densities and a value of 27 for Rd/Rc. The remaining model parameters are given in Table 1. The ECM homeostatic concentration (cm,0) was determined from the ECM (collagen and GAG) concentration of fresh juvenile bovine cartilage explants. The ECM production rate per cell ( ) was calculated from the total ECM synthesis produced over the first 4 weeks divided by 28 days and the total number of cells at 4 weeks. was assumed to be constant. The simulation results are shown in Figure 8. The average cross-link density decreased with time concomitant with an increase in average ECM accumulation in the hydrogel for all cell densities (Figure 8A). The high cell density condition, which started with the lowest initial average cross-link density, led to the greatest amount of ECM accumulation within the hydrogel by day 30. Snap shots of cross-link density and ECM accumulation from 3D simulations are shown at day 0, 15, and 30 (Figure 8B). The low cell density condition had more diffuse and less dense regions of accumulated ECM. On the contrary, regions of dense ECM are observed in the medium cell density condition and were even more pronounced in the high cell density condition. The compressive modulus of the construct, which combines the modulus of the hydrogel and the modulus of the ECM, as a function of time was also determined in the simulations (Figure 8C). The modulus decreased for all conditions, which corresponded to a decrease in the cross-linking density with minimal deposited ECM. However, the modulus begins to increase as the ECM forms its own interconnected matrix. This transition occurred the earliest in the high cell density condition and took the longest to occur in the low cell density condition. The experimentally measured modulus corresponded to the simulation results at day 28.
Figure 8.

Simulation results for low, medium, and high cell densities showing (A) normalized cross-link density (○) and ECM concentration (◇), where cross-link density is normalized to the initial cross-link density of the acellular construct, and (B) representative volume elements depicting the spatial distribution of ECM and cross-link density at 0, 15, and 30 days for low, medium, and high cell densities. (C) Evolution of E, the compressive modulus, (○) over time (experimental data from week 0 and 4 shown as solid squares,■). Error bars represent standard deviation from three different simulations or experimental replicates (n = 3).
DISCUSSION
This study describes local heterogeneities within a cell-laden hydrogel that arise from two phenomena: (a) clustering of cells and (b) spatial variations in the hydrogel cross-link density. Using a combined experimental and theoretical approach, the local heterogeneities were defined along with spatiotemporal mapping of both cross-link density and ECM evolution. With increasing cell density within the hydrogel, the local heterogeneities were further magnified. Results from this work demonstrate that with increasing local heterogeneities, the amount of deposited ECM is higher concomitant with improved ECM evolution and an overall higher modulus. Taken together, our findings point toward heterogeneities as being important to achieve macroscopic ECM evolution in hydrolytically degradable PEG hydrogels.
When cells were encapsulated in the PEG-CAP hydrogels, a stark decrease in the compressive modulus was observed, which was more pronounced with higher cell concentrations at the time of encapsulation. The volume fraction of cells, which are softer than the hydrogel, ranged from 0.014 to 0.038 in the hydrogel and was not sufficient to explain the large drop in modulus. This observation, thus, led to the introduction of heterogeneities into our previously developed computational model in an effort to explain the results. The presence of cell clusters was evident in the hydrogels through confocal microscopy images. The clustering of cells is attributed to cell aggregation that occurred during the processing of the cells prior to encapsulation. Chondrocytes, along with other cell types, are known to aggregate,48–50 and, although methods were employed to minimize aggregates for this study, the cells were not perfectly dispersed within the hydrogel immediately after encapsulation. Accounting for cell clusters within the model confirmed a decrease in modulus with increasing cell concentration, but not to the same degree that was observed experimentally. Given the prior evidence that chondrocytes interact with propagating radicals during encapsulation,24 chondrocytes may quench the radicals and inhibit polymerization. Since radicals are short-lived, this termination would be restricted to regions nearby cells. With the introduction of Rd combined with the presence of cell clusters, the model was able to explain the experimentally observed drop in modulus. In regions with cell clusters where cells are in close proximity to one another, their Rd’s overlap such that the overall cross-linking density in these regions is lower. With increasing cell concentration, the distance between cells within the background (i.e., not in clusters) and the distance between clusters become smaller and can begin to approach Rd, such that even in the bulk the overall cross-link density may be lower. Thus, the increasing number and size of cell clusters coupled with a high value of Rd is able to explain the reduction in the overall compressive modulus with increasing cell density.
The value for Rd/Rc was estimated to be ~27 or equivalent to an Rd of ~135 μm. There are several factors that may impact the magnitude of the Rd region, including diffusion and termination of radicals and the hydrophilic nature of the monomers. Propagating radicals can be stabilized by the surrounding chemistry, which increases their lifetime51 and thus will increase the probability of interacting with cells. The addition of hydrophobic caprolactone units to the multiarm PEG creates an amphiphilic molecule where block copolymers of PEG and caprolactone groups have been shown to form micelles in aqueous solvents.52,53 Thus, it is reasonable to postulate that as cells terminate radicals, the effects on propagation may extend farther into the polymerizing solution due to the amphiphilic nature of the PEG-CAP chemistry. In support of this postulation, several studies have reported a drop in modulus after encapsulating chondrocytes at a cell seeding density of 50 M in hydrogels formed by radical mediated polymerization. For example, the compressive modulus dropped by 10% in a PEG hydrogel formed from 8-arm PEG-NB with peptide sensitive cross-links,54 by 18% in PEG hydrogels formed from PEG dimethacrylate monomers,16 and by 42% in a hydrogel formed by copolymerizing poly(lactic acid)-b-PEG-b-poly(lactic acid) dimethacrylate with acrylated poly(vinyl alcohol).55 The latter chemistry, which experienced the greatest drop in modulus, is the least hydrophilic. Moreover, in the study with the PEG hydrogel containing peptide cross-linkers, the Rd/Rc was estimated to be three or an Rd of ~15 μm.54 Thus, the hydrophilic nature of the monomers appears to have a significant effect on the value of Rd.
The presence of an Rd and clusters is able to explain the observed ECM growth within the different hydrolytically degradable hydrogels. In regions of lower cross-link density (i.e., in the clusters), the hydrogel will reach reverse gelation much faster within the cell clusters when compared to regions where the cells are more dispersed and farther apart (i.e., in the background). This phenomenon enables ECM elaboration and ECM connectivity between adjacent cells in the clusters while the background regions maintain a cross-linked hydrogel.56 Thus, the transition from hydrogel to ECM depends on the number of cells, clusters, and cluster size. Indeed, our results show that in the low cell density condition, which has smaller cell clusters, the overall modulus drops by ~50% at 4 weeks. This observation is consistent with the idea that, as the hydrogel degrades primarily through hydrolysis as degradation by enzymes in serum and/or secreted by chondrocytes has not been observed (unpublished data), but with limited ECM interconnectivity, the overall modulus must decrease. On the other hand, in the medium and high cell density conditions, the overall modulus increased by ~3-fold at 4 weeks. This observation is consistent with the idea that, although the hydrogel is degrading, there is substantial macroscopic ECM that forms within the large cluster regions, which contributes to the overall modulus.
The model was able to capture the overall evolution of ECM growth and construct modulus as a function of time for the PEG-CAP hydrogels with varying initial cell concentrations. Since the model describes hydrogel degradation that is coupled to ECM molecule transport and deposition, but does not describe maturation of the ECM alone, the model was limited to the time scale of hydrogel degradation (~30 days). Results from the model provide insights into the spatiotemporal behavior of the construct as it transitions from hydrogel to ECM. Experimental limitations prevent the real time continuous analysis of the modulus evolution. The model provides insights into the drop in modulus that occurs as the constructs degrade initially prior to significant ECM deposition and elaboration. This effect was most pronounced in the low cell density condition, which reported a ~70% modulus drop in the first ~24 days prior to recovery of the modulus by 30 days. The medium and high cell density cases reached a minimum modulus at earlier times and exhibited a greater recovery in the first 30 days. The simulation results support the idea that higher cell seeding densities lead to increased ECM connectivity through the following mechanisms. Encapsulation at high cell densities leads to an overall lower bulk cross-link density as single cells in the background and cells within the clusters are closer together, and this leads to overlapping Rd’s. This effect causes the hydrogel to reach reverse gelation faster especially in the clusters, which creates space for ECM transport and deposition within the clusters. As clusters are closer together, interconnectivity of the ECM between clusters occurs leading to an overall ECM interconnectivity within the hydrogel.
Long-term by 12 weeks, the engineered neo-cartilage tissue was largely similar across all three conditions. The low cell density condition by week 12 reached a modulus that was similar to the medium and high cell density conditions at week 4, where the latter two conditions appeared to maintain their mechanical properties after week 4. The high cell density condition resulted in the greatest total amount of deposited ECM per construct and on a per cell basis. These findings suggest that differences in the spatiotemporal degradation of the hydrogel due the local heterogeneities have profound effects on neotissue growth. Herein, our findings indicate that starting with a lower cell seeding density, which corresponds to a higher initial modulus, results in less ECM deposition, a considerable drop in mechanical properties, and a slow transition to an interconnected neotissue. Alternatively, starting with a high cell seeding density, which corresponds to a lower initial compressive modulus, results in a more rapid transition to intact neo-cartilage. Although the modulus in the high cell density condition was relatively low at 8 kPa, hydrogels can be readily designed with hydrolytically susceptible bonds that have a higher hydrolysis kinetic constant than the ester bonds used in this study. Thus, a hydrogel with a higher initial cross-linking density and hence modulus can be designed to achieve similar degradation rates to those investigated in this work.
Overall, this study highlights the importance of heterogeneities within a cell-laden hydrolytically labile hydrogel. On the contrary, homogeneous networks, such as those formed from orthogonal click reactions,57 have been promoted for their consistent properties throughout the polymer network.20 This aspect is important when studying the effects of local cues, such as matrix stiffness, on cells encapsulated in 3D hydrogels. However, in the context of tissue engineering, our results strongly point to the need to introduce local heterogeneities into the network structure to improve matrix connectivity and promote a seamless transition from hydrogel to neotissue.
There are several limitations in this study that are important to note. We assumed an average value of Rd based on the experimentally determined decrease in bulk compressive modulus when increasing the cell seeding density. However, chondrocytes were isolated from full thickness cartilage and are a heterogeneous population of cells that may have different cellular responses,58 leading to heterogeneous evolutions in Rd. The model did not account for any changes in the cell population that arise due to cell proliferation and cell death. However, the cell number as measured experimentally through DNA content did not change with culture time and thus may not have been a significant factor for the model. This study is limited to one biological donor and thus variations in Rd and cell clustering may vary from donor to donor which requires additional studies.
CONCLUSIONS
Using a combined experimental and computational approach, this study introduces the importance of local heterogeneities in achieving a seamless transition from hydrogel to neotissue in cell-laden hydrolytically labile hydrogels formed from radical mediated polymerizations. Two local heterogeneities were identified. The first is the presence of cell clusters. The second is the local inhibition of the polymerization in the vicinity of the cell creating a region with reduced cross-linking. When combined, the two local heterogeneities create regions within the cell clusters that have a low cross-link density and thus degrade the fastest and create space for ECM transport and deposition. With increasing cell concentration within the hydrogel the local heterogeneities are magnified and this improves the overall outcome with enhanced mechanical properties and overall higher amounts of ECM. Future studies will explore controlling cell cluster formation,59,60 which may allow for even more control over the evolution of ECM. Although, this study focused on chondrocytes, mammalian cells have a natural capacity to protect themselves from radicals,61 and thus network heterogeneities are likely be present in other cell types. Collectively, the presence of heterogeneities is key for the success of hydrolytically degradable hydrogels.
Table 2.
Cluster and Background Parameters
| simulation | total volume fraction of cells (f) | cluster (fc) | background (fb) |
|---|---|---|---|
| 50 M | 0.014 | 0.02 | 0.012 |
| 100 M | 0.025 | 0.05 | 0.022 |
| 150 M | 0.038 | 0.077 | 0.034 |
Acknowledgments
Research reported in this publication was supported by the National Institute of Arthritis and Musculoskeletal and Skin Diseases of the National Institutes of Health under Award Number 1R01AR065441. The content is solely the responsibility of the authors and does not necessarily represent the official views of the National Institutes of Health. The authors acknowledge the National Institute of Health (NIH) Institutional Pharmaceutical Training and the Department of Education’s GAANN (PR Award No. P200A150211) fellowships to M.C.S. and S.C.
Footnotes
Notes
The authors declare no competing financial interest.
References
- 1.Nicodemus GD, Bryant SJ. Cell Encapsulation in Biodegradable Hydrogels for Tissue Engineering Applications. Tissue Eng, Part B. 2008;14(2):149–165. doi: 10.1089/ten.teb.2007.0332. [DOI] [PMC free article] [PubMed] [Google Scholar]
- 2.Metters AT, Bowman CN, Anseth KS. A Statistical Kinetic Model for the Bulk Degradation of PLA-b-PEG-b-PLA Hydrogel Networks. J Phys Chem B. 2000;104(30):7043–7049. [Google Scholar]
- 3.Martens P, Metters AT, Anseth KS, Bowman CN. A Generalized Bulk-Degradation Model for Hydrogel Networks Formed from Multivinyl Cross-linking Molecules. J Phys Chem B. 2001;105(22):5131–5138. [Google Scholar]
- 4.Neumann AJ, Quinn T, Bryant SJ. Nondestructive evaluation of a new hydrolytically degradable and photo-clickable PEG hydrogel for cartilage tissue engineering. Acta Biomater. 2016;39:1–11. doi: 10.1016/j.actbio.2016.05.015. [DOI] [PMC free article] [PubMed] [Google Scholar]
- 5.Dadsetan M, Szatkowski JP, Yaszemski MJ, Lu L. Characterization of Photo-Cross-Linked Oligo[poly(ethylene glycol) fumarate] Hydrogels for Cartilage Tissue Engineering. Biomacromolecules. 2007;8(5):1702–1709. doi: 10.1021/bm070052h. [DOI] [PubMed] [Google Scholar]
- 6.Bryant SJ, Anseth KS. Controlling the spatial distribution of ECM components in degradable PEG hydrogels for tissue engineering cartilage. J Biomed Mater Res. 2003;64A(1):70–79. doi: 10.1002/jbm.a.10319. [DOI] [PubMed] [Google Scholar]
- 7.Park H, Temenoff JS, Holland TA, Tabata Y, Mikos AG. Delivery of TGF-β1 and chondrocytes via injectable, biodegradable hydrogels for cartilage tissue engineering applications. Biomaterials. 2005;26(34):7095–7103. doi: 10.1016/j.biomaterials.2005.05.083. [DOI] [PubMed] [Google Scholar]
- 8.Wang Y, Yang X, Gu Z, Qin H, Li L, Liu J, Yu X. In vitro study on the degradation of lithium-doped hydroxyapatite for bone tissue engineering scaffold. Mater Sci Eng, C. 2016;66:185–192. doi: 10.1016/j.msec.2016.04.065. [DOI] [PubMed] [Google Scholar]
- 9.Andriano KP, Tabata Y, Ikada Y, Heller J. In vitro and in vivo comparison of bulk and surface hydrolysis in absorbable polymer scaffolds for tissue engineering. J Biomed Mater Res. 1999;48(5):602–612. doi: 10.1002/(sici)1097-4636(1999)48:5<602::aid-jbm3>3.0.co;2-6. [DOI] [PubMed] [Google Scholar]
- 10.Lam CXF, Hutmacher DW, Schantz J-T, Woodruff MA, Teoh SH. Evaluation of polycaprolactone scaffold degradation for 6 months in vitro and in vivo. J Biomed Mater Res, Part A. 2009;90A(3):906–919. doi: 10.1002/jbm.a.32052. [DOI] [PubMed] [Google Scholar]
- 11.Lu HH, Cooper JA, Jr, Manuel S, Freeman JW, Attawia MA, Ko FK, Laurencin CT. Anterior cruciate ligament regeneration using braided biodegradable scaffolds: in vitro optimization studies. Biomaterials. 2005;26(23):4805–4816. doi: 10.1016/j.biomaterials.2004.11.050. [DOI] [PubMed] [Google Scholar]
- 12.Cooper JA, Lu HH, Ko FK, Freeman JW, Laurencin CT. Fiber-based tissue-engineered scaffold for ligament replacement: design considerations and in vitro evaluation. Biomaterials. 2005;26(13):1523–1532. doi: 10.1016/j.biomaterials.2004.05.014. [DOI] [PubMed] [Google Scholar]
- 13.Mahoney MJ, Anseth KS. Three-dimensional growth and function of neural tissue in degradable polyethylene glycol hydrogels. Biomaterials. 2006;27(10):2265–2274. doi: 10.1016/j.biomaterials.2005.11.007. [DOI] [PubMed] [Google Scholar]
- 14.Kim B-S, Mooney DJ. Engineering smooth muscle tissue with a predefined structure. J Biomed Mater Res. 1998;41(2):322–332. doi: 10.1002/(sici)1097-4636(199808)41:2<322::aid-jbm18>3.0.co;2-m. [DOI] [PubMed] [Google Scholar]
- 15.Fidkowski C, Kaazempur-Mofrad MR, Borenstein J, Vacanti JP, Langer R, Wang Y. Endothelialized Microvasculature Based on a Biodegradable Elastomer. Tissue Eng. 2005;11(1–2):302–309. doi: 10.1089/ten.2005.11.302. [DOI] [PubMed] [Google Scholar]
- 16.Bryant SJ, Anseth KS. Hydrogel properties influence ECM production by chondrocytes photoencapsulated in poly(ethylene glycol) hydrogels. J Biomed Mater Res. 2002;59(1):63–72. doi: 10.1002/jbm.1217. [DOI] [PubMed] [Google Scholar]
- 17.Nicodemus GD, Skaalure SC, Bryant SJ. Gel structure has an impact on pericellular and extracellular matrix deposition, which subsequently alters metabolic activities in chondrocyte-laden PEG hydrogels. Acta Biomater. 2011;7(2):492–504. doi: 10.1016/j.actbio.2010.08.021. [DOI] [PMC free article] [PubMed] [Google Scholar]
- 18.Metters AT, Bowman CN, Anseth KS. Verification of scaling laws for degrading PLA-b-PEG-b-PLA hydrogels. AIChE J. 2001;47(6):1432–1437. [Google Scholar]
- 19.Metters AT, Anseth KS, Bowman CN. A Statistical Kinetic Model for the Bulk Degradation of PLA-b-PEG-b-PLA Hydrogel Networks: Incorporating Network Non-Idealities. J Phys Chem B. 2001;105(34):8069–8076. [Google Scholar]
- 20.Tibbitt MW, Kloxin AM, Sawicki LA, Anseth KS. Mechanical Properties and Degradation of Chain and Step-Polymerized Photodegradable Hydrogels. Macromolecules. 2013;46(7):2785–2792. doi: 10.1021/ma302522x. [DOI] [PMC free article] [PubMed] [Google Scholar]
- 21.Bryant SJ, Bender RJ, Durand KL, Anseth KS. Encapsulating chondrocytes in degrading PEG hydrogels with high modulus: Engineering gel structural changes to facilitate cartilaginous tissue production. Biotechnol Bioeng. 2004;86(7):747–755. doi: 10.1002/bit.20160. [DOI] [PubMed] [Google Scholar]
- 22.Bryant SJ, Anseth KS, Lee DA, Bader DL. Crosslinking density influences the morphology of chondrocytes photoencapsulated in PEG hydrogels during the application of compressive strain. J Orthop Res. 2004;22(5):1143–1149. doi: 10.1016/j.orthres.2004.02.001. [DOI] [PubMed] [Google Scholar]
- 23.Roberts JJ, Bryant SJ. Comparison of photopolymerizable thiol-ene PEG and acrylate-based PEG hydrogels for cartilage development. Biomaterials. 2013;34(38):9969–9979. doi: 10.1016/j.biomaterials.2013.09.020. [DOI] [PMC free article] [PubMed] [Google Scholar]
- 24.Farnsworth N, Bensard C, Bryant SJ. The role of the PCM in reducing oxidative stress induced by radical initiated photoencapsulation of chondrocytes in poly(ethylene glycol) hydrogels. Osteoarthritis Cartilage. 2012;20(11):1326–1335. doi: 10.1016/j.joca.2012.06.015. [DOI] [PubMed] [Google Scholar]
- 25.Dhote V, Vernerey FJ. Mathematical model of the role of degradation on matrix development in hydrogel scaffold. Biomech Model Mechanobiol. 2014;13(1):167–183. doi: 10.1007/s10237-013-0493-0. [DOI] [PMC free article] [PubMed] [Google Scholar]
- 26.Dhote V, Skaalure S, Akalp U, Roberts J, Bryant SJ, Vernerey FJ. On the role of hydrogel structure and degradation in controlling the transport of cell-secreted matrix molecules for engineered cartilage. J Mech Behav Biomed Mater. 2013;19:61–74. doi: 10.1016/j.jmbbm.2012.10.016. [DOI] [PMC free article] [PubMed] [Google Scholar]
- 27.Bryant SJ, Cuy JL, Hauch KD, Ratner BD. Photopatterning of porous hydrogels for tissue engineering. Biomaterials. 2007;28(19):2978–2986. doi: 10.1016/j.biomaterials.2006.11.033. [DOI] [PMC free article] [PubMed] [Google Scholar]
- 28.Kim Y-J, Sah RLY, Doong J-YH, Grodzinsky AJ. Fluorometric assay of DNA in cartilage explants using Hoechst 33258. Anal Biochem. 1988;174(1):168–176. doi: 10.1016/0003-2697(88)90532-5. [DOI] [PubMed] [Google Scholar]
- 29.Templeton DM. The basis and applicability of the dimethylmethylene blue binding assay for sulfated glycosaminoglycans. Connect Tissue Res. 1988;17(1):23–32. doi: 10.3109/03008208808992791. [DOI] [PubMed] [Google Scholar]
- 30.Woessner JF. The determination of hydroxyproline in tissue and protein samples containing small proportions of this imino acid. Arch Biochem Biophys. 1961;93(2):440–447. doi: 10.1016/0003-9861(61)90291-0. [DOI] [PubMed] [Google Scholar]
- 31.Vernerey F, Liu WK, Moran B. Multi-scale micromorphic theory for hierarchical materials. J Mech Phys Solids. 2007;55(12):2603–2651. [Google Scholar]
- 32.Flory PJ. The George Fisher Baker Non-Resident Lectureship in Chemistry at Cornell University. Cornell University Press; Ithaca, NY: 1953. Principles of Polymer Chemistry. [Google Scholar]
- 33.Akalp U, Chu S, Skaalure SC, Bryant SJ, Doostan A, Vernerey FJ. Determination of the polymer-solvent interaction parameter for PEG hydrogels in water: Application of a self learning algorithm. Polymer. 2015;66:135–147. doi: 10.1016/j.polymer.2015.04.030. [DOI] [PMC free article] [PubMed] [Google Scholar]
- 34.Tokiwa Y, Suzuki T. Hydrolysis of polyesters by lipases. Nature. 1977;270(5632):76–78. doi: 10.1038/270076a0. [DOI] [PubMed] [Google Scholar]
- 35.Kääb MJ, Ap Gwynn I, Nötzli HP. Collagen fibre arrangement in the tibial plateau articular cartilage of man and other mammalian species. J Anat. 1998;193(1):23–34. doi: 10.1046/j.1469-7580.1998.19310023.x. [DOI] [PMC free article] [PubMed] [Google Scholar]
- 36.Ng L, Grodzinsky AJ, Patwari P, Sandy J, Plaas A, Ortiz C. Individual cartilage aggrecan macromolecules and their constituent glycosaminoglycans visualized via atomic force microscopy. J Struct Biol. 2003;143(3):242–257. doi: 10.1016/j.jsb.2003.08.006. [DOI] [PubMed] [Google Scholar]
- 37.Anderson ML, Mott PH, Roland CM. The Compression of Bonded Rubber Disks. Rubber Chem Technol. 2004;77(2):293–302. [Google Scholar]
- 38.Wong M, Ponticiello M, Kovanen V, Jurvelin JS. Volumetric changes of articular cartilage during stress relaxation in unconfined compression. J Biomech. 2000;33(9):1049–1054. doi: 10.1016/s0021-9290(00)00084-1. [DOI] [PubMed] [Google Scholar]
- 39.Mow VC, Gibbs MC, Lai WM, Zhu WB, Athanasiou KA. Biphasic indentation of articular cartilage—II. A numerical algorithm and an experimental study. J Biomech. 1989;22(8):853–861. doi: 10.1016/0021-9290(89)90069-9. [DOI] [PubMed] [Google Scholar]
- 40.Anseth KS, Bowman CN, Brannon-Peppas L. Mechanical properties of hydrogels and their experimental determination. Biomaterials. 1996;17(17):1647–1657. doi: 10.1016/0142-9612(96)87644-7. [DOI] [PubMed] [Google Scholar]
- 41.Gould ST, Darling NJ, Anseth KS. Small peptide functionalized thiol–ene hydrogels as culture substrates for understanding valvular interstitial cell activation and de novo tissue deposition. Acta Biomater. 2012;8(9):3201–3209. doi: 10.1016/j.actbio.2012.05.009. [DOI] [PMC free article] [PubMed] [Google Scholar]
- 42.Guilak F, Jones WR, Ting-Beall HP, Lee GM. The deformation behavior and mechanical properties of chondrocytes in articular cartilage. Osteoarthritis Cartilage. 1999;7(1):59–70. doi: 10.1053/joca.1998.0162. [DOI] [PubMed] [Google Scholar]
- 43.Vernerey FJ. A mixture approach to investigate interstitial growth in engineering scaffolds. Biomech Model Mechanobiol. 2016;15(2):259–278. doi: 10.1007/s10237-015-0684-y. [DOI] [PMC free article] [PubMed] [Google Scholar]
- 44.Vernerey FJ, Liu WK, Moran B, Olson G. A micromorphic model for the multiple scale failure of heterogeneous materials. J Mech Phys Solids. 2008;56(4):1320–1347. [Google Scholar]
- 45.Aboudi J, Arnold SM, Bednarcyk BA. Micromechanics of Composite Materials. 1. Butterworth-Heinemann; 2013. [Google Scholar]
- 46.Nemat-Nasser S, Hori M. Micromechanics: Overall Properties of Heterogeneous Materials. 2. Elsevier; 2013. [Google Scholar]
- 47.Madras N, Sokal AD. The pivot algorithm: A highly efficient Monte Carlo method for the self-avoiding walk. J Stat Phys. 1988;50(1–2):109–186. [Google Scholar]
- 48.Gigout A, Buschmann MD, Jolicoeur M. Chondrocytes Cultured in Stirred Suspension with Serum-Free Medium Containing Pluronic-68 Aggregate and Proliferate While Maintaining Their Differentiated Phenotype. Tissue Eng, Part A. 2009;15(8):2237–2248. doi: 10.1089/ten.tea.2008.0256. [DOI] [PubMed] [Google Scholar]
- 49.Dean DM, Napolitano AP, Youssef J, Morgan JR. Rods, tori, and honeycombs: the directed self-assembly of microtissues with prescribed microscale geometries. FASEB J. 2007;21(14):4005–4012. doi: 10.1096/fj.07-8710com. [DOI] [PubMed] [Google Scholar]
- 50.Napolitano AP, Chai P, Dean DM, Morgan JR. Dynamics of the Self-Assembly of Complex Cellular Aggregates on Micromolded Nonadhesive Hydrogels. Tissue Eng. 2007;13(8):2087–2094. doi: 10.1089/ten.2006.0190. [DOI] [PubMed] [Google Scholar]
- 51.Tanaka H, Sato T, Otsu T. Long-lived polymer radicals, 2. An ESR study on the reactions of the propagating polymer radicals of N-methylacrylamide and N-methylmethacrylamide with vinyl monomers at room temperature. Makromol Chem. 1980;181(11):2421–2431. [Google Scholar]
- 52.Cho H, Lai TC, Kwon GS. Poly(ethylene glycol)-block-poly(ε-caprolactone) micelles for combination drug delivery: Evaluation of paclitaxel, cyclopamine and gossypol in intraperitoneal xenograft models of ovarian cancer. J Controlled Release. 2013;166(1):1–9. doi: 10.1016/j.jconrel.2012.12.005. [DOI] [PMC free article] [PubMed] [Google Scholar]
- 53.Tian Y, Wu W-C, Chen C-Y, Jang S-H, Zhang M, Strovas T, Anderson J, Cookson B, Li Y, Meldrum D, et al. Utilization of micelles formed from poly(ethylene glycol)-block-poly(ε-caprolactone) block copolymers as nanocarriers to enable hydrophobic red two-photon absorbing (2PA) emitters for cells imaging. J Biomed Mater Res, Part A. 2010;93(3):1068. doi: 10.1002/jbm.a.32607. [DOI] [PMC free article] [PubMed] [Google Scholar]
- 54.Chu S, Sridhar SL, Skaalure SC, Vernerey FJ, Bryant SJ, Akalp U. Understanding the Spatiotemporal Degradation Behavior of Aggrecanase-Sensitive Poly(ethylene glycol) Hydrogels for use in Cartilage Tissue Engineering. Tissue Eng, Part A. 2017 doi: 10.1089/ten.tea.2016.0490. [DOI] [PMC free article] [PubMed] [Google Scholar]
- 55.Martens PJ, Bryant SJ, Anseth KS. Tailoring the Degradation of Hydrogels Formed from Multivinyl Poly(ethylene glycol) and Poly(vinyl alcohol) Macromers for Cartilage Tissue Engineering. Biomacromolecules. 2003;4(2):283–292. doi: 10.1021/bm025666v. [DOI] [PubMed] [Google Scholar]
- 56.Sridhar SL, Schneider MC, Chu S, de Roucy G, Bryant SJ, Vernerey FJ. Heterogeneity is key to hydrogel-based cartilage tissue regeneration. Soft Matter. 2017;13:4841. doi: 10.1039/c7sm00423k. [DOI] [PMC free article] [PubMed] [Google Scholar]
- 57.Hoyle CE, Bowman CN. Thiol–Ene Click Chemistry. Angew Chem, Int Ed. 2010;49(9):1540–1573. doi: 10.1002/anie.200903924. [DOI] [PubMed] [Google Scholar]
- 58.Coates EE, Fisher JP. Phenotypic Variations in Chondrocyte Subpopulations and Their Response to In Vitro Culture and External Stimuli. Ann Biomed Eng. 2010;38(11):3371–3388. doi: 10.1007/s10439-010-0096-1. [DOI] [PubMed] [Google Scholar]
- 59.Khademhosseini A, Eng G, Yeh J, Kucharczyk PA, Langer R, Vunjak-Novakovic G, Radisic M. Microfluidic patterning for fabrication of contractile cardiac organoids. Biomed Microdevices. 2007;9(2):149–157. doi: 10.1007/s10544-006-9013-7. [DOI] [PubMed] [Google Scholar]
- 60.Nishida K, Yamato M, Hayashida Y, Watanabe K, Maeda N, Watanabe H, Yamamoto K, Nagai S, Kikuchi A, Tano Y, et al. Functional bioengineered corneal epithelial sheet grafts from corneal stem cells expanded ex vivo on a temperature-responsive cell culture surface. Transplantation. 2004;77(3):379–385. doi: 10.1097/01.TP.0000110320.45678.30. [DOI] [PubMed] [Google Scholar]
- 61.Rahman K. Studies on free radicals, antioxidants, and co-factors. Clin Interv Aging. 2007;2(2):219–236. [PMC free article] [PubMed] [Google Scholar]