

Abstract
Aims/Introduction
The present study was carried out to generate induced pluripotent stem cells (iPSCs) from patients with fulminant type 1 diabetes, and evaluate the cytokine‐induced apoptotic reactions of β‐like insulin‐producing cells differentiated from the iPSCs.
Materials and Methods
iPSCs were generated from fibroblasts of patients with fulminant type 1 diabetes by inducing six reprogramming factors. Insulin‐producing cells were differentiated from the iPSCs in vitro. The proportion of cleaved caspase‐3‐positive or terminal deoxynucleotidyl transferase 2′‐deoxyuridine, 5′‐triphosphate nick end labeling‐positive cells among insulin (INS)‐positive cells derived from fulminant type 1 diabetes iPSC and control human iPSC lines was evaluated under treatment with tumor necrosis factor‐α, interleukin‐1β and interferon‐γ. Ribonucleic acid sequencing was carried out to compare gene expressions in INS‐positive cells derived from fulminant type 1 diabetes iPSC and control human iPSC lines.
Results
Two iPSC clones were established from each of three patients with fulminant type 1 diabetes. The differentiation of insulin‐producing cells from fulminant type 1 diabetes iPSC was confirmed by immunofluorescence analysis and KCl‐induced C‐peptide secretion. After treatment with pro‐inflammatory cytokines, these INS‐positive cells showed higher expression of cleaved caspase‐3 than those derived from control human iPSCs. Altered expression levels of several apoptosis‐related genes were observed in INS‐positive cells derived from the fulminant type 1 diabetes iPSCs by ribonucleic acid sequencing.
Conclusions
We generated iPSCs from patients with fulminant type 1 diabetes and differentiated them into insulin‐producing cells. This in vitro disease model can be used to elucidate the disease mechanisms of fulminant type 1 diabetes.
Keywords: Fulminant type 1 diabetes, Induced pluripotent stem cell, β‐Cell
Introduction
Fulminant type 1 diabetes is a subtype of type 1 diabetes mellitus characterized by a drastic onset of hyperglycemia. The core character is that almost all pancreatic β‐cells are rapidly destroyed, leading to a state of insulin dependence, reflected by the discrepancy of glucose and glycated hemoglobin levels, in this subtype. With respect to the main pathological characteristics, (i) islet‐related autoantibodies are usually not detected; (ii) many patients have digestive or flu‐like symptoms just before onset; and (iii) a specific human leukocyte antigen haplotype is closely associated with the disease. Additionally, a previous epidemiological investigation showed that although patients are mainly distributed in East Asia, fulminant type 1 diabetes was recently reported in Western countries. Several viruses, such as enteroviruses, are also considered to be associated with disease onset1, 2, 3, 4.
These findings show that some antiviral immunological processes might serve as etiological factors5; however, the mechanisms of β‐cell destruction remain unclear. One reason for this is that most pancreatic β‐cells have already been destroyed when hyperglycemia and ketoacidosis occur. Many recent studies have generated induced pluripotent stem cells (iPSCs) from patients with intractable disorders as models with which to study disease mechanisms6, 7. Accordingly, we generated iPSCs to study fulminant type 1 diabetes.
Cytokine‐induced apoptosis is assumed to be a mechanism of β‐cell destruction in fulminant type 1 diabetes, because massive mononuclear cell infiltration is observed in the pancreas of fulminant type 1 diabetes patients8. Tumor necrosis factor‐α (TNF‐α), interleukin‐1β (IL‐1β) and interferon‐γ (IFN‐γ) are inducers of apoptosis in in vitro cultures of human and animal pancreatic islet cells9. IFN‐γ is expressed in the β‐cells of fulminant type 1 diabetes patients10, whereas gene ontology and pathway analyses of peripheral blood mononuclear cells have shown that the expression levels of TNF receptor signaling pathways and IL‐1‐mediated signaling events are significantly different between fulminant type 1 diabetes patients and healthy individuals11. Additionally, CXC chemokine ligand 10, melanoma differentiation‐associated gene 5 and retinoic acid‐inducible protein I are expressed in fulminant type 1 diabetes β‐cells, and CXC chemokine receptor 3‐bearing T cells infiltrate around the diseased islets10, 12. Thus, we hypothesized that the apoptotic responses of β‐cells differ between fulminant type 1 diabetes patients and healthy individuals.
In the present study, we generated iPSCs from fulminant type 1 diabetes patients (fulminant type 1 diabetes iPSCs) and differentiated them into insulin‐producing cells. We then examined the proportion of apoptotic cells among insulin (INS)‐positive cells differentiated from fulminant type 1 diabetes iPSCs and iPSCs from control human iPSCs (control‐iPSCs) under treatment with TNF‐α, IL‐1β and IFN‐γ. The gene expressions between the two cell populations were compared by ribonucleic acid (RNA) sequencing analysis.
Methods
Patients
iPSCs were generated from three Japanese patients who fulfilled the criteria for fulminant type 1 diabetes13. Patient 1 was a man aged in his 50s, patient 2 was a man aged in his 40s and patient 3 was a woman aged in her 20s. Written informed consent was obtained from all three patients.
Generation of iPSCs
Skin biopsies were carried out on the three patients several years after fulminant type 1 diabetes onset. All iPSC clones were generated from skin fibroblasts through episomal vectors encoding six reprogramming factors (OCT4, SOX2, KLF4, L‐MYC, LIN28 and p53‐short hairpin RNA) according to a previously reported protocol14. Control‐iPSC lines (409B2, 975E2 and 975E4) were provided by the Center for iPS Cell Research and Application (CiRA), Kyoto University14. 409B2 was generated from a 36‐year‐old Caucasian woman, and 975E2 and 975E4 were generated from a 6‐year‐old Japanese female patient. Both donors were healthy, and these control‐iPSCs were generated from skin fibroblasts using the same methods used for fulminant type 1 diabetes iPSCs. This study was approved by the ethics committees of Osaka University and Kyoto University.
Cell culture
Fulminant type 1 diabetes iPSCs and control‐iPSCs were cultured on mitomycin C‐treated SNL 76/7 feeder cells15 with Primate ES Medium (ReproCELL, Yokohama, Japan) containing 4 ng/mL recombinant human basic fibroblast growth factor (Wako Pure Chemical Industries, Osaka, Japan) and 500 U/mL penicillin/streptomycin (P/S; Thermo Fisher Scientific, Rockford, IL, USA) at 37°C in a humidified atmosphere of 5% CO2. iPSCs were passaged at 1:3 to 1:6 after dissociation with CTK solution containing 0.25% trypsin (Thermo Fisher Scientific), 0.1% collagenase IV (Thermo Fisher Scientific), 20% knockout serum replacement (Thermo Fisher Scientific) and 1 mmol/L CaCl2 in phosphate‐buffered saline (Nacalai Tesque, Kyoto, Japan).
Immunofluorescence and terminal deoxynucleotidyl transferase 2′‐deoxyuridine, 5′‐triphosphate nick end labeling staining
The cells were washed with phosphate‐buffered saline and fixed with 4% paraformaldehyde for 20 min at 4°C. Primary antibodies were as follows: goat anti‐octamer‐binding transcription factor 4 (1:200; R&D Systems, Minneapolis, MN, USA), rabbit anti‐sex‐determining region Y‐box 2 (1:200; Merck KGaA, Darmstadt, Germany), rabbit anti‐β class III tubulin (1:500; Cambridge Bioscience, Cambridge, UK), mouse anti‐VIMENTIN (1:300; Santa Cruz Biotechnology, Santa Cruz, CA, USA), goat anti‐sex‐determining region Y‐box 17 (1:300; R&D Systems), goat anti‐pancreatic and duodenal homeobox 1 (1:300; R&D Systems), guinea pig anti‐insulin (INS; 1:500; Dako, Glostrup, Denmark), mouse anti‐glucagon (1:300; Sigma‐Aldrich, St. Louis, MO, USA), rabbit anti‐somatostatin (1:250; Dako), goat anti‐ghrelin (1:250; Santa Cruz Biotechnology), rabbit anti‐amylase (1:500; Sigma‐Aldrich) and rabbit anti‐cleaved caspase‐3 (1:400; Cell Signaling Technology, Danvers, MA, USA). Alexa Fluor‐conjugated secondary antibodies (1:1,000; Thermo Fisher Scientific) were used, and nuclei were stained with Hoechst 33342 (1:1,000; Thermo Fisher Scientific). Terminal deoxynucleotidyl transferase 2′‐deoxyuridine, 5′‐triphosphate nick end labeling (TUNEL) staining was carried out with In Situ Cell Death Detection Kit, POD (Roche Diagnostics GmbH, Penzberg, Germany). Quantification of the stained cells was carried out using a fluorescence microscope (BZ‐X710; Keyence, Osaka, Japan). Quantitative analysis of cells positive for cleaved caspase‐3, TUNEL and INS was carried out by counting the entire field of nine randomly selected views (magnification: ×40).
Embryoid body formation
Embryoid body formation of fulminant type 1 diabetes iPSCs was carried out as described previously16.
Teratoma formation
Teratoma formation of fulminant type 1 diabetes iPSCs was evaluated as described previously using non‐obese diabetic/severe combined immunodeficient mice17. Animal experiments were approved by the CiRA Animal Experiment Committee and carried out in accordance with institutional guidelines.
Karyotype analysis
G‐banding chromosome analysis was carried out by Nihon Gene Research Laboratories.
Differentiation protocol
Fulminant type 1 diabetes iPSCs and control‐iPSCs were grown until 70–80% confluent. and dissociated with CTK dissociation solution. The cells were then dissociated into single cells using Accutase (Innovative Cell Technologies, San Diego, CA, USA), and reseeded on Matrigel (BD Biosciences, San Jose, CA, USA)‐coated plates at a density of 1.25 × 10⁵/cm2. The directed differentiation into pancreatic endocrine lineage was carried out according to a previously described protocol18 with some modifications. In stage 1, cells were cultured for 1 day in Roswell Park Memorial Institute 1640 medium (Nacalai Tesque) supplemented with 2% growth factor reduced B27 (Thermo Fisher Scientific), 50 U/mL P/S, 100 ng/mL activin A (R&D Systems), 3 μmol/L CHIR99021 (Axon Medchem, Groningen, the Netherlands) and 10 μmol/L Y‐27632. Cells were then cultured for an additional 3 days in stage 1 medium, but without Y‐27632 exchanged for 1 μmol/L CHIR99021. The medium was then replaced with stage 2 medium containing Improved MEM Zinc Option Medium (Thermo Fisher Scientific), 1% growth factor reduced B27, 50 U/mL P/S, 10 μmol/L SB431542 (Cayman Chemical Company, Ann Arbor, MI, USA), 1 μmol/L AMPK Inhibitor, Compound C (Merck KGaA) and 2 μmol/L retinoic acid (Sigma‐Aldrich) for 6 days. In stage 3, cells were cultured in Improved MEM Zinc Option Medium supplemented with 1% growth factor reduced B27, 50 U/mL P/S, 10 μmol/L forskolin (Wako), 10 μmol/L dexamethasone (Wako), 5 μmol/L Alk5 inhibitor II (Wako) and 10 mmol/L nicotinamide (STEMCELL Technologies, Vancouver, BC, Canada) for 12 days.
Flow cytometry
The differentiated cells in stage 3 (day 12) were treated with 0.25% trypsin/ethylenediaminetetraacetic acid for 5 min at 37°C. After dissociation, the cells were fixed and permeabilized using BD cytofix/cytoperm™ fixation/permeabilization solution (BD Biosciences). The primary antibody was guinea pig anti‐INS (1:500), and the secondary antibody was Alexa Fluor® 647 AffiniPure Donkey Anti‐Guinea Pig IgG (H+L; Jackson ImmunoResearch, West Grove, PA, USA). The cells were analyzed and sorted by FACS Aria II (Becton, Dickson and Co., Franklin Lakes, NJ, USA).
C‐peptide release assay and C‐peptide content analysis
The differentiated cells in stage 3 (day 12) were pre‐incubated in Krebs‐Ringer bicarbonate HEPES buffer (137 mmol/L NaCl, 4.8 mmol/L KCl, 1.2 mmol/L KH2PO4, 1.2 mmol/L MgSO4, 2.5 mmol/L CaCl2, 5 mmol/L NaHCO3, 16 mmol/L HEPES and 0.1% (w/v) bovine serum ambumin containing 2.2 mmol/L glucose for 1 h at 37°C. The cells were subsequently incubated with 2.2 mmol/L glucose for 1 h at 37°C, and then with 22 mmol/L glucose and 30 mmol/L KCl for another 1 h at 37°C. Human C‐peptide was measured by an enzyme‐linked immunosorbent assay kit (Mercodia AB, Uppsala, Sweden). For the C‐peptide content analysis, the iPSC‐derived cells were treated with 0.25% trypsin/ethylenediaminetetraacetic acid for 5 min at 37°C, lysed into 0.5% acid/ethanol, and kept overnight at −80°C. Human C‐peptide of the supernatant was measured by enzyme‐linked immunosorbent assay kit (Mercodia AB).
Caspase‐3 activity assay
In stage 3 (day 12), the culture medium was changed to Improved MEM Zinc Option medium containing 1% growth factor reduced B27, 50 U/mL P/S, 1,000 U/mL TNF‐α, 50 U/mL IL‐1β and 1,000 U/mL IFN‐γ (PeproTech, Rocky Hill, NJ, USA). The concentrations of cytokines were based on previous reports of induced apoptosis of human pancreatic islet cells19, 20, 21. After the cells were treated with cytokines for 1.5–24 h at 37°C and harvested in lysis buffer, caspase‐3 activity was measured by APOPCYTO Caspase‐3 Colorimetric Assay Kit (Medical & Biological Laboratories, Nagoya, Japan). Caspase‐3 activity was normalized to total protein, and is presented as the relative intensity compared with untreated cells.
RNA isolation from iPSC‐derived INS‐positive cells and real‐time quantitative polymerase chain reaction
Extraction of RNA from cells fixed and isolated by flow cytometry sorting has rarely been reported22. We developed an original method to extract RNA from INS‐positive cells derived from iPSCs. iPSC‐derived INS‐positive cells in stage 3 (day 12) were treated with 0.25% trypsin/ethylenediaminetetraacetic acid for 5 min at 37°C and dissociated by pipetting. The cells were then fixed by PAXgene Tissue Containers (QIAGEN, Valencia, CA, USA) for >2 h at 4°C, blocked with 2% normal donkey serum (Merck KGaA)/BD Perm/Wash Buffer™ (BD Biosciences) for 20 min at room temperature, stained with primary antibodies (guinea pig anti‐INS) for 30 min at 4°C and secondary antibodies (Alexa Fluor® 647 AffiniPure Donkey Anti‐Guinea Pig IgG [H+L]) for 30 min at 4°C and isolated by flow cytometry sorting. Recombinant RNase inhibitor (Toyobo, Osaka, Japan) was used to supplement all steps of blocking, staining and flow cytometry. Buffer RLT supplemented with 0.1% 2‐mercaptoethanol was applied to the sorted cells, and total RNA was purified using an RNeasy Micro Kit (QIAGEN). Reverse transcription was carried out using a High Capacity cDNA Reverse Transcription Kit (Thermo Fisher Scientific), and real‐time quantitative polymerase chain reaction (qPCR) was carried out using SYBR Premix Ex Taq II (Takara Bio Inc., Shiga, Japan) by ViiA7 Real‐Time PCR Systems (Thermo Fisher Scientific). The primer pairs were 5′‐CTACCTAGTGTGCGGGGAAC‐3′ and 5′‐GCTGGTAGAGGGAGCAGATG‐3′ for INSULIN, 5′‐CAGCAAGTCAGCTGGATATGTTA‐3′ and 5′‐TCCGTGTTGATATGGTGCTC‐3′ for PARP3, 5′‐CCATTACTGGGGGCTTCA3′ and 5′‐CATAGAGGCAAGGCTGCTG‐3′ for CHCHD2, 5′‐AAAGCCTCAGTGGAATCCTGT‐3′ and 5′‐ATGGCAATTCCACGATTTTT‐3′ for ITPR2, 5′‐ATGTTTGTGTTCCCCGTGAC‐3′ and 5′‐GCAGGCAGAACAGGATGTG‐3′ for CH25H, and 5′‐CAATGTGGCCGAGGACTTTG‐3′ and 5′‐CATTCTCCTTAGAGAGAAGTGG‐3′ for β‐ACTIN. The messenger RNA expression levels of INSULIN, PARP3, CHCHD2, ITPR2 and CH25H were normalized to those of β‐ACTIN by the delta‐delta Ct method.
RNA sequencing
INS‐positive cells (800 cells for 409B2, 975E2, 975E4, FT1D01 and FT1D02, and 44 cells for FT1D03) isolated by the aforementioned flow cytometry sorting technique were lysed in Reaction Buffer of SMARTer Ultra Low Input RNA for Illumina Sequencing HV (Clontech Laboratories, Mountain View, CA, USA). Complementary deoxyribonucleic acids (DNAs) were synthesized using a SMARTer Ultra Low Kit. The amplification of complementary DNAs was carried out by 12 cycles of PCR for 409B2, 975E2, 975E4, FT1D01 and FT1D02, and 14 cycles for FT1D03. Illumina sequencing libraries were generated using a NexteraXT DNA Sample Prep Kit (Illumina, San Diego, CA, USA). The libraries were sequenced in the 100‐cycle Single‐Read mode of the HiSeq2500. All sequence reads were extracted in FASTQ format using BCL2FASTQ Conversion Software 1.8.4 in the CASAVA 1.8.2 pipeline (Illumina). The sequence reads were mapped to hg19 reference genes downloaded on 25 April 2014 using Tophat v2.0.14 (https://ccb.jhu.edu/software/tophat/index.shtml). Calculation of the gene expression values and normalization were carried out by RPKMforgenes (10 December 2012; http://sandberg.cmb.ki.se/rnaseq/). Gene Set Enrichment Analysis (GSEA) was downloaded from the Broad Institute (http://www.broadinstitute.org/gsea/) on 16 March 2015.
Statistical analysis
Data are presented as mean ± standard deviation from three independent experiments. Student's t‐test and one‐way analysis of variance followed by Scheffe's post‐hoc test were used for statistical analysis. Differences between groups were considered significant at P < 0.05.
Results
iPSCs can be generated from fulminant type 1 diabetes patients
iPSCs were established from three patients. Two iPSC clones were established from each patient: FT1D01 and FT1D01‐2 from patient 1, FT1D02 and FT1D02‐2 from patient 2, and FT1D03 and FT1D03‐2 from patient 3. These iPSC clones showed morphology similar to that of human embryonic stem cell colonies (Figure 1a), expression of pluripotent markers (octamer‐binding transcription factor 4 and sex‐determining region Y‐box 2; Figures 1b and S1), multipotent differentiation into three embryonic germ layers through embryoid body (Figures 1c and S2) and teratoma formation (Figures 1d and S3) and a normal karyotype (Figure 1e). These results show that iPSCs can be generated from fulminant type 1 diabetes patients.
Figure 1.
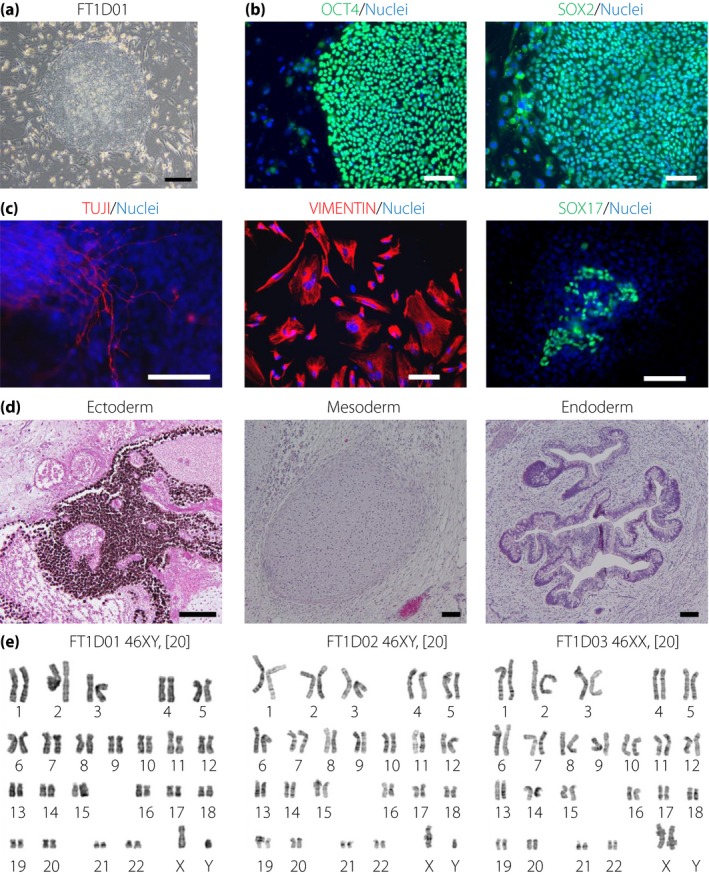
Generation of induced pluripotent stem cells from patients with fulminant type 1 diabetes. (a) An induced pluripotent stem cell colony derived from fibroblasts of a patient with fulminant type 1 diabetes (FT1D). (b) Immunofluorescence analysis of pluripotency markers (octamer‐binding transcription factor 4 [OCT4] and sex‐determining region Y‐box 2 [SOX2]) on FT1D01. (c) Embryoid body formation from FT1D01. Immunofluorescence analysis of markers for three embryonic germ layers: class III tubulin (TUJ1; ectoderm), VIMENTIN (mesoderm) and SOX17 (endoderm). (d) Teratoma formation of FT1D01. Hematoxylin–eosin staining shows differentiation into pigmented epithelium (ectoderm), cartilage (mesoderm) and gut‐like epithelium (endoderm). (e) Karyotyping of FT1D induced pluripotent stem cells derived from three patients. Nuclei were stained with Hoechst 33342 (blue) in (b) and (c). Scale bars, 300 μm in (a) and 100 μm in (b)–(d).
Fulminant type 1 diabetes iPSCs can be differentiated into pancreatic lineage cells
Because the target cells of fulminant type 1 diabetes are pancreatic β‐cells, we aimed to differentiate fulminant type 1 diabetes iPSCs into pancreatic endocrine lineage. Fulminant type 1 diabetes iPSCs were differentiated in the following three steps: sex‐determining region Y‐box 17‐positive definitive endoderm cells, pancreatic and duodenal homeobox 1‐positive pancreatic progenitor cells, and INS‐positive cells. The expression of these markers was examined by immunofluorescence analysis (Figures 2a and S4). Glucagon‐, somatostatin‐, ghrelin‐ and amylase‐positive cells, as well as C‐peptide‐positive cells, were also differentiated from fulminant type 1 diabetes iPSCs (Figures 2b and S5). Some cells were positively stained with C‐peptide and either glucagon or somatostatin. To compare the differentiation potential into endocrine cells between fulminant type 1 diabetes iPSCs and control‐iPSCs, we examined the induction rate of INS‐positive cells by flow cytometry. No significant difference was observed in the induction rate (fulminant type 1 diabetes, 3.9 ± 1.3% vs control, 4.1 ± 1.1%; P = 0.73, n = 3; Figure 2c). We also confirmed that the C‐peptide content of INS‐positive cells from fulminant type 1 diabetes iPSCs and control‐iPSCs was not significantly different (fulminant type 1 diabetes, 0.29 ± 0.10 fmol/cell vs control, 0.32 ± 0.18 fmol/cell; P = 0.52, n = 3; Figure S6). We then evaluated the insulin secretory function of insulin‐producing cells differentiated from fulminant type 1 diabetes iPSCs by C‐peptide secretion analysis. The C‐peptide level did not increase on glucose stimulation, but increased significantly on KCl stimulation (Figure 2d). These results suggest that β‐like insulin‐producing cells can be differentiated from fulminant type 1 diabetes iPSCs.
Figure 2.
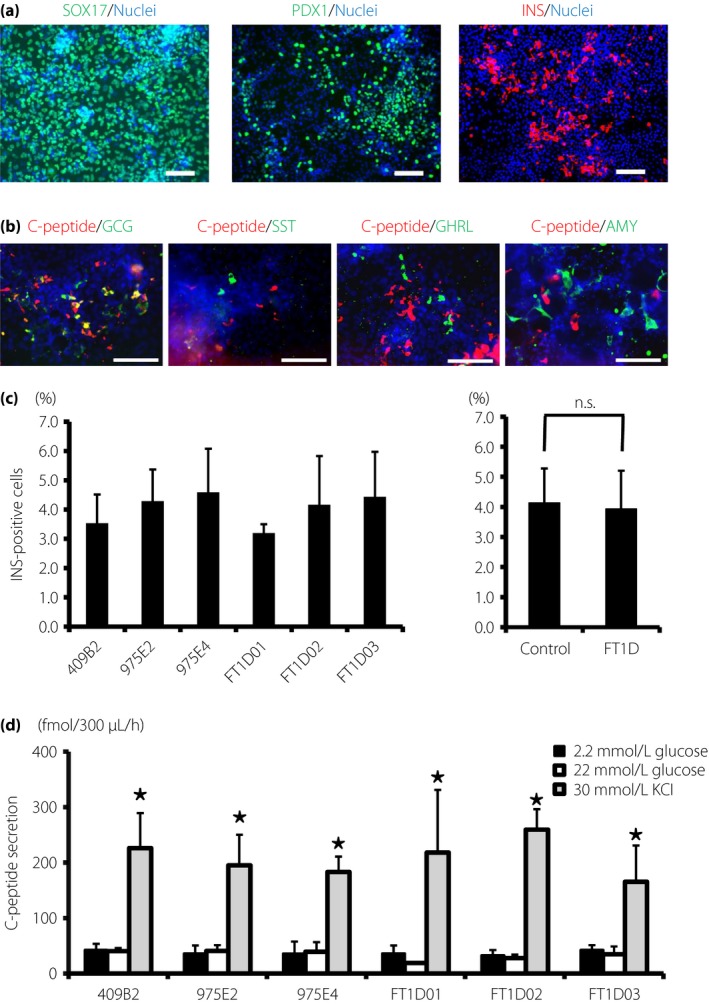
Differentiation of fulminant type 1 diabetes (FT1D) induced pluripotent stem cells (iPSCs) into pancreatic lineage cells in vitro. (a) Immunofluorescence analysis of representative markers for endoderm and pancreatic linages in cells differentiated from FT1D01: sex‐determining region Y‐box 17 (SOX17)‐positive cells, pancreatic and duodenal homeobox 1 (PDX1)‐positive cells and insulin (INS)‐positive cells. (b) Immunofluorescence analysis of pancreatic lineage markers in cells differentiated from FT1D01: C‐peptide (red), glucagon (GCG), somatostatin (SST), ghrelin (GHRL) and amylase (AMY; green). (c) Flow cytometric analysis of the induction rate of INS‐positive cells differentiated from control human iPSCs (control‐iPSCs) and fulminant type 1 diabetes iPSCs. (d) C‐peptide secretion analysis of the differentiated cells from three control human iPSCs and three fulminant type 1 diabetes iPSCs. Nuclei were stained with Hoechst 33342 (blue) in (a) and (b). The data from three independent experiments are shown as mean ± standard deviation (n = 3) in (c) and (d). *P < 0.05. Scale bars, 100 μm.
Proportion of cleaved caspase‐3‐positive cells is high in INS‐positive cells derived from fulminant type 1 diabetes iPSCs
To examine the cytokine‐induced apoptotic response of β‐cells in fulminant type 1 diabetes patients, we evaluated the apoptosis of insulin‐producing cells derived from three fulminant type 1 diabetes iPSC lines (FT1D01, FT1D02 and FT1D03) and three control‐iPSC lines (409B2, 975E2 and 975E4). We carried out a time‐course analysis of caspase‐3 activity in pancreatic cells differentiated from FT1D01 and 975E2 in stage 3 (day 12) in response to a cytokine cocktail consisting of 1,000 U/mL TNF‐α, 50 U/mL IL‐1β and 1,000 U/mL IFN‐γ. In both iPSC clones, caspase‐3 activity was increased from 3 h after the induction of cytokines, peaking at 4.5 h, and thereafter gradually decreasing (Figure 3a). We then quantified the number of cleaved caspase‐3‐ or TUNEL‐positive cells among INS‐positive cells derived from the three fulminant type 1 diabetes iPSC and three control‐iPSC clones in response to the three cytokines by immunofluorescence analysis. Cells were treated with cytokines for 4.5 h for the cleaved caspase‐3 analysis, and 9 h for the TUNEL analysis. The results showed that the proportion of cleaved caspase‐3‐positive cells among the induced INS‐positive cells was significantly higher in fulminant type 1 diabetes iPSCs than in control‐iPSCs (fulminant type 1 diabetes, 25.3 ± 6.9% vs control, 18.2 ± 3.8%; P = 0.02, n = 3; Figure 3b). In contrast, there was no significant difference in the proportion of TUNEL‐positive cells (fulminant type 1 diabetes, 4.8 ± 2.6% vs control, 4.3 ± 1.9%; P = 0.63, n = 3; Figure 3c). We also evaluated the difference in the apoptosis rate between two iPSC clones from each patient with fulminant type 1 diabetes (FT1D01 vs FT1D01‐2, FT1D02 vs FT1D02‐2 and FT1D03 vs FT1D03‐2). There were no significant differences between two iPSC clones of the same patients (Figure S7). We then carried out TUNEL analysis after 9 h of treatment with the lower dose of cytokines (300 U/mL TNF‐α, 15 U/mL IL‐1β and 300 U/mL IFN‐γ), but no significant differences in the proportion of TUNEL‐positive cells were observed (Figure S8). These results suggest that β‐like insulin‐producing cells from fulminant type 1 diabetes iPSCs might be more sensitive to apoptosis‐inducing stimuli.
Figure 3.
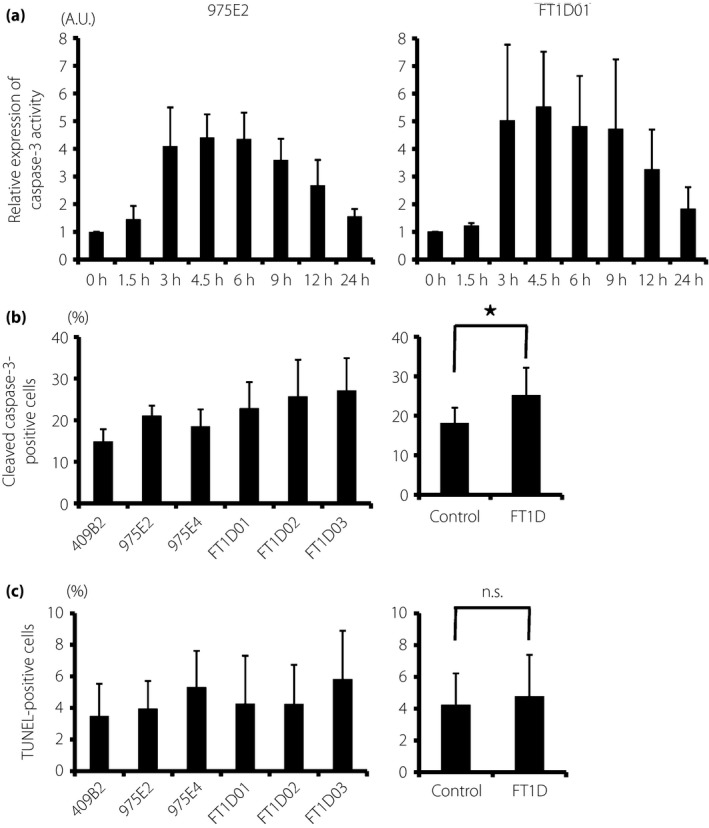
Apoptosis analysis of pancreatic cells differentiated from fulminant type 1 diabetes (FT1D) induced pluripotent stem cells (iPSCs). (a) Caspase‐3 activity in pancreatic cells from control human iPSCs (975E2) and fulminant type 1 diabetes iPSCs (FT1D01) in response to tumor necrosis factor‐α, interleukin‐1β and interferon‐γ. Each value was normalized with the total protein volume and is presented as the relative intensity compared with untreated cells (0 h). (b) Proportion of cleaved caspase‐3‐positive cells to insulin‐positive cells derived from three control human iPSCs and three fulminant type 1 diabetes iPSCs. (c) Proportion of terminal deoxynucleotidyl transferase 2′‐deoxyuridine, 5′‐triphosphate nick end labeling (TUNEL)‐positive cells to insulin‐positive cells derived from the same clones. The data from three independent experiments are shown as mean ± standard deviation (n = 3). *P < 0.05.
Expression of apoptosis‐related and immunoregulatory genes is altered in INS‐positive cells derived from fulminant type 1 diabetes iPSCs
To examine the detailed gene expression profiles of insulin‐producing cells differentiated from fulminant type 1 diabetes iPSCs, we developed an original method to extract RNA samples from INS‐positive cells that were fixed with fixative solution (PAXgene Tissue Containers), stained with anti‐INSULIN antibody and isolated by flow cytometry sorting (Figure 4a,b). qPCR analysis confirmed that INSULIN expression was detected in INS‐positive cells, but not in INS‐negative cells (Figure 4c).
Figure 4.
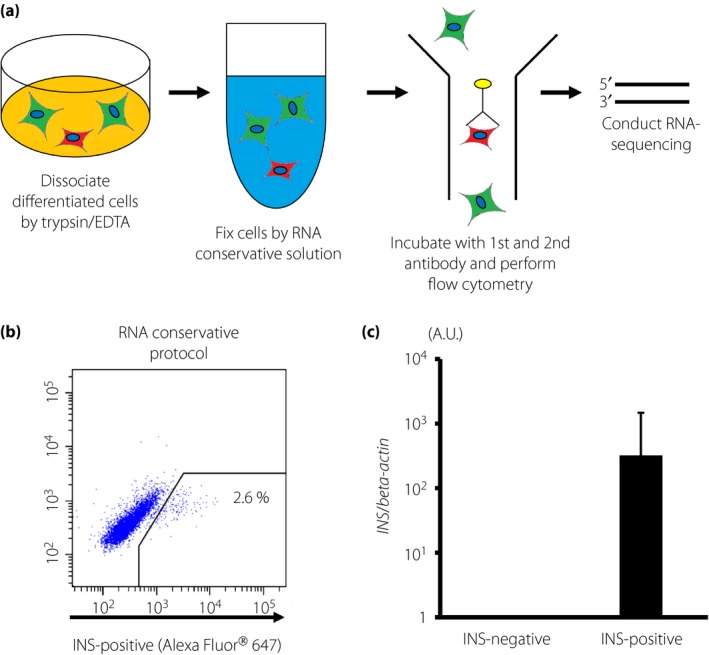
Ribonucleic acid (RNA) isolation from insulin (INS)‐positive cells derived from induced pluripotent stem cells. (a) Schematic drawing of RNA extraction from induced pluripotent stem cell‐derived INS‐positive cells. (b) Flow cytometric analysis of induced INS‐positive cells. Representative results from the analysis of INS‐positive cells derived from 975E4. (c) INSULIN gene expression in INS‐positive and INS‐negative cells isolated by flow cytometry sorting. The values were normalized to the average of the samples of INS‐negative cells. The data from three independent experiments using 975E4 are shown as mean ± standard deviation (n = 3) in (c). EDTA, ethylenediaminetetraacetic acid.
Next, in stage 3 (day 12), RNA sequencing analysis was carried out on isolated INS‐positive cells derived from the three fulminant type 1 diabetes iPSC clones (FT1D01, FT1D02 and FT1D03) and three control‐iPSC clones after 4.5 h of treatment with the three cytokines. The top 50 extracted differentially expressed genes identified by GSEA analysis are shown in Figure 5. Among these molecules, several apoptosis‐related genes were identified, including poly(ADP‐ribose) polymerase 3 (PARP3), coiled‐coil‐helix‐coiled‐coil‐helix domain containing 2 (CHCHD2) and inositol 1,4,5‐trisphosphate receptor, type 2 (ITPR2). An antiviral function gene, cholesterol 25‐hydroxylase (CH25H), was also identified. The basal expression of these genes before the cytokine treatment was not significantly different between fulminant type 1 diabetes iPSCs and control‐iPSCs (Figure S9). Other functional gene groups were also extracted, such as those related to cell–cell adhesion or differentiation and immune responses of B lymphoid cells. The top five gene sets and genes within those sets whose expression was altered in the fulminant type 1 diabetes samples as analyzed by GSEA are presented in Tables 1 and 2. The analysis showed that several pathways related to the immune response were differentially expressed between fulminant type 1 diabetes and control samples. The ‘immunoregulatory interactions between a lymphoid and a non‐lymphoid cell’ pathway was upregulated in fulminant type 1 diabetes samples, whereas target genes of RUNX1‐RUNX1T1 fusion protein were downregulated (Tables 1 and 2).
Figure 5.
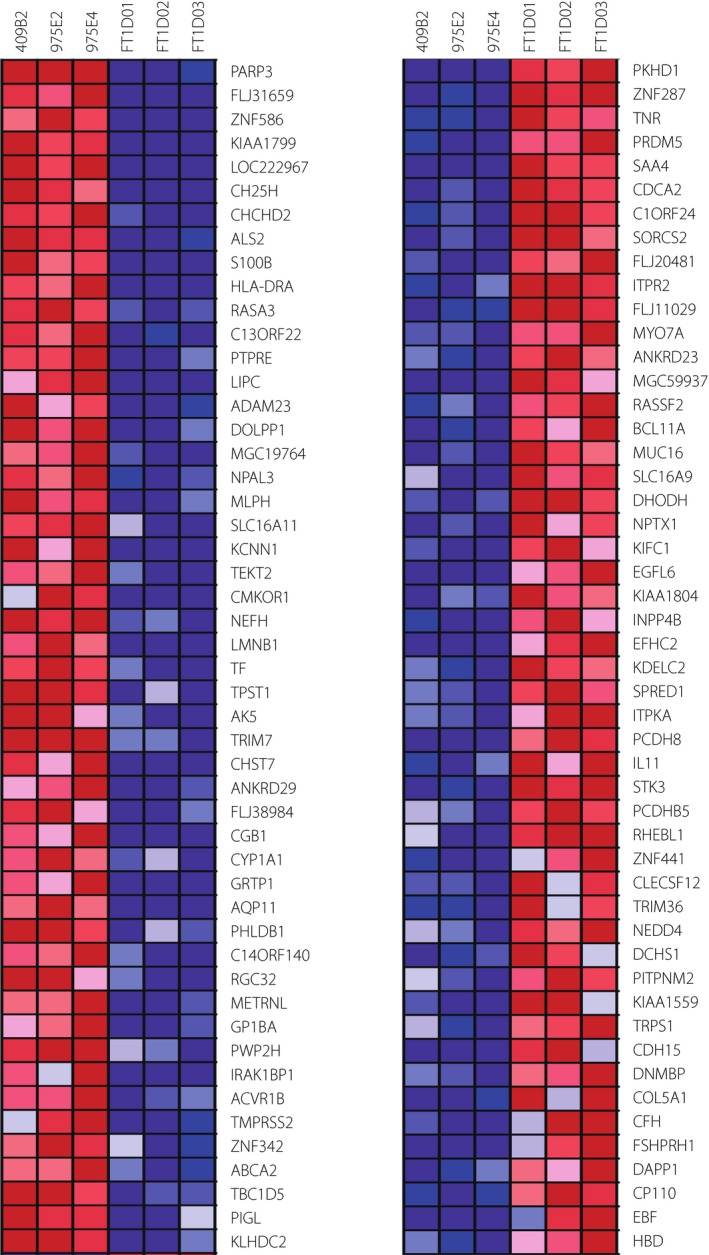
Gene expression analyses of insulin‐positive cells derived from fulminant type 1 diabetes induced pluripotent stem cells by ribonucleic acid sequencing. Heat map of differentially expressed genes between insulin‐positive cells derived from fulminant type 1 diabetes and control human iPSCs shows the top 50 genes identified by Gene Set Enrichment Analysis.
Table 1.
Top five gene sets and the corresponding upregulated genes in fulminant type 1 diabetes samples as analyzed by gene set enrichment analysis
| Name | Size | Gene name | NOM P‐value |
|---|---|---|---|
| REACTOME_IMMUNOREGULATORY_INTERACTIONS_BETWEEN_A_LYMPHOID_AND_A_NON_LYMPHOID_CELL | 47 | CD3G, ULBP1, CD200R1, LILRB1, LILRB2, IFITM1, CD81, B2M, CDH1, ITGB1, KIR3DL2, ULBP3, CD8A, SELL, CD96, HLA‐G, KLRK1, HLA‐B, ICAM3, ICAM1, PVRL2, HLA‐A, CD40LG, CD160, CD3E, CD226, CD34, KLRC1, CD19, HCST, KIR2DS1, FCGR3A, LILRB4, KIR2DS2, CD3D, LILRB5, AMICA1, C3, HLA‐C, CRTAM, FCGR2B, KIR3DL1, KIR2DL1, ITGB7, KIR2DL2, CD40, ULBP2 | <0.01 |
| BILANGES_SERUM_SENSITIVE_VIA_TSC2 | 22 | COL1A2, GBF1, SPAG5, SNRPD3, GLG1, CTGF, KIAA1467, ATP1A1, EIF5B, SMARCA4, ANKRD26, NPM3, HIST1H1E, KIF1B, DDX46, CYR61, COL3A1, THBS2, BDP1, CRIM1, NEDD4, KIFC1 | <0.01 |
| CELL_PROJECTION_PART | 16 | SPAG6, CABP4, SOD1, DNAH9, B4GALT1, EFHC1, RAB35, PKD2, DNALI1, LC22A12, ATP6V0A4, ITLN1, ACTN2, CDK5R1, CROCC, PKHD1 | <0.01 |
| FINAK_BREAST_CANCER_SDPP_SIGNATURE | 17 | CXCL14, CD48, LCP1, RUNX3, CD8A, GZMA, ADRA2A, SPP1, OGN, SLC40A1, HRASLS, PLEK, F2RL2, VGLL1, ADM, FRZB, SNTG2 | <0.01 |
| SYNAPSE | 15 | TRAPPC4, GRM7, CABP4, CDK5, DLG4, NUFIP1, MAGEE1, ITGB1, NLGN1, SYNE1, RIMS1, ACHE, CDK5R1, EFNB1, MYO7A | <0.01 |
NOM, nominal.
Table 2.
Top five gene sets and the corresponding downregulated genes in fulminant type 1 diabetes samples as analyzed by gene set enrichment analysis
| Name | Size | Gene name | NOM P‐value |
|---|---|---|---|
| TONKS_TARGETS_OF_RUNX1_RUNX1T1_FUSION_SUSTAINED_IN_MONOCYTE_UP | 16 | CH25H, NEFH, CYP1A1, CRHBP, GDF15, TFPI, DUSP6, TM4SF1, PHLDA1, QPRT, HSPB1, SOX4, UCHL1, CSF1, ARG2, EPS8 | <0.01 |
| MORF_PAPSS1 | 68 | EIF4EBP2, TCEA1, AP3S1, LRPPRC, PAPSS1, GANAB, TIAL1, RTN4, DGKZ, ESD, SMNDC1, ANXA7, ACTR3, DCTD, DNAJC8, TOMM70A, PDHB, RPN1, FBXW11, PO7, ARF4, HDAC1, EPRS, AFG3L2, RNPEP, SRRM1, HDAC2, NDUFC1, RCHY1, CAPZA1, SUMO2, CAPZB, VDAC3, CALM2, ARFGEF1, ANAPC5, SEC24C, SEC63, SREBF2, TMED9, GNB2, HADHA, XRCC5, EIF1AX, AHCYL1, CANX, HADHB, XPO1, RAB6A, TM9SF2, GTF2A2, SERP1, GNB1, G3BP2, IDH3G, LYPLA1, VAMP3, PTPRA, CAP1, STARD7, CS, GAK, PUM2, RNF44, NAP1L4, GPAA1, BRD8, METAP1 | <0.01 |
| MODULE_152 | 99 | PCK2, ALAS1, PCCB, CYBA, BNIP3, LACTB, COX7A1, NDUFA5, SLC39A6, UCP1, UQCRC2, ACAA2, MAOB, FH, ECH1, NME4, GLUD1, NDUFA6, CYC1, SDHD, ATP5J, MRPL12, ATP5G1, BNIP3L, IDH3B, UQCRFS1, NDUFB5, SUCLG1, SDHB, NDUFS2, ABCF1, NDUFB3, IDH2, GPX4, MRPL3, NDUFA7, ATP6V1G1, ATP6V1D, AGXT, ATP5C1, HAX1, MGST1, ATP5G3, CYCS, ATP5B, BCKDHA, TIMM17B, ATP5O, VDAC1, SURF1, COX5A, SDHA, COX6A1, COX7A2, HADHA, COX8A, TOMM20, NDUFB8, COX17, NDUFS4, COX7C, ECHS1, SLC25A3, NDUFA3, COX5B, NDUFA9, COX6C, COX7B, ATP6V1B2, CYP11B2, ATP5D, PRDX5, ATP5H, NDUFS5, CLPP, NDUFAB1, COX4I1, NDUFA4, GCSH, COX6B1, NDUFS6, UQCRC1, NDUFS8, NDUFV1, NDUFB1, UQCRH, NDUFB10, NDUFV2, DECR1, ATP5E, GOT2, ATP5I, ATP6V1H, ATP6V0D1, ATP6AP1, CLN3, ATP6V1E1, NDUFB7, ATP6V0A1 | <0.01 |
| WONG_MITOCHONDRIA_GENE_MODULE | 152 | MTRR, AUH, PCK2, COQ3, MRPS36, PCCB, NDUFAF1, GSTZ1, DBT, NT5M, BCL2, COX7A1, PDK3, CRYZ, NDUFA5, LRPPRC, ABCB6, DCTN6, WARS2, FH, HINT2, ACAT1, MRPS30, SUCLA2, MRPS18C, MRPL32, NME4, GLUD1, NDUFA6, TOMM70A, NDUFB6, PDHB, NIPSNAP1, SCO1, CYC1, PPIF, MRPS17, MRPL45, MCCC2, ATP5J, MRPL13, MRPL12, ATP5G1, ATP13A3, MRPS33, ACADSB, MRPL42, OXCT1, CHDH, UQCRFS1, NDUFB5, SUCLG1, SDHB, NDUFS2, NDUFB3, NDUFC1, IDH2, GPX4, TUFM, VDAC3, MRPL3, MCEE, MRPL36, NDUFA7, ATP6V1G1, ATP6V1D, NDUFA8, ATP1B1, DLD, ATP5C1, HAX1, ATP5G3, ATP6V1C1, ATP5B, SOD2, CRYZL1, TIMM17B, ATP5O, SURF1, COX5A, MRPL11, COX6A1, COX7A2, ATP1B3, UNG, COX8A, NDUFB8, COX17, NDUFB9, NDUFS4, COX7C, ECHS1, MRPS15, NDUFA3, COX5B, TIMM23, NDUFA9, COX6C, ATP5L, SLC9A2, COX7B, SEC61G, NDUFA10, COX7B2, PRDX5, ATP5H, CRAT, NDUFS5, CLPP, NDUFAB1, COX4I1, MRPL18, NDUFA4, SFXN5, COX6B1, CYP27A1, NDUFS6, TFAM, NDUFS8, NDUFV1, NDUFB1, NDUFB10, NDUFV2, MRPL40, MRPS16, DECR1, MRPS28, ATP5E, COX7A2L, GOT2, ATP5I, ATP5G2, DUT, ATP6V1B1, MRPS18A, SLC9A5, MRPL27, TIMM10, ATP6AP1, ATOX1, MIPEP, MRPS18B, NQO1, FDXR, ATP6V1E1, SFXN2, BOP1, SLC25A17, SLC40A1, GCDH, GCAT, GRPEL2 | <0.01 |
| BOGNI_TREATMENT_RELATED_MYELOID_LEUKEMIA_DN | 17 | TBC1D5, NR2C1, PIM2, BTN3A3, FBXO21, CCNG2, CD2AP, CDK8, ZFYVE26, PREP, RGL2, MRPL28, ACOX1, CCNG1, CDH2, CCND1, DDR1 | <0.01 |
NOM, nominal.
Discussion
In the present study, we successfully derived iPSCs from fulminant type 1 diabetes patients and differentiated the fulminant type 1 diabetes iPSCs into insulin‐producing cells with similar efficiency as control‐iPSCs. The proportion of cleaved caspase‐3‐positive cells among INS‐positive cells was higher in the fulminant type 1 diabetes iPSCs than control‐iPSCs, although there was no significant difference in the proportion of TUNEL‐positive cells under the same cytokine treatment. This discrepancy could be due to the difference in the two apoptosis detection systems. TUNEL assays detect DNA fragments that are the final products of apoptotic signal cascades23. Thus, no difference in the proportion of TUNEL‐positive cells between fulminant type 1 diabetes iPSCs and control‐iPSCs could show that the β‐cells of both fulminant type 1 diabetes and healthy individuals eventually undergo apoptosis to similar degrees. In contrast, caspase‐3 is activated in the middle of apoptotic cascades24. Thus, the higher proportion of cleaved caspase‐3‐positive β‐like cells in fulminant type 1 diabetes iPSCs suggests that the β‐cells of fulminant type 1 diabetes might be more sensitive to cytotoxic cytokines. Other possible explanations for the discrepancy include functional differences between β‐like insulin‐producing cells differentiated from iPSCs and β‐cells in vivo. The insulin‐producing cells generated from iPSCs in the present study were functionally immature and thus might show different reactions to cytokines or other stimuli compared with mature β‐cells. Some recently reported differentiation protocols showed efficient in vitro generation of functional β‐cells with glucose‐stimulated insulin secretion potential25, 26. Modification of our iPSC model by adoption of these methods might create fulminant type 1 diabetes disease models that more accurately mimic in vivo disease phenotypes.
RNA sequencing and GSEA provided candidate genes that might be related to the pathogenesis of β‐cell destruction in fulminant type 1 diabetes. Among them, the expression of CH25H was downregulated in INS‐positive cells derived from all three fulminant type 1 diabetes iPSC clones. CH25H encodes cholesterol 25‐hydroxylase and alters cholesterol to 25‐hydroxycholesterol. CH25H also acts as an interferon‐stimulated gene, and 25‐hydroxycholesterol has multiple antiviral effects27. GSEA also showed the upregulation of genes related to B‐cell differentiation or immune responses, such as dual‐adapter for phosphotyrosine, and 3‐phosphoinositides‐1 (DAPP1) and early B‐cell factor (EBF), in INS‐positive cells derived from fulminant type 1 diabetes iPSC clones. DAPP1 regulates B‐cell receptor signaling, which mediates T‐cell function28, and EBF is a key factor for B‐cell differentiation29. Finally, GSEA showed that immune response‐related genes are differentially expressed between fulminant type 1 diabetes and control samples, implying that insufficient antiviral function or abnormal immunoregulation in fulminant type 1 diabetes β‐cells might cause rapid β‐cell destruction and disease development.
Whether these data are unique for fulminant type 1 diabetes iPSCs and are not observed in iPSCs from patients with autoimmune type 1 (type 1A) diabetes is unknown. Several reports have described the generation of iPSCs from patients with type 1 diabetes30, 31, 32 and the differentiation of the iPSCs into insulin‐producing cells31, 32. However, detailed characterization of the β‐like cells was not carried out. Future studies should compare iPSC‐derived β‐like cells between fulminant type 1 diabetes and type 1A diabetes.
In summary, we established iPSCs from fulminant type 1 diabetes patients and generated β‐like cells from the fulminant type 1 diabetes iPSCs. These cells showed upregulated expression of apoptotic markers (as evaluated by cleaved caspase‐3) after cytokine treatment. Additionally, gene expression analysis showed that the expressions of several apoptosis‐ and immunoregulation‐related genes were altered in INS‐positive cells derived from fulminant type 1 diabetes iPSCs. Our iPSC model should allow for further understanding of the pathophysiology and establishment of therapeutic methods for fulminant type 1 diabetes.
Disclosure
The authors declare no conflict of interest.
Supporting information
Figure S1 ¦ Pluripotency markers of induced pluripotent stem cells from two fulminant type 1 diabetes patients.
Figure S2 ¦ Embryoid body formation from FT1D02 and FT1D03.
Figure S3 ¦ Teratoma formation in FT1D02.
Figure S4 ¦ Differentiation of FT1D02 and FT1D03 into pancreatic lineage cells in vitro.
Figure S5 ¦ Differentiation of FT1D02 and FT1D03 into glucagon (GCG)‐, somatostatin (SST)‐, ghrelin (GHRL)‐, and amylase (AMY)‐positive cells.
Figure S6 ¦ C‐peptide content of induced pluripotent stem cell‐derived insulin‐positive cells.
Figure S7 ¦ Proportion of cleaved caspase‐3‐ or terminal deoxynucleotidyl transferase dUTP nick end labeling (TUNEL)‐positive cells to insulin‐positive cells from two induced pluripotent stem cell clones of each fulminant type 1 diabetes (FT1D) patient.
Figure S8 ¦ Apoptosis analysis of induced pluripotent stem cell‐derived insulin‐positive cells treated with the lower dose of cytokines.
Figure S9 ¦ Basal expressions of PARP3, CHCHD2, ITPR2 and CH25H in iPSC‐derived INS‐positive cells.
Acknowledgments
The authors thank all the members of Osafune laboratory, CiRA, for providing technical support and helpful suggestions, and Dr Peter Karagiannis, CiRA, for critically reading and revising the manuscript. Finally, the authors thank Angela Morben, DVM, ELS, from Edanz Group (http://www.edanzediting.com/ac) for editing a draft of this manuscript. This research was partially supported by the Japan Agency for Medical Research and Development (AMED) through its research grant ‘Core Center for iPS Cell Research, Research Center Network for Realization of Regenerative Medicine,’ and by the Japan IDDM network.
J Diabetes Investig 2018;9: 481–493
Contributor Information
Kenji Osafune, Email: osafu@cira.kyoto-u.ac.jp.
Akihisa Imagawa, Email: imagawa@osaka-med.ac.jp.
References
- 1. Imagawa A, Hanafusa T, Uchigata Y, et al Fulminant type 1 diabetes: a nationwide survey in Japan. Diabetes Care 2003; 26: 2345–2352. [DOI] [PubMed] [Google Scholar]
- 2. Imagawa A, Hanafusa T, Makino H, et al High titres of IgA antibodies to enterovirus in fulminant type‐1 diabetes. Diabetologia 2005; 48: 290–293. [DOI] [PubMed] [Google Scholar]
- 3. Imagawa A, Hanafusa T, Awata T, et al Report of the Committee of the Japan Diabetes Society on the Research of Fulminant and Acute‐onset Type 1 Diabetes Mellitus: new diagnostic criteria of fulminant type 1 diabetes mellitus. J Diabetes Investig 2012; 3: 536–539. [DOI] [PMC free article] [PubMed] [Google Scholar]
- 4. Gaudy C, Clévy C, Monestier S, et al Anti‐PD1 pembrolizumab can induce exceptional fulminant type 1. Diabetes Care 2015; 38: e182–e183. [DOI] [PubMed] [Google Scholar]
- 5. Tanaka S, Aida K, Nishida Y, et al Pathophysiological mechanisms involving aggressive islet cell destruction in fulminant type 1 diabetes. Endocr J 2013; 60: 837–845. [DOI] [PubMed] [Google Scholar]
- 6. Ebert AD, Yu J, Rose FF Jr, et al Induced pluripotent stem cells from a spinal muscular atrophy patient. Nature 2009; 457: 277–280. [DOI] [PMC free article] [PubMed] [Google Scholar]
- 7. Numasawa‐Kuroiwa Y, Okada Y, Shibata S, et al Involvement of ER stress in dysmyelination of Pelizaeus‐Merzbacher Disease with PLP1 missense mutations shown by iPSC‐derived oligodendrocytes. Stem Cell Reports 2014; 2: 648–661. [DOI] [PMC free article] [PubMed] [Google Scholar]
- 8. Shibasaki S, Imagawa A, Tauriainen S, et al Expression of toll‐like receptors in the pancreas of recent‐onset fulminant type 1 diabetes. Endocr J 2010; 57: 211–219. [DOI] [PubMed] [Google Scholar]
- 9. Thomas HE, McKenzie MD, Angstetra E, et al Beta cell apoptosis in diabetes. Apoptosis 2009; 14: 1389–1404. [DOI] [PubMed] [Google Scholar]
- 10. Aida K, Nishida Y, Tanaka S, et al RIG‐I‐ and MDA5‐initiated innate immunity linked with adaptive immunity accelerates beta‐cell death in fulminant type 1 diabetes. Diabetes 2011; 60: 884–889. [DOI] [PMC free article] [PubMed] [Google Scholar]
- 11. Wang Z, Zheng C, Tan YY, et al Gene expression changes in patients with fulminant type 1 diabetes. Chin Med J 2011; 124: 3613–3617. [PubMed] [Google Scholar]
- 12. Tanaka S, Nishida Y, Aida K, et al Enterovirus infection, CXC chemokine ligand 10 (CXCL10), and CXCR3 circuit: a mechanism of accelerated beta‐cell failure in fulminant type 1 diabetes. Diabetes 2009; 58: 2285–2291. [DOI] [PMC free article] [PubMed] [Google Scholar]
- 13. Hanafusa T, Imagawa A. Fulminant type 1 diabetes: a novel clinical entity requiring special attention by all medical practitioners. Nat Clin Pract Endocrinol Metab 2007; 3: 36–45. [DOI] [PubMed] [Google Scholar]
- 14. Okita K, Matsumura Y, Sato Y, et al A more efficient method to generate integration‐free human iPS cells. Nat Methods 2011; 8: 409–412. [DOI] [PubMed] [Google Scholar]
- 15. McMahon AP, Bradley A. The Wnt‐1 (int‐1) proto‐oncogene is required for development of a large region of the mouse brain. Cell 1990; 62: 1073–1085. [DOI] [PubMed] [Google Scholar]
- 16. Ameku T, Taura D, Sone M, et al Identification of MMP1 as a novel risk factor for intracranial aneurysms in ADPKD using iPSC models. Sci Rep 2016; 6: 30013. [DOI] [PMC free article] [PubMed] [Google Scholar]
- 17. Yu J, Hu K, Smuga‐Otto K, et al Human induced pluripotent stem cells free of vector and transgene sequences. Science 2009; 324: 797–801. [DOI] [PMC free article] [PubMed] [Google Scholar]
- 18. Kunisada Y, Tsubooka‐Yamazoe N, Shoji M, et al Small molecules induce efficient differentiation into insulin‐producing cells from human induced pluripotent stem cells. Stem Cell Res 2011; 8: 274–284. [DOI] [PubMed] [Google Scholar]
- 19. Eizirik DL, Sandler S, Welsh N, et al Cytokines suppress human islet function irrespective of their effects on nitric oxide generation. J Clin Invest 1994; 93: 1968–1974. [DOI] [PMC free article] [PubMed] [Google Scholar]
- 20. Hostens K, Pavlovic D, Zambre Y, et al Exposure of human islets to cytokines can result in disproportionately elevated proinsulin release. J Clin Invest 1999; 104: 67–72. [DOI] [PMC free article] [PubMed] [Google Scholar]
- 21. Mokhtari D, Myers JW, Welsh N. MAPK kinase kinase‐1 is essential for cytokine‐induced c‐Jun NH2‐terminal kinase and nuclear factor‐kappaB activation in human pancreatic islet cells. Diabetes 2008; 57: 1896–1904. [DOI] [PMC free article] [PubMed] [Google Scholar]
- 22. Hrvatin S, Deng F, O'Donnell CW, et al MARIS: method for analyzing RNA following intracellular sorting. PLoS One 2014; 9: e89459. [DOI] [PMC free article] [PubMed] [Google Scholar]
- 23. Gavrieli Y, Sherman Y, Ben‐Sasson SA. Identification of programmed cell death in situ via specific labeling of nuclear DNA fragmentation. J Cell Biol 1992; 119: 493–501. [DOI] [PMC free article] [PubMed] [Google Scholar]
- 24. Earnshaw WC, Martins LM, Kaufmann SH. Mammalian caspases: structure, activation, substrates, and functions during apoptosis. Annu Rev Biochem 1999; 68: 383–424. [DOI] [PubMed] [Google Scholar]
- 25. Pagliuca FW, Millman JR, Gürtler M, et al Generation of functional human pancreatic β cells in vitro. Cell 2014; 159: 428–439. [DOI] [PMC free article] [PubMed] [Google Scholar]
- 26. Rezania A, Bruin JE, Arora P, et al Reversal of diabetes with insulin‐producing cells derived in vitro from human pluripotent stem cells. Nat Biotechnol 2014; 32: 1121–1133. [DOI] [PubMed] [Google Scholar]
- 27. Cyster JG, Dang EV, Reboldi A, et al 25‐Hydroxycholesterols in innate and adaptive immunity. Nat Rev Immunol 2014; 14: 731–743. [DOI] [PubMed] [Google Scholar]
- 28. Zhang TT, Li H, Cheung SM, et al Phosphoinositide 3‐kinase‐regulated adapters in lymphocyte activation. Immunol Rev 2009; 232: 255–272. [DOI] [PubMed] [Google Scholar]
- 29. Boller S, Grosschedl R. The regulatory network of B‐cell differentiation: a focused view of early B‐cell factor 1 function. Immunol Rev 2014; 261: 102–115. [DOI] [PMC free article] [PubMed] [Google Scholar]
- 30. Park IH, Arora N, Huo H, et al Disease‐specific induced pluripotent stem cells. Cell 2008; 134: 877–886. [DOI] [PMC free article] [PubMed] [Google Scholar]
- 31. Maehr R, Chen S, Snitow M, et al Generation of pluripotent stem cells from patients with type 1 diabetes. Proc Natl Acad Sci USA 2009; 106: 15768–15773. [DOI] [PMC free article] [PubMed] [Google Scholar]
- 32. Thatava T, Kudva YC, Edukulla R, et al Intrapatient variations in type 1 diabetes‐specific iPS cell differentiation into insulin‐producing cells. Mol Ther 2013; 21: 228–239. [DOI] [PMC free article] [PubMed] [Google Scholar]
Associated Data
This section collects any data citations, data availability statements, or supplementary materials included in this article.
Supplementary Materials
Figure S1 ¦ Pluripotency markers of induced pluripotent stem cells from two fulminant type 1 diabetes patients.
Figure S2 ¦ Embryoid body formation from FT1D02 and FT1D03.
Figure S3 ¦ Teratoma formation in FT1D02.
Figure S4 ¦ Differentiation of FT1D02 and FT1D03 into pancreatic lineage cells in vitro.
Figure S5 ¦ Differentiation of FT1D02 and FT1D03 into glucagon (GCG)‐, somatostatin (SST)‐, ghrelin (GHRL)‐, and amylase (AMY)‐positive cells.
Figure S6 ¦ C‐peptide content of induced pluripotent stem cell‐derived insulin‐positive cells.
Figure S7 ¦ Proportion of cleaved caspase‐3‐ or terminal deoxynucleotidyl transferase dUTP nick end labeling (TUNEL)‐positive cells to insulin‐positive cells from two induced pluripotent stem cell clones of each fulminant type 1 diabetes (FT1D) patient.
Figure S8 ¦ Apoptosis analysis of induced pluripotent stem cell‐derived insulin‐positive cells treated with the lower dose of cytokines.
Figure S9 ¦ Basal expressions of PARP3, CHCHD2, ITPR2 and CH25H in iPSC‐derived INS‐positive cells.