

Abstract
Major depressive disorder (MDD) is a common illness accompanied by considerable morbidity, mortality, costs, and heightened risk of suicide. We conducted a genome-wide association (GWA) meta-analysis based in 135,458 cases and 344,901 control, We identified 44 independent and significant loci. The genetic findings were associated with clinical features of major depression, and implicated brain regions exhibiting anatomical differences in cases. Targets of antidepressant medications and genes involved in gene splicing were enriched for smaller association signal. We found important relations of genetic risk for major depression with educational attainment, body mass, and schizophrenia: lower educational attainment and higher body mass were putatively causal whereas major depression and schizophrenia reflected a partly shared biological etiology. All humans carry lesser or greater numbers of genetic risk factors for major depression. These findings help refine and define the basis of major depression and imply a continuous measure of risk underlies the clinical phenotype.
INTRODUCTION
Major depressive disorder (MDD) is a notably complex and common illness1. It is often chronic or recurrent and is thus accompanied by considerable morbidity, disability, excess mortality, substantial costs, and heightened risk of suicide2–8. Twin studies attribute approximately 40% of the variation in liability to MDD to additive genetic effects (phenotype heritability, h2)9, and h2 may be greater for recurrent, early-onset, and postpartum MDD10,11. GWA studies of MDD have had notable difficulties in identifying individual associated loci12. For example, there were no significant findings in the initial Psychiatric Genomics Consortium (PGC) MDD mega-analysis (9,240 cases)13 or in the CHARGE meta-analysis of depressive symptoms (N=34,549)14. More recent studies have proven modestly successful. A study of Han Chinese women (5,303 recurrent MDD cases) identified significant loci15, a meta-analysis of depressive symptoms (161,460 individuals) identified two loci16, and an analysis of self-reported major depression identified 15 loci (75,607 cases).
There are many reasons why identifying causal loci for MDD has proven difficult12. MDD is probably influenced by many genetic loci each with small effects17, as are most common diseases18 including psychiatric disorders19,20. Estimates of the proportion of variance attributable to genome-wide SNPs (SNP heritability, ) indicate that around a quarter of the h2 for MDD is due to common genetic variants21,22, and demonstrate that a genetic signal is detectable in GWA data, implying that larger sample sizes are needed to detect specific loci given their effect sizes. Such a strategy has been proven in schizophrenia studies, the flagship adult psychiatric disorder in genomics research. We thus accumulated clinical, population, and volunteer cohorts23. This pragmatic approach takes the view that sample size can overcome heterogeneity to identify risk alleles that are robustly associated with major depression. Potential concerns about combining carefully curated research cohorts with volunteer cohorts were ameliorated via multiple lines of evidence that suggest the results are likely to be applicable to clinical MDD. As discussed more fully below, our analyses have neurobiological, clinical, and therapeutic relevance for major depression.
RESULTS
Cohort analyses: phenotype validation
We identified seven cohorts that used a range of methods to ascertain cases with major depression (described in detail in Table 1, Supplementary Tables 1–3). The methods used by these cohorts were extensively reviewed drawing on the breadth of expertise in the PGC, and we assessed the comparability of the cohorts using genomic data. We use “MDD” to refer to directly evaluated subjects meeting standard criteria for major depressive disorder and use “major depression” where case status was determined using alternative methods as well as to the phenotype from the full meta-analysis.
Table 1.
Brief description of the seven MDD or major depression cohorts used in the meta-analysis
| Sample | Country | Case ascertainment | Cases | Controls |
|---|---|---|---|---|
| PGC2913, a | Various | Structured diagnostic interviewsb | 16,823 | 25,632 |
| deCODE13 | Iceland | National inpatient electronic records | 1,980 | 9,536 |
| GenScotland78,79 | UK | Structured diagnostic interview | 997 | 6,358 |
| GERA80 | USA | Kaiser Permanente Northern California Healthcare electronic medical records (1995–2013) | 7,162 | 38,307 |
| iPSYCH81 | Denmark | National inpatient electronic records | 18,629 | 17,841 |
| UK Biobank82 (Pilot data release) | UK | From self-reported MDD symptoms or treatment or electronic records69 | 14,260 | 15,480 |
| 23andMeD28 (Discovery sample)c | USA | Self-reported diagnosis or treatment for clinical depression by a medical professional | 75,607 | 231,747 |
| Total | 135,458 | 344,901 |
19 additional samples to the 10 samples published in the first PGC-MDD paper13.
One sample used natural language processing of electronic medical records followed by expert diagnostic review.
In Hyde et al.28 SNPs in 15 genomic regions met genome-wide significance in the combined discovery and replication samples, and 11 regions achieved genome-wide significance in the discovery sample made available to the research community and used here. More details are provided in Supplementary Tables 1–3.
We evaluated the comparability of the seven cohorts by estimating the common-variant genetic correlations (rg) between them. These analyses strongly supported the comparability of the seven cohorts (Supplementary Table 3) as the weighted mean rg was 0.76 (SE 0.03). The high genetic correlations between the 23andMeD and other cohorts are notable. While there is no statistical evidence of heterogeneity in the rg estimates between pairs of cohorts (P=0.13), the estimate is statistically different from 1 which may reflect etiological heterogeneity. This estimate can be benchmarked against the slightly larger weighted mean rg between schizophrenia cohorts of 0.84 (SE 0.05)21.
Given the positive evidence of the genetic comparability of these cohorts, we completed a GWA meta-analysis of 9.6 million imputed SNPs in 135,458 MDD and major depression cases and 344,901 controls (Fig. 1). There was no evidence of residual population stratification24 (LD score regression intercept 1.018, SE 0.009). We estimated to be 8.7% (SE 0.004, liability scale, assuming lifetime risk 0.15, Supplementary Table 3b and Supplementary Fig. 1), and note that this is about a quarter of h2 estimated from twin or family studies9. This fraction is somewhat lower than that of other complex traits18, and is plausibly due to etiological heterogeneity (and reflecting the mean rg <1 between cohorts).
Fig. 1. Results of GWA meta-analysis of seven cohorts for major depression.

(a) Relation between adding cohorts and number of genome-wide significant genomic regions (before the rigorous vetting used to define the final 44 regions). Beginning with the largest cohort (#1 on the x-axis), added the next largest cohort (#2) until all cohorts were included (#7). The number next to each point shows the total effective sample size equivalent to sample size where the numbers of cases and controls are equal. (b) Association test quantile-quantile plot showing a marked departure from a null model of no associations (y-axis truncated 10−12). (c) Manhattan plot with x-axis showing genomic position (chr1-chr22 plus chrX), and the y-axis showing statistical significance as –log10(P) t-statistic; threshold for significance accounting for multiple testing shown by horizontal line. Association test from meta-analysis of 135,458 major depression cases and 344,901 controls. The red line shows the genome-wide significance threshold (P=5×10⁻⁸).
To evaluate the impact of combining major depression cohorts that used different ascertainment methods, we undertook a series of genetic risk score (GRS) prediction analyses to demonstrate the validity of our GWA results for clinical MDD (Fig. 2). Importantly, the variance explained in out-of-sample prediction increased with the size of the GWA discovery cohort (Fig. 2a), with the GRS from the full discovery sample meta-analysis explaining 1.9% of variance in liability (Fig. 2a, Supplementary Fig. 2, and Supplementary Table 4). For any randomly selected case and control, GRS ranked cases higher than controls with probability 0.57 (i.e., AUC=0.57), and the odds ratio of MDD for those in the 10th versus 1st GRS decile (OR10) was 2.4 (Fig. 2b, Supplementary Table 4). GRS analyses in other disorders (e.g., schizophrenia25) have shown that mean GRS increases with clinical severity in cases. We found significantly higher major depression GRS in those with more severe MDD, as measured in different ways (Fig. 2c). Last, because around half of the major depression cases were identified by self-report (i.e., diagnosis or treatment for clinical depression by a medical professional), we further evaluated the comparability of the 23andMeD cohort with the other cohorts (full meta-analysis excluding 23andMeD, “FMex23”) as detailed in Fig. 2c, Supplementary Table 5 and Supplementary Note. Taken together, we interpret these results as supporting this meta-analysis of GWA results for these seven cohorts.
Fig. 2. Genetic risk score (GRS) prediction analyses into PGC29 MDD target samples.

(a) Variance explained (liability scale) based on different discovery samples for three target samples: PGC29 (16,823 cases, 25,632 controls), iPSYCH (a nationally representative sample of 18,629 cases and 17,841 controls,) and a clinical cohort from Münster not included in the GWA analysis (845 MDD inpatient cases, 834 controls). PGC29-LOO: Target sample is one of the PGC29 samples, with discovery sample the remaining 28 PGC29 samples, hence, leave-one-out. (b) Odds ratios of major depression per GRS decile relative to the first decile for iPSYCH and PGC29 target samples. (c) Odds ratios of major depression in GRS standard deviation (SD): 3,950 early onset vs 3,950 late onset cases earlier age at onset; 4,958 severe vs 3,976 moderate cases defined by count of endorsed MDD symptom criteria; 5,574 cases recurrent MDD vs 12,968 single episode cases; severity defined as chronic/unremitting MDD 610 “Stage IV” cases vs 499 “Stage II” or 332 first-episode MDD 77 used the NESDA sample from PGC29. Error bars represent 95% confidence intervals. Logistic regression association test p-values in the target sample for GRS generated from SNPs with p-value < 0.05 in the discovery sample.
Implications of the individual loci for the biology of major depression
Our meta-analysis of seven MDD and major depression cohorts identified 44 independent loci that were statistically significant (P<5×10⁻⁸), statistically independent of any other signal26, and supported by multiple SNPs. This number supports our prediction that GWA discovery in major depression would require about five times more cases than for schizophrenia (lifetime risk ~1% and h2~0.8) to achieve approximately similar power27. Of these 44 loci, 30 are novel and 14 were significant in a prior study of MDD or depressive symptoms. The overlap of our findings with prior reports were: 1/1 with CHARGE depressive symptom14, 1/2 overlap with SSGAC depressive symptom16, and 12/15 overlap with Hyde et al.28 ). There are few trans-ancestry comparisons for major depression so we contrasted these European results with the Han Chinese CONVERGE study15 (Supplementary Note). The loci identified in CONVERGE are uncommon in Europeans (rs12415800 0.45 vs 0.02 and rs35936514 0.28 vs 0.06) and were, not significant in our analysis.
Table 2 lists genes in or near the lead SNP in each region, regional plots are in Supplementary Data 1, and Supplementary Tables 6–7 provide extensive summaries of available information about the biological functions of the genes in each region. In the Supplementary Note we review four key genes in more detail: OLFM4 and NEGR1 (notable for reported associations with obesity and body mass index29–34), RBFOX1 (notable for independent our associations at both the 5′ and the 3′ ends, a splicing regulator35,36, with a functional role that may be consistent with chronic hypothalamic-pituitary-adrenal axis hyperactivation reported in MDD37), and LRFN5 (notable for its role in pre-synaptic differentiation38,39 and neuroinflammation40).
Table 2.
44 significantly associated genomic regions in meta-analysis of 135,458 major depression cases and 344,901 controls
| Chr | Region (Mb) | SNP | Location-bp | P | A1/2 | OR-A1 | SE(log)OR) | Frq | Prev | Gene Context |
|---|---|---|---|---|---|---|---|---|---|---|
| 1 | 8.390–8.895 | rs159963 | 8,504,421 | 3.2E-08 | A/C | 0.97 | 0.0049 | 0.56 | H,S | [RERE]; SLC45A1,100194 |
| 1 | 72.511–73.059 | rs1432639 | 72,813,218 | 4.6E-15 | A/C | 1.04 | 0.0050 | 0.63 | H | NEGR1, −64941 |
| 1 | 73.275–74.077 | rs12129573 | 73,768,366 | 4.0E-12 | A/C | 1.04 | 0.0050 | 0.37 | S | LINC01360, −3486 |
| 1 | 80.785–80.980 | rs2389016 | 80,799,329 | 1.0E-08 | T/C | 1.03 | 0.0053 | 0.28 | H | |
| 1 | 90.671–90.966 | rs4261101 | 90,796,053 | 1.0E-08 | A/G | 0.97 | 0.0050 | 0.37 | ||
| 1 | 197.343–197.864 | rs9427672 | 197,754,741 | 3.1E-08 | A/G | 0.97 | 0.0058 | 0.24 | DENND1B, −10118 | |
| 2 | 57.765–58.485 | rs11682175 | 57,987,593 | 4.7E-09 | T/C | 0.97 | 0.0048 | 0.52 | H,S | VRK2, −147192 |
| 2 | 156.978–157.464 | rs1226412 | 157,111,313 | 2.4E-08 | T/C | 1.03 | 0.0059 | 0.79 | [LINC01876]; NR4A2,69630; GPD2, −180651 | |
| 3 | 44.222–44.997 | chr3_44287760_I | 44,287,760 | 4.6E-08 | I/D | 1.03 | 0.0051 | 0.34 | T | [TOPAZ1]; TCAIM, −91850; ZNF445,193501 |
| 3 | 157.616–158.354 | rs7430565 | 158,107,180 | 2.9E-09 | A/G | 0.97 | 0.0048 | 0.58 | H | [RSRC1]; LOC100996447,155828; MLF1, −181772 |
| 4 | 41.880–42.189 | rs34215985 | 42,047,778 | 3.1E-09 | C/G | 0.96 | 0.0063 | 0.24 | [SLC30A9]; LINC00682, −163150; DCAF4L1,59294 | |
| 5 | 87.443–88.244 | chr5_87992715_I | 87,992,715 | 7.9E-11 | I/D | 0.97 | 0.0050 | 0.58 | H | LINC00461, −12095; MEF2C,21342 |
| 5 | 103.672–104.092 | chr5_103942055_D | 103,942,055 | 7.5E-12 | I/D | 1.03 | 0.0048 | 0.48 | C | |
| 5 | 124.204–124.328 | rs116755193 | 124,251,883 | 7.0E-09 | T/C | 0.97 | 0.0050 | 0.38 | LOC101927421, −120640 | |
| 5 | 164.440–164.789 | rs11135349 | 164,523,472 | 1.1E-09 | A/C | 0.97 | 0.0048 | 0.48 | H | |
| 5 | 166.977–167.056 | rs4869056 | 166,992,078 | 6.8E-09 | A/G | 0.97 | 0.0050 | 0.63 | [TENM2] | |
| 6 | 27.738–32.848 | rs115507122 | 30,737,591 | 3.3E-11 | C/G | 0.96 | 0.0063 | 0.18 | S | extended MHC |
| 6 | 99.335–99.662 | rs9402472 | 99,566,521 | 2.8E-08 | A/G | 1.03 | 0.0059 | 0.24 | FBXL4, −170672; C6orf168,154271 | |
| 7 | 12.154–12.381 | rs10950398 | 12,264,871 | 2.6E-08 | A/G | 1.03 | 0.0049 | 0.41 | [TMEM106B]; VWDE,105637 | |
| 7 | 108.925–109.230 | rs12666117 | 109,105,611 | 1.4E-08 | A/G | 1.03 | 0.0048 | 0.47 | ||
| 9 | 2.919–3.009 | rs1354115 | 2,983,774 | 2.4E-08 | A/C | 1.03 | 0.0049 | 0.62 | H | PUM3, −139644; LINC01231, −197814 |
| 9 | 11.067–11.847 | rs10959913 | 11,544,964 | 5.1E-09 | T/G | 1.03 | 0.0057 | 0.76 | ||
| 9 | 119.675–119.767 | rs7856424 | 119,733,595 | 8.5E-09 | T/C | 0.97 | 0.0053 | 0.29 | [ASTN2] | |
| 9 | 126.292–126.735 | rs7029033 | 126,682,068 | 2.7E-08 | T/C | 1.05 | 0.0093 | 0.07 | [DENND1A]; LHX2, −91820 | |
| 10 | 106.397–106.904 | rs61867293 | 106,563,924 | 7.0E-10 | T/C | 0.96 | 0.0061 | 0.20 | H | [SORCS3] |
| 11 | 31.121–31.859 | rs1806153 | 31,850,105 | 1.2E-09 | T/G | 1.04 | 0.0059 | 0.22 | [DKFZp686K1684]; [PAUPAR]; ELP4,44032; PAX6, −10596; | |
| 12 | 23.924–24.052 | rs4074723 | 23,947,737 | 3.1E-08 | A/C | 0.97 | 0.0049 | 0.41 | [SOX5] | |
| 13 | 44.237–44.545 | rs4143229 | 44,327,799 | 2.5E-08 | A/C | 0.95 | 0.0091 | 0.92 | [ENOX1]; LACC1, −125620; CCDC122,82689 | |
| 13 | 53.605–54.057 | rs12552 | 53,625,781 | 6.1E-19 | A/G | 1.04 | 0.0048 | 0.44 | H | [OLFM4]; LINC01065,80099 |
| 14 | 41.941–42.320 | rs4904738 | 42,179,732 | 2.6E-09 | T/C | 0.97 | 0.0049 | 0.57 | [LRFN5] | |
| 14 | 64.613–64.878 | rs915057 | 64,686,207 | 7.6E-10 | A/G | 0.97 | 0.0049 | 0.42 | [SYNE2]; MIR548H1, −124364; ESR2,7222 | |
| 14 | 75.063–75.398 | chr14_75356855_I | 75,356,855 | 3.8E-09 | D/I | 1.03 | 0.0049 | 0.49 | [DLST]; PROX2, −26318; RPS6KL1,13801 | |
| 14 | 103.828–104.174 | rs10149470 | 104,017,953 | 3.1E-09 | A/G | 0.97 | 0.0049 | 0.49 | S | BAG5,4927; APOPT1, −11340 |
| 15 | 37.562–37.929 | rs8025231 | 37,648,402 | 2.4E-12 | A/C | 0.97 | 0.0048 | 0.57 | H | |
| 16 | 6.288–6.347 | rs8063603 | 6,310,645 | 6.9E-09 | A/G | 0.97 | 0.0053 | 0.65 | [RBFOX1] | |
| 16 | 7.642–7.676 | rs7198928 | 7,666,402 | 1.0E-08 | T/C | 1.03 | 0.0050 | 0.62 | [RBFOX1] | |
| 16 | 13.022–13.119 | rs7200826 | 13,066,833 | 2.4E-08 | T/C | 1.03 | 0.0055 | 0.25 | [SHISA9]; CPPED1, −169089 | |
| 16 | 71.631–72.849 | rs11643192 | 72,214,276 | 3.4E-08 | A/C | 1.03 | 0.0049 | 0.41 | PMFBP1, −7927; DHX38,67465; | |
| 17 | 27.345–28.419 | rs17727765 | 27,576,962 | 8.5E-09 | T/C | 0.95 | 0.0088 | 0.92 | [CRYBA1]; MYO18A, −69555; NUFIP2,5891 | |
| 18 | 36.588–36.976 | rs62099069 | 36,883,737 | 1.3E-08 | A/T | 0.97 | 0.0049 | 0.42 | [MIR924HG] | |
| 18 | 50.358–50.958 | rs11663393 | 50,614,732 | 1.6E-08 | A/G | 1.03 | 0.0049 | 0.45 | O | [DCC]; MIR4528, −148738 |
| 18 | 51.973–52.552 | rs1833288 | 52,517,906 | 2.6E-08 | A/G | 1.03 | 0.0054 | 0.72 | [RAB27B]; CCDC68,50833 | |
| 18 | 52.860–53.268 | rs12958048 | 53,101,598 | 3.6E-11 | A/G | 1.03 | 0.0051 | 0.33 | S | [TCF4]; MIR4529, −44853 |
| 22 | 40.818–42.216 | rs5758265 | 41,617,897 | 7.6E-09 | A/G | 1.03 | 0.0054 | 0.28 | H,S | [L3MBTL2]; EP300-AS1, −24392; CHADL,7616 |
Chr (chromosome) and Region (boundaries in Mb, hg19) are shown, defined by locations of SNPs with P<1×10⁻⁵ and LD r2 > 0.1 with the most associated SNP (logistic regression; lowest P-value in region listed not corrected for multiple testing) whose location is given in bp. In three regions a second SNP fulfils the filtering criteria and these were followed up with conditional analyses: Chr1: conditional analysis selects only rs1432639 as significant, with P=2.0×10⁻⁴ for rs12134600 after fitting rs1432639; Chr5, conditional analysis shows two independent associations selecting rs247910 and rs10514301 as the most associated SNPs; and Chr10 conditional analysis selects only rs61867293 with P=8.6×10⁻⁵ for rs1021363 after conditioning on rs61867293. For each of the 47 SNPs, there is at least 1 additional genome-wide significant SNP in the cluster of surrounding SNPs with low P-values. Chromosome X was analyzed but had no findings that met genome-wide significance.
Column labels and abbreviations. A1/2 = the two alleles (or insertion-deletion); A1 was tested for association, and its OR (odds ratio) and SE (standard error) are shown. FreqU = frequency of A1 in controls across all cohorts. Entries in the “Prev” column indicate which of four previous studies identified genome-significant associations in a region. H=Hyde et al.28, 23andMe GWA of self-reported clinical depression (discovery sample overlaps with this paper); O=Okbay et al.16, meta-analysis of GWA of MDD, depressive symptoms, psychological well-being and neuroticism (includes many PGC29 samples); S=PGC report on 108 schizophrenia-associated loci19; and C=CHARGE consortium meta-analysis of depressive symptoms14. Gene context: distances between the Peak SNP and the closest genes are shown. Brackets indicate that the Peak SNP was within that gene. The closest genes upstream (taking strand into account, as a negative number indicating distance in bp between Peak SNP and the nearest gene boundary) and downstream (positive distance in bp) are also shown, if there is a flanking gene within 200 kb. The name of the closest gene is bolded. Note that it is generally not known whether the associated SNPs have biological effects on these or other more distant genes.
Gene-wise analyses identified 153 significant genes after controlling for multiple comparisons (Supplementary Table 7). Many of these genes were in the extended MHC region (45 of 153) and their interpretation is complicated by high LD and gene density. In addition to the genes discussed above, other notable and significant genes outside of the MHC include multiple potentially “druggable” targets that suggest connections of the pathophysiology of MDD to neuronal calcium signaling (CACNA1E and CACNA2D1), dopaminergic neurotransmission (DRD2, a principal target of antipsychotics), glutamate neurotransmission (GRIK5 and GRM5), and presynaptic vesicle trafficking (PCLO).
Finally, comparison of the major depression loci with 108 loci for schizophrenia19 identified six shared loci. Many SNPs in the extended MHC region are strongly associated with schizophrenia, but implication of the MHC region is novel for major depression. Another example is TCF4 (transcription factor 4) which is strongly associated with schizophrenia but not previously with MDD. TCF4 is essential for normal brain development, and rare mutations in TCF4 cause Pitt–Hopkins syndrome which includes autistic features41. GRS calculated from the schizophrenia GWA results explained 0.8% of the variance in liability of MDD (Fig. 2c).
Implications from integration of functional genomic data
Results from “-omic” studies of functional features of cells and tissues are necessary to understand the biological implications of results of GWA for complex disorders42. To further elucidate the biological relevance of the major depression findings, we integrated the results with a wide range of functional genomic data. First, using enrichment analyses, we compared the major depression GWA findings to bulk tissue mRNA-seq from GTEx43. Only brain samples showed significant enrichment (Fig. 3A), and the three tissues with the most significant enrichments were all cortical. Prefrontal cortex and anterior cingulate cortex are important for higher-level executive functions and emotional regulation which are often impaired in MDD. Both of these regions were implicated in a large meta-analysis of brain MRI findings in adult MDD cases44. Second, given the predominance of neurons in cortex, we confirmed that the major depression genetic findings connect to genes expressed in neurons but not oligodendrocytes or astrocytes (Fig. 3B)45. Given the different methods used by the seven MDD/major depression cohorts in this study, demonstration of enrichment of association signals in the brain regions expected to be most relevant to MDD provides independent support for the validity of our approach.
Fig. 3. Comparisons of the major depression GWA meta-analysis.
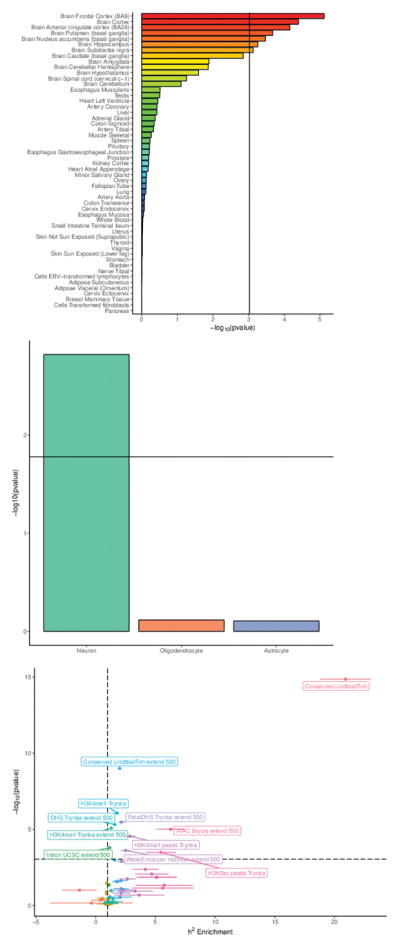
(a) Enrichment in bulk tissue mRNA-seq from GTEx; t-statistic, sample sizes in GTEx range from N=75–564. Threshold for significance accounting for multiple testing shown by vertical line. (b) Major depression results and enrichment in three major brain cell types; t-statistic; threshold for significance accounting for multiple testing shown by horizontal line. Sample sizes vary as these data are aggregated from many different sources. (c) Partitioned LDSC to evaluate enrichment of the major depression GWA findings in over 50 functional genomic annotations (Supplementary Table 8); enrichment statistic; threshold for significance accounting for multiple testing given by horizontal dashed line. Sample sizes vary as these data are aggregated from many different sources.
Third, we used partitioned LD score regression46 to evaluate the enrichment of the major depression GWA findings in over 50 functional genomic annotations (Fig. 3C and Supplementary Table 8). The major finding was the significant enrichment of in genomic regions conserved across 29 Eutherian mammals47 (20.9 fold enrichment, P=1.4×10⁻¹⁵). This annotation was also the most enriched for schizophrenia46. We could not evaluate regions conserved in primates or human “accelerated” regions as there were too few for confident evaluation47. The other enrichments implied regulatory activity, and included open chromatin in human brain and an epigenetic mark of active enhancers (H3K4me1). Notably, exonic regions did not show enrichment suggesting that, as with schizophrenia17, genetic variants that change exonic sequences may not play a large role in major depression. We found no evidence that Neanderthal introgressed regions were enriched for major depression GWA findings48.
Fourth, we applied methods to integrate GWA SNP results with those from gene expression and methylation quantitative trait loci studies (eQTL and mQTL). SMR49 analysis identified 13 major depression associated SNPs with strong evidence that they control local gene expression in one or more tissues, and nine with strong evidence that they control local DNA methylation (Supplementary Table 9 and Supplementary Data 2). A transcriptome-wide association study50 applied to data from the dorsolateral prefrontal cortex51 identified 17 genes where major depression-associated SNPs influenced gene expression (Supplementary Table 10). These genes included OLFM4 (discussed above).
Fifth, we added additional data types to attempt to improve understanding of individual loci. For the intergenic associations, we evaluated total-stranded RNA-seq data from human brain and found no evidence for unannotated transcripts in these regions. A particularly important data type is assessment of DNA-DNA interactions which can localize a GWA finding to a specific gene that may be nearby or hundreds of kb away52–54. We integrated the major depression results with “easy Hi-C” data from brain cortical samples (3 adult, 3 fetal, > 1 billion reads each). These data clarified three associations. The statistically independent associations in NEGR1 (rs1432639, P=4.6×10⁻¹⁵) and over 200 kb away (rs12129573, P=4.0×10⁻¹²) both implicate NEGR1 (Supplementary Fig. 3a), the former likely due to the presence of a reportedly functional copy number polymorphism (see Supplementary Note) and the presence of intergenic loops. The latter association has evidence of DNA looping interactions with NEGR1. The association in SOX5 (rs4074723) and the two statistically independent associations in RBFOX1 (rs8063603 and rs7198928, P=6.9×10⁻⁹ and 1.0×10⁻⁸) had only intragenic associations, suggesting that the genetic variation in the regions of the major depression associations act locally and can be assigned to these genes. In contrast, the association in RERE (rs159963 P=3.2×10⁻⁸) could not be assigned to RERE as it may contain super-enhancer elements given its many DNA-DNA interactions with many nearby genes (Supplementary Fig. 3b).
Implications based on the roles of sets of genes
A parsimonious explanation for the presence of many significant associations for a complex trait is that the different associations are part of a higher order grouping of genes55. These could be a biological pathway or a collection of genes with a functional connection. Multiple methods allow evaluation of the connection of major depression GWA results to sets of genes grouped by empirical or predicted function (i.e., pathway or gene set analysis).
Full pathway analyses are in Supplementary Table 11, and 19 pathways with false discovery rate q-values < 0.05 are summarized in Fig. 4. The major groupings of significant pathways were: RBFOX1, RBFOX2, RBFOX3, or CELF4 regulatory networks; genes whose mRNAs are bound by FMRP; synaptic genes; genes involved in neuronal morphogenesis; genes involved in neuron projection; genes associated with schizophrenia (at P<10−4)19; genes involved in CNS neuron differentiation; genes encoding voltage-gated calcium channels; genes involved in cytokine and immune response; and genes known to bind to the retinoid X receptor. Several of these pathways are implicated by GWA of schizophrenia and by rare exonic variation of schizophrenia and autism56,57, and immediately suggest shared biological mechanisms across these disorders.
Fig. 4.

Generative topographic mapping of the 19 significant pathway results. The average position of each pathway on the map is represented by a point. The map is colored by the –log10(P) obtained using MAGMA. The X and Y coordinates result from a kernel generative topographic mapping algorithm (GTM) that reduces high dimensional gene sets to a two-dimensional scatterplot by accounting for gene overlap between gene sets. Each point represents a gene set. Nearby points are more similar in gene overlap than more distant points. The color surrounding each point (gene set) indicates significance per the scale on the right. The significant pathways (Supplementary Table 11) fall into nine main clusters as described in the text.
A key issue for common variant GWA studies is their relevance for pharmacotherapy. We conducted gene set analysis that compared the major depression GWA results to targets of antidepressant medications defined by pharmacological studies58, and found that 42 sets of genes encoding proteins bound by antidepressant medications were highly enriched for smaller major depression association P-values than expected by chance (42 drugs, rank enrichment test P=8.5×10⁻¹⁰). This finding connects our major depression genomic findings to MDD therapeutics, and suggests the salience of these results for novel lead compound discovery for MDD59.
Implications based on relationships with other traits
Prior epidemiological studies associated MDD with many other diseases and traits. Due to limitations inherent to observational studies, understanding whether a phenotypic correlation is potentially causal or if it results from reverse causation or confounding is generally difficult. Genetic studies now offer complementary strategies to assess whether a phenotypic association between MDD and a risk factor or a comorbidity is mirrored by a non-zero rg (common variant genetic correlation) and, for some of these, evaluate the potential causality of the association given that exposure to genetic risk factors begins at conception.
We used LD score regression to estimate rg of major depression with 221 psychiatric disorders, medical diseases, and human traits22,60. Supplementary Table 12 contains the full results, and Table 3 holds the rg values with false discovery rates < 0.01. First, the rg were very high between our major depression GWA results and those from two studies of current depressive symptoms. Both correlations were close to +1 (the samples in one report overlapped partially with this meta-analysis16 but the other did not 14).
Table 3.
LDSC genetic correlations of MDD with other disorders, diseases, and human traits
| Trait | rg | SE | FDR |
|
PMID | |
|---|---|---|---|---|---|---|
| Depressive symptoms, CHARGE | 0.91 | 0.123 | 3.2E-12 | 0.04 | 23290196 | |
| Depressive symptoms, SSGAC | 0.98 | 0.034 | 1.3E-176 | 0.05 | 27089181 | |
| ADHD (iPSYCH-PGC) | 0.42 | 0.033 | 6.1E-36 | 0.24 | submitted | |
| Anorexia nervosa | 0.13 | 0.028 | 7.1E-05 | 0.55 | 24514567 | |
| Anxiety disorders | 0.80 | 0.140 | 2.0E-07 | 0.06 | 26857599 | |
| Autism spectrum disorders (iPSYCH-PGC) | 0.44 | 0.039 | 8.4E-28 | 0.20 | submitted | |
| Bipolar disorder | 0.32 | 0.034 | 3.3E-19 | 0.43 | 21926972 | |
| Schizophrenia | 0.34 | 0.025 | 7.7E-40 | 0.46 | 25056061 | |
| Smoking, ever vs never | 0.29 | 0.038 | 7.0E-13 | 0.08 | 20418890 | |
| Daytime sleepiness‡ | 0.19 | 0.048 | 5.7E-04 | 0.05 | 0 | |
| Insomnia‡ | 0.38 | 0.038 | 4.0E-22 | 0.13 | 0 | |
| Tiredness | 0.67 | 0.037 | 6.2E-72 | 0.07 | 28194004 | |
| Subjective well-being | −0.65 | 0.035 | 7.5E-76 | 0.03 | 27089181 | |
| Neuroticism | 0.70 | 0.031 | 2.5E-107 | 0.09 | 27089181 | |
| College completion | −0.17 | 0.034 | 6.7E-06 | 0.08 | 23722424 | |
| Years of education | −0.13 | 0.021 | 1.6E-08 | 0.13 | 27225129 | |
| Body fat | 0.15 | 0.038 | 6.5E-04 | 0.11 | 26833246 | |
| Body mass index | 0.09 | 0.026 | 3.6E-03 | 0.19 | 20935630 | |
| Obesity class 1 | 0.11 | 0.029 | 1.6E-03 | 0.22 | 23563607 | |
| Obesity class 2 | 0.12 | 0.033 | 3.0E-03 | 0.18 | 23563607 | |
| Obesity class 3 | 0.20 | 0.053 | 1.6E-03 | 0.12 | 23563607 | |
| Overweight | 0.13 | 0.030 | 1.4E-04 | 0.11 | 23563607 | |
| Waist circumference | 0.11 | 0.024 | 8.2E-05 | 0.12 | 25673412 | |
| Waist-to-hip ratio | 0.12 | 0.030 | 2.9E-04 | 0.11 | 25673412 | |
| Triglycerides | 0.14 | 0.028 | 1.0E-05 | 0.17 | 20686565 | |
| Age at menarche | −0.14 | 0.023 | 6.3E-08 | 0.20 | 25231870 | |
| Age of first birth | −0.29 | 0.029 | 6.1E-22 | 0.06 | 27798627 | |
| Fathers age at death | −0.28 | 0.058 | 3.0E-05 | 0.04 | 27015805 | |
| Number of children ever born | 0.13 | 0.036 | 2.4E-03 | 0.03 | 27798627 | |
| Coronary artery disease | 0.12 | 0.027 | 8.2E-05 | 0.08 | 26343387 | |
| Squamous cell lung cancer | 0.26 | 0.075 | 3.6E-03 | 0.04 | 27488534 |
All genetic correlations (rg) estimated using bivariate LDSC applied to major depression GWA results are in Supplementary Table 12. Shown above are the rg of major depression with false discovery rate (FDR) < 0.01 (FDR estimated for 221 genetic correlations, H0: rg =0). Thematically related traits are indicated by shading. iPSYCH is a nationally representative cohort based on blood spots collected at birth. Within iPSYCH, rg with ADHD was 0.58 (SE 0.050) and 0.51 (SE 0.07) with ASD – these are larger than those listed above, and inconsistent with artefactual correlations. is shown to aid interpretation as high rg in the context of high is more noteworthy than when is low. PMID is PubMed article identifier.
Self-reported daytime sleepiness and insomnia from UK Biobank excluding subjects with major depression, other psychiatric disorders (bipolar disorder, schizophrenia, autism, intellectual disability), shift workers, and those taking hypnotics.
Second, we found significant positive genetic correlations between major depression and every psychiatric disorder assessed along with smoking initiation. This is the most comprehensive and best-powered evaluation of the relation of MDD with other psychiatric disorders yet published, and these results indicate that the common genetic variants that predispose to MDD overlap substantially with those for adult and childhood onset psychiatric disorders, although they remain substantially distinct as well.
Third, the common-variant genetic architecture of major depression was positively correlated with multiple measures of sleep quality (daytime sleepiness, insomnia, and tiredness). The first two of these correlations used UK Biobank data with people endorsing major depression, other major psychiatric disorders, shift workers, and those taking hypnotics excluded. This pattern of correlations combined with the importance of sleep and fatigue in major depression (two criteria for MDD) suggests a close and potentially profound mechanistic relation. Major depression also had a strong genetic correlation with neuroticism (a personality dimension assessing the degree of emotional instability); this is consistent with the literature showing a close interconnection of MDD and this personality trait. The strong negative rg with subjective well-being underscores the capacity of major depression to impact human health.
Finally, major depression had significant negative genetic correlations with data from two studies of educational attainment, which while often considered at the genetic level as proxy measures of intelligence also likely includes more complex personality constructs. With this in mind, it is relevant to note that the rg between major depression and IQ61 was not significantly different from zero, despite an the rg between years of education and IQ of 0.7, implying complex relationships between these traits worthy of future investigation. We also found significant positive correlations with multiple measures of adiposity, relationship to female reproductive behavior (decreased age at menarche, age at first birth, and increased number of children), and positive correlations with coronary artery disease and lung cancer.
We used bi-directional Mendelian randomization (MR) to investigate the relationships between four traits genetically correlated with major depression: years of education (EDY)62, body mass index (BMI)29, coronary artery disease (CAD)63, and schizophrenia19. These traits were selected because all of the following were true: phenotypically associated with MDD, significant rg with MDD, and >30 independent genome-wide significant associations from large GWA. We report GSMR64 results but obtained qualitatively similar results with other MR methods (Supplementary Table 13 and Supplementary Fig. 4). MR analyses provided evidence for a 1.12-fold increase in major depression per standard deviation of BMI (PGSMR=1.2×10⁻⁷) and a 0.84-fold decrease in major depression per standard deviation of EDY (PGSMR=2.3×10⁻⁶). There was no evidence of reverse causality of major depression for BMI (PGSMR=0.53) or EDY (PGSMR=0.11). For BMI there was some evidence of pleiotropy, as six BMI SNPs were excluded by the HEIDI-outlier test including SNPs near OLFM4 and NEGR1. Thus, these results are consistent with EDY and BMI as either causal risk factors or correlated with causal risk factors for major depression. These results provide hypotheses for future research to understand these potentially directional relationships.
For CAD, the MR analyses were not significant when considering major depression as an outcome (PGSMR=0.30) or as an exposure (PGSMR=0.12), however, the high standard error of the estimates using MDD SNP instruments implies this analysis should be revisited when more major depression genome-wide significant SNP instruments become available from future GWA studies.
We used MR to investigate the relationship between major depression and schizophrenia. Although major depression had positive rg with many psychiatric disorders, only schizophrenia has sufficient associations for MR analyses. We found significant bi-directional correlations in SNP effect sizes for schizophrenia loci in major depression (PGSMR=1.1×10−40) and for major depression loci in schizophrenia (PGSMR=1.5×10⁻¹¹). These results suggest that the major depression-schizophrenia rg of 0.34 is consistent with partially shared biological pathways being causal for both disorders. Although it is plausible that diagnostic misclassification/ambiguity (e.g., misdiagnosis of MDD as schizoaffective disorder) could contaminate these analyses, levels of misclassification would need to be implausibly high (30% unidirectional, 15% bidirectional) to result in an rg of ~0.3REF65.
All MR analyses were repeated after excluding the 23andMeD cohort, and the pattern of results was the same (Supplementary Table 13).
DISCUSSION
The nature of severe depression has been discussed for millennia66. This GWA meta-analysis is among the largest ever conducted in psychiatric genetics, and provides a body of results that help refine and define the fundamental basis of major depression.
In conducting this meta-analysis of major depression, we employed a pragmatic approach by including cohorts that met empirical criteria for sufficient genetic and phenotypic similarity. Our approach was cautious, clinically informed, guided by empirical data, and selective (e.g., we did not include cohorts with bipolar disorder (which requires MDD), depressive symptoms, neuroticism, or well-being). Approximately 44% of all major depression cases were assessed using traditional methods (PGC29, GenScot), treatment registers (iPSYCH, GERA; such approaches have been extensively used to elucidate the epidemiology of major depression), or a combination of methods (deCODE, UK Biobank) whereas ~56% of cases were from 23andMeD (via self-report)28. Multiple lines of genetic evidence supported conducting meta-analysis of these seven cohorts (e.g., out-of-sample prediction, sign tests, and genetic correlations).
However, our approach may be controversial to some readers given the unconventional reliance on self-report of major depression. We would reframe the issue: we hypothesize that brief methods of assessing major depression are informative for the genetics of MDD. We present a body of results that are consistent with this hypothesis. Even if unconventional, our hypothesis is testable and falsifiable, and we invite and welcome empirical studies to further support or refute this hypothesis.
Our results lead us to draw some broad conclusions. First, major depression is a brain disorder. Although this is not unexpected, some past models of MDD have had little or no place for heredity or biology. The genetic results best match gene expression patterns in prefrontal and anterior cingulate cortex, anatomical regions that show differences between MDD cases and controls. The genetic findings implicated neurons (not microglia or astrocytes), and we anticipate more detailed cellular localization when sufficient single-cell and single-nuclei RNA-seq datasets become available67.
Second, the genetic associations for major depression (as with schizophrenia)46 tend to occur in genomic regions conserved across a range of placental mammals. Conservation suggests important functional roles. Notably, our analyses did not implicate exons or coding regions.
Third, the results also implicated developmental gene regulatory processes. For instance, the genetic findings pointed at the splicing regulator RBFOX1 (the presence of two independent genetic associations in RBFOX1 strongly suggests that it is the relevant gene). Gene set analyses implicated genes containing binding sites to the protein product of RBFOX1, and this gene set is also significantly enriched for rare exonic variation in autism and schizophrenia56,57. These analyses highlight the potential importance of splicing to generate alternative isoforms; risk for major depression may be mediated not by changes in isolated amino acids but rather by changes in the proportions of isoforms coming from a gene, given that isoforms often have markedly different biological functions68,69. These convergent results provide possible clues of a biological mechanism common to multiple severe psychiatric disorders that merits future research.
Fourth, in the most extensive analysis of the genetic “connections” of major depression with a wide range of disorders, diseases, and human traits, we found significant positive genetic correlations with measures of body mass and negative genetic correlations with years of education, while showing no evidence of genetic correlation with IQ. MR analysis results are consistent with both BMI and years of education being causal, or correlated with causal, risk factors for major depression, and our results provide hypotheses and motivation for more detailed prospective studies, as currently available data may not provide insight about the fundamental driver or drivers of causality. The underlying mechanisms are likely more complex as it is difficult to envision how genetic variation in educational attainment or body mass alters risk for MDD without invoking an additional mechanistic component. While the significant MR analyses need further investigations to fully understand, the negative MR results provide important evidence that there is not a direct causal relationship between MDD and subsequent changes in body mass or education years. If such associations are observed in epidemiological or clinical samples, then it is likely not MDD but something correlated with MDD that drives the association.
Fifth, we found significant positive correlations of major depression with all psychiatric disorders that we evaluated, including disorders prominent in childhood. This pattern of results indicates that the current classification scheme for major psychiatric disorders does not align well with the underlying genetic basis of these disorders. Currently, only schizophrenia has a sufficient number of genome-wide significant loci to conduct MR analysis, but the bidirectionally significant MR results are consistent a shared biological basis for major depression and schizophrenia.
The dominant psychiatric nosological systems were principally designed for clinical utility, and are based on data that emerge during human interactions (i.e., observable signs and reported symptoms) and not objective measurements of pathophysiology. MDD is frequently comorbid with other psychiatric disorders, and the phenotypic comorbidity has an underlying structure that reflects shared origins (as inferred from factor analyses and twin studies)70–73. Our genetic results add to this knowledge: major depression is not a discrete entity at any level of analysis. Rather, our data strongly suggest the existence of biological processes common to major depression and schizophrenia (and likely, other psychiatric disorders).
Finally, as expected, we found that major depression had modest (8.7%) as it is a complex malady with both genetic and environmental determinants. We found that major depression has a very high genetic correlation with proxy measures that can be briefly assessed. Lifetime major depressive disorder requires a constellation of signs and symptoms whose reliable scoring requires an extended interview with a trained clinician. However, the common variant genetic architecture of lifetime major depression in these seven cohorts (containing many subjects medically treated for MDD) has strong overlap with that of current depressive symptoms in general community samples. Similar relations of clinically-defined ADHD or autism with quantitative genetic variation in the population have been reported74,75. The “disorder versus symptom” relationship has been debated extensively76, but our data indicate that the common variant genetic overlap is very high. This finding has important implications.
One implication is for future genetic studies. In a first phase, it should be possible to elucidate the bulk of the common variant genetic architecture of MDD using a cost-effective shortcut – large studies of genotyped individuals who complete online self-report assessments of lifetime MDD (a sample size approaching 1 million MDD cases may be achievable by 2020). Use of online assessment could allow for recording of a broad range of phenotypes including comorbidities and putative environmental exposures, but the key feature being large samples with consistently assessed measures. In a second phase, with a relatively complete understanding of the genetic basis of major depression, one could then evaluate smaller samples of carefully phenotyped individuals with MDD to understand the clinical importance of the genetic results. Subsequent empirical studies may show that it is possible to stratify MDD cases at first presentation to identify individuals at high risk for recurrence, poor outcome, poor treatment response, or who might subsequently develop a psychiatric disorder requiring alternative pharmacotherapy (e.g., schizophrenia or bipolar disorder). This could form a cornerstone of precision medicine in psychiatry.
In summary, this GWA meta-analysis of 135,438 MDD and major depression cases and 344,901 controls identified 44 loci. An extensive set of companion analyses provide insights into the nature of MDD as well as its neurobiology, therapeutic relevance, and genetic and biological interconnections to other psychiatric disorders. Comprehensive elucidation of these features is the primary goal of our genetic studies of MDD.
ONLINE METHODS
PGC29 cohort
Our analysis was anchored in a GWA mega-analysis of 29 samples of European-ancestry (16,823 MDD cases and 25,632 controls). Supplementary Table 1 summarizes the source and inclusion/exclusion criteria for cases and controls for each sample. All PGC29 samples passed a structured methodological review by MDD assessment experts (DF Levinson and KS Kendler). Cases were required to meet international consensus criteria (DSM-IV, ICD-9, or ICD-10)83–85 for a lifetime diagnosis of MDD established using structured diagnostic instruments from assessments by trained interviewers, clinician-administered checklists, or medical record review. All cases met standard criteria for MDD, were directly interviewed (28/29 samples) or had medical record review by an expert diagnostician (1/29 samples), and most were ascertained from clinical sources (19/29 samples). Controls in most samples were screened for the absence of lifetime MDD (22/29 samples), and randomly selected from the population.
Additional cohorts
We critically evaluated six independent, European-ancestry cohorts (118,635 cases and 319,269 controls). Supplementary Table 2 summarizes the source and inclusion/exclusion criteria for cases and controls for each cohort. These cohorts used a range of methods for assessing MDD or major depression. Most studies included here applied otherwise typical inclusion and exclusion criteria for both cases and controls (e.g., excluding cases with lifetime bipolar disorder or schizophrenia and excluding controls with major depression).
Cohort comparability
Supplementary Table 3 summarizes the numbers of cases and controls in PGC29 and the six additional cohorts. The most direct and important way to evaluate the comparability of these cohorts for a GWA meta-analysis is using SNP genotype data. 22,24 We used LD score (LDSC) regression (described below) to estimate for each cohort (Supplementary Table 3 and Supplementary Fig. 1), and rg for all pairwise combinations of the cohorts (Supplementary Table 3b), and to demonstrate no evidence of sample overlap. We used leave-one-sample-out genetic risk scores (GRS) finding significant differences in case-control GRS distributions of the left-out-sample for all-but-one PGC29 samples (Supplementary Table 4). For full details of the cohort comparability analyses including GRS analyses see the Supplementary Note. In GRS analyses the discovery sample is the GWA sample that provides the allelic-weightings for each SNP used to generate a sum score for each individual in the independent target sample.
Genotyping and quality control
Genotyping procedures can be found in the primary reports for each cohort (summarized in Supplementary Table 3). Individual genotype data for all PGC29 samples, GERA, and iPSYCH were processed using the PGC “ricopili” pipeline (URLs) for standardized quality control, imputation, and analysis19. The cohorts from deCODE, Generation Scotland, UK Biobank, and 23andMeD were processed by the collaborating research teams using comparable procedures. SNPs and insertion-deletion polymorphisms were imputed using the 1000 Genomes Project multi-ancestry reference panel (URLs)86. More detailed information on sample QC is provided in the Supplementary Note.
Linkage disequilibrium (LD) score regression (LDSC)22,24 was used to estimate from GWA summary statistics. Estimates of on the liability scale depend on the assumed lifetime prevalence of MDD in the population (K), and we assumed K=0.15 but also evaluated a range of estimates of K to explore sensitivity including 95% confidence intervals (Supplementary Fig. 1). LDSC bivariate genetic correlations attributable to genome-wide SNPs (rg) were estimated across all MDD and major depression cohorts and between the full meta-analyzed cohort and other traits and disorders.
LDSC was also used to partition by genomic features24,46. We tested for enrichment of based on genomic annotations partitioning proportional to bp length represented by each annotation. We used the “baseline model” which consists of 53 functional categories. The categories are fully described elsewhere46, and included conserved regions47, USCC gene models (exons, introns, promoters, UTRs), and functional genomic annotations constructed using data from ENCODE 87 and the Roadmap Epigenomics Consortium88. We complemented these annotations by adding introgressed regions from the Neanderthal genome in European populations89 and open chromatin regions from the brain dorsolateral prefrontal cortex. The open chromatin regions were obtained from an ATAC-seq experiment performed in 288 samples (N=135 controls, N=137 schizophrenia, N=10 bipolar, and N=6 affective disorder)90. Peaks called with MACS91 (1% FDR) were retained if their coordinates overlapped in at least two samples. The peaks were re-centered and set to a fixed width of 300bp using the diffbind R package92. To prevent upward bias in heritability enrichment estimation, we added two categories created by expanding both the Neanderthal introgressed regions and open chromatin regions by 250bp on each side.
We used LDSC to estimate rg between major depression and a range of other disorders, diseases, and human traits22. The intent of these comparisons was to evaluate the extent of shared common variant genetic architectures in order to suggest hypotheses about the fundamental genetic basis of major depression (given its extensive comorbidity with psychiatric and medical conditions and its association with anthropometric and other risk factors). Subject overlap of itself does not bias rg. These rg are mostly based on studies of independent subjects and the estimates should be unbiased by confounding of genetic and non-genetic effects (except if there is genotype by environment correlation). When GWA studies include overlapping samples, rg remains unbiased but the intercept of the LDSC regression is an estimate of the correlation between association statistics attributable to sample overlap. These calculations were done using the internal PGC GWA library and with LD-Hub (URLs)60.
Integration of GWA findings to tissue and cellular gene expression
We used partitioned LDSC to evaluate which somatic tissues were enriched for major depression heritability93. Gene expression data generated using mRNA-seq from multiple human tissues were obtained from GTEx v6p (URLs). Genes for which <4 samples had at least one read count per million were discarded, and samples with <100 genes with at least one read count per million were excluded. The data were normalized, and a t-statistic was obtained for each tissue by comparing the expression in each tissue with the expression of all other tissues with the exception of tissues related to the tissue of interest (e.g., brain cortex vs all other tissues excluding other brain samples), using sex and age as covariates. A t-statistic was also obtained for each tissue among its related tissue (ex: cortex vs all other brain tissues) to test which brain region was the most associated with major depression, also using sex and age as covariates. The top 10% of the genes with the most extreme t-statistic were defined as tissue specific. The coordinates for these genes were extended by a 100kb window and tested using LD score regression. Significance was obtained from the coefficient z-score, which corrects for all other categories in the baseline model.
Lists of genes specifically expressed in neurons, astrocytes, and oligodendrocytes were obtained from Cahoy et al.45 As these experiment were done in mice, genes were mapped to human orthologous genes using ENSEMBL. The coordinates for these genes were extended by a 100kb window and tested using LD score regression as for the GTEx tissue specific genes.
We conducted eQTL look-ups of the most associated SNPs in each region and report GWA SNPs in LD (r2 > 0.8) with the top eQTLs in the following data sets: eQTLGen Consortium (lllumina arrays in whole blood N=14,115, in preparation), BIOS (RNA-seq in whole blood (N=2,116),94 NESDA/NTR (Affymetrix arrays in whole blood, N=4,896),95 GEUVADIS (RNA-seq in LCL (N=465),96 Rosmap (RNA seq in cortex, N= 494)97, GTEx (RNA-seq in 44 tissues, N>70)43, and Common Mind Consortium (CMC, prefrontal cortex, Sage Synapse accession syn5650509, N=467)51.
We used summary-data-based Mendelian randomization (SMR)49 to identify loci with strong evidence of causality via gene expression and DNA methylation (eQTL and meQTL). SMR analysis is limited to significant cis SNP-expression (FDR < 0.05) and SNPs with MAF > 0.01 at a Bonferroni-corrected pSMR. Due to LD, multiple SNPs may be associated with the expression of a gene, and some SNPs are associated with the expression of more than one gene. Since the aim of SMR is to prioritize variants and genes for subsequent studies, a test for heterogeneity excludes regions that may harbor multiple causal loci (pHET < 0.05; a very conservative threshold). SMR analyses were conducted using eQTLs from eQTLGen Consortium (whole blood), GTEx (11 brain tissues), and Common Mind Consortium43,51 as well as meQTLs from whole blood98.
We conducted a transcriptome wide association study50 using pre-computed expression reference weights for CMC data (5,420 genes with significant cis-SNP heritability) provided with the TWAS/FUSION software. The significance threshold was 0.05/5420.
DNA looping using Hi-C
Dorsolateral prefrontal cortex (Brodmann area 9) was dissected from postmortem samples from three adults of European ancestry (Dr Craig Stockmeier, University of Mississippi Medical Center). Cerebra from three fetal brains were obtained from the NIH NeuroBiobank (URLs; gestation age 17–19 weeks, African ancestry). We used “easy Hi-C” to assess DNA chromatin (looping) interactions (see Supplementary Note).
Gene-wise and pathway analysis
Our approach was guided by rigorous method comparisons conducted by PGC members55,99. P-values quantifying the degree of association of genes and gene sets with MDD were generated using MAGMA (v1.06)100. MAGMA uses Brown’s method to combine SNP p-values and account for LD. We used ENSEMBL gene models for 19,079 genes giving a Bonferroni corrected P-value threshold of 2.6×10⁻⁶. Gene set P-values were obtained using a competitive analysis that tests whether genes in a gene set are more strongly associated with the phenotype than other gene sets. We used European-ancestry subjects from 1,000 Genomes Project (Phase 3 v5a, MAF ≥ 0.01)101 for the LD reference. The gene window used was 35 kb upstream and 10 kb downstream to include regulatory elements.
Gene sets were from two main sources. First, we included gene sets previously shown to be important for psychiatric disorders (71 gene sets; e.g., FMRP binding partners, de novo mutations, GWAS top SNPs, ion channels)57,102,103. Second, we included gene sets from MSigDB (v5.2)104 which includes canonical pathways and Gene Ontology gene sets. Canonical pathways were curated from BioCarta, KEGG, Matrisome, Pathway Interaction Database, Reactome, SigmaAldrich, Signaling Gateway, Signal Transduction KE, and SuperArray. Pathways containing between 10-10K genes were included.
To evaluate gene sets related to antidepressants, gene-sets were extracted from the Drug-Gene Interaction database (DGIdb v.2.0)105 and the Psychoactive Drug Screening Program Ki DB106 downloaded in June 2016. The association of 3,885 drug gene-sets with major depression was estimated using MAGMA (v1.6). The drug gene-sets were ordered by p-value, and the Wilcoxon-Mann-Whitney test was used to assess whether the 42 antidepressant gene-sets in the dataset (ATC code N06A in the Anatomical Therapeutic Chemical Classification System) had a higher ranking than expected by chance.
One issue is that some gene sets contain overlapping genes, and these may reflect largely overlapping results. The pathway map was constructed using the kernel generative topographic mapping algorithm (k-GTM) as described by Olier et al.107 GTM is a probabilistic alternative to Kohonen maps: the kernel variant is used when the input is a similarity matrix. The GTM and k-GTM algorithms are implemented in GTMapTool (URLs). We used the Jaccard similarity matrix of FDR-significant pathways as input for the algorithm, where each pathway is encoded by a vector of binary values representing the presence (1) or absence (0) of a gene. Parameters for the k-GTM algorithm are the square root of the number of grid points (k), the square root of the number of RBF functions (m), the regularization coefficient (l), the RBF width factor (w), and the number of feature space dimensions for the kernel algorithm (b). We set k=square root of the number of pathways, m=square root of k, l=1 (default), w=1 (default), and b=the number of principal components explaining 99.5% of the variance in the kernel matrix. The output of the program is a set of coordinates representing the average positions of pathways on a 2D map. The x and y axes represent the dimensions of a 2D latent space. The pathway coordinates and corresponding MAGMA P-values were used to build the pathway activity landscape using the kriging interpolation algorithm implemented in the R gstat package.
Mendelian randomization (MR)108
We conducted bi-directional MR analysis for four traits: years of education (EDY)62, body mass index (BMI)29, coronary artery disease (CAD)63, and schizophrenia (SCZ)19. We denote z as a genetic variant (i.e., a SNP) that is significantly associated with x, an exposure or putative causal trait for y (the disease/trait outcome). The effect size of x on y can be estimated using a two-step least squares (2SLS)109 approach: b̂xy = b̂zy / b̂zx, where b̂zx is the estimated effect size for the SNP-trait association the exposure trait, and b̂zy is the effect size estimated for the same SNP in the GWAS of the outcome trait.
We used generalized summary statistics-based MR (GSMR)64 to estimate b̂xy and its standard error from multiple SNPs associated with the exposure trait at a genome-wide significance level. We conducted bi-directional GSMR analyses for each pair of traits, and report results after excluding SNPs that fail the HEIDI-outlier heterogeneity test (which is more conservative than excluding SNPs that have an outlying association likely driven by locus-specific pleiotropy). GSMR is more powerful than inverse-weighted MR (IVW-MR) and MR-Egger because it takes account of the sampling variation of both b̂zx and b̂zy. GSMR also accounts for residual LD between the clumped SNPs. For comparison, we also conducted IVW-MR and MR-Egger analyses. 110 More details are provided in the Supplementary Note.
Genome build
All genomic coordinates are given in NCBI Build 37/UCSC hg19.
Data availability
The PGC’s policy is to make genome-wide summary results public. Summary statistics for a combined meta-analysis of PGC29 with five of the six expanded samples (deCODE, Generation Scotland, GERA, iPSYCH, and UK Biobank) are available on the PGC web site (URLs). Results for 10,000 SNPs for all seven cohorts are also available on the PGC web site.
GWA summary statistics for the Hyde et al. cohort (23andMe, Inc.) must be obtained separately. These can be obtained by qualified researchers under an agreement with 23andMe that protects the privacy of the 23andMe participants. Contact David Hinds (dhinds@23andme.com) to apply for access to the data. Researchers who have the 23andMe summary statistics can readily recreate our results by meta-analyzing the six cohort results file with the Hyde et al. results file from 23andMe.28
Availability of genotype data for PGC29 is described in Supplementary Table 15. For the expanded cohorts, interested users should contact the lead PIs of these cohorts (which are separate from the PGC).
Supplementary Material
Acknowledgments
Full acknowledgments are in the Supplementary note. We are deeply indebted to the investigators who comprise the PGC, and to the hundreds of thousands of subjects who have shared their life experiences with PGC investigators. A full list of funding is in the Supplementary Note. Major funding for the PGC is from the US National Institutes of Health (U01 MH109528 and U01 MH109532). Statistical analyses were carried out on the NL Genetic Cluster Computer (http://www.geneticcluster.org) hosted by SURFsara. The iPSYCH team acknowledges funding from The Lundbeck Foundation (grant no R102-A9118 and R155-2014-1724), the Stanley Medical Research Institute, the European Research Council (project no: 294838), the Novo Nordisk Foundation for supporting the Danish National Biobank resource, and grants from Aarhus and Copenhagen Universities and University Hospitals, including support to the iSEQ Center, the GenomeDK HPC facility, and the CIRRAU Center. UK Biobank: this research has been conducted using the UK Biobank Resource (URLs), including applications #4844 and #6818. Finally, we thank the members of the eQTLGen Consortium for allowing us to use their very large eQTL database ahead of publication. Its members are listed in Supplementary Table 14.
Some data used in this study were obtained from dbGaP (URLs). dbGaP accession phs000021: Funding support for the Genome-Wide Association of Schizophrenia Study was provided by the National Institute of Mental Health (R01 MH67257, R01 MH59588, R01 MH59571, R01 MH59565, R01 MH59587, R01 MH60870, R01 MH59566, R01 MH59586, R01 MH61675, R01 MH60879, R01 MH81800, U01 MH46276, U01 MH46289 U01 MH46318, U01 MH79469, and U01 MH79470) and the genotyping of samples was provided through the Genetic Association Information Network (GAIN). Samples and associated phenotype data for the Genome-Wide Association of Schizophrenia Study were provided by the Molecular Genetics of Schizophrenia Collaboration (PI: Pablo V. Gejman, Evanston Northwestern Healthcare (ENH) and Northwestern University, Evanston, IL, USA). dbGaP accession phs000196: this work utilized in part data from the NINDS dbGaP database from the CIDR:NGRC PARKINSON’S DISEASE STUDY. dbGaP accession phs000187: High Density SNP Association Analysis of Melanoma: Case-Control and Outcomes Investigation. Research support to collect data and develop an application to support this project was provided by P50 CA093459, P50 CA097007, R01 ES011740, and R01 CA133996.
URLs
1000 Genomes Project multi-ancestry imputation panel, https://mathgen.stats.ox.ac.uk/impute/data_download_1000G_phase1_integrated.html
23andMe privacy policy https://www.23andme.com/en-eu/about/privacy
Bedtools, https://bedtools.readthedocs.io
dbGaP, https://www.ncbi.nlm.nih.gov/gap
Genotype-based checksums for relatedness determination, http://www.broadinstitute.org/~sripke/share_links/checksums_download
GSMR, http://cnsgenomics.com/software/gsmr/
GTEx, http://www.gtexportal.org/home/datasets
GTMapTool, http://infochim.u-strasbg.fr/mobyle-cgi/portal.py#forms::gtmaptool
LD-Hub, http://ldsc.broadinstitute.org
PGC website, http://www.med.unc.edu/pgc
NIH NeuroBiobank, https://neurobiobank.nih.gov
PGC “ricopili” GWA pipeline, https://github.com/Nealelab/ricopili
SMR, http://cnsgenomics.com/software/smr/#Overview
TWAS, http://gusevlab.org/projects/fusion/
UK Biobank, http://www.ukbiobank.ac.uk
AUTHOR CONTRIBUTIONS
Writing group: G. Breen, A. D. Børglum, D. F. Levinson, C. M. Lewis, S. Ripke, P. F. Sullivan, N. R. Wray.
PGC MDD PI group: V. Arolt, B. T. Baune, K. Berger, D. I. Boomsma, G. Breen, A. D. Børglum, S. Cichon, U. Dannlowski, J. R. DePaulo, E. Domenici, K. Domschke, T. Esko, E. d. Geus, H. J. Grabe, S. P. Hamilton, C. Hayward, A. C. Heath, D. M. Hougaard, K. S. Kendler, S. Kloiber, D. F. Levinson, C. M. Lewis, G. Lewis, Q. S. Li, S. Lucae, P. A. Madden, P. K. Magnusson, N. G. Martin, A. M. McIntosh, A. Metspalu, O. Mors, P. B. Mortensen, B. Müller-Myhsok, M. Nordentoft, M. M. Nöthen, M. C. O’Donovan, S. A. Paciga, N. L. Pedersen, B. W. Penninx, R. H. Perlis, D. J. Porteous, J. B. Potash, M. Preisig, M. Rietschel, C. Schaefer, T. G. Schulze, J. W. Smoller, K. Stefansson, P. F. Sullivan, H. Tiemeier, R. Uher, H. Völzke, M. M. Weissman, T. Werge, A. R. Winslow, N. R. Wray.
Bioinformatics: 23andMe Research Team, M. J. Adams, S. V. d. Auwera, G. Breen, J. Bryois, A. D. Børglum, E. Castelao, J. H. Christensen, T. Clarke, J. R. I. Coleman, L. Colodro-Conde, eQTLGen Consortium, G. E. Crawford, C. A. Crowley, G. Davies, E. M. Derks, T. Esko, A. J. Forstner, H. A. Gaspar, P. Giusti-Rodríguez, J. Grove, L. S. Hall, E. Hannon, T. F. Hansen, C. Hayward, M. Hu, R. Jansen, F. Jin, Z. Kutalik, Q. S. Li, Y. Li, P. A. Lind, X. Liu, L. Lu, D. J. MacIntyre, S. E. Medland, E. Mihailov, Y. Milaneschi, J. Mill, J. N. Painter, B. W. Penninx, W. J. Peyrot, G. Pistis, P. Qvist, L. Shen, S. I. Shyn, C. A. Stockmeier, P. F. Sullivan, K. E. Tansey, A. Teumer, P. A. Thomson, A. G. Uitterlinden, Y. Wang, S. M. Weinsheimer, N. R. Wray, H. S. Xi.
Clinical: E. Agerbo, T. M. Air, V. Arolt, B. T. Baune, A. T. F. Beekman, K. Berger, E. B. Binder, D. H. R. Blackwood, H. N. Buttenschøn, A. D. Børglum, N. Craddock, U. Dannlowski, J. R. DePaulo, N. Direk, K. Domschke, M. Gill, F. S. Goes, H. J. Grabe, A. C. Heath, A. M. v. Hemert, I. B. Hickie, M. Ising, S. Kloiber, J. Krogh, D. F. Levinson, S. Lucae, D. J. MacIntyre, D. F. MacKinnon, P. A. Madden, W. Maier, N. G. Martin, P. McGrath, P. McGuffin, A. M. McIntosh, A. Metspalu, C. M. Middeldorp, S. S. Mirza, F. M. Mondimore, O. Mors, P. B. Mortensen, D. R. Nyholt, H. Oskarsson, M. J. Owen, C. B. Pedersen, M. G. Pedersen, J. B. Potash, J. A. Quiroz, J. P. Rice, M. Rietschel, C. Schaefer, R. Schoevers, E. Sigurdsson, G. C. B. Sinnamon, D. J. Smith, F. Streit, J. Strohmaier, D. Umbricht, M. M. Weissman, J. Wellmann, T. Werge, G. Willemsen.
Genomic assays: G. Breen, H. N. Buttenschøn, J. Bybjerg-Grauholm, M. Bækvad-Hansen, A. D. Børglum, S. Cichon, T. Clarke, F. Degenhardt, A. J. Forstner, S. P. Hamilton, C. S. Hansen, A. C. Heath, P. Hoffmann, G. Homuth, C. Horn, J. A. Knowles, P. A. Madden, L. Milani, G. W. Montgomery, M. Nauck, M. M. Nöthen, M. Rietschel, M. Rivera, E. C. Schulte, T. G. Schulze, S. I. Shyn, H. Stefansson, F. Streit, T. E. Thorgeirsson, J. Treutlein, A. G. Uitterlinden, S. H. Witt.
Obtained funding for primary MDD samples: B. T. Baune, K. Berger, D. H. R. Blackwood, D. I. Boomsma, G. Breen, H. N. Buttenschøn, A. D. Børglum, S. Cichon, J. R. DePaulo, I. J. Deary, E. Domenici, T. C. Eley, T. Esko, H. J. Grabe, S. P. Hamilton, A. C. Heath, D. M. Hougaard, I. S. Kohane, D. F. Levinson, C. M. Lewis, G. Lewis, Q. S. Li, S. Lucae, P. A. Madden, W. Maier, N. G. Martin, P. McGuffin, A. M. McIntosh, A. Metspalu, G. W. Montgomery, O. Mors, P. B. Mortensen, M. Nordentoft, D. R. Nyholt, M. M. Nöthen, P. F. O’Reilly, B. W. Penninx, D. J. Porteous, J. B. Potash, M. Preisig, M. Rietschel, C. Schaefer, T. G. Schulze, G. C. B. Sinnamon, J. H. Smit, D. J. Smith, H. Stefansson, K. Stefansson, P. F. Sullivan, T. E. Thorgeirsson, H. Tiemeier, A. G. Uitterlinden, H. Völzke, M. M. Weissman, T. Werge, N. R. Wray.
Statistical analysis: 23andMe Research Team, A. Abdellaoui, M. J. Adams, T. F. M. Andlauer, S. V. d. Auwera, S. Bacanu, K. Berger, T. B. Bigdeli, G. Breen, E. M. Byrne, A. D. Børglum, N. Cai, T. Clarke, J. R. I. Coleman, B. Couvy-Duchesne, H. S. Dashti, G. Davies, N. Direk, C. V. Dolan, E. C. Dunn, N. Eriksson, V. Escott-Price, T. Esko, H. K. Finucane, J. Frank, H. A. Gaspar, S. D. Gordon, J. Grove, L. S. Hall, C. Hayward, A. C. Heath, S. Herms, D. A. Hinds, J. Hottenga, C. L. Hyde, M. Ising, E. Jorgenson, F. F. H. Kiadeh, J. Kraft, W. W. Kretzschmar, Z. Kutalik, J. M. Lane, C. M. Lewis, Q. S. Li, Y. Li, D. J. MacIntyre, P. A. Madden, R. M. Maier, J. Marchini, M. Mattheisen, H. Mbarek, A. M. McIntosh, S. E. Medland, D. Mehta, E. Mihailov, Y. Milaneschi, S. S. Mirza, S. Mostafavi, N. Mullins, B. Müller-Myhsok, B. Ng, M. G. Nivard, D. R. Nyholt, P. F. O’Reilly, R. E. Peterson, E. Pettersson, W. J. Peyrot, G. Pistis, D. Posthuma, S. M. Purcell, B. P. Riley, S. Ripke, M. Rivera, R. Saxena, C. Schaefer, L. Shen, J. Shi, S. I. Shyn, H. Stefansson, S. Steinberg, P. F. Sullivan, K. E. Tansey, H. Teismann, A. Teumer, W. Thompson, P. A. Thomson, T. E. Thorgeirsson, C. Tian, M. Traylor, V. Trubetskoy, M. Trzaskowski, A. Viktorin, P. M. Visscher, Y. Wang, B. T. Webb, J. Wellmann, T. Werge, N. R. Wray, Y. Wu, J. Yang, F. Zhang.
Footnotes
Competing Financial Interests
Aartjan TF Beekman: Speakers bureaus of Lundbeck and GlaxoSmithKline. Greg Crawford: Co-founder of Element Genomics. Enrico Domenici: Employee of Hoffmann-La Roche at the time this study was conducted, consultant to Roche and Pierre-Fabre. Nicholas Eriksson: Employed by 23andMe, Inc. and owns stock in 23andMe, Inc. David Hinds: Employee of and own stock options in 23andMe, Inc. Sara Paciga: Employee of Pfizer, Inc. Craig L Hyde: Employee of Pfizer, Inc. Ashley R Winslow: Former employee and stockholder of Pfizer, Inc. Jorge A Quiroz: Employee of Hoffmann-La Roche at the time this study was conducted. Hreinn Stefansson: Employee of deCODE Genetics/AMGEN. Kari Stefansson: Employee of deCODE Genetics/AMGEN. Stacy Steinberg: Employee of deCODE Genetics/AMGEN. Patrick F Sullivan: Scientific advisory board for Pfizer Inc and an advisory committee for Lundbeck. Thorgeir E Thorgeirsson: Employee of deCODE Genetics/AMGEN. Chao Tian: Employee of and own stock options in 23andMe, Inc.
References
- 1.Kessler RC, Bromet EJ. The epidemiology of depression across cultures. Annu Rev Public Health. 2013;34:119–38. doi: 10.1146/annurev-publhealth-031912-114409. [DOI] [PMC free article] [PubMed] [Google Scholar]
- 2.Judd LL. The clinical course of unipolar major depressive disorders. Archives of general psychiatry. 1997;54:989–91. doi: 10.1001/archpsyc.1997.01830230015002. [DOI] [PubMed] [Google Scholar]
- 3.Lopez AD, Mathers CD, Ezzati M, Jamison DT, Murray CJ. Global and regional burden of disease and risk factors, 2001: systematic analysis of population health data. Lancet. 2006;367:1747–57. doi: 10.1016/S0140-6736(06)68770-9. [DOI] [PubMed] [Google Scholar]
- 4.Wittchen HU, et al. The size and burden of mental disorders and other disorders of the brain in Europe 2010. European neuropsychopharmacology : the journal of the European College of Neuropsychopharmacology. 2011;21:655–79. doi: 10.1016/j.euroneuro.2011.07.018. [DOI] [PubMed] [Google Scholar]
- 5.Ferrari AJ, et al. Burden of depressive disorders by country, sex, age, and year: findings from the global burden of disease study 2010. PLoS Med. 2013;10:e1001547. doi: 10.1371/journal.pmed.1001547. [DOI] [PMC free article] [PubMed] [Google Scholar]
- 6.Angst F, Stassen HH, Clayton PJ, Angst J. Mortality of patients with mood disorders: follow-up over 34–38 years. J Affect Disord. 2002;68:167–81. doi: 10.1016/s0165-0327(01)00377-9. [DOI] [PubMed] [Google Scholar]
- 7.Gustavsson A, et al. Cost of disorders of the brain in Europe 2010. European neuropsychopharmacology : the journal of the European College of Neuropsychopharmacology. 2011;21:718–779. doi: 10.1016/j.euroneuro.2011.08.008. [DOI] [PubMed] [Google Scholar]
- 8.Murray CJ, et al. Disability-adjusted life years (DALYs) for 291 diseases and injuries in 21 regions, 1990–2010: a systematic analysis for the Global Burden of Disease Study 2010. Lancet. 2012;380:2197–223. doi: 10.1016/S0140-6736(12)61689-4. [DOI] [PubMed] [Google Scholar]
- 9.Sullivan PF, Neale MC, Kendler KS. Genetic epidemiology of major depression: Review and meta analysis. American Journal of Psychiatry. 2000;157:1552–1562. doi: 10.1176/appi.ajp.157.10.1552. [DOI] [PubMed] [Google Scholar]
- 10.Rice F, Harold G, Thapar A. The genetic aetiology of childhood depression: a review. J Child Psychol Psychiatry. 2002;43:65–79. doi: 10.1111/1469-7610.00004. [DOI] [PubMed] [Google Scholar]
- 11.Viktorin A, et al. Heritability of Perinatal Depression and Genetic Overlap With Nonperinatal Depression. Am J Psychiatry. 2015 doi: 10.1176/appi.ajp.2015.15010085. appiajp201515010085. [DOI] [PubMed] [Google Scholar]
- 12.Levinson DF, et al. Genetic studies of major depressive disorder: why are there no GWAS findings, and what can we do about it. Biological Psychiatry. 2014;76:510–2. doi: 10.1016/j.biopsych.2014.07.029. [DOI] [PMC free article] [PubMed] [Google Scholar]
- 13.Major Depressive Disorder Working Group of the PGC. A mega-analysis of genome-wide association studies for major depressive disorder. Molecular Psychiatry. 2013;18:497–511. doi: 10.1038/mp.2012.21. [DOI] [PMC free article] [PubMed] [Google Scholar]
- 14.Hek K, et al. A genome-wide association study of depressive symptoms. Biological psychiatry. 2013;73:667–78. doi: 10.1016/j.biopsych.2012.09.033. [DOI] [PMC free article] [PubMed] [Google Scholar]
- 15.CONVERGE Consortium. Sparse whole genome sequencing identifies two loci for major depressive disorder. Nature. 2015 doi: 10.1038/nature14659. [DOI] [PMC free article] [PubMed] [Google Scholar]
- 16.Okbay A, et al. Genetic variants associated with subjective well-being, depressive symptoms, and neuroticism identified through genome-wide analyses. Nat Genet. 2016 doi: 10.1038/ng.3552. [DOI] [PMC free article] [PubMed] [Google Scholar]
- 17.Sullivan PF, et al. Psychiatric Genomics: An Update and an Agenda. doi: 10.1176/appi.ajp.2017.17030283. (Submitted) [DOI] [PMC free article] [PubMed] [Google Scholar]
- 18.Visscher PM, Brown MA, McCarthy MI, Yang J. Five Years of GWAS Discovery. American journal of human genetics. 2012;90:7–24. doi: 10.1016/j.ajhg.2011.11.029. [DOI] [PMC free article] [PubMed] [Google Scholar]
- 19.Schizophrenia Working Group of the Psychiatric Genomics Consortium. Biological insights from 108 schizophrenia-associated genetic loci. Nature. 2014;511:421–7. doi: 10.1038/nature13595. [DOI] [PMC free article] [PubMed] [Google Scholar]
- 20.Psychiatric GWAS Consortium Bipolar Disorder Working Group. Large-scale genome-wide association analysis of bipolar disorder identifies a new susceptibility locus near ODZ4. Nature genetics. 2011;43:977–83. doi: 10.1038/ng.943. [DOI] [PMC free article] [PubMed] [Google Scholar]
- 21.Cross-Disorder Group of the Psychiatric Genomics Consortium. Genetic relationship between five psychiatric disorders estimated from genome-wide SNPs. Nature genetics. 2013;45:984–94. doi: 10.1038/ng.2711. [DOI] [PMC free article] [PubMed] [Google Scholar]
- 22.Bulik-Sullivan BK, et al. An atlas of genetic correlations across human diseases and traits. Nature Genetics. 2015;47:1236–41. doi: 10.1038/ng.3406. [DOI] [PMC free article] [PubMed] [Google Scholar]
- 23.Wray NR, et al. Genome-wide association study of major depressive disorder: new results, meta-analysis, and lessons learned. Mol Psychiatry. 2012;17:36–48. doi: 10.1038/mp.2010.109. [DOI] [PMC free article] [PubMed] [Google Scholar]
- 24.Bulik-Sullivan BK, et al. LD Score regression distinguishes confounding from polygenicity in genome-wide association studies. Nature Genetics. 2015;47:291–5. doi: 10.1038/ng.3211. [DOI] [PMC free article] [PubMed] [Google Scholar]
- 25.Meier SM, et al. High loading of polygenic risk in cases with chronic schizophrenia. Mol Psychiatry. 2016;21:969–74. doi: 10.1038/mp.2015.130. [DOI] [PubMed] [Google Scholar]
- 26.Yang J, et al. Conditional and joint multiple-SNP analysis of GWAS summary statistics identifies additional variants influencing complex traits. Nat Genet. 2012;44:369–75. S1–3. doi: 10.1038/ng.2213. [DOI] [PMC free article] [PubMed] [Google Scholar]
- 27.Wray NR, Maier R. Genetic Basis of Complex Genetic Disease: The Contribution of Disease Heterogeneity to Missing Heritability. Current Epidemiology Reports. 2014;1:220–7. [Google Scholar]
- 28.Hyde CL, et al. Identification of 15 genetic loci associated with risk of major depression in individuals of European descent. Nat Genet. 2016;48:1031–6. doi: 10.1038/ng.3623. [DOI] [PMC free article] [PubMed] [Google Scholar]
- 29.Locke AE, et al. Genetic studies of body mass index yield new insights for obesity biology. Nature. 2015;518:197–206. doi: 10.1038/nature14177. [DOI] [PMC free article] [PubMed] [Google Scholar]
- 30.Berndt SI, et al. Genome-wide meta-analysis identifies 11 new loci for anthropometric traits and provides insights into genetic architecture. Nat Genet. 2013;45:501–12. doi: 10.1038/ng.2606. [DOI] [PMC free article] [PubMed] [Google Scholar]
- 31.Bradfield JP, et al. A genome-wide association meta-analysis identifies new childhood obesity loci. Nat Genet. 2012;44:526–31. doi: 10.1038/ng.2247. [DOI] [PMC free article] [PubMed] [Google Scholar]
- 32.Speliotes EK, et al. Association analyses of 249,796 individuals reveal 18 new loci associated with body mass index. Nat Genet. 2010;42:937–48. doi: 10.1038/ng.686. [DOI] [PMC free article] [PubMed] [Google Scholar]
- 33.Willer CJ, et al. Six new loci associated with body mass index highlight a neuronal influence on body weight regulation. Nat Genet. 2009;41:25–34. doi: 10.1038/ng.287. [DOI] [PMC free article] [PubMed] [Google Scholar]
- 34.Thorleifsson G, et al. Genome-wide association yields new sequence variants at seven loci that associate with measures of obesity. Nat Genet. 2009;41:18–24. doi: 10.1038/ng.274. [DOI] [PubMed] [Google Scholar]
- 35.Fogel BL, et al. RBFOX1 regulates both splicing and transcriptional networks in human neuronal development. Hum Mol Genet. 2012;21:4171–86. doi: 10.1093/hmg/dds240. [DOI] [PMC free article] [PubMed] [Google Scholar]
- 36.Gehman LT, et al. The splicing regulator Rbfox1 (A2BP1) controls neuronal excitation in the mammalian brain. Nat Genet. 2011;43:706–11. doi: 10.1038/ng.841. [DOI] [PMC free article] [PubMed] [Google Scholar]
- 37.Pariante CM, Lightman SL. The HPA axis in major depression: classical theories and new developments. Trends Neurosci. 2008;31:464–8. doi: 10.1016/j.tins.2008.06.006. [DOI] [PubMed] [Google Scholar]
- 38.Choi Y, et al. SALM5 trans-synaptically interacts with LAR-RPTPs in a splicing-dependent manner to regulate synapse development. Sci Rep. 2016;6:26676. doi: 10.1038/srep26676. [DOI] [PMC free article] [PubMed] [Google Scholar]
- 39.Mah W, et al. Selected SALM (synaptic adhesion-like molecule) family proteins regulate synapse formation. J Neurosci. 2010;30:5559–68. doi: 10.1523/JNEUROSCI.4839-09.2010. [DOI] [PMC free article] [PubMed] [Google Scholar]
- 40.Zhu Y, et al. Neuron-specific SALM5 limits inflammation in the CNS via its interaction with HVEM. Sci Adv. 2016;2:e1500637. doi: 10.1126/sciadv.1500637. [DOI] [PMC free article] [PubMed] [Google Scholar]
- 41.Amiel J, et al. Mutations in TCF4, encoding a class I basic helix-loop-helix transcription factor, are responsible for Pitt-Hopkins syndrome, a severe epileptic encephalopathy associated with autonomic dysfunction. Am J Hum Genet. 2007;80:988–93. doi: 10.1086/515582. [DOI] [PMC free article] [PubMed] [Google Scholar]
- 42.Akbarian S, et al. The PsychENCODE project. Nat Neurosci. 2015;18:1707–12. doi: 10.1038/nn.4156. [DOI] [PMC free article] [PubMed] [Google Scholar]
- 43.GTEx Consortium. Human genomics. The Genotype-Tissue Expression (GTEx) pilot analysis: multitissue gene regulation in humans. Science. 2015;348:648–60. doi: 10.1126/science.1262110. [DOI] [PMC free article] [PubMed] [Google Scholar]
- 44.Schmaal L, et al. Cortical abnormalities in adults and adolescents with major depression based on brain scans from 20 cohorts worldwide in the ENIGMA Major Depressive Disorder Working Group. Mol Psychiatry. 2016 doi: 10.1038/mp.2016.60. [DOI] [PMC free article] [PubMed] [Google Scholar]
- 45.Cahoy JD, et al. A transcriptome database for astrocytes, neurons, and oligodendrocytes: a new resource for understanding brain development and function. J Neurosci. 2008;28:264–78. doi: 10.1523/JNEUROSCI.4178-07.2008. [DOI] [PMC free article] [PubMed] [Google Scholar]
- 46.Finucane HK, et al. Partitioning heritability by functional category using GWAS summary statistics. Nature Genetics. 2015;47:1228–35. doi: 10.1038/ng.3404. [DOI] [PMC free article] [PubMed] [Google Scholar]
- 47.Lindblad-Toh K, et al. A high-resolution map of human evolutionary constraint using 29 mammals. Nature. 2011;478:476–82. doi: 10.1038/nature10530. [DOI] [PMC free article] [PubMed] [Google Scholar]
- 48.Simonti CN, et al. The phenotypic legacy of admixture between modern humans and Neandertals. Science. 2016;351:737–41. doi: 10.1126/science.aad2149. [DOI] [PMC free article] [PubMed] [Google Scholar]
- 49.Zhu Z, et al. Integration of summary data from GWAS and eQTL studies predicts complex trait gene targets. Nat Genet. 2016;48:481–7. doi: 10.1038/ng.3538. [DOI] [PubMed] [Google Scholar]
- 50.Gusev A, et al. Integrative approaches for large-scale transcriptome-wide association studies. Nat Genet. 2016;48:245–52. doi: 10.1038/ng.3506. [DOI] [PMC free article] [PubMed] [Google Scholar]
- 51.Fromer M, et al. Gene expression elucidates functional impact of polygenic risk for schizophrenia. Nature Neuroscience. 2016;19:1442–1453. doi: 10.1038/nn.4399. [DOI] [PMC free article] [PubMed] [Google Scholar]
- 52.Smemo S, et al. Obesity-associated variants within FTO form long-range functional connections with IRX3. Nature. 2014;507:371–5. doi: 10.1038/nature13138. [DOI] [PMC free article] [PubMed] [Google Scholar]
- 53.Won H, et al. Chromosome conformation elucidates regulatory relationships in developing human brain. Nature. 2016;538:523–527. doi: 10.1038/nature19847. [DOI] [PMC free article] [PubMed] [Google Scholar]
- 54.Martin JS, et al. HUGIn: Hi-C Unifying Genomic Interrogator. doi: 10.1093/bioinformatics/btx359. (Submitted) [DOI] [PMC free article] [PubMed] [Google Scholar]
- 55.Pathway Analysis Subgroup of the Psychiatric Genomics C. Psychiatric genome-wide association study analyses implicate neuronal, immune and histone pathways. Nat Neurosci. 2015;18:199–209. doi: 10.1038/nn.3922. [DOI] [PMC free article] [PubMed] [Google Scholar]
- 56.De Rubeis S, et al. Synaptic, transcriptional and chromatin genes disrupted in autism. Nature. 2014;515:209–15. doi: 10.1038/nature13772. [DOI] [PMC free article] [PubMed] [Google Scholar]
- 57.Genovese G, et al. Increased burden of ultra-rare protein-altering variants among 4,877 individuals with schizophrenia. Nature Neuroscience. 2016 doi: 10.1038/nn.4402. [DOI] [PMC free article] [PubMed] [Google Scholar]
- 58.Gaspar HA, Breen G. Pathways analyses of schizophrenia GWAS focusing on known and novel drug targets. (Submitted) [Google Scholar]
- 59.Breen G, et al. Translating genome-wide association findings into new therapeutics for psychiatry. Nat Neurosci. 2016;19:1392–1396. doi: 10.1038/nn.4411. [DOI] [PMC free article] [PubMed] [Google Scholar]
- 60.Zheng J, et al. LD Hub: a centralized database and web interface to perform LD score regression that maximizes the potential of summary level GWAS data for SNP heritability and genetic correlation analysis. Bioinformatics. 2017;33:272–279. doi: 10.1093/bioinformatics/btw613. [DOI] [PMC free article] [PubMed] [Google Scholar]
- 61.Sniekers S, et al. Genome-wide association meta-analysis of 78,308 individuals identifies new loci and genes influencing human intelligence. Nat Genet. 2017 doi: 10.1038/ng.3869. [DOI] [PMC free article] [PubMed] [Google Scholar]
- 62.Okbay A, et al. Genome-wide association study identifies 74 loci associated with educational attainment. Nature. 2016;533:539–42. doi: 10.1038/nature17671. [DOI] [PMC free article] [PubMed] [Google Scholar]
- 63.Nikpay M, et al. A comprehensive 1,000 Genomes-based genome-wide association meta-analysis of coronary artery disease. Nat Genet. 2015;47:1121–30. doi: 10.1038/ng.3396. [DOI] [PMC free article] [PubMed] [Google Scholar]
- 64.Zhu Z, et al. Causal associations between risk factors and common diseases inferred from GWAS summary data. Nature Communications. 2018;9:224. doi: 10.1038/s41467-017-02317-2. [DOI] [PMC free article] [PubMed] [Google Scholar]
- 65.Wray NR, Lee SH, Kendler KS. Impact of diagnostic misclassification on estimation of genetic correlations using genome-wide genotypes. Eur J Hum Genet. 2012;20:668–74. doi: 10.1038/ejhg.2011.257. [DOI] [PMC free article] [PubMed] [Google Scholar]
- 66.Hippocrates. Aphorisms, (400 BCE).
- 67.Skene NG, et al. Brain cell types and the genetic basis of schizophrenia. (Submitted) [Google Scholar]
- 68.Yang X, et al. Widespread Expansion of Protein Interaction Capabilities by Alternative Splicing. Cell. 2016;164:805–17. doi: 10.1016/j.cell.2016.01.029. [DOI] [PMC free article] [PubMed] [Google Scholar]
- 69.Zhang X, et al. Cell-Type-Specific Alternative Splicing Governs Cell Fate in the Developing Cerebral Cortex. Cell. 2016;166:1147–1162 e15. doi: 10.1016/j.cell.2016.07.025. [DOI] [PMC free article] [PubMed] [Google Scholar]
- 70.Kessler RC, et al. The epidemiology of major depressive disorder: results from the National Comorbidity Survey Replication (NCS-R) Jama. 2003;289:3095–105. doi: 10.1001/jama.289.23.3095. [DOI] [PubMed] [Google Scholar]
- 71.Hasin DS, Goodwin RD, Stinson FS, Grant BF. Epidemiology of major depressive disorder: results from the National Epidemiologic Survey on Alcoholism and Related Conditions. Archives of general psychiatry. 2005;62:1097–106. doi: 10.1001/archpsyc.62.10.1097. [DOI] [PubMed] [Google Scholar]
- 72.Kendler KS, et al. The structure of genetic and environmental risk factors for syndromal and subsyndromal common DSM-IV axis I and all axis II disorders. Am J Psychiatry. 2011;168:29–39. doi: 10.1176/appi.ajp.2010.10030340. [DOI] [PMC free article] [PubMed] [Google Scholar]
- 73.Kendler KS, Prescott CA, Myers J, Neale MC. The structure of genetic and environmental risk factors for common psychiatric and substance use disorders in men and women. Arch Gen Psychiatry. 2003;60:929–37. doi: 10.1001/archpsyc.60.9.929. [DOI] [PubMed] [Google Scholar]
- 74.Robinson EB, et al. Genetic risk for autism spectrum disorders and neuropsychiatric variation in the general population. Nat Genet. 2016;48:552–5. doi: 10.1038/ng.3529. [DOI] [PMC free article] [PubMed] [Google Scholar]
- 75.Middeldorp CM, et al. A Genome-Wide Association Meta-Analysis of Attention-Deficit/Hyperactivity Disorder Symptoms in Population-Based Pediatric Cohorts. J Am Acad Child Adolesc Psychiatry. 2016;55:896–905 e6. doi: 10.1016/j.jaac.2016.05.025. [DOI] [PMC free article] [PubMed] [Google Scholar]
- 76.Kendell RE. The classification of depressions: a review of contemporary confusion. British Journal of Psychiatry. 1976;129:15–28. doi: 10.1192/bjp.129.1.15. [DOI] [PubMed] [Google Scholar]
- 77.Verduijn J, et al. Using Clinical Characteristics to Identify Which Patients With Major Depressive Disorder Have a Higher Genetic Load for Three Psychiatric Disorders. Biol Psychiatry. 2017;81:316–324. doi: 10.1016/j.biopsych.2016.05.024. [DOI] [PubMed] [Google Scholar]
- 78.Smith BH, et al. Cohort Profile: Generation Scotland: Scottish Family Health Study (GS:SFHS). The study, its participants and their potential for genetic research on health and illness. Int J Epidemiol. 2013;42:689–700. doi: 10.1093/ije/dys084. [DOI] [PubMed] [Google Scholar]
- 79.Fernandez-Pujals AM, et al. Epidemiology and Heritability of Major Depressive Disorder, Stratified by Age of Onset, Sex, and Illness Course in Generation Scotland: Scottish Family Health Study (GS:SFHS) PLoS One. 2015;10:e0142197. doi: 10.1371/journal.pone.0142197. [DOI] [PMC free article] [PubMed] [Google Scholar]
- 80.Banda Y, et al. Characterizing Race/Ethnicity and Genetic Ancestry for 100,000 Subjects in the Genetic Epidemiology Research on Adult Health and Aging (GERA) Cohort. Genetics. 2015;200:1285–95. doi: 10.1534/genetics.115.178616. [DOI] [PMC free article] [PubMed] [Google Scholar]
- 81.Pedersen CB, et al. The iPSYCH2012 case-cohort sample: new directions for unravelling genetic and environmental architectures of severe mental disorders. Mol Psychiatry. 2018;23:6–14. doi: 10.1038/mp.2017.196. [DOI] [PMC free article] [PubMed] [Google Scholar]
- 82.Allen NE, Sudlow C, Peakman T, Collins R, Biobank UK. UK biobank data: come and get it. Sci Transl Med. 2014;6:224ed4. doi: 10.1126/scitranslmed.3008601. [DOI] [PubMed] [Google Scholar]
- 83.World Health Organization. International Classification of Diseases. World Health Organization; Geneva: 1978. [Google Scholar]
- 84.World Health Organization. International Classification of Diseases. World Health Organization; Geneva: 1992. [Google Scholar]
- 85.American Psychiatric Association. Diagnostic and Statistical Manual of Mental Disorders. American Psychiatric Association; Washington, DC: 1994. [Google Scholar]
- 86.Durbin RM, et al. A map of human genome variation from population-scale sequencing. Nature. 2010;467:1061–73. doi: 10.1038/nature09534. [DOI] [PMC free article] [PubMed] [Google Scholar]
- 87.Encode Project Consortium. A user’s guide to the encyclopedia of DNA elements (ENCODE) PLoS Biol. 2011;9:e1001046. doi: 10.1371/journal.pbio.1001046. [DOI] [PMC free article] [PubMed] [Google Scholar]
- 88.Roadmap Epigenomics Consortium et al. Integrative analysis of 111 reference human epigenomes. Nature. 2015;518:317–30. doi: 10.1038/nature14248. [DOI] [PMC free article] [PubMed] [Google Scholar]
- 89.Vernot B, et al. Excavating Neandertal and Denisovan DNA from the genomes of Melanesian individuals. Science. 2016;352:235–9. doi: 10.1126/science.aad9416. [DOI] [PMC free article] [PubMed] [Google Scholar]
- 90.Bryois J, et al. Evaluation of Chromatin Accessibility in Prefrontal Cortex of Schizophrenia Cases and Controls. doi: 10.1038/s41467-018-05379-y. (Submitted) [DOI] [PMC free article] [PubMed] [Google Scholar]
- 91.Zhang Y, et al. Model-based analysis of ChIP-Seq (MACS) Genome Biol. 2008;9:R137. doi: 10.1186/gb-2008-9-9-r137. [DOI] [PMC free article] [PubMed] [Google Scholar]
- 92.Ross-Innes CS, et al. Differential oestrogen receptor binding is associated with clinical outcome in breast cancer. Nature. 2012;481:389–93. doi: 10.1038/nature10730. [DOI] [PMC free article] [PubMed] [Google Scholar]
- 93.Finucane H, et al. Heritability enrichment of specifically expressed genes identifies disease-relevant tissues and cell types. doi: 10.1038/s41588-018-0081-4. (Submitted) [DOI] [PMC free article] [PubMed] [Google Scholar]
- 94.Zhernakova DV, et al. Identification of context-dependent expression quantitative trait loci in whole blood. Nat Genet. 2017;49:139–145. doi: 10.1038/ng.3737. [DOI] [PubMed] [Google Scholar]
- 95.Jansen R, et al. Conditional eQTL analysis reveals allelic heterogeneity of gene expression. Hum Mol Genet. 2017;26:1444–1451. doi: 10.1093/hmg/ddx043. [DOI] [PMC free article] [PubMed] [Google Scholar]
- 96.Lappalainen T, et al. Transcriptome and genome sequencing uncovers functional variation in humans. Nature. 2013;501:506–11. doi: 10.1038/nature12531. [DOI] [PMC free article] [PubMed] [Google Scholar]
- 97.Ng B, et al. An xQTL map integrates the genetic architecture of the human brain’s transcriptome and epigenome. Nat Neurosci. 2017;20:1418–1426. doi: 10.1038/nn.4632. [DOI] [PMC free article] [PubMed] [Google Scholar]
- 98.Hannon E, Weedon M, Bray N, O’Donovan M, Mill J. Pleiotropic Effects of Trait-Associated Genetic Variation on DNA Methylation: Utility for Refining GWAS Loci. Am J Hum Genet. 2017;100:954–959. doi: 10.1016/j.ajhg.2017.04.013. [DOI] [PMC free article] [PubMed] [Google Scholar]
- 99.de Leeuw CA, Neale BM, Heskes T, Posthuma D. The statistical properties of gene-set analysis. Nat Rev Genet. 2016 doi: 10.1038/nrg.2016.29. [DOI] [PubMed] [Google Scholar]
- 100.de Leeuw CA, Mooij JM, Heskes T, Posthuma D. MAGMA: generalized gene-set analysis of GWAS data. PLoS Comput Biol. 2015;11:e1004219. doi: 10.1371/journal.pcbi.1004219. [DOI] [PMC free article] [PubMed] [Google Scholar]
- 101.1000 Genomes Project Consortium et al. A global reference for human genetic variation. Nature. 2015;526:68–74. doi: 10.1038/nature15393. [DOI] [PMC free article] [PubMed] [Google Scholar]
- 102.Turner TN, et al. denovo-db: a compendium of human de novo variants. Nucleic Acids Res. 2017;45:D804–D811. doi: 10.1093/nar/gkw865. [DOI] [PMC free article] [PubMed] [Google Scholar]
- 103.Pirooznia M, et al. High-throughput sequencing of the synaptome in major depressive disorder. Mol Psychiatry. 2016;21:650–5. doi: 10.1038/mp.2015.98. [DOI] [PMC free article] [PubMed] [Google Scholar]
- 104.Liberzon A, et al. The Molecular Signatures Database (MSigDB) hallmark gene set collection. Cell Syst. 2015;1:417–425. doi: 10.1016/j.cels.2015.12.004. [DOI] [PMC free article] [PubMed] [Google Scholar]
- 105.Wagner AH, et al. DGIdb 2.0: mining clinically relevant drug-gene interactions. Nucleic Acids Res. 2016;44:D1036–44. doi: 10.1093/nar/gkv1165. [DOI] [PMC free article] [PubMed] [Google Scholar]
- 106.Roth BL, Kroeze WK, Patel S, Lopez E. The Multiplicity of Serotonin Receptors: Uselessly diverse molecules or an embarrasment of riches? The Neuroscientist. 2000;6:252–262. [Google Scholar]
- 107.Olier I, Vellido A, Giraldo J. Kernel Generative Topographic Mapping. ESANN 2010 Proceedings. 2010:28–30. [Google Scholar]
- 108.Smith GD, Ebrahim S. ‘Mendelian randomization’: can genetic epidemiology contribute to understanding environmental determinants of disease? Int J Epidemiol. 2003;32:1–22. doi: 10.1093/ije/dyg070. [DOI] [PubMed] [Google Scholar]
- 109.Wooldridge JX. Introductory Econometrics: A modern approach. Nelson Education; 2015. [Google Scholar]
- 110.Bowden J, Davey Smith G, Burgess S. Mendelian randomization with invalid instruments: effect estimation and bias detection through Egger regression. Int J Epidemiol. 2015;44:512–25. doi: 10.1093/ije/dyv080. [DOI] [PMC free article] [PubMed] [Google Scholar]
Associated Data
This section collects any data citations, data availability statements, or supplementary materials included in this article.
Supplementary Materials
Data Availability Statement
The PGC’s policy is to make genome-wide summary results public. Summary statistics for a combined meta-analysis of PGC29 with five of the six expanded samples (deCODE, Generation Scotland, GERA, iPSYCH, and UK Biobank) are available on the PGC web site (URLs). Results for 10,000 SNPs for all seven cohorts are also available on the PGC web site.
GWA summary statistics for the Hyde et al. cohort (23andMe, Inc.) must be obtained separately. These can be obtained by qualified researchers under an agreement with 23andMe that protects the privacy of the 23andMe participants. Contact David Hinds (dhinds@23andme.com) to apply for access to the data. Researchers who have the 23andMe summary statistics can readily recreate our results by meta-analyzing the six cohort results file with the Hyde et al. results file from 23andMe.28
Availability of genotype data for PGC29 is described in Supplementary Table 15. For the expanded cohorts, interested users should contact the lead PIs of these cohorts (which are separate from the PGC).