

Abstract
Background
Positron Emission Tomography (PET) studies in Major Depressive Disorder (MDD) have reported higher serotonin 1A (5-HT1A) autoreceptor binding in the raphe. In males, the difference is so large that it can potentially be used as the first biological marker for MDD. However, the raphe includes several nuclei, which project to different regions of the brain and spinal cord and may be differentially involved in disease. We aimed to identify 5-HT1A differences in individual raphe nuclei using PET in order to determine whether use of subnuclei would provide greater sensitivity and specificity of diagnosing MDD.
Methods
We identified individual nuclei using a hybrid set-level technique on an average [11C]-WAY100635 PET image derived from 52 healthy volunteers (HV). We delineated three nuclei: dorsal raphe nucleus (DRN), median raphe nucleus (MRN), and raphe magnus (RMg). An atlas image of these nuclei was created and nonlinearly warped to each subject (through an associated MRI) in a separate sample of 41 males (25 HV, 16 MDD) who underwent [11C]-WAY100635 PET.
Results
5-HT1A binding was elevated in DRN in MDD (p<0.01), and was not different in the RMg and MRN between groups. Receiver operating characteristic (ROC) curves showed that combining DRN and MRN produces highest sensitivity (94%) and specificity (84%) to identify MDD.
Conclusions
In agreement with post-mortem studies, we found higher 5-HT1A autoreceptor binding in MDD selectively in the DRN. 5-HT1A autoreceptor binding in the combined DRN and MRN is a better biomarker for MDD than in the raphe as a whole.
Keywords: serotonin 1A, serotonin, dorsal raphe nucleus, median raphe nucleus, raphe magnus, positron emission tomography, human
Introduction
Serotonin (5-HT) dysfunction is implicated in the pathogenesis of major depressive disorder (MDD). Many studies of MDD have focused on serotonin neuron cell bodies that project to the central nervous system. These cells are found in the brainstem raphe nuclei (Hornung, 2003). Serotonin release by raphe nuclei is regulated by somato-dendritic 5-HT1A autoreceptors (de Montigny & Blier, 1984; Pineyro & Blier, 1999) that inhibit cell firing. Greater 5-HT1A expression in raphe nuclei is therefore thought to cause a depletion of serotonin elsewhere in the brain, linking increased levels of 5-HT1A to MDD pathophysiology. Post-mortem studies have shown that this effect is especially pronounced in the dorsal raphe nucleus (DRN) (Boldrini, Underwood, Mann, & Arango, 2008).
Positron emission tomography (PET) imaging allows examination of 5-HT1A in vivo, and several key findings have been made in the DRN. Using the selective 5-HT1A antagonist [11C]-WAY100635 (Forster et al., 1995), we previously reported the presence of higher 5-HT1A autoreceptor binding in the DRN in MDD compared to healthy volunteers (HV) as measured by BPF—the amount of available receptors times the affinity of those receptors for the tracer (Parsey et al., 2010; Parsey, Oquendo, et al., 2006). We also found that greater 5-HT1A BPF in the DRN is a sensitive (81.7%) and specific (84.8%) diagnostic marker of MDD in males (Kaufman et al., 2015).
However, the resolution of a single PET imaging study generally prevents distinguishing the DRN from other nuclei of the raphe. Thus, even though many PET studies implicate the DRN, they may in fact be imaging the raphe as a whole. This has been true for our own studies, as we previously delineated the DRN by drawing an ellipse around an area of high 5-HT1A density in the brainstem (Kaufman et al., 2015; Miller et al., 2013; Parsey et al., 2010; Parsey, Olvet, et al., 2006; Parsey, Oquendo, et al., 2006). Other studies have drawn a sphere in the midbrain only (Drevets, 2000; Hahn et al., 2010; Kraus et al., 2012). While this likely includes DRN, it may also include nearby raphe nuclei such as the median raphe nucleus (MRN). By combining 5-HT1A binding in the entire midbrain or pontine region, we may be missing critical differences related to mood disorders that reflect different functional roles of these raphe subdivisions. Other raphe nuclei include the MRN, caudal linear nucleus (CLN), raphe pontis (RPo), raphe magnus (RMg), raphe pallidus (RPa), and raphe obscurus (ROb), shown in Fig. 1. Neurons from CLN, DRN, and MRN project to the brain, while RPo, RMg, RPa, and ROb project to spinal cord (Hornung, 2003).
Fig. 1.
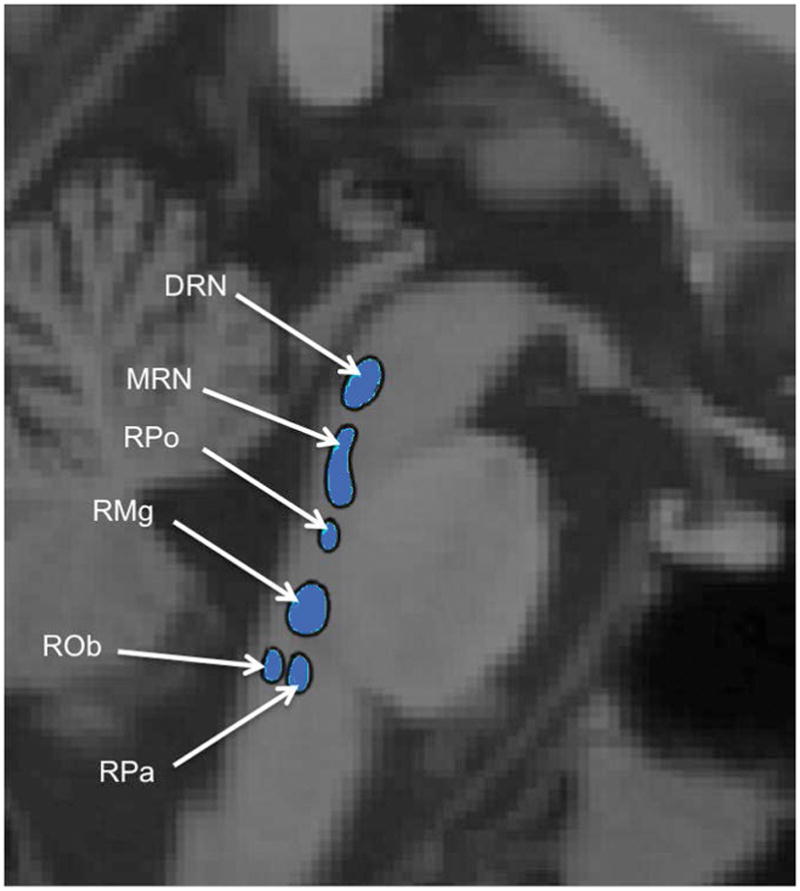
Schematic of individual raphe nuclei, adapted from Son et al. 2012 (Son et al., 2012). DRN: Dorsal Raphe Nucleus ; MRN: Median Raphe Nucleus ; RPo: Raphe Pontis ; RMg: Raphe Magnus ; ROb: Raphe Obscurus ; RPa: Raphe Pallidus. Caudal Linear Nucleus is not shown.
To identify individual raphe nuclei requires higher resolution and image contrast than generally observed in a single PET scan. To that end, we combined PET scans from 52 HV participants to create an average image. We used this image to delineate three distinct 5-HT1A-defined nuclei: DRN, MRN, and RMg (Fig. 2). This template was then applied to novel [11C]-WAY100635 data to quantify 5-HT1A autoreceptor binding in medication-free MDD and HV. We hypothesized that 5-HT1A BPF in the DRN and MRN would be higher in MDD relative to HV and would serve as a more accurate biomarker than the entire raphe, as these two nuclei send projections to forebrain areas known to be involved in MDD. As RMg innervates the spinal cord and serves sensorimotor functions, we hypothesized no difference in this region. Our previous work has shown that differences in raphe 5-HT1A binding between MDD and HV are greater in men than in women (Kaufman et al., 2015), and post-mortem, studies have also shown sex differences in binding (Boldrini et al., 2008). To best capture differences, we focused on men in this study.
Fig. 2.

Delineation of individual raphe nuclei from a [11C]-WAY100635 image. a: High resolution template brain (Holmes et al., 1998) in Montreal Neurological Institute space. b: Voxel [11C]-WAY100635 average BPF image over 52 healthy volunteers overlaid on MRI with ROIs labeled. DRN: dorsal raphe nucleus, MRN: median raphe nucleus, RMg: raphe magnus.
An objective biomarker for MDD has been highly sought after for decades (Kapur, Phillips, & Insel, 2012; Young et al., 2016). For a robust estimate of BPF diagnosis classification threshold, we calculated receiver operating characteristic (ROC) curves using an expanded simulated dataset based on each subject’s BPF value and a calculated standard error measurement of BPF.
Materials and Methods
Participants
The data used in this study were acquired under a protocol approved by the Institutional Review Boards of Columbia University Medical Center and the New York State Psychiatric Institute, compliant with the Code of Ethics of the World Medical Association (Declaration of Helsinki), and with informed written consent. 52 healthy volunteers were imaged to create the atlas and a separate cohort of forty-one male subjects were included in this analysis—25 were healthy volunteers (HV) and 16 met Diagnostic and Statistical Manual of Mental Disorders, Fourth Edition (DSM-IV) criteria for major depressive disorder (MDD). Data on these subjects have been reported previously (Kaufman et al., 2015; Miller et al., 2009; Parsey et al., 2010; Parsey, Oquendo, et al., 2006)—these studies reported differences in 5-HT1A binding in the raphe as a whole, but not individual nuclei. Diagnosis was made by consensus amongst senior clinical faculty based on a structured clinical interview for DSM-IV Axis I Disorders (SCID I) and on medical history. Functional impairment and depression severity were assessed using the 17-item Hamilton Depression Rating Scale (HDRS-17), Beck Inventory, and Global Assessment Scale. Inclusion criteria for subjects with MDD included: 1) age 18–65 years, 2) current episode as defined by DSM IV criteria for MDD, 3) antidepressant free for at least four years (based on reported differences in 5-HT1A binding with recent antidepressant use (Parsey et al., 2010)), with no other psychotropic medication for at least two weeks except benzodiazepines, which were discontinued at least three days prior to PET scanning, 4) absence of lifetime alcohol or substance abuse or dependence, 5) absence of lifetime exposure to MDMA (3,4-methylenedioxymethamphetamine, “ecstasy”), 6) absence of significant unstable medical conditions, 7) absence of psychosis, schizophrenia, or bipolar disorder, and 8) capacity to provide informed consent. Inclusion criteria for controls were similar, except for 1) absence of an axis I disorder, and 2) absence of a first degree relative with a history of a mood or psychotic disorder. Screening was verified via history, physical exams, and routine blood and urine tests.
Radiochemistry, Input Function Measures, and Image Acquisition and Analysis
[11C]-WAY100635 preparation, as well as measurement of arterial input function, metabolites, and plasma free fraction (fp) was performed as previously described (Parsey et al., 2000). Magnetic Resonance Imaging (MRI) and PET data were acquired as previously described (Parsey et al., 2010). Image processing was performed automatically through MATLAB (The Mathworks, Natick, Massachusetts), with extension to Functional Magnetic Resonance Imaging of the Brain’s (FMRIB’s) Linear Image Registration Tool (FLIRT v.5.2 (Jenkinson & Smith, 2001)) for coregistration, Brain Extraction Tool v1.2 (Smith, 2002) for skull-stripping, Statistical Parametric Mapping (SPM5) segmentation routines (Ashburner & Friston, 2005) to segment gray matter, white matter, and cerebrospinal fluid (CSF), and the Advanced Normalization Toolbox (ANTs (Avants, Epstein, Grossman, & Gee, 2008; Avants et al., 2011)) for normalization. All processing steps were checked by image analysts blind to MDD status for quality assurance.
Derivation of Outcome Measures
Regional distribution volumes for 11C-WAY100635 were derived as described previously (Parsey et al., 2010). The closest measure to in vitro binding potential for PET is BPF, or the product of available receptor density (Bavail, nM per g of tissue) and affinity (1/KD, nM per ml of brain). We have described optimal modeling used to calculate this measure elsewhere (Parsey et al., 2000); briefly, time activity curves (TACs) measured from PET scans were fit to a two tissue compartment model with plasma-to-tissue rate constants constrained to that of the cerebellar white matter, using an arterial input function. The last point in one patient’s time activity curve (TAC) for the median raphe nucleus (MRN) was removed as their BPF with that point included was millions of mL/cc, much higher than is physiologically plausible. Standard errors (SE) of BPF values were calculated using a bootstrapping technique that incorporates errors in plasma, metabolite, and brain data (Ogden & Tarpey, 2006).
Subdivision of the Raphe
Parametric binding potential (BPF) maps were generated at each voxel from 52 PET scans of healthy volunteers from a previous study using basis pursuit (Gunn, Gunn, Turkheimer, Aston, & Cunningham, 2002) (see Fig. 2), a data driven method that still allows for modeling considerations such as compartment modeling and reference regions (Gunn et al., 2002). This makes it well suited for a voxel analysis. A region-growing technique was used on an averaged BPF image to identify the raphe nuclei. Seeds were manually placed in regions of the raphe that showed high focal binding, and a hybrid level-set method was employed to delineate the nuclei. Basically, this technique iteratively grows and adjusts the boundaries of a given region from the manually placed seed until the standard deviation inside the region is significantly different from the space surrounding the region (Yan Zhang, Matuszewski, Shark, & Moore, 2008). This method yielded three loci, which we determined to correspond to dorsal raphe nucleus (DRN), median raphe nucleus (MRN), and raphe magnus (RMg) by comparison to an atlas. These nuclei had volumes of 168, 160, and 280 mm3, respectively. Since DRN and MRN both project to the forebrain, we defined an additional region of interest that encompassed both nuclei. All nuclei were identified as binary regions on an image in standard space, and treated as a template image that was nonlinearly warped to individual participants through their associated MRI image using the Advanced Normalization Toolbox (Avants et al., 2011). Proper warping and alignment of the atlas containing the raphe regions to individual participant MRIs was visually checked and validated by a trained technician. With the raphe nuclei defined for each subject, BPF was calculated within each region as described above.
Statistical analysis
A linear mixed model with weights and two weighted linear regression models were used to compare raphe nucleus values between HV and MDD groups in individual nucleus regions of interest (ROIs) and combined nucleus ROIs, respectively. Log-transformation was applied to BPF to normalize the distribution to meet model assumptions. Weights were defined as the reciprocal of standard error squared for each outcome. The two-way interaction term between subject group (HV vs MDD) and nuclei was considered. Dependence structures for modeling the correlation among nuclei from the same subject were selected based on Akaike Information Criteria. Compound Symmetry was used as the covariance structure in the final linear mixed model. P-values less than 0.05 were considered statistically significant and analysis was performed using SAS 9.4 (SAS Institute Inc., Cary, NC). Post-hoc t-tests were then carried out for group differences in each individual nucleus, and Bonferroni correction was used for to correct for multiple comparisons.
To examine whether BPF thresholds could distinguish someone with MDD versus someone without, receiver operating characteristic (ROC) analysis was performed using the BPF values of each nucleus. In order to approximate real-world BPF values in a generalized sample, 1000 simulated values were generated for each subject. These values were sampled from log normal distributions with mean and standard deviation determined by the subject’s BPF and standard error of BPF. Then, each of the 1000 simulated data points were fit to a logistic function with BPF as a predictive variable and the probability of having MDD as the outcome variable (defined as the log odds of having MDD for a given BPF). Using logistic regression outputs, ROCs were constructed, and Youden’s index (defined as the point maximizing the sum of sensitivity and specificity) was used to determine which BPF threshold could separate those with and without MDD with the greatest predictive performance. Averages and standard deviations of the area under the curve (AUC) and BPF cutoff thresholds were calculated.
A one-sided z-test for each participant was performed using simulated data, where the null hypothesis was that the participant’s measured mean BPF value was less than the threshold value (i.e. the patient does not have MDD). If the null hypothesis was rejected, the participant was classified as having MDD. A confusion matrix was constructed comparing the output of our classification system to the number of true positives (patients who were correctly identified as having MDD) and true negatives (HVs who were correctly identified as not having MDD). Sensitivity was calculated by dividing the number of participants the algorithm classified as having MDD by the number of true positives, while specificity was calculated by dividing the number of participants classified as HV divided by the number of true negatives.
Results
Comparison of Raphe Nuclei
Patient demographics are listed in Table 1. A linear mixed model including individual nuclei revealed a significant group (MDD vs HV) effect across all nuclei (p < 0.05), but no evidence for a group by nucleus interaction (p=0.22). However, linear regressions revealed that dorsal and median raphe nucleus (DRN and MRN) combined, as well as the entire raphe nucleus showed significantly higher 5-HT1A binding in patients with MDD compared with HV (both p < 0.01). DRN had statistically significantly higher 5-HT1A binding in MDD compared with HV (p < 0.01); binding in HV was, on average, 42% that of MDD patients. In the DRN and MRN combined and raphe as a whole, 5-HT1A binding was twice as high in MDD, on average, as in HV (Table 2). By contrast, on average, HV participants had 70% of binding found in MDD in both the MRN and RMg; this difference was not significant (p = 0.67 and p > 0.99, respectively, see Fig. 3 and 4).
Table 1.
Participant Demographics
| Healthy Volunteer | MDD | p-value | Test statistics value | DF | |
|---|---|---|---|---|---|
|
| |||||
| N | 25 | 16 | NA | ||
| Age +/− SD | 40.2 +/− 13.9 | 40.1 +/− 14.5 | 0.99 | 0 | 1 |
| HDRS Score +/− SD | 0.8 +/− 1.2 | 26.3 +/− 5.7 | < 0.01 | 304.83 | 1 |
| Education +/− SD | 15.7 +/− 3.0 | 10.9 +/− 3.9 | < 0.01 | 19.69 | 1 |
| Lifetime Aggression +/− SD | 15.3 +/− 3.4 | 19.4 +/− 6.1 | 0.07 | 4.01 | 1 |
| Global Assessment Scale +/− SD | 89.4 +/− 4.5 | 54.6 +/− 9.4 | < 0.01 | 257.66 | 1 |
| Hopelessness +/− SD | 2.0 +/− 2.3 | 12.0 +/− 6.9 | < 0.01 | 43.61 | 1 |
| Age of Onset +/− SD | NA | 20.1 | NA | ||
HDRS: Hamilton Depression Rating Scale, SD: Standard Deviation
Table 2.
Groupwise Comparison of BPF valuesa.
| Region | Ratio HV:MDD | 95% CIc Lower | 95% CI Upper | P-value | Test statistics value | Degrees of Freedom for t-tests |
|---|---|---|---|---|---|---|
| Raphe | 0.58 | 0.45 | 0.73 | <0.01*b | −4.61 | 39 |
| DRN | 0.42 | 0.25 | 0.70 | <0.01* | −3.39 | 78 |
| MRN | 0.70 | 0.43 | 1.12 | 0.67 | −1.55 | 78 |
| DRN + MRN | 0.52 | 0.39 | 0.68 | <0.01* | −4.79 | 39 |
| RMg | 0.70 | 0.23 | 2.09 | >0.99 | −0.65 | 78 |
Ratio values for DRN, MRN, and RMg were from a fitted linear mixed model, and Raphe and DRN+MRN values were from weighted simple linear regression. P values were from t-tests comparing these ratios with 1 and Bonferroni corrected for multiple comparisons by multiplying by 5.
*p < 0.05,
Confidence Interval
Fig. 3.
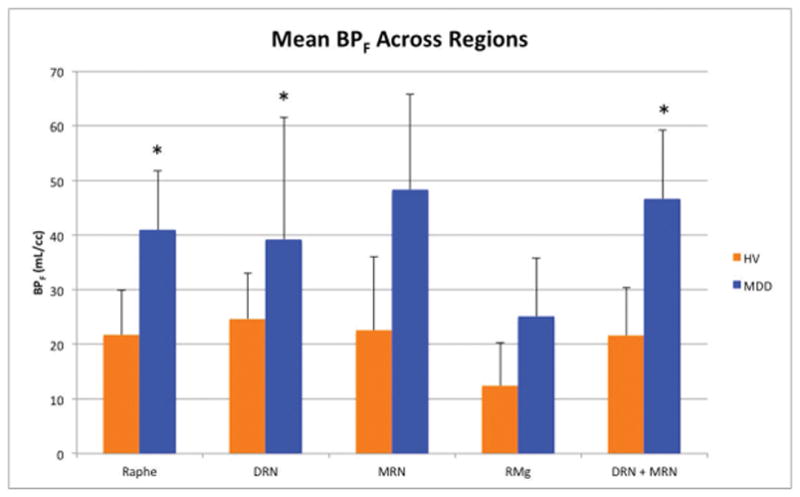
Groupwise comparison of BPF means across regions. P values were obtained using a linear mixed model and Bonferroni corrected. HV: Healthy volunteers, MDD: Participants with major depressive disorder, DRN: dorsal raphe nucleus, MRN: median raphe nucleus, RMg: raphe magnus, BPF: binding potential in milliliters per cubic centimeter, *: p < 0.05.
Fig. 4.

Dot plots illustrating separation in BPF values between groups for each ROI. BPF values above 300 mL/cc are not shown. Standard deviation for each point were calculated through bootstrapping. The thick horizontal bar represents the weighted mean and the thick vertical bars represent weighted standard errors of the mean. The dashed horizontal line represents a threshold BPF value, designed to maximize separation of HV from MDD. HV: Healthy volunteers, MDD: Participants with major depressive disorder, DRN: dorsal raphe nucleus, MRN: median raphe nucleus, RMg: raphe magnus, BPF: binding potential in milliliters per cubic centimeter.
Diagnosis Classification using nuclei BPF
Receiver Operating Characteristic (ROC) curve values for all nuclei can be found in Table 3. The DRN and MRN combined had the best performance, with a sensitivity of 94% and a specificity of 84% and an average AUC of 93%. The worst was RMg, with a specificity of 94% but a sensitivity of only 32% and an average AUC of 63% (Fig. 5).
Table 3.
Diagnostic Accuracy for each region of interest
| Region | Threshold* +/− SD (mL/cc) | Sensitivity* | Specificity* | AUC +/− SD |
|---|---|---|---|---|
|
| ||||
| DRN | 49.70 +/− 13.37 | 0.75 | 0.84 | 0.851 +/− 0.03 |
| MRN | 53.39 +/− 15.58 | 0.80 | 0.68 | 0.774 +/− 0.02 |
| RMg | 18.03 +/− 6.57 | 0.94 | 0.32 | 0.633 +/− 0.02 |
| DRN + MRN | 37.92 +/− 5.74 | 0.94 | 0.84 | 0.934 +/− 0.02 |
Note: Sensitivity and specificity were calculated by applying the thresholds decided based on Youden’s index onto the original data, not onto the simulated data.
Fig. 5.
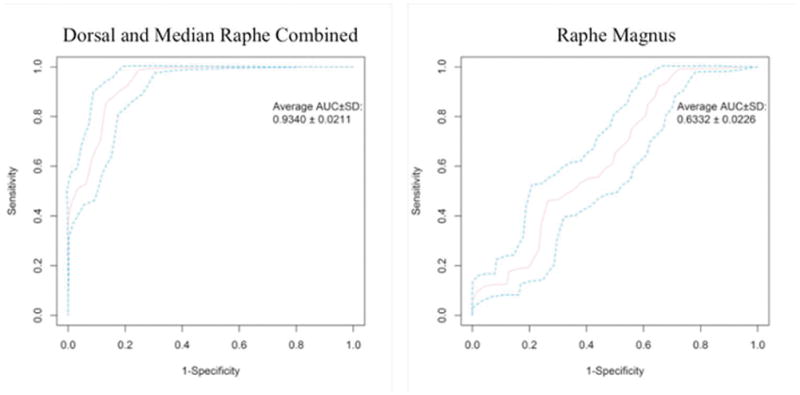
Receiver operating characteristic (ROC) curves for BPF thresholds separating participants with and without MDD in raphe magnus and dorsal and median raphe combined. AUC: area under the curve, followed by 95% confidence interval. Of all the nuclei examined, raphe magnus performs the worst as a diagnostic test (right), while dorsal and median raphe nucleus combined performs the best (left).
Discussion
We have improved our raphe-based biomarker for major depressive disorder (MDD) (Kaufman et al., 2015) by focusing on individual nuclei. Within our sample, we used BPF values as thresholds to objectively classify participants as having MDD or not, using ROC curves derived from simulated datasets to classify participants and evaluate diagnostic accuracy. As the simulated datasets contained BPF values that fell within the standard error for each participant, they represented a generalized expansion of our measured data. As greater standard error represents higher uncertainty regarding the measure, the simulated BPF values will be sampled from a greater range for those with higher standard error. Thus, we can realistically estimate an underlying population for each subject. As we did not have an external sample to test these thresholds, this analysis provides a robust method for testing accuracy that can yield greater predictive potential than delineating a diagnostic threshold from our dataset alone.
In terms of sensitivity and specificity, binding in the RMg performs much worse than the combination of DRN and MRN or DRN alone—in fact, greatest diagnostic accuracy can be obtained by grouping DRN and MRN and omitting RMg, which resulted in 94% sensitivity and 84% specificity, an increase from our previous finding of 81.7% sensitivity and 84.8% specificity over the raphe nucleus as a whole (Kaufman et al., 2015). This corresponds to what is known physiologically. The greatest evidence for 5-HT1A mediated autoregulation has been found in the DRN and MRN (Boldrini et al., 2008; Hopwood & Stamford, 2001). Moreover, DRN and MRN provide the majority of serotonergic fibers to the brain, while RMg projects to the spinal cord (Hornung, 2003). As MDD is considered a disorder of the brain, one would expect greater dysregulation in the DRN and MRN of depressed patients, particularly in the DRN, which supplies the majority of forebrain structures and regions such as the amygdala (Hornung, 2003).
We are not the first to examine individual raphe nuclei in vivo via PET imaging; others have delineated individual nuclei using the serotonin transporter (5-HTT) (Fazio et al., 2016; Son et al., 2014). An advantage to our approach of using 5-HT1A as opposed to 5-HTT is that 5-HT1A has a more specific differential distribution across the raphe nuclei (Stockmeier, Shapiro, Haycock, Thompson, & Lowy, 1996), which allows us to target somato-dendritic autoreceptors with greater precision. Using this sensitive measure we show that 5-HT1A binding in the DRN and MRN may be a valuable biomarker for MDD. 94% sensitivity of this combined region surpasses the median sensitivity of current assessments used in the clinic (85%), and 84% specificity surpasses the median specificity of 74% (Williams, Pignone, Ramirez, & Perez Stellato, 2002). In addition, this biomarker is objectively observable. An accurate and objective biomarker can be used for further examination of the disorder, including exploring subdiagnostic categories, evaluating more targeted treatment strategies, and identifying increased risk for MDD (Peterson & Weissman, 2011). Though PET imaging is expensive, the biological understanding it offers could aid researchers and clinicians substantially in understanding the neurobiological underpinnings of this disorder, which can improve treatment decisions, formulation of new research questions, and rational drug design. Importantly, a reliable PET-based biomarker using PET can also allow us to search for other, less costly surrogate markers that offer similar information. However, to have more confidence in this diagnostic accuracy will require validating the thresholds in an independent cohort with a larger sample size.
Anatomical projections of the DRN have been studied in rodents and monkeys (Wilson & Molliver, 1991a, 1991b). The rostral portion of the DRN contains the dorsal, ventral, ventrolateral and Interfascicular subnuclei, while the caudal DRN contains the caudal and interfascicular subnuclei. Tract-tracing studies indicated that neurons located in the rostral portion of the DRN project to caudate-putamen and substantia nigra, whereas caudal DRN neurons project to the hippocampus, amygdala and locus coeruleus in rodents (Azmitia, 1981; Imai, Steindler, & Kitai, 1986), and to the pineal gland in the golden hamster (Leander, Vrang, & Moller, 1998). Neurons of the medial DRN project to the medial PFC in the rat (Van Bockstaele, Biswas, & Pickel, 1993). The ventromedial and ventrolateral DRN project to the thalamus (Gonzalo-Ruiz, Lieberman, & Sanz-Anquela, 1995) and olfactory cortex (Datiche, Luppi, & Cattarelli, 1995). In macaque monkeys, the dorsal DRN is reported to have dorsolateral PFC as its cortical target (Charara & Parent, 1998; Wilson & Molliver, 1991b).
Given this information, and that post-mortem studies have shown higher 5-HT1A binding in MDD at the most rostral level of the DRN (Boldrini et al., 2008), it is surprising that DRN was not a better MDD biomarker than DRN and MRN combined. In fact, when comparing individual nuclei, the greatest difference between groups is found in the DRN. This is supported by previous post-mortem data. Tryptophan hydroxylase-immunoreactivity, corresponding to serotonergic neurons, is reported to be higher in MDD suicide victims compared with controls in the DRN, but not in the MRN (Boldrini, Underwood, Mann, & Arango, 2005).
However, with PET imaging, small regions such as individual nuclei are more susceptible to noise and partial volume effects. MRN was most affected by noise (possibly due to overlap with the caudal tail of DRN (Hornung, 2003) that exacerbated partial volume effects), but all three individual nuclei were noisier than the DRN + MRN and the entire raphe (Figure 4). Therefore on a practical level, larger ROIs are better for discrimination. However, the RN as a whole included the nonspecific RMg, which decreased our ability to differentiate HV from MDD. The ROI encompassing DRN and MRN, but not RMg, ended up as the best biomarker. Ideally, an improved method of image reconstruction could reduce noise and mitigate partial volume effects. This could help us determine whether the superiority of DRN + MRN over DRN alone is a biological effect of binding, or simply a volume effect.
While there was no difference between groups in 5-HT1A density in RMg, there are individual patients with MDD with particularly high binding in this region (Fig. 4). This may have clinical relevance on an individual level. The RMg plays a role in analgesia and pain perception; stimulation studies in MDD have revealed a lowered pain threshold relative to healthy comparisons (Boettger, Grossmann, & Bar, 2013; Klauenberg et al., 2008; Pinerua-Shuhaibar, Villalobos, Delgado, Rubio, & Suarez-Roca, 2011; Tikasz, Tourjman, Chalaye, Marchand, & Potvin, 2016; Zambito Marsala et al., 2015). Indeed, 5-HT1A activation may result in hyperalgesia (Y. Zhang, Gao, Yang, Huang, & Wu, 2000), perhaps through inhibition of centrally modulated analgesia. This could provide an explanation for known correlations between pain and depression severity (Brnabic, Lin, Monkul, Duenas, & Raskin, 2012; Brnabic, Raskin, Alev, Serap Monkul, & Lowry, 2012; Maneeton, Maneeton, & Srisurapanont, 2013; Robinson et al., 2013). Future studies involving RMg imaging would benefit from measures of pain sensitivity, as 5-HT1A binding in the RMg may represent a clinical phenotype.
An important limitation in our study was the sample size of 25 HV and 16 patients with MDD. However, the fact that we found these findings in this sample indicates that this finding is robust. Independent validation in a separate sample would not only be critical to confirming this, but would allow explorations of individual variability in RN binding and whether such variations correspond to different symptoms or subtypes of the disorder. Another limitation is that there is currently no “gold standard” for in vivo raphe nuclei receptor quantification that we can directly compare to our method. However, the concordance of our results with what has been supported in human post-mortem studies (Bach-Mizrachi et al., 2006; Boldrini et al., 2008) provides face validity. In addition, although 5-HT1A autoreceptors are a key regulator of serotonin release from the RN, other serotonin receptors such as 5-HT1B, 5-HT1D and 5-HT2B also provide autoregulation (Hopwood & Stamford, 2001; McDevitt & Neumaier, 2011). Therefore, even if 5-HT1A differences are nonsignificant in MRN and RMg, there may still be differences in serotonergic autoregulation between groups. Additionally, 5-HT1A receptor density may not correlate precisely with serotonin-producing neurons. 5-HT1A receptors are known to regulate other types of neurons such as GABA-producing interneurons (Monti, 2010).
A significant impediment to studying individual raphe nuclei is the spatial resolution of PET imaging. The full width half max of our scanner was 4.5 mm. Given the small size of these nuclei, our data will be susceptible to partial volume effects, which would decrease the apparent BPF of each nucleus. Partial volume correction can be performed, but these usually require an MRI-defined region—none exists for the raphe nucleus. This means that the differences we find in our study are likely underestimated; the finding of increased 5-HT1A density in patients with MDD suggests that this is due to a physiological difference, irrespective of these effects.
Finally, since our aim was to highlight differences between raphe nuclei as a clinical tool, we focused our analysis on males as much larger group differences in 5-HT1A binding are seen with them (Kaufman et al., 2015). In addition, though we have previously collected data from female participants, we did not obtain information that we now know plays a role in serotonin function, such as menstrual cycle and hormone levels (Endicott, 1993). Future analyses should include female participants with relevant covariates, particularly if there is a different distribution of 5-HT1A receptors among different nuclei between sexes. This is especially important, as MDD is more prevalent in females (Kessler et al., 2003). That being said, males with MDD still comprise millions of people (Karg et al., 2012). Given the sex differences in MDD, studying both sexes independently is important in studying and eventually treating this disorder.
Conclusions
Using an averaged serotonin 1A binding map obtained through PET imaging, we have delineated three of the raphe nuclei and applied these region labels to individual scans. Group differences in 5-HT1A are greatest when excluding the RMg from the raphe ROI, yielding a highly sensitive and specific biomarker. Across single nuclei, individuals with MDD have greater BPF than healthy volunteers in the DRN, but not in the MRN or RMg. This accords well with the fact that DRN projects to forebrain areas implicated in MDD. Our findings may allow for more detailed future study of MDD symptomatology and its relation to different raphe nuclei.
Acknowledgments
We acknowledge the biostatistical computation and support provided by the Biostatistical Consulting Core at School of Medicine, Stony Brook University. We also acknowledge the support in patient recruitment carried out by Dr. Greg Sullivan. The work was supported by the following grants: F30MH109412 (PI: Pillai), R01MH40695 (PI: Mann), P50MH062185 (PI: Mann), R01MH074813 (PI: Parsey), R01MH090276 (PI: Parsey), and K01MH091354 (PI: DeLorenzo) awarded by the National Institutes of Health, a Clinical and Translational Science Award (CTSA) from Columbia University, and grants from the American Foundation for the Prevention of Suicide (AFSP) and the National Alliance for Research on Schizophrenia and Depression (NARSAD).
Footnotes
Financial Disclosures
Dr. Oquendo receives royalties for the use of the Columbia Suicide Severity Rating Scale. Her family owns stock in Bristol Myers Squibb. Dr. Mann receives royalties for commercial use of the C- SSRS from the Research Foundation for Mental Hygiene and has stock options in Qualitas Health, a start up company making omega-3-fatty-acid products. Dr. Pillai, Ms. Zhang, Dr. Yang, Dr. Boldrini, Dr. Parsey, and Dr. DeLorenzo report no biomedical financial interests or potential conflict of interest.
References
- Ashburner J, Friston KJ. Unified segmentation. Neuroimage. 2005;26(3):839–851. doi: 10.1016/j.neuroimage.2005.02.018. [DOI] [PubMed] [Google Scholar]
- Avants BB, Epstein CL, Grossman M, Gee JC. Symmetric diffeomorphic image registration with cross-correlation: evaluating automated labeling of elderly and neurodegenerative brain. Med Image Anal. 2008;12(1):26–41. doi: 10.1016/j.media.2007.06.004. [DOI] [PMC free article] [PubMed] [Google Scholar]
- Avants BB, Tustison NJ, Song G, Cook PA, Klein A, Gee JC. A reproducible evaluation of ANTs similarity metric performance in brain image registration. Neuroimage. 2011;54(3):2033–2044. doi: 10.1016/j.neuroimage.2010.09.025. [DOI] [PMC free article] [PubMed] [Google Scholar]
- Azmitia EC. Bilateral serotonergic projections to the dorsal hippocampus of the rat: simultaneous localization of 3H-5HT and HRP after retrograde transport. J Comp Neurol. 1981;203(4):737–743. doi: 10.1002/cne.902030410. [DOI] [PubMed] [Google Scholar]
- Bach-Mizrachi H, Underwood MD, Kassir SA, Bakalian MJ, Sibille E, Tamir H, … Arango V. Neuronal tryptophan hydroxylase mRNA expression in the human dorsal and median raphe nuclei: major depression and suicide. Neuropsychopharmacology. 2006;31(4):814–824. doi: 10.1038/sj.npp.1300897. [DOI] [PubMed] [Google Scholar]
- Boettger MK, Grossmann D, Bar KJ. Thresholds and perception of cold pain, heat pain, and the thermal grill illusion in patients with major depressive disorder. Psychosom Med. 2013;75(3):281–287. doi: 10.1097/PSY.0b013e3182881a9c. [DOI] [PubMed] [Google Scholar]
- Boldrini M, Underwood MD, Mann JJ, Arango V. More tryptophan hydroxylase in the brainstem dorsal raphe nucleus in depressed suicides. Brain Res. 2005;1041(1):19–28. doi: 10.1016/j.brainres.2005.01.083. [DOI] [PubMed] [Google Scholar]
- Boldrini M, Underwood MD, Mann JJ, Arango V. Serotonin-1A autoreceptor binding in the dorsal raphe nucleus of depressed suicides. J Psychiatr Res. 2008;42(6):433–442. doi: 10.1016/j.jpsychires.2007.05.004. [DOI] [PMC free article] [PubMed] [Google Scholar]
- Brnabic A, Lin C, Monkul ES, Duenas H, Raskin J. Major depressive disorder severity and the frequency of painful physical symptoms: a pooled analysis of observational studies. Curr Med Res Opin. 2012;28(12):1891–1897. doi: 10.1185/03007995.2012.748654. [DOI] [PubMed] [Google Scholar]
- Brnabic A, Raskin J, Alev L, Serap Monkul E, Lowry A. Frequency and outcomes of painful physical symptoms in a naturalistic population with major depressive disorder: an analysis of pooled observational studies focusing on subjects aged 65 years and over. Int J Clin Pract. 2012;66(12):1158–1167. doi: 10.1111/ijcp.12014. [DOI] [PubMed] [Google Scholar]
- Charara A, Parent A. Chemoarchitecture of the primate dorsal raphe nucleus. J Chem Neuroanat. 1998;15(2):111–127. doi: 10.1016/s0891-0618(98)00036-2. [DOI] [PubMed] [Google Scholar]
- Datiche F, Luppi PH, Cattarelli M. Serotonergic and non-serotonergic projections from the raphe nuclei to the piriform cortex in the rat: a cholera toxin B subunit (CTb) and 5-HT immunohistochemical study. Brain Res. 1995;671(1):27–37. doi: 10.1016/0006-8993(94)01293-q. [DOI] [PubMed] [Google Scholar]
- de Montigny C, Blier P. Effects of antidepressant treatments on 5-HT neurotransmission: electrophysiological and clinical studies. Adv Biochem Psychopharmacol. 1984;39:223–239. [PubMed] [Google Scholar]
- Drevets WC. Functional anatomical abnormalities in limbic and prefrontal cortical structures in major depression. Prog Brain Res. 2000;126:413–431. doi: 10.1016/s0079-6123(00)26027-5. [DOI] [PubMed] [Google Scholar]
- Endicott J. The menstrual cycle and mood disorders. J Affect Disord. 1993;29(2–3):193–200. doi: 10.1016/0165-0327(93)90033-g. [DOI] [PubMed] [Google Scholar]
- Fazio P, Schain M, Varnas K, Halldin C, Farde L, Varrone A. Mapping the distribution of serotonin transporter in the human brainstem with high-resolution PET: Validation using postmortem autoradiography data. Neuroimage. 2016;133:313–320. doi: 10.1016/j.neuroimage.2016.03.019. [DOI] [PubMed] [Google Scholar]
- Forster EA, Cliffe IA, Bill DJ, Dover GM, Jones D, Reilly Y, Fletcher A. A pharmacological profile of the selective silent 5-HT1A receptor antagonist, WAY-100635. Eur J Pharmacol. 1995;281(1):81–88. doi: 10.1016/0014-2999(95)00234-c. [DOI] [PubMed] [Google Scholar]
- Gonzalo-Ruiz A, Lieberman AR, Sanz-Anquela JM. Organization of serotoninergic projections from the raphe nuclei to the anterior thalamic nuclei in the rat: a combined retrograde tracing and 5-HT immunohistochemical study. J Chem Neuroanat. 1995;8(2):103–115. doi: 10.1016/0891-0618(94)00039-v. [DOI] [PubMed] [Google Scholar]
- Gunn RN, Gunn SR, Turkheimer FE, Aston JA, Cunningham VJ. Positron emission tomography compartmental models: a basis pursuit strategy for kinetic modeling. J Cereb Blood Flow Metab. 2002;22(12):1425–1439. doi: 10.1097/00004647-200212000-00003. [DOI] [PubMed] [Google Scholar]
- Hahn A, Lanzenberger R, Wadsak W, Spindelegger C, Moser U, Mien LK, … Kasper S. Escitalopram enhances the association of serotonin-1A autoreceptors to heteroreceptors in anxiety disorders. J Neurosci. 2010;30(43):14482–14489. doi: 10.1523/jneurosci.2409-10.2010. [DOI] [PMC free article] [PubMed] [Google Scholar]
- Holmes CJ, Hoge R, Collins L, Woods R, Toga AW, Evans AC. Enhancement of MR images using registration for signal averaging. J Comput Assist Tomogr. 1998;22(2):324–333. doi: 10.1097/00004728-199803000-00032. [DOI] [PubMed] [Google Scholar]
- Hopwood SE, Stamford JA. Multiple 5-HT(1) autoreceptor subtypes govern serotonin release in dorsal and median raphe nuclei. Neuropharmacology. 2001;40(4):508–519. doi: 10.1016/s0028-3908(00)00192-1. [DOI] [PubMed] [Google Scholar]
- Hornung JP. The human raphe nuclei and the serotonergic system. J Chem Neuroanat. 2003;26(4):331–343. doi: 10.1016/j.jchemneu.2003.10.002. [DOI] [PubMed] [Google Scholar]
- Imai H, Steindler DA, Kitai ST. The organization of divergent axonal projections from the midbrain raphe nuclei in the rat. J Comp Neurol. 1986;243(3):363–380. doi: 10.1002/cne.902430307. [DOI] [PubMed] [Google Scholar]
- Jenkinson M, Smith S. A global optimisation method for robust affine registration of brain images. Med Image Anal. 2001;5(2):143–156. doi: 10.1016/s1361-8415(01)00036-6. [DOI] [PubMed] [Google Scholar]
- Kapur S, Phillips AG, Insel TR. Why has it taken so long for biological psychiatry to develop clinical tests and what to do about it? Mol Psychiatry. 2012;17(12):1174–1179. doi: 10.1038/mp.2012.105. [DOI] [PubMed] [Google Scholar]
- Karg RS, Bose J, Batts KR, Forman-Hoffman VL, Liao D, Hirsch E, … Hedden SL. CBHSQ Data Review. Rockville (MD): Substance Abuse and Mental Health Services Administration (US); 2012. Past Year Mental Disorders among Adults in the United States: Results from the 2008–2012 Mental Health Surveillance Study. [PubMed] [Google Scholar]
- Kaufman J, Sullivan GM, Yang J, Ogden RT, Miller JM, Oquendo MA, … DeLorenzo C. Quantification of the Serotonin 1A Receptor Using PET: Identification of a Potential Biomarker of Major Depression in Males. Neuropsychopharmacology. 2015;40(7):1692–1699. doi: 10.1038/npp.2015.15. [DOI] [PMC free article] [PubMed] [Google Scholar]
- Kessler RC, Berglund P, Demler O, Jin R, Koretz D, Merikangas KR, … Wang PS. The epidemiology of major depressive disorder: results from the National Comorbidity Survey Replication (NCS-R) Jama. 2003;289(23):3095–3105. doi: 10.1001/jama.289.23.3095. [DOI] [PubMed] [Google Scholar]
- Klauenberg S, Maier C, Assion HJ, Hoffmann A, Krumova EK, Magerl W, … Juckel G. Depression and changed pain perception: hints for a central disinhibition mechanism. Pain. 2008;140(2):332–343. doi: 10.1016/j.pain.2008.09.003. [DOI] [PubMed] [Google Scholar]
- Kraus C, Hahn A, Savli M, Kranz GS, Baldinger P, Hoflich A, … Lanzenberger R. Serotonin-1A receptor binding is positively associated with gray matter volume -- a multimodal neuroimaging study combining PET and structural MRI. Neuroimage. 2012;63(3):1091–1098. doi: 10.1016/j.neuroimage.2012.07.035. [DOI] [PubMed] [Google Scholar]
- Leander P, Vrang N, Moller M. Neuronal projections from the mesencephalic raphe nuclear complex to the suprachiasmatic nucleus and the deep pineal gland of the golden hamster (Mesocricetus auratus) J Comp Neurol. 1998;399(1):73–93. [PubMed] [Google Scholar]
- Maneeton N, Maneeton B, Srisurapanont M. Prevalence and predictors of pain in patients with major depressive disorder. Asian J Psychiatr. 2013;6(4):288–291. doi: 10.1016/j.ajp.2012.12.004. [DOI] [PubMed] [Google Scholar]
- McDevitt RA, Neumaier JF. Regulation of dorsal raphe nucleus function by serotonin autoreceptors: a behavioral perspective. J Chem Neuroanat. 2011;41(4):234–246. doi: 10.1016/j.jchemneu.2011.05.001. [DOI] [PMC free article] [PubMed] [Google Scholar]
- Miller JM, Brennan KG, Ogden TR, Oquendo MA, Sullivan GM, Mann JJ, Parsey RV. Elevated serotonin 1A binding in remitted major depressive disorder: evidence for a trait biological abnormality. Neuropsychopharmacology. 2009;34(10):2275–2284. doi: 10.1038/npp.2009.54. [DOI] [PMC free article] [PubMed] [Google Scholar]
- Miller JM, Hesselgrave N, Ogden RT, Zanderigo F, Oquendo MA, Mann JJ, Parsey RV. Brain serotonin 1A receptor binding as a predictor of treatment outcome in major depressive disorder. Biol Psychiatry. 2013;74(10):760–767. doi: 10.1016/j.biopsych.2013.03.021. [DOI] [PMC free article] [PubMed] [Google Scholar]
- Monti JM. The role of dorsal raphe nucleus serotonergic and non-serotonergic neurons, and of their receptors, in regulating waking and rapid eye movement (REM) sleep. Sleep Med Rev. 2010;14(5):319–327. doi: 10.1016/j.smrv.2009.10.003. [DOI] [PubMed] [Google Scholar]
- Ogden RT, Tarpey T. Estimation in regression models with externally estimated parameters. Biostatistics. 2006;7(1):115–129. doi: 10.1093/biostatistics/kxi044. [DOI] [PubMed] [Google Scholar]
- Parsey RV, Ogden RT, Miller JM, Tin A, Hesselgrave N, Goldstein E, … Mann JJ. Higher serotonin 1A binding in a second major depression cohort: modeling and reference region considerations. Biol Psychiatry. 2010;68(2):170–178. doi: 10.1016/j.biopsych.2010.03.023. [DOI] [PMC free article] [PubMed] [Google Scholar]
- Parsey RV, Olvet DM, Oquendo MA, Huang YY, Ogden RT, Mann JJ. Higher 5-HT1A receptor binding potential during a major depressive episode predicts poor treatment response: preliminary data from a naturalistic study. Neuropsychopharmacology. 2006;31(8):1745–1749. doi: 10.1038/sj.npp.1300992. [DOI] [PubMed] [Google Scholar]
- Parsey RV, Oquendo MA, Ogden RT, Olvet DM, Simpson N, Huang YY, … Mann JJ. Altered serotonin 1A binding in major depression: a [carbonyl-C-11]WAY100635 positron emission tomography study. Biol Psychiatry. 2006;59(2):106–113. doi: 10.1016/j.biopsych.2005.06.016. [DOI] [PubMed] [Google Scholar]
- Parsey RV, Slifstein M, Hwang DR, Abi-Dargham A, Simpson N, Mawlawi O, … Laruelle M. Validation and reproducibility of measurement of 5-HT1A receptor parameters with [carbonyl-11C]WAY-100635 in humans: comparison of arterial and reference tisssue input functions. J Cereb Blood Flow Metab. 2000;20(7):1111–1133. doi: 10.1097/00004647-200007000-00011. [DOI] [PubMed] [Google Scholar]
- Peterson BS, Weissman MM. A brain-based endophenotype for major depressive disorder. Annu Rev Med. 2011;62:461–474. doi: 10.1146/annurev-med-010510-095632. [DOI] [PMC free article] [PubMed] [Google Scholar]
- Pinerua-Shuhaibar L, Villalobos N, Delgado N, Rubio MA, Suarez-Roca H. Enhanced central thermal nociception in mildly depressed nonpatients and transiently sad healthy subjects. J Pain. 2011;12(3):360–369. doi: 10.1016/j.jpain.2010.08.002. [DOI] [PubMed] [Google Scholar]
- Pineyro G, Blier P. Autoregulation of serotonin neurons: role in antidepressant drug action. Pharmacol Rev. 1999;51(3):533–591. [PubMed] [Google Scholar]
- Robinson MJ, Sheehan D, Gaynor PJ, Marangell LB, Tanaka Y, Lipsius S, … Namiki C. Relationship between major depressive disorder and associated painful physical symptoms: analysis of data from two pooled placebo-controlled, randomized studies of duloxetine. Int Clin Psychopharmacol. 2013;28(6):330–338. doi: 10.1097/YIC.0b013e328364381b. [DOI] [PubMed] [Google Scholar]
- Smith SM. Fast robust automated brain extraction. Hum Brain Mapp. 2002;17(3):143–155. doi: 10.1002/hbm.10062. [DOI] [PMC free article] [PubMed] [Google Scholar]
- Son YD, Cho ZH, Choi EJ, Kim JH, Kim HK, Lee SY, … Kim YB. Individually differentiated serotonergic raphe nuclei measured with brain PET/MR imaging. Radiology. 2014;272(2):541–548. doi: 10.1148/radiol.14131547. [DOI] [PubMed] [Google Scholar]
- Son YD, Cho ZH, Kim HK, Choi EJ, Lee SY, Chi JG, … Kim YB. Glucose metabolism of the midline nuclei raphe in the brainstem observed by PET-MRI fusion imaging. Neuroimage. 2012;59(2):1094–1097. doi: 10.1016/j.neuroimage.2011.09.036. [DOI] [PubMed] [Google Scholar]
- Stockmeier CA, Shapiro LA, Haycock JW, Thompson PA, Lowy MT. Quantitative subregional distribution of serotonin 1A receptors and serotonin transporters in the human dorsal raphe. Brain Research. 1996;727(1):1–12. doi: 10.1016/0006-8993(96)00239-9. [DOI] [PubMed] [Google Scholar]
- Tikasz A, Tourjman V, Chalaye P, Marchand S, Potvin S. Increased spinal pain sensitization in major depressive disorder: A pilot study. Psychiatry Res. 2016;246:756–761. doi: 10.1016/j.psychres.2016.10.052. [DOI] [PubMed] [Google Scholar]
- Van Bockstaele EJ, Biswas A, Pickel VM. Topography of serotonin neurons in the dorsal raphe nucleus that send axon collaterals to the rat prefrontal cortex and nucleus accumbens. Brain Res. 1993;624(1–2):188–198. doi: 10.1016/0006-8993(93)90077-z. [DOI] [PubMed] [Google Scholar]
- Williams JW, Jr, Pignone M, Ramirez G, Perez Stellato C. Identifying depression in primary care: a literature synthesis of case-finding instruments. Gen Hosp Psychiatry. 2002;24(4):225–237. doi: 10.1016/s0163-8343(02)00195-0. [DOI] [PubMed] [Google Scholar]
- Wilson MA, Molliver ME. The organization of serotonergic projections to cerebral cortex in primates: regional distribution of axon terminals. Neuroscience. 1991a;44(3):537–553. doi: 10.1016/0306-4522(91)90076-z. [DOI] [PubMed] [Google Scholar]
- Wilson MA, Molliver ME. The organization of serotonergic projections to cerebral cortex in primates: retrograde transport studies. Neuroscience. 1991b;44(3):555–570. doi: 10.1016/0306-4522(91)90077-2. [DOI] [PubMed] [Google Scholar]
- Young JJ, Silber T, Bruno D, Galatzer-Levy IR, Pomara N, Marmar CR. Is there Progress? An Overview of Selecting Biomarker Candidates for Major Depressive Disorder. Front Psychiatry. 2016;7:72. doi: 10.3389/fpsyt.2016.00072. [DOI] [PMC free article] [PubMed] [Google Scholar]
- Zambito Marsala S, Pistacchi M, Tocco P, Gioulis M, Fabris F, Brigo F, Tinazzi M. Pain perception in major depressive disorder: a neurophysiological case-control study. J Neurol Sci. 2015;357(1–2):19–21. doi: 10.1016/j.jns.2015.06.051. [DOI] [PubMed] [Google Scholar]
- Zhang Y, Gao X, Yang ZL, Huang YL, Wu GC. Expression of 5-HT(1A) receptor mRNA in rat nucleus raphe magnus neurons after peripheral inflammation. Brain Res. 2000;887(2):465–468. doi: 10.1016/s0006-8993(00)03037-7. [DOI] [PubMed] [Google Scholar]
- Zhang Y, Matuszewski BJ, Shark L-K, Moore CJ. Set Method. IEEE; London, UK: 2008. Medical Image Segmentation Using New Hybrid Level; pp. 71–76. [DOI] [Google Scholar]