

Abstract
Behavioral Approach System (BAS) sensitivity has been implicated in the development of a variety of different psychiatric disorders. Prominent among these in the empirical literature are bipolar spectrum disorders (BSDs). Given that adolescence represents a critical developmental stage of risk for the onset of BSDs, it is important to clarify the latent structure of BAS sensitivity in this period of development. A statistical approach especially well-suited for delineating the latent structure of BAS sensitivity is taxometric analysis, which is designed to evaluate whether the latent structure of a construct is taxonic (i.e., categorical) or dimensional (i.e., continuous) in nature. The current study applied three mathematically non-redundant taxometric procedures (i.e., MAMBAC, MAXEIG, and L-Mode) to a large community sample of adolescents (n = 12,494) who completed two separate measures of BAS sensitivity: the BIS/BAS Scales (Carver & White, 1994) and the Sensitivity to Reward and Sensitivity to Punishment Questionnaire (Torrubia, Ávila, Moltó, & Caseras, 2001). Given the significant developmental changes in reward sensitivity that occur across adolescence, the current investigation aimed to provide a fine-grained evaluation of the data by performing taxometric analyses at an age-by-age level (14–19 years; n for each age ≥ 883). Results derived from taxometric procedures, across all ages tested, were highly consistent, providing strong evidence that BAS sensitivity is best conceptualized as dimensional in nature. Thus, the findings suggest that BAS-related vulnerability to BSDs exists along a continuum of severity, with no natural cut-point qualitatively differentiating high- and low-risk adolescents. Clinical and research implications for the assessment of BSD-related vulnerability are discussed.
Keywords: Behavioral Approach System, bipolar disorder, classification, latent structure, taxometrics
Introduction
Bipolar spectrum disorders (BSDs) can be severe mental illnesses that typically follow a chronic course, with a 50% relapse rate within the first year and 70% within five years (Pari, Simon, Wolstenholme, Geddes, & Goodwin, 2014). Their associated societal and economic burden is considerable (Fagiolini et al., 2013; Kleine-Budde et al., 2014). Indeed, BSDs rank among the 10 most debilitating health conditions worldwide (Kupfer, 2005). Children with BSDs receiving clinical care exhibit poorer functioning and greater rates of psychiatric hospitalization relative to same-age peers in clinical care (Findling et al., 2010). These disorders are associated with increased risk for adverse outcomes in adulthood, including chronic physical health conditions, substance abuse, suicide, and all-cause mortality (Cassidy, Ahearn, & Carroll, 2001; Hoang, Stewart, & Goldacre, 2011; McIntyre et al., 2006; Ösby, Brandt, Correia, Ekbom, & Sparén, 2001).
Recent evidence suggests that the initial prodromal period of bipolar disorder may last for a significant period of time (27.1 ± 23.1 months; Van Meter, Burke, Youngstrom, Faedda, & Correll, 2016). Unfortunately, although clinical intervention early in the course of these disorders has potential to produce long-term reductions in severity and associated impairment (McGorry, Purcell, Goldstone, & Amminger, 2011), most individuals with BSDs do not receive treatment until at least six years after disorder onset (Wang et al., 2005). Advancing our ability to characterize vulnerability to these disorders is therefore important, insofar as it may lead to earlier identification of at-risk individuals, and thus, a larger window of opportunity for prevention and early intervention. The current study focused on characterizing the latent structure of one vulnerability to BSDs within a theoretical framework increasingly studied within the context of these disorders, the Behavioral Approach System (BAS) or reward hypersensitivity model.
The Behavioral Approach System (BAS) Model and BSDs
BAS sensitivity, or reward sensitivity more broadly, has received substantial theoretical and empirical interest in the study of a variety of clinical and non-clinical participants, including substance use disorders (Franken & Muris, 2006; Hommer, Bjork, & Gilman, 2011), unipolar depression (Alloy, Olino, Freed, & Nusslock, 2016), and normative development (Galván, 2013). Among the most well-articulated and empirically studied models of BAS sensitivity is that describing the etiology of BSDs. According to this prominent theoretical model of BSDs, high BAS sensitivity is an important risk factor for these disorders (Alloy, Nusslock, & Boland, 2015; Alloy et al., 2016). Specifically, the BAS is a psychobiological system involved in regulating approach motivation and behavior in the pursuit of goals and rewards (Gray, 1991). The BAS is stimulated by reward-relevant stimuli and modulates goal striving and behavior related to goal attainment (Urosević, Abramson, Harmon-Jones, & Alloy, 2008). It is theorized that BAS hypersensitivity may serve as an etiological factor in the development of BSDs, leading to manic symptoms when it is elicited by goal striving/attainment and depressive symptoms when it is dampened by goal non-attainment (Alloy & Abramson, 2010; Alloy et al., 2015, 2016; Depue & Iacono, 1989; Urosević et al., 2008). Therefore, BAS hypersensitivity has been conceptualized as a vulnerability that may lead to the experience of both poles of bipolar disorder.
A range of evidence corroborates the tenets of the BAS or reward hypersensitivity model of BSDs. Indeed, research suggests that among adolescents, BAS hypersensitivity predicts the first onset of BSDs (Alloy, Bender, et al., 2012). Moreover, among those diagnosed with BSDs, BAS hypersensitivity has been found to predict the recurrence of BSD mood episodes (Alloy et al., 2008), increases in manic symptoms (Meyer, Johnson, & Winters, 2001), and the transition from milder to more severe forms of BSDs (Alloy, Urošević, et al., 2012). Moreover, symptom-level evidence supports this model, suggesting that life events characterized by goal-attainment or goal-striving predict manic and hypomanic symptom increases among those with BSDs (e.g., Johnson et al., 2000, 2008; Nusslock, Abramson, Harmon-Jones, Alloy, & Hogan, 2007). Furthermore, high goal-directed activity is one of the most common symptoms across pediatric bipolar subtypes (for a review, see Van Meter, Burke, Kowatch, Findling, & Youngstrom, 2016). Although no studies have examined whether neurophysiological indices of BAS sensitivity predict the onset of BSDs, electroencephalogram (EEG) studies have provided preliminary support for the BAS model of BSD development. For example, research suggests that those with BSDs are likely to have greater left frontal cortical activity (hypothesized to play a role in BAS sensitivity) during engagement in challenging tasks in the pursuit of goals (Harmon-Jones et al., 2008). Moreover, prospective research suggests that elevated left-frontal EEG activity in the resting state predicts a greater likelihood of transitioning to more severe forms of BSD (Nusslock et al., 2012).
Adolescence as a period of risk for BSD onset
In characterizing the latent structure of vulnerability to BSDs within the conceptual framework of the BAS/reward model, the current investigation focused specifically on adolescence, with analyses repeated at each age (in addition to in the whole sample), for several reasons. Relative to early childhood and adulthood, adolescence is a time of particular sensitivity to reward, in part accounting for increases in risky behaviors observed during this period of development (Blakemore & Robbins, 2012; Casey, Getz, & Galvan, 2008; Galván, 2013). Indeed, it is during this period of development that a key brain region in reward sensitivity, the ventral striatum (VS), involved in the anticipation and receipt of rewards, undergoes significant maturation (Delgado, Nystrom, Fissell, Noll, & Fiez, 2000). Neuroimaging research suggests that the VS exhibits greater reactivity during adolescence as compared to other periods of development during the receipt of rewards (Ernst et al., 2005; Galvan et al., 2006). Simultaneously, adolescents exhibit significant brain development in the prefrontal cortex, a region responsible for cognitive control (Davey, Yücel, & Allen, 2008; Lupien, McEwen, Gunnar, & Heim, 2009; Miller & Cohen, 2001). Thus, it is also a time of increased cognitive capability to focus on goal-directed behavior (Casey, Galvan, & Hare, 2005). Adolescence is therefore a particularly apt period for the study of BAS-related vulnerability to BSDs. Additionally, conducting especially fine-grained analyses (i.e., by age) is important in accounting for meaningful developmental changes in reward sensitivity and capability to pursue goal-directed behavior that occur across this period of development (Collado, Felton, MacPherson, & Lejuez, 2014; Steinberg et al., 2009).
The study of vulnerability to BSDs is also particularly relevant to adolescence, with increasing awareness of this developmental period as an age of risk for these disorders. Recent epidemiological estimates of BSDs in adolescents range from 2.1% for 12-month prevalence (Kessler et al., 2012) to 2.9% for lifetime prevalence (Merikangas et al., 2010). A recent meta-analysis of epidemiological studies found the prevalence rate across 12 studies to be 1.8% (Van Meter, Moreira, & Youngstrom, 2011). In comparison, epidemiological estimates of the prevalence rate of BSDs in adults range from 2.6% for 12 months to 3.9% for lifetime. When taken together, these findings suggest that the majority of individuals afflicted with these disorders may experience their first onset during adolescence. Indeed, an initial peak in risk for the onset of these disorders appears to occur around ages 15–19 (Alloy, Abramson, Walshaw, Keyser, & Gerstein, 2006; Oedegaard, Syrstad, Morken, Akiskal, & Fasmer, 2009), and there is some evidence that age 17 may be the earliest high-risk period for BSDs onset (Bellivier et al., 2003; Bellivier, Golmard, Henry, Leboyer, & Schürhoff, 2001). Collectively, these findings lend support to the view that characterizing vulnerability to BSDs during adolescence may be of special clinical value, inasmuch as the potential improved understanding of initial risk may facilitate earlier prevention, prior to disorder manifestation, and intervention early in the course of these disorders, thereby reducing risk for associated negative long-term outcomes and impairment.
Characterizing the latent structure of BAS-related vulnerability to BSDs
A statistical approach especially well suited for delineating the latent structure of BAS sensitivity is taxometric analysis. This family of statistical techniques is specifically designed to evaluate whether the latent structure of a construct is taxonic (i.e., categorical) or dimensional (i.e., continuous) in nature. That is, whereas traditional statistical methods (e.g., latent class analysis, cluster analysis) are more vulnerable to detecting spurious taxa (Solomon, Haaga, & Arnow, 2001), taxometric analysis is specifically appropriate for addressing this question because instead of assuming or imposing a specific latent structure on the data, it simultaneously compares the existing data to both categorical and continuous models to evaluate with which they better fit (Fraley & Waller, 1998). This statistical approach has been empirically validated (Ruscio, Ruscio, & Keane, 2004; Waller & Meehl, 1998), and has been increasingly applied to various forms of psychopathology, including negative symptoms of schizophrenia (Ahmed, Strauss, Buchanan, Kirkpatrick, & Carpenter, 2015), psychopathy (Murrie et al., 2007), attention-deficit/hyperactivity disorder (Marcus & Barry, 2011), and depression (Hankin, Fraley, Lahey, & Waldman, 2005; Liu, 2016; Richey et al., 2009), as well as cognitive vulnerability to depression (Gibb, Alloy, Abramson, Beevers, & Miller, 2004).
It is worth noting that three studies thus far have applied taxometric techniques to elucidate the latent structure of mania but with mixed results (Ahmed, Green, Clark, Stahl, & McFarland, 2011; Prisciandaro & Roberts, 2011; Prisciandaro & Tolliver, 2015). One of these found support for a taxonic solution, but with significant dimensional variation within the taxon (Ahmed et al., 2011), whereas support for a dimensional conceptualization of mania was reported in the two remaining studies (Prisciandaro & Roberts, 2011; Prisciandaro & Tolliver, 2015). Thus, further research is needed to clarify the latent structure of BSDs. This is particularly important for resolving diverging views toward conceptualizing BSDs specifically and psychopathology more generally (i.e., the dimensional approach promoted with the Research Domain Criteria; Insel et al., 2010; and the categorical conceptualization of mental disorders in DSM-5; American Psychiatric Association, 2013).
Furthermore, although taxometric studies of mania are etiologically informative insofar as dimensional constructs are multi-determined, whereas taxonic ones may conceivably emerge from single risk factors (Meehl, 1977; Meehl & Golden, 1982), it should not be assumed that dimensional outcomes originate from similarly dimensional risk factors and taxonic syndromes from categorical ones. To provide just one example from the mood disorders literature to illustrate this point, two studies have found evidence of a dimensional latent structure for adolescent depression (Hankin et al., 2005; Liu, 2016), despite a variant in the serotonin transporter gene (5-HTTLPR; i.e., a taxonic risk factor) being implicated in risk for this disorder (Thapar, Collishaw, Pine, & Thapar, 2012). Thus, it cannot be assumed from support for dimensionality in BSDs that underlying risk factors (e.g., BAS sensitivity) are likewise dimensional, or that evidence of BSDs being categorical is suggestive of similarly taxonic processes of risk. To date, one taxometric study has been conducted on temperamental risk for BSDs (Meyer & Keller, 2003). Although some support was found for hypomanic-hyperthymic temperament existing along a continuum, this early study was limited by its reliance on a single taxometric procedure (i.e., an absence of consistency tests that are now a standard part of taxometric research). Additional taxometric studies of the latent structure of risk factors for BSDs, such as BAS sensitivity, are therefore warranted.
The current study
The current investigation provides the first taxometric analysis of the latent structure of vulnerability to BSDs, focusing specifically on BAS sensitivity. A challenge that should be mentioned in conducting taxometric studies is the minimum n of 300 that is generally recommended to ensure valid analyses. Taxometric analyses with smaller samples tend to produce unstable curves in the resulting graphical output, and thus, are biased toward spurious taxonic findings (Meehl, 1995). Additionally, samples substantially larger than the minimum required for taxometric analysis (n ≥ 300), such as is the case in the current study, may offset potential concerns of low taxon base rates insofar as they yield a sufficiently higher raw number of cases of the putative taxon (Ruscio & Ruscio, 2004).1 In drawing from a large community sample of adolescents, the current study is uniquely well suited for conducting fine-grained, age-by-age analyses (n for each age ≥ 883).
Methods
Participants
Participants in the current study were drawn from the first phase of a two-phase screening procedure for inclusion in a study designed to examine the onset of BSDs among adolescents (Project TEAM; Alloy, Bender, et al., 2012). A total of 12,494 students from 13 Philadelphia public high schools (ages 14–18) and two universities (ages 17–19) were screened during the first phase of the screening process; they completed measures assessing demographic information as well as two self-report questionnaires measuring BAS sensitivity. Those scoring in the highest 15th percentile (categorized as High BAS) or middle 40th–60th percentile (categorized as Moderate BAS) on both self-report measures of BAS sensitivity were invited to complete the Phase II screening procedures to determine eligibility for participation in the prospective study (for more information, see Alloy, Bender, et al., 2012). Given the focus of the current study on characterizing the latent structure of BAS-related vulnerability to BSDs, all Phase I participants were retained in the analyses (n = 12,494).2 As detailed in Table 1, the number of participants at each age well exceeds the minimum of 300 recommended to conduct age-by-age analyses (Meehl, 1995). Participants ranged in age from 14–19 (mean = 17.54 years; SD = 1.56) and were 63.51% female and 8.15% Hispanic. The racial composition of the sample was 58.86% White, 21.09% African American, 12.46% Asian, and 7.58% other. Participants who were ages 18 or older provided their own written consent. For participants who were under 18, we obtained written parental consent and written assent from the adolescent. The current study’s procedures were approved by the Temple University Institutional Review Board.
Table 1.
Summary of taxometric analyses
| Age group | Indicator correlations
|
Cohen’s d | Comparison curve fit index
|
|||||
|---|---|---|---|---|---|---|---|---|
| rfull sample | rtaxon | rcomplement | MAMBAC | MAXEIG | L-Mode | Mean | ||
| All ages (n = 12,494) | .369 | .060 | .056 | 1.297 – 1.485 | .278 | .209 | .103 | .197 |
| 14-year-olds (n = 903) | .363 | .073 | .037 | 1.301 – 1.505 | .325 | .221 | .181 | .242 |
| 15-year-olds (n = 1,124) | .327 | .036 | .012 | 1.249 – 1.469 | .265 | .165 | .162 | .197 |
| 16-year-olds (n = 883) | .369 | .062 | .035 | 1.324 – 1.522 | .154 | .313 | .151 | .206 |
| 17-year-olds (n = 902) | .378 | .059 | .059 | 1.272 – 1.580 | .254 | .163 | .189 | .202 |
| 18-year-olds (n = 4,802) | .376 | .083 | .053 | 1.295 – 1.487 | .261 | .265 | .154 | .227 |
| 19-year-olds (n = 3,880) | .374 | .071 | .059 | 1.293 – 1.508 | .229 | .244 | .126 | .200 |
Note: Cohen’s d = difference between the putative taxon and complement standardized using pooled within-group variances weighted by degrees of freedom; L-Mode = latent mode; MAMBAC = means above minus below a cut; MAXEIG = maximum eigenvalue.
Measures
The Behavioral Inhibition System/Behavioral Activation System Scale (BIS/BAS; (Carver & White, 1994) was the first measure administered to assess individuals’ BAS sensitivity. The questionnaire, which assesses both BAS sensitivity and behavioral inhibition system sensitivity, includes 20 items using a 4-point Likert-type scale ranging from strongly disagree (1) to strongly agree (4). A BAS-Total score is calculated by summing all BAS items, with higher scores indicating higher BAS sensitivity. The BAS-Total scale comprises three subscales: BAS-Reward Responsiveness (BAS-RR), BAS-Drive (BAS-D), and BAS-Fun Seeking (BAS-FS). The BAS-RR (5-items) assesses positive response to rewards, the BAS-D (4 items) assesses persistence in pursuit of a desired reward, and the BAS-FS (4 items) assesses a willingness impulsively to seek out rewarding stimuli. The three BAS subscales were used as separate taxometric indicators in the analyses. The BIS/BAS subscales have demonstrated good internal consistency and test-retest reliability (Carver & White, 1994). In the current study, the BAS subscales evidenced adequate to good internal consistency (BAS-D = .73; BAS-FS = .63; BAS-RR = .70).
The Sensitivity to Punishment and Sensitivity to Reward Questionnaire (SPSRQ; Torrubia, Ávila, Moltó, & Caseras, 2001) was the second self-report measure administered to assess BAS sensitivity. The SPSRQ was designed to improve upon weaknesses observed in the BIS/BAS scales’ item content, to augment its construct validity, and to be more theoretically aligned with Gray’s BIS/BAS theory (Torrubia et al., 2001). This measure comprises two subscales, assessing sensitivity to reward (SR) and punishment (SP); in the current study, the SR subscale was used to measure BAS sensitivity (Alloy, Bender, et al., 2012). The SR subscale includes 24 items assessed with “yes” and “no” responses. Research suggests that the SR subscale has evidenced good internal consistency and test-retest reliability (Torrubia et al., 2001). In the current study, the SR subscale was included in analyses as a taxometric indicator.3 The internal consistency of the SR subscale was good (Cronbach’s α = .76).
Data analysis
Taxometric analysis requires multiple indicators reflecting different aspects of the underlying construct of interest, and collectively, these indicators should have content validity. In deciding upon appropriate taxometric indicators to use in analysis, one common approach is to adopt the theoretically or empirically derived subscales of the study measures. The three BAS subscales of the BIS/BAS and the Sensitivity to Reward subscale of the SPSRQ were therefore selected as taxometric indicators in the current study.
A central feature of taxometric methods is the implementation of multiple mathematically non-overlapping procedures that yield non-redundant results, with each procedure providing a consistency test for the others. Consistency in results produced across multiple procedures provides confidence in the conclusions drawn regarding the latent structure of the construct of interest. Three distinct taxometric procedures were adopted in the current investigation: MAMBAC (mean above minus below a cut; Meehl & Yonce, 1994), MAXEIG (maximum eigenvalue; Waller & Meehl, 1998), and L-Mode (latent mode; Waller & Meehl, 1998).
MAMBAC requires at least two valid indicators, one functioning as the input indicator and another functioning as the output indicator. The difference in mean scores of the output indicator above and below a sliding cut-off score on the input indicator is plotted on the y-axis as a function of the input indicator cut-points on the x-axis. This procedure is repeated for every possible pair of indicators, with each indicator in a pair alternating as the input and output indicator. Thus, two graphical MAMBAC plots are generated for each pair of indicators. In the current study, 50 cuts were made along each input indicator. A final MAMBAC curve is produced by averaging the results of these analyses.
For MAXEIG, at least three indicators are required. One indicator functions as the input indicator, and the interrelationship between the remaining indicators is evaluated in a series of overlapping “windows” (i.e., subsamples) ordered along the input indicator. Based on optimal analysis parameters (Walters & Ruscio, 2010), the sample in the current study was split into 25 windows with 90% overlap between adjacent windows. The covariance matrix for the output indicators (variance values are replaced with 0’s ensuring that only covariances remain) in each window is factor analyzed, and the eigenvalue of the first principal factor is then plotted on the y-axis of a graph, with the windows of the input indicator on the x-axis. This procedure is repeated with each indicator functioning as the input indicator.
L-Mode similarly requires at least three indicators. This is a factor analytic procedure for disambiguating between taxonic and dimensional structures. It calculates the factor scores of cases on a one-factor latent variable, with the factor score density plot of the entire distribution then plotted. A bimodal distribution of factor score estimates indicates a taxonic latent structure. A continuous latent structure, however, is indicated by a distribution of factor score estimates that is unimodal.
For each taxometric procedure, simulated taxonic and dimensional comparison data were generated, approximating all distribution properties of the empirical data known to influence the shape of taxometric curves. That is, the simulated data were identical to the research data in terms of surface-level statistical properties of the observed indicators, such as sample size, means, standard deviations, indicator skew, and inter-indicator correlations, differing only in terms of latent structure. Additionally, and following procedures adopted in prior taxometric studies (e.g., Ruscio, 2010), the three taxometric techniques were initially conducted without comparison data so as to obtain mean base rate estimates of the putative taxon, which were then used in generating the simulated data.4 The results for the empirical data were directly compared with those for simulated taxonic and dimensional data to ascertain which they most closely matched. Data for each model (i.e., taxonic and dimensional) were simulated 100 times to approximate sampling distributions for each model for each of the three taxometric procedures used in the current study. This approach of comparing the empirical data to simulated models of taxonicity and dimensionality with identical statistical properties allows for a much more accurate comparison than would be the case with a prototypical model.
The comparison curve fit index (CCFI) was calculated for each taxometric procedure as an objective measure of the degree to which the results matched the simulated taxonic or dimensional comparison data (Ruscio, Ruscio, & Meron, 2007). It compares the root-mean-square residual of the fit between the curve for the actual data and for each of the simulated comparison curves. CCFI values range from 0 (dimensional structure) to 1 (taxonic structure), with 0.50 being equally consistent with dimensional and taxonic structures (Ruscio, Walters, Marcus, & Kaczetow, 2010). CCFI values between the dual thresholds of 0.45 and 0.55 are reflective of ambiguous results (Walters & Ruscio, 2013). These dual thresholds have an accuracy rate of 98.2% for MAMBAC, 95.8% for MAXEIG, and 97.3% for L-Mode (Ruscio et al., 2010). The CCFI is a relatively recent development in taxometric research, but an important advancement that appears to have resulted in appreciably reduced rates of pseudotaxa in the taxometric literature (Haslam, Holland, & Kuppens, 2012). All analyses were conducted using Ruscio’s (2012) taxometric packages for the R programming language in MRO 3.3.2.
Results
Indicator suitability
Indicator properties, including correlations, and validity, were evaluated to determine suitability for taxometric analysis. Indicator correlations are required to be substantially smaller within the putative taxon and complement groups than within the full sample to avoid nuisance covariance (Ruscio, Haslam, & Ruscio, 2006). The traditional recommendation is for within-group indicator correlations to be < 0.3, and full sample indicator correlations to be > 0.3 (Meehl, 1995). More recently, it has been suggested that a more important consideration is for a sizeable difference to exist between the full-sample and within-group indicator correlations (Ruscio et al., 2006; Walters, 2008). This condition was satisfied in analyses across all age groups, with full sample rs ≥ .327, and taxon and complement rs ≤ .083. Another recommendation is that the constructed indicators separate the putative taxon from its complement at Cohen’s d ≥ 1.25 to achieve an acceptable minimum validity (Meehl, 1995; Meehl & Yonce, 1996). This condition also was generally satisfied across all age groups in the current study.5 A summary of indicator validity, as well as indicator correlations in the full sample, the putative taxon, and complement, are presented in Table 1.
Descriptive analyses
Full sample correlations, means, and standard deviations for age and the four taxometric indicators are summarized in Table 2. Correlations between indicators ranged from r = .25 to r = .44. Age was weakly correlated with the taxometric indicators, with rs ranging from −.02 to .05.
Table 2.
Correlations between taxometric indicators and age for the full sample.
| Variable | 1 | 2 | 3 | 4 | 5 |
|---|---|---|---|---|---|
| 1. Age | – | ||||
| 2. BAS Drive | .05*** | – | |||
| 3. BAS Fun-Seeking | .01 | .44*** | – | ||
| 4. BAS Reward Responsiveness | −.02* | .40*** | .41*** | – | |
| 5. SPSRQ – Reward | .03** | .37*** | .35*** | .25*** | – |
| Mean | 17.54 | 10.69 | 11.62 | 16.55 | 11.99 |
| Standard Deviation | 1.56 | 2.27 | 2.12 | 2.27 | 4.33 |
Note: BAS = Behavioral Approach System; SPSRQ = Sensitivity to Punishment and Sensitivity to Reward Questionnaire
p < .05,
p < .01,
p < .001.
Taxometric analyses
MAMBAC analyses produced 12 curves for each age group. The average of each set of 12 curves was compared to simulated categorical and dimensional MAMBAC data. Clear and consistent support for a dimensional solution was observed across and within each age, with CCFIs ≤ .325. Similarly, MAXEIG curves resembled simulated dimensional data much more closely than simulated categorical data, with CCFIs ≤ .313. Again, across and within each age, L-Mode procedures yielded unimodal distributions and CCFIs ≤ .189, thus providing unambiguous support for a dimensional latent structure for BAS sensitivity. Finally, the mean CCFIs (≤ .242) across all three taxometric procedures for each age group and the full sample were clearly supportive of the view that BAS sensitivity exists along a continuum. Figure 1 illustrates the averaged MAMBAC, MAXEIG, and L-Mode curves, respectively, relative to simulated categorical and dimensional data, and CCFIs for each analysis are summarized in Table 1.
Figure 1.


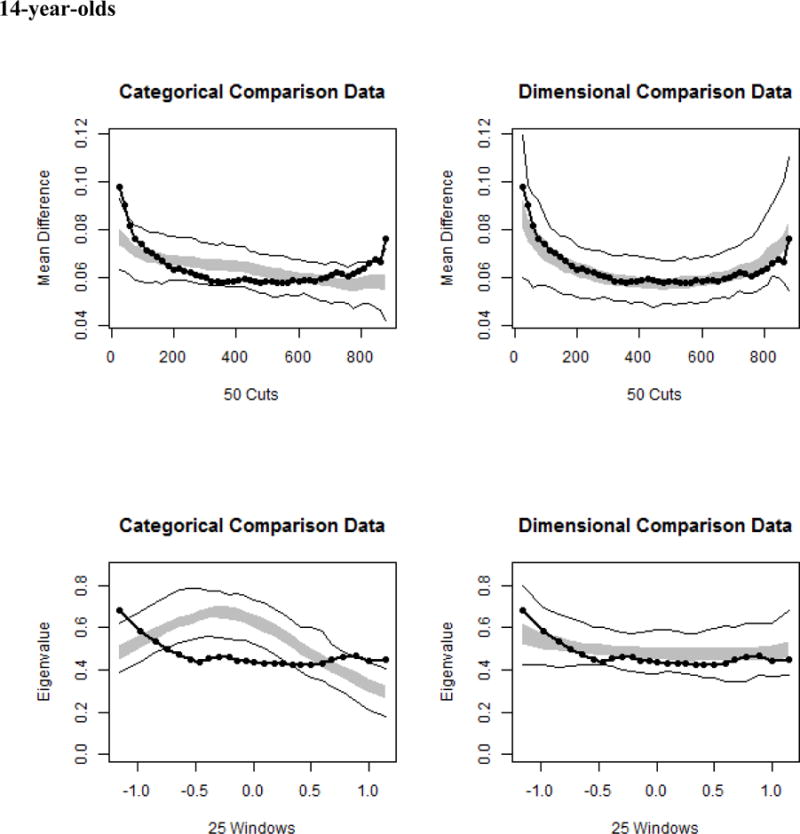


Taxometric results across the full sample and each age, with sample data shown relative to simulated taxonic and dimensional data. In each graph, the average curve for the sample data are represented by a dark line, with the gray area reflecting the middle 50% of the simulated values, and the light lines indicating the minimum and maximum simulated values at each data point. The top panels illustrate results for averaged MAMBAC curves, the middle panels portray averaged MAXEIG curves, and the bottom panels depict results for averaged L-Mode curves.
Discussion
The current study sought to characterize the latent structure of vulnerability to BSDs as conceptualized within the BAS/reward model. Specifically, we applied taxometric procedures to data from 12,494 adolescents to ascertain if BAS-related vulnerability to BSDs aligned more with a categorical or continuous latent structure. In recognition of the significant developmental changes in reward sensitivity that occur across adolescence, the current investigation provided a fine-grained evaluation of the data, with taxometric analyses being conducted at an age-by-age level. The results of these analyses were consistent in yielding unambiguous support for a dimensional solution across all age groups, reflecting the stability of the latent structure of this construct across adolescence. More specifically, BAS-related vulnerability to BSDs appears to exist along a continuum of severity, with no natural cut-point qualitatively differentiating a group of high-risk individuals from those at lower risk. This consistency in findings across age aligns with the finding that the indicators of BAS sensitivity were consistent across age. It should be noted that the absence of differences regarding taxonic versus dimensional solutions across age should not be taken to indicate that there are no age differences in reward sensitivity. Although evidence of taxonicity for some age groups and dimensionality for others would be supportive of the existence of developmental differences, the absence of such differences cannot be inferred from consistency in taxometric solutions across age groups. That is, it is entirely possible that important age differences in reward sensitivity exist with this construct still being dimensional across age.
The finding that BAS sensitivity exists along a natural continuum has several important implications for the study and treatment of BSDs. First, among existing theoretical conceptualizations of risk for BSDs, diathesis-stress models figure prominently (Alloy et al., 2006; Johnson & Roberts, 1995). According to these etiological models of BSDs, exposure to certain life events appear to confer heightened risk for a bipolar episode (e.g., goal striving or attainment events and schedule-disrupting life events in the case of mania, and negative or goal non-attainment life events in the case of depressive episodes; Alloy et al., 2015; Johnson, 2005). Not all individuals exposed to these life events, however, go on to experience a manic or depressive episode. Rather, these life events are believed to interact with pre-existing diatheses in vulnerable individuals, leading to the development of affective episodes.
Although certain important features of this basic diathesis-stress conceptualization of BSDs have yet to be empirically evaluated, the current findings may lend some measure of clarity, and thereby inform future research in this area. In particular, within this basic etiological model of BSD, several characterizations of relevant diatheses are hypothetically possible and have different theoretical implications (Monroe & Simons, 1991). For example, if a distinct threshold or cut-point exists for a given diathesis, only individuals with a diathetic loading above the cut-point would be at risk for experiencing an affective episode when confronted with etiologically relevant life events of sufficient magnitude, and individuals with diathetic loadings below the cut-point should be relatively impervious to the effects of these life events. In such cases, the diathesis is necessary but not sufficient to trigger an affective episode. A taxonic latent structure for a given diathesis would be entirely consistent with this possibility. The findings of the current study do not fit this model well. Alternatively, if no diathetic cut-point exists, a titration model may potentially be more applicable. According to this model, the etiological importance of life events and a given diathesis are dependent on each other, such that a high diathetic loading may be sufficient to trigger an affective episode in the presence of relatively minor life events, whereas a low diathetic loading similarly would require relatively major life events to precipitate an affective episode. A dimensional latent structure, as observed in the current study, is congruent with this possibility. Finally, it should be noted that although BAS-related vulnerability to BSDs appear to be more supportive of a titration model of risk for these disorders, it cannot be inferred that this model holds true in general for other diatheses for BSDs. Indeed, genetic diatheses, with their inherent diathetic thresholds, have been identified for these disorders (Nurnberger et al., 2014).
In addition to advancing our theoretical understanding of the etiology of BSDs, clarifying the latent structure of vulnerability to these disorders is important insofar as it may directly inform design considerations in future studies. Specifically, evidence of a dimensional latent structure for BAS-related vulnerability for BSDs indicates that large, unselected samples of the population of interest may be particularly well suited for evaluating the association between this diathesis and BSDs (Ruscio et al., 2006). This is not to say, however, that adopting cut-points to categorize participants is necessarily inadvisable for studying dimensional diatheses in relation to a clinical outcome. Whereas reducing dimensional constructs into artificial dichotomies is problematic because of its attendant loss of measurement precision and statistical power, as well as increased risk for spurious findings in some cases (MacCallum, Zhang, Preacher, & Rucker, 2002; Maxwell & Delaney, 1993; Ruscio & Ruscio, 2002), the alternative of selecting for and studying individuals with particularly high diathetic loading on the diathesis of interest may be justifiable in certain situations. As an example, and in contrast to the practice of dichotomizing continuous scores on a dimensional variable, the high-risk research design involves screening for and selecting participants based on high and low loadings on a diathesis, and then comparing these individuals in relation to the clinical outcome (Carter & Garber, 2011; Goodman & Gotlib, 1999; Haeffel et al., 2005; Just, Abramson, & Alloy, 2001). This strategy ensures greater variability in the diathesis of interest, which substantially enhances the ability statistically to detect interactions through reducing standard errors and without compromising parameter estimates (Carter & Garber, 2011; McClelland & Judd, 1993). Such an approach may be adopted to amplify statistical power when available resources do not permit a longitudinal assessment of the diathesis in relation to a relatively low-base rate clinical outcome, such as BSDs, in an otherwise larger unselected sample.
From a clinical perspective, the findings of the current study highlight the challenge of accurately identifying individuals at risk for BSDs in a way that effectively informs preventive strategies. That is, the absence of a discrete taxon for BAS-related vulnerability to BSDs underscores the importance of evaluating this diathesis as part of a larger constellation of relevant risk factors in determining who is particularly in need of early prevention efforts. Additionally, evidence that BAS-related vulnerability to BSDs exists along a continuum of severity is informative for clinical intervention protocols specifically targeting this diathesis; in contrast to taxonic diatheses that are hypothesized to change in a digital all-or-none manner (Strube, 1989), dimensional constructs should exhibit a more graded response to intervention efforts. Importantly, although not the clinical areas of focus in the present investigation, BAS sensitivity has been implicated in a range of other psychological disorders. For example, BAS hyposensitivity is correlated with the presence of unipolar depression, with some evidence that it may be a vulnerability factor for this disorder (for a review, see Alloy et al., 2016). Moreover, research suggests that BAS hypersensitivity is associated with and may underpin substance use (e.g., Franken & Muris, 2006; Hommer, Bjork, & Gilman, 2011). Thus, the findings in the present study suggest similar guidance to the approach to these and related disorders in terms of both prevention and intervention. Our findings offer interesting insight from a non-clinical perspective as well. Developmental and personality researchers may consider investigating the latent structure of BAS sensitivity further over the course of early childhood and adulthood in order to inform our understanding of this personality feature in the general population over the life course.
This study is notable for being the first investigation of vulnerability to BSDs to apply modern taxometric techniques. Moreover, it focused on a period of development – adolescence – of particular clinical relevance, a time when many individuals experience their first onset of these disorders. Given the low lifetime prevalence of BSDs in adolescents, especially relative to other forms of psychopathology (e.g., depression, externalizing disorders, and substance use disorders; Merikangas et al., 2010), and the consequently quite substantial sample size required for adequately conducting taxometric analyses with related constructs (Meehl, 1995; Ruscio et al., 2006; Ruscio & Ruscio, 2004), the current study was uniquely suited for this purpose.
Nonetheless, the limitations of this study are worth noting. In particular, the indicators of BAS sensitivity were entirely derived from self-report data. Self-report measures may be limited inasmuch as individuals have imperfect insight into the processes underlying their behavior. This is especially the case for affective and cognitive processes occurring, at least in part, outside of the individual’s conscious awareness (Nisbett & Wilson, 1977). Additionally, several studies have found modest correlations between self-report and behavioral or physiological measures of several constructs, including conceptually related ones such as anhedonia (Rizvi, Pizzagalli, Sproule, & Kennedy, 2016) and self-control (Duckworth & Kern, 2011). In accounting for this pattern of findings, several researchers have suggested that self-report and behavioral measures may, in some measure, reflect different aspects of the same underlying construct (Amstadter et al., 2012; Cyders & Coskunpinar, 2011; Lobbestael, Arntz, & Wiers, 2008; McHugh et al., 2011). For these reasons, it would be important for future taxometric research to adopt a multi-method approach to measuring vulnerability to BSDs (e.g., by including a behavioral measure of reward sensitivity). At present, taxometric studies employing measures of the same construct across multiple units of analysis are exceedingly rare.
Acknowledgments
This research was supported by National Institute of Mental Health R01 Grants MH77908 and MH102310 to Lauren B. Alloy. Preparation of the manuscript also was supported by National Institute of Mental Health R01 Grant MH101138 to Richard T. Liu and a National Science Foundation Graduate Research Fellowship to Taylor A. Burke.
Footnotes
The smallest raw number of cases of the simulated putative taxon in our analyses, across all age groups, was 430 for 16-year-olds.
Restricting analyses to participants who completed the Phase II screening would also be problematic insofar as it significantly increases the possibility of spurious findings. That is, conducting taxometric analysis with participants selected using a measure of the construct of interest, producing a non-continuous distribution on the measure, substantially heightens the likelihood of detecting a pseudotaxon, and thus should be avoided (Ruscio et al., 2006).
The BAS-RR subscale and the SPSRQ SR subscale were included as separate taxometric indicators in the analyses due to the relatively low correlations between these scales at each age. Additionally, the correlations between these indicators were comparable or lower than the remaining correlations across taxometric indicators, supporting the validity of maintaining the distinction between the BAS-RR and SPSRQ SR subscales.
Mean estimated taxon base rates were: .50 across all ages, .61 for 14-year-olds, .57 for 15-year-olds, .49 for 16-year-olds, .54 for 17-year-olds, .51 for 18-year-olds, and .52 for 19-year-olds.
Although the BAS-RR subscale falls just short of this condition for analyses with data from 15-year-olds (Cohen’s d = 1.249), it does not compromise the validity of the analyses for this age group, especially given the high validity of the remaining three indicators.
References
- Ahmed AO, Green BA, Clark CB, Stahl KC, McFarland ME. Latent structure of unipolar and bipolar mood symptoms. Bipolar Disorders. 2011;13:522–536. doi: 10.1111/j.1399-5618.2011.00940.x. [DOI] [PubMed] [Google Scholar]
- Ahmed AO, Strauss GP, Buchanan RW, Kirkpatrick B, Carpenter WT. Are negative symptoms dimensional or categorical? Detection and validation of deficit schizophrenia with taxometric and latent variable mixture models. Schizophrenia Bulletin. 2015;41:879–891. doi: 10.1093/schbul/sbu163. [DOI] [PMC free article] [PubMed] [Google Scholar]
- Alloy LB, Abramson LY. The role of the Behavioral Approach System (BAS) in bipolar spectrum disorders. Current Directions in Psychological Science. 2010;19:189–194. doi: 10.1177/0963721410370292. [DOI] [PMC free article] [PubMed] [Google Scholar]
- Alloy LB, Abramson LY, Walshaw PD, Cogswell A, Grandin LD, Hughes ME, Iacoviello BM, et al. Behavioral Approach System and Behavioral Inhibition System sensitivities and bipolar spectrum disorders: prospective prediction of bipolar mood episodes. Bipolar Disorders. 2008;10:310–322. doi: 10.1111/j.1399-5618.2007.00547.x. [DOI] [PubMed] [Google Scholar]
- Alloy LB, Abramson LY, Walshaw PD, Keyser J, Gerstein RK. A cognitive vulnerability-stress perspective on bipolar spectrum disorders in a normative adolescent brain, cognitive, and emotional development context. Development and Psychopathology. 2006;18:1055–1103. doi: 10.1017/S0954579406060524. [DOI] [PubMed] [Google Scholar]
- Alloy LB, Bender RE, Whitehouse WG, Wagner CA, Liu RT, Grant DA, Jager-Hyman S, et al. High Behavioral Approach System (BAS) sensitivity, reward responsiveness, and goal-striving predict first onset of bipolar spectrum disorders: A prospective behavioral high-risk design. Journal of Abnormal Psychology. 2012;121:16–27. doi: 10.1037/a0025877. [DOI] [PMC free article] [PubMed] [Google Scholar]
- Alloy LB, Nusslock R, Boland EM. The development and course of bipolar spectrum disorders: An integrated reward and circadian rhythm dysregulation model. Annual Review of Clinical Psychology. 2015;11:213–250. doi: 10.1146/annurev-clinpsy-032814-112902. [DOI] [PMC free article] [PubMed] [Google Scholar]
- Alloy LB, Olino T, Freed RD, Nusslock R. Role of reward sensitivity and processing in major depressive and bipolar spectrum disorders. Behavior Therapy. 2016;47:600–621. doi: 10.1016/j.beth.2016.02.014. [DOI] [PMC free article] [PubMed] [Google Scholar]
- Alloy LB, Urošević S, Abramson LY, Jager-Hyman S, Nusslock R, Whitehouse WG, Hogan M. Progression along the bipolar spectrum: a longitudinal study of predictors of conversion from bipolar spectrum conditions to bipolar I and II disorders. Journal of Abnormal Psychology. 2012;121:16–27. doi: 10.1037/a0023973. [DOI] [PMC free article] [PubMed] [Google Scholar]
- American Psychiatric Association. Diagnostic and Statistical Manual of Mental Disorders: DSM-5. Washington, DC: American Psychiatric Association; 2013. [Google Scholar]
- Amstadter AB, Daughters SB, Macpherson L, Reynolds EK, Danielson CK, Wang F, Potenza MN, et al. Genetic associations with performance on a behavioral measure of distress intolerance. Journal of Psychiatric Research. 2012;46:87–94. doi: 10.1016/j.jpsychires.2011.09.017. [DOI] [PMC free article] [PubMed] [Google Scholar]
- Bellivier F, Golmard JL, Rietschel M, Schulze TG, Malafosse A, Preisig M, McKeon P, et al. Age at onset in bipolar I affective disorder: further evidence for three subgroups. American Journal of Psychiatry. 2003;160:999–1001. doi: 10.1176/appi.ajp.160.5.999. [DOI] [PubMed] [Google Scholar]
- Bellivier F, Golmard JL, Henry C, Leboyer M, Schürhoff F. Admixture analysis of age at onset in bipolar I affective disorder. Archives of General Psychiatry. 2001;58:510–512. doi: 10.1001/archpsyc.58.5.510. [DOI] [PubMed] [Google Scholar]
- Blakemore SJ, Robbins TW. Decision-making in the adolescent brain. Nature Neuroscience. 2012;15:1184–1191. doi: 10.1038/nn.3177. [DOI] [PubMed] [Google Scholar]
- Carter JS, Garber J. Predictors of the first onset of a major depressive episode and changes in depressive symptoms across adolescence: Stress and negative cognitions. Journal of Abnormal Psychology. 2011;120:779–796. doi: 10.1037/a0025441. [DOI] [PubMed] [Google Scholar]
- Carver CS, White TL. Behavioral inhibition, behavioral activation, and affective responses to impending reward and punishment: The BIS/BAS Scales. Journal of Personality and Social Psychology. 1994;67:319–333. doi: 10.1037/0022-3514.67.2.319. [DOI] [Google Scholar]
- Casey BJ, Galvan A, Hare TA. Changes in cerebral functional organization during cognitive development. Current Opinion in Neurobiology. 2005;15:239–244. doi: 10.1016/j.conb.2005.03.012. [DOI] [PubMed] [Google Scholar]
- Casey BJ, Getz S, Galvan A. The adolescent brain. Developmental Review. 2008;28:62–77. doi: 10.1016/j.dr.2007.08.003. [DOI] [PMC free article] [PubMed] [Google Scholar]
- Cassidy F, Ahearn EP, Carroll BJ. Substance abuse in bipolar disorder. Bipolar Disorders. 2001;3:181–188. [PubMed] [Google Scholar]
- Collado A, Felton JW, MacPherson L, Lejuez CW. Longitudinal trajectories of sensation seeking, risk taking propensity, and impulsivity across early to middle adolescence. Addictive Behaviors. 2014;39:1580–1588. doi: 10.1016/j.addbeh.2014.01.024. [DOI] [PMC free article] [PubMed] [Google Scholar]
- Cyders MA, Coskunpinar A. Measurement of constructs using self-report and behavioral lab tasks: Is there overlap in nomothetic span and construct representation for impulsivity? Clinical Psychology Review. 2011;31:965–982. doi: 10.1016/j.cpr.2011.06.001. [DOI] [PubMed] [Google Scholar]
- Davey CG, Yücel M, Allen NB. The emergence of depression in adolescence: Development of the prefrontal cortex and the representation of reward. Neuroscience and Biobehavioral Reviews. 2008;32:1–19. doi: 10.1016/j.neubiorev.2007.04.016. [DOI] [PubMed] [Google Scholar]
- Delgado MR, Nystrom LE, Fissell C, Noll DC, Fiez JA. Tracking the hemodynamic responses to reward and punishment in the striatum. Journal of Neurophysiology. 2000;84:3072–3077. doi: 10.1152/jn.2000.84.6.3072. [DOI] [PubMed] [Google Scholar]
- Depue RA, Iacono WG. Neurobehavioral aspects of affective disorders. Annual Review of Psychology. 1989;40:457–492. doi: 10.1146/annurev.ps.40.020189.002325. [DOI] [PubMed] [Google Scholar]
- Duckworth AL, Kern ML. A meta-analysis of the convergent validity of self-control measures. Journal of Research in Personality. 2011;45:259–268. doi: 10.1016/j.jrp.2011.02.004. [DOI] [PMC free article] [PubMed] [Google Scholar]
- Ernst M, Nelson EE, Jazbec S, McClure EB, Monk CS, Leibenluft E, Blair J, et al. Amygdala and nucleus accumbens in responses to receipt and omission of gains in adults and adolescents. NeuroImage. 2005;25:1279–1291. doi: 10.1016/j.neuroimage.2004.12.038. [DOI] [PubMed] [Google Scholar]
- Fagiolini A, Forgione R, Maccari M, Cuomo A, Morana B, Dell’Osso MC, Pellegrini F, et al. Prevalence, chronicity, burden and borders of bipolar disorder. Journal of Affective Disorders. 2013;148:161–169. doi: 10.1016/j.jad.2013.02.001. [DOI] [PubMed] [Google Scholar]
- Findling RL, Youngstrom EA, Fristad MA, Birmaher B, Kowatch RA, Arnold LE, Frazier TW, et al. Characteristics of children with elevated symptoms of mania: the Longitudinal Assessment of Manic Symptoms (LAMS) study. Journal of Clinical Psychiatry. 2010;71:1664–1672. doi: 10.4088/JCP.09m05859yel. [DOI] [PMC free article] [PubMed] [Google Scholar]
- Fraley RC, Waller NG. Adult attachment patterns: A test of the typology models. In: Simpson JA, Rholes WS, editors. Attachment theory and close relationships. New York: Guilford Press; 1998. pp. 77–114. [Google Scholar]
- Franken IHA, Muris P. BIS/BAS personality characteristics and college students’ substance use. Personality and Individual Differences. 2006;40:1497–1503. doi: 10.1016/j.paid.2005.12.005. [DOI] [Google Scholar]
- Galván A. The teenage brain: Sensitivity to rewards. Current Directions in Psychological Science. 2013;22:88–93. doi: 10.1177/0963721413480859. [DOI] [PMC free article] [PubMed] [Google Scholar]
- Galvan A, Hare TA, Parra CE, Penn J, Voss H, Glover G, Casey BJ. Earlier development of the accumbens relative to orbitofrontal cortex might underlie risk-taking behavior in adolescents. Journal of Neuroscience. 2006;26:6885–6892. doi: 10.1523/JNEUROSCI.1062-06.2006. [DOI] [PMC free article] [PubMed] [Google Scholar]
- Gibb BE, Alloy LB, Abramson LY, Beevers CG, Miller IW. Cognitive vulnerability to depression: A taxometric analysis. Journal of Abnormal Psychology. 2004;113:81–89. doi: 10.1037/0021-843X.113.1.81. [DOI] [PubMed] [Google Scholar]
- Goodman SH, Gotlib IH. Risk for psychopathology in the children of depressed mothers: A developmental model for understanding mechanisms of transmission. Psychological Review. 1999;106:458–490. doi: 10.1037/0033-295x.106.3.458. [DOI] [PubMed] [Google Scholar]
- Gray JA. Neural systems, emotion and personality. In: Madden J, editor. Neurobiology of learning, emotion, and affect. New York: Raven Press; 1991. pp. 273–306. [Google Scholar]
- Haeffel GJ, Abramson LY, Voelz ZR, Metalsky GI, Halberstadt L, Dykman BM, Donovan P, et al. Negative cognitive styles, dysfunctional attitudes, and the remitted depression paradigm: A search for the elusive cognitive vulnerability to depression factor among remitted depressives. Emotion. 2005;5:343–348. doi: 10.1037/1528-3542.5.3.343. [DOI] [PubMed] [Google Scholar]
- Hankin BL, Fraley RC, Lahey BB, Waldman ID. Is depression best viewed as a continuum or discrete category? A taxometric analysis of childhood and adolescent depression in a population-based sample. Journal of Abnormal Psychology. 2005;114:96–110. doi: 10.1037/0021-843X.114.1.96. [DOI] [PubMed] [Google Scholar]
- Harmon-Jones E, Abramson LY, Nusslock R, Sigelman JD, Urosevic S, Turonie LD, Alloy LB, et al. Effect of bipolar disorder on left frontal cortical responses to goals differing in valence and task difficulty. Biological Psychiatry. 2008;63:693–698. doi: 10.1016/j.biopsych.2007.08.004. [DOI] [PubMed] [Google Scholar]
- Haslam N, Holland E, Kuppens P. Categories versus dimensions in personality and psychopathology: A quantitative review of taxometric research. Psychological Medicine. 2012;42:903–920. doi: 10.1017/S0033291711001966. [DOI] [PubMed] [Google Scholar]
- Hoang U, Stewart R, Goldacre MJ. Mortality after hospital discharge for people with schizophrenia or bipolar disorder: retrospective study of linked English hospital episode statistics, 1999–2006. BMJ. 2011;343:d5422. doi: 10.1136/bmj.d5422. [DOI] [PMC free article] [PubMed] [Google Scholar]
- Hommer DW, Bjork JM, Gilman JM. Imaging brain response to reward in addictive disorders. Annals of the New York Academy of Sciences. 2011;1216:50–61. doi: 10.1111/j.1749-6632.2010.05898.x. [DOI] [PubMed] [Google Scholar]
- Insel T, Cuthbert B, Garvey M, Heinssen R, Pine DS, Quinn K, Sanislow C, et al. Research domain criteria (RDoC): Toward a new classification framework for research on mental disorders. American Journal of Psychiatry. 2010;167:748–751. doi: 10.1176/appi.ajp.2010.09091379. [DOI] [PubMed] [Google Scholar]
- Johnson SL. Life events in bipolar disorder: Towards more specific models. Clinical Psychology Review. 2005;25:1008–1027. doi: 10.1016/j.cpr.2005.06.004. The psychology of bipolar disorder. [DOI] [PMC free article] [PubMed] [Google Scholar]
- Johnson SL, Cueller AK, Ruggero C, Winett-Perlman C, Goodnick P, White R, Miller I. Life events as predictors of mania and depression in bipolar I disorder. Journal of Abnormal Psychology. 2008;117:268–277. doi: 10.1037/0021-843X.117.2.268. [DOI] [PMC free article] [PubMed] [Google Scholar]
- Johnson SL, Roberts JE. Life events and bipolar disorder: Implications from biological theories. Psychological Bulletin. 1995;117:434–449. doi: 10.1037/0033-2909.117.3.434. [DOI] [PubMed] [Google Scholar]
- Johnson SL, Sandrow D, Meyer B, Winters R, Miller I, Solomon D, Keitner G. Increases in manic symptoms after life events involving goal attainment. Journal of Abnormal Psychology. 2000;109:721–727. doi: 10.1037//0021-843x.109.4.721. [DOI] [PMC free article] [PubMed] [Google Scholar]
- Just N, Abramson LY, Alloy LB. Remitted depression studies as tests of the cognitive vulnerability hypotheses of depression onset: A critique and conceptual analysis. Clinical Psychology Review. 2001;21:63–83. doi: 10.1016/S0272-7358(99)00035-5. [DOI] [PubMed] [Google Scholar]
- Kessler RC, Avenevoli S, Costello EJ, Georgiades K, Green JG, Gruber MJ, He J, et al. Prevalence, persistence, and sociodemographic correlates of DSM-IV disorders in the National Comorbidity Survey Replication Adolescent Supplement. Archives of General Psychiatry. 2012;69:372–380. doi: 10.1001/archgenpsychiatry.2011.160. [DOI] [PMC free article] [PubMed] [Google Scholar]
- Kleine-Budde K, Touil E, Moock J, Bramesfeld A, Kawohl W, Rössler W. Cost of illness for bipolar disorder: A systematic review of the economic burden. Bipolar Disorders. 2014;16:337–353. doi: 10.1111/bdi.12165. [DOI] [PubMed] [Google Scholar]
- Kupfer DJ. The increasing medical burden in bipolar disorder. JAMA. 2005;293:2528–2530. doi: 10.1001/jama.293.20.2528. [DOI] [PubMed] [Google Scholar]
- Liu RT. Taxometric evidence of a dimensional latent structure for depression in an epidemiological sample of children and adolescents. Psychological Medicine. 2016;46:1265–1275. doi: 10.1017/S0033291715002792. [DOI] [PMC free article] [PubMed] [Google Scholar]
- Lobbestael J, Arntz A, Wiers RW. How to push someone’s buttons: A comparison of four anger-induction methods. Cognition and Emotion. 2008;22:353–373. doi: 10.1080/02699930701438285. [DOI] [Google Scholar]
- Lupien SJ, McEwen BS, Gunnar MR, Heim C. Effects of stress throughout the lifespan on the brain, behaviour and cognition. Nature Reviews Neuroscience. 2009;10:434–445. doi: 10.1038/nrn2639. [DOI] [PubMed] [Google Scholar]
- MacCallum RC, Zhang S, Preacher KJ, Rucker DD. On the practice of dichotomization of quantitative variables. Psychological Methods. 2002;7:19–40. doi: 10.1037/1082-989X.7.1.19. [DOI] [PubMed] [Google Scholar]
- Marcus DK, Barry TD. Does attention-deficit/hyperactivity disorder have a dimensional latent structure? A taxometric analysis. Journal of Abnormal Psychology. 2011;120:427–442. doi: 10.1037/a0021405. [DOI] [PMC free article] [PubMed] [Google Scholar]
- Maxwell SE, Delaney HD. Bivariate median splits and spurious statistical significance. Psychological Bulletin. 1993;113:181–190. doi: 10.1037/0033-2909.113.1.181. [DOI] [Google Scholar]
- McClelland GH, Judd CM. Statistical difficulties of detecting interactions and moderator effects. Psychological Bulletin. 1993;114:376–390. doi: 10.1037/0033-2909.114.2.376. [DOI] [PubMed] [Google Scholar]
- McGorry PD, Purcell R, Goldstone S, Amminger GP. Age of onset and timing of treatment for mental and substance use disorders: implications for preventive intervention strategies and models of care. Current Opinion in Psychiatry. 2011;24:301–306. doi: 10.1097/YCO.0b013e3283477a09. [DOI] [PubMed] [Google Scholar]
- McHugh RK, Daughters SB, Lejuez CW, Murray HW, Hearon BA, Gorka SM, Otto MW. Shared variance among self-report and behavioral measures of distress intolerance. Cognitive Therapy and Research. 2011;35:266–275. doi: 10.1007/s10608-010-9295-1. [DOI] [PMC free article] [PubMed] [Google Scholar]
- McIntyre RS, Konarski JZ, Soczynska JK, Wilkins K, Panjwani G, Bouffard B, Bottas A, et al. Medical comorbidity in bipolar disorder: implications for functional outcomes and health service utilization. Psychiatric Services. 2006;57:1140–1144. doi: 10.1176/appi.ps.57.8.1140. [DOI] [PubMed] [Google Scholar]
- Meehl PE. Specific etiology and other forms of strong influence: some quantitative meanings. Journal of Medicine and Philosophy. 1977;2:33–53. [Google Scholar]
- Meehl PE. Bootstraps taxometrics: Solving the classification problem in psychopathology. American Psychologist. 1995;50:266–275. doi: 10.1037/0003-066X.50.4.266. [DOI] [PubMed] [Google Scholar]
- Meehl PE, Golden R. Taxometric methods. In: Kendall P, Butcher J, editors. Handbook of research methods in clinical psychology. New York: Wiley; 1982. pp. 127–181. [Google Scholar]
- Meehl PE, Yonce LJ. Taxometric analysis: I. Detecting taxonicity with two quantitative indicators using means above and below a sliding cut (MAMBAC procedure) Psychological Reports. 1994;74:1059–1274. Psychological Reports, 74, 1059–1274. [Google Scholar]
- Meehl PE, Yonce LJ. Taxometric analysis: II. Detecting taxonicity using covariance of two quantitative indicators in successive intervals of a third indicator (Maxcov procedure) Psychological Reports. 1996;78:1091–1227. [Google Scholar]
- Merikangas KR, He JP, Burstein M, Swanson SA, Avenevoli S, Cui L, Benjet C, et al. Lifetime prevalence of mental disorders in U.S. adolescents: Results from the National Comorbidity Survey Replication–Adolescent Supplement (NCS-A) Journal of the American Academy of Child and Adolescent Psychiatry. 2010;49:980–989. doi: 10.1016/j.jaac.2010.05.017. [DOI] [PMC free article] [PubMed] [Google Scholar]
- Meyer B, Johnson SL, Winters R. Responsiveness to threat and incentive in bipolar disorder: Relations of the BIS/BAS scales with symptoms. Journal of Psychopathology and Behavioral Assessment. 2001;23:133–143. doi: 10.1023/A:1010929402770. [DOI] [PMC free article] [PubMed] [Google Scholar]
- Meyer TD, Keller F. Is there evidence for a latent class called “hypomanic temperament”? Journal of Affective Disorders. 2003;75:259–267. doi: 10.1016/S0165-0327(02)00051-4. [DOI] [PubMed] [Google Scholar]
- Miller EK, Cohen JD. An integrative theory of prefrontal cortex function. Annual Review of Neuroscience. 2001;24:167–202. doi: 10.1146/annurev.neuro.24.1.167. [DOI] [PubMed] [Google Scholar]
- Monroe SM, Simons AD. Diathesis-stress theories in the context of life stress research: Implications for the depressive disorders. Psychological Bulletin. 1991;110:406–425. doi: 10.1037/0033-2909.110.3.406. [DOI] [PubMed] [Google Scholar]
- Murrie DC, Marcus DK, Douglas KS, Lee Z, Salekin RT, Vincent G. Youth with psychopathy features are not a discrete class: a taxometric analysis. Journal of Child Psychology and Psychiatry. 2007;48:714–723. doi: 10.1111/j.1469-7610.2007.01734.x. [DOI] [PubMed] [Google Scholar]
- Nisbett RE, Wilson TD. Telling more than we can know: Verbal reports on mental processes. Psychological Review. 1977;84:231–259. doi: 10.1037/0033-295X.84.3.231. [DOI] [Google Scholar]
- Nurnberger JIJ, Koller DL, Jung J, Edenberg HJ, Foroud T, Guella I, Vawter MP, et al. Identification of pathways for bipolar disorder: A meta-analysis. JAMA Psychiatry. 2014;71:657–664. doi: 10.1001/jamapsychiatry.2014.176. [DOI] [PMC free article] [PubMed] [Google Scholar]
- Nusslock R, Abramson LY, Harmon-Jones E, Alloy LB, Hogan ME. A goal-striving life event and the onset of hypomanic and depressive episodes and symptoms: perspective from the behavioral approach system (BAS) dysregulation theory. Journal of Abnormal Psychology. 2007;116:105–115. doi: 10.1037/0021-843X.116.1.105. [DOI] [PubMed] [Google Scholar]
- Nusslock R, Harmon-Jones E, Alloy LB, Urosevic S, Goldstein K, Abramson LY. Elevated left mid-frontal cortical activity prospectively predicts conversion to bipolar I disorder. Journal of Abnormal Psychology. 2012;121:592–601. doi: 10.1037/a0028973. [DOI] [PMC free article] [PubMed] [Google Scholar]
- Oedegaard KJ, Syrstad VEG, Morken G, Akiskal HS, Fasmer OB. A study of age at onset and affective temperaments in a Norwegian sample of patients with mood disorders. Journal of Affective Disorders. 2009;118:229–233. doi: 10.1016/j.jad.2009.01.030. [DOI] [PubMed] [Google Scholar]
- Ösby U, Brandt L, Correia N, Ekbom A, Sparén P. Excess mortality in bipolar and unipolar disorder in Sweden. Archives of General Psychiatry. 2001;58:844–850. doi: 10.1001/archpsyc.58.9.844. [DOI] [PubMed] [Google Scholar]
- Pari AAA, Simon J, Wolstenholme J, Geddes JR, Goodwin GM. Economic evaluations in bipolar disorder: A systematic review and critical appraisal. Bipolar Disorders. 2014;16:557–582. doi: 10.1111/bdi.12213. [DOI] [PubMed] [Google Scholar]
- Prisciandaro JJ, Roberts JE. Evidence for the continuous latent structure of mania in the Epidemiologic Catchment Area from multiple latent structure and construct validation methodologies. Psychological Medicine. 2011;41:575–588. doi: 10.1017/S0033291710001078. [DOI] [PMC free article] [PubMed] [Google Scholar]
- Prisciandaro JJ, Tolliver BK. Evidence for the continuous latent structure of mania and depression in out-patients with bipolar disorder: results from the Systematic Treatment Enhancement Program for Bipolar Disorder (STEP-BD) Psychological Medicine. 2015;45:2595–2603. doi: 10.1017/S0033291715000513. [DOI] [PMC free article] [PubMed] [Google Scholar]
- Richey JA, Schmidt NB, Lonigan CJ, Phillips BM, Catanzaro SJ, Laurent J, Gerhardstein RR, et al. The latent structure of child depression: A taxometric analysis. Journal of Child Psychology and Psychiatry. 2009;50:1147–1155. doi: 10.1111/j.1469-7610.2009.02085.x. [DOI] [PubMed] [Google Scholar]
- Rizvi SJ, Pizzagalli DA, Sproule BA, Kennedy SH. Assessing anhedonia in depression: Potentials and pitfalls. Neuroscience and Biobehavioral Reviews. 2016;65:21–35. doi: 10.1016/j.neubiorev.2016.03.004. [DOI] [PMC free article] [PubMed] [Google Scholar]
- Ruscio AM. The latent structure of social anxiety disorder: Consequences of shifting to a dimensional diagnosis. Journal of Abnormal Psychology. 2010;119:662–671. doi: 10.1037/a0019341. [DOI] [PMC free article] [PubMed] [Google Scholar]
- Ruscio AM, Ruscio J. The latent structure of analogue depression: Should the Beck Depression Inventory be used to classify groups? Psychological Assessment. 2002;14:135–145. doi: 10.1037/1040-3590.14.2.135. [DOI] [PubMed] [Google Scholar]
- Ruscio J. Taxometric programs for the R computing environment: User’s manual 2013 [Google Scholar]
- Ruscio J, Haslam N, Ruscio AM. Introduction to the Taxometric Method: A Practical Guide. Mahwah, NJ: Lawrence Erlbaum Associates; 2006. [Google Scholar]
- Ruscio J, Ruscio AM. Clarifying boundary issues in psychopathology: The role of taxometrics in a comprehensive program of structural research. Journal of Abnormal Psychology. 2004;113:24–38. doi: 10.1037/0021-843X.113.1.24. [DOI] [PubMed] [Google Scholar]
- Ruscio J, Ruscio AM, Keane TM. Using taxometric analysis to distinguish a small latent taxon from a latent dimension with positively skewed indicators: The case of involuntary defeat syndrome. Journal of Abnormal Psychology. 2004;113:145–154. doi: 10.1037/0021-843X.113.1.145. [DOI] [PubMed] [Google Scholar]
- Ruscio J, Ruscio AM, Meron M. Applying the bootstrap to taxometric analysis: Generating empirical sampling distributions to help interpret results. Multivariate Behavioral Research. 2007;42:349–386. doi: 10.1080/00273170701360795. [DOI] [PubMed] [Google Scholar]
- Ruscio J, Walters GD, Marcus DK, Kaczetow W. Comparing the relative fit of categorical and dimensional latent variable models using consistency tests. Psychological Assessment. 2010;22:5–21. doi: 10.1037/a0018259. [DOI] [PubMed] [Google Scholar]
- Solomon A, Haaga DAF, Arnow BA. Is clinical depression distinct from subthreshold depressive symptoms? A review of the continuity issue in depression research. Journal of Nervous and Mental Disease. 2001;189:498–506. doi: 10.1097/00005053-200108000-00002. [DOI] [PubMed] [Google Scholar]
- Steinberg L, Graham S, O’Brien L, Woolard J, Cauffman E, Banich M. Age differences in future orientation and delay discounting. Child Development. 2009;80:28–44. doi: 10.1111/j.1467-8624.2008.01244.x. [DOI] [PubMed] [Google Scholar]
- Strube MJ. Evidence for the Type in Type A behavior: A taxometric analysis. Journal of Personality and Social Psychology. 1989;56:972–987. doi: 10.1037/0022-3514.56.6.972. [DOI] [Google Scholar]
- Thapar A, Collishaw S, Pine DS, Thapar AK. Depression in adolescence. Lancet. 2012;379:1056–1067. doi: 10.1016/S0140-6736(11)60871-4. [DOI] [PMC free article] [PubMed] [Google Scholar]
- Torrubia R, Ávila C, Moltó J, Caseras X. The Sensitivity to Punishment and Sensitivity to Reward Questionnaire (SPSRQ) as a measure of Gray’s anxiety and impulsivity dimensions. Personality and Individual Differences. 2001;31:837–862. doi: 10.1016/S0191-8869(00)00183-5. [DOI] [Google Scholar]
- Urosević S, Abramson LY, Harmon-Jones E, Alloy LB. Dysregulation of the behavioral approach system (BAS) in bipolar spectrum disorders: review of theory and evidence. Clinical Psychology Review. 2008;28:1188–1205. doi: 10.1016/j.cpr.2008.04.004. [DOI] [PMC free article] [PubMed] [Google Scholar]
- Van Meter AR, Burke C, Kowatch RA, Findling RL, Youngstrom EA. Ten-year updated meta-analysis of the clinical characteristics of pediatric mania and hypomania. Bipolar Disorders. 2016;18:19–32. doi: 10.1111/bdi.12358. [DOI] [PubMed] [Google Scholar]
- Van Meter AR, Burke C, Youngstrom EA, Faedda GL, Correll CU. The bipolar prodrome: Meta-Analysis of symptom prevalence prior to initial or recurrent mood episodes. Journal of the American Academy of Child and Adolescent Psychiatry. 2016;55:543–555. doi: 10.1016/j.jaac.2016.04.017. [DOI] [PubMed] [Google Scholar]
- Van Meter AR, Moreira ALR, Youngstrom EA. Meta-analysis of epidemiologic studies of pediatric bipolar disorder. Journal of Clinical Psychiatry. 2011;72:1250–1256. doi: 10.4088/JCP.10m06290. [DOI] [PubMed] [Google Scholar]
- Waller N, Meehl PE. Advanced Quantitative Techniques in the Social Sciences. Vol. 9. Thousand Oaks, CA: Sage Publications; 1998. Multivariate taxometric procedures: Distinguishing types from continua. [Google Scholar]
- Walters GD. The latent structure of alcohol use disorders: a taxometric analysis of structured interview data obtained from male federal prison inmates. Alcohol and Alcoholism. 2008;43:326–333. doi: 10.1093/alcalc/agm165. [DOI] [PubMed] [Google Scholar]
- Walters GD, Ruscio J. Where do we draw the line? Assigning cases to subsamples for MAMBAC, MAXCOV, and MAXEIG taxometric analyses. Assessment. 2010;17:321–333. doi: 10.1177/1073191109356539. [DOI] [PubMed] [Google Scholar]
- Walters GD, Ruscio J. Trajectories of youthful antisocial behavior: categories or continua? Journal of Abnormal Child Psychology. 2013;41:653–666. doi: 10.1007/s10802-012-9700-1. [DOI] [PubMed] [Google Scholar]
- Wang PS, Berglund P, Olfson M, Pincus HA, Wells KB, Kessler RC. Failure and delay in initial treatment contact after first onset of mental disorders in the National Comorbidity Survey Replication. Archives of General Psychiatry. 2005;62:603–613. doi: 10.1001/archpsyc.62.6.603. [DOI] [PubMed] [Google Scholar]