

Abstract
µ-opioid receptor (MOR) is a class of opioid receptors with a high affinity for enkephalins and beta-endorphin. In hippocampus, activation of MOR is known to enhance the neuronal excitability of pyramidal neurons, which has been mainly attributed to a disinhibition of pyramidal neurons via activating Gαi subunit to suppress the presynaptic release of GABA in hippocampal interneurons. In contrast, the potential role of MOR in hippocampal astrocytes, the most abundant cell type in the brain, has remained unexplored. Here, we determine the cellular and subcellular distribution of MOR in different cell types of the hippocampus by utilizing MOR-mCherry mice and two different antibodies against MOR. Consistent with previous findings, we demonstrate that MOR expression in the CA1 pyramidal layer is co-localized with axon terminals from GABAergic inhibitory neurons but not with soma of pyramidal neurons. More importantly, we demonstrate that MOR is highly expressed in CA1 hippocampal astrocytes. The ultrastructural analysis further demonstrates that the astrocytic MOR is localized in soma and processes, but not in microdomains near synapses. Lastly, we demonstrate that astrocytes in ventral tegmental area and nucleus accumbens also express MOR. Our results provide the unprecedented evidence for the presence of MOR in astrocytes, implicating potential roles of astrocytic MOR in addictive behaviors.
Keywords: Astrocyte, Electron microscopy, Hippocampus, µ-opioid receptor
Graphical Abstract
INTRODUCTION
µ-opioid receptor (MOR) is one of the three classes of opioid receptors, µ-, δ-, and κ-opioid receptors. MOR has a high affinity for enkephalins and beta-endorphin [1]. MOR exists either presynaptically or postsynaptically depending on different brain regions and types of neurons. MOR is distributed in various brain regions including nucleus accumbens (NAc), ventral tegmental area (VTA), periaqueductal gray region, olfactory bulb, cerebral cortex, some of the nuclei of the amygdala, and hippocampus [2,3].
In hippocampus, MOR has been reported to be localized in somata, dendrites, axons, and axon terminals of GABAergic interneurons such as many parvalbumin-containing basket cells [4,5,6]. Activation of MOR has been demonstrated to promote the neuronal excitability of pyramidal neurons in hippocampus. This action of MOR has been attributed to the disinhibition of the pyramidal neurons through a suppression of GABA release from GABAergic interneurons, because MOR is an inhibitory Gαi-protein coupled receptor (Gi-GPCR) [7,8,9,10]. MORs are highly expressed throughout the brain regions including the hippocampus. Consistent with electrophysiological recordings, MORs are shown to be expressed in GABAergic interneurons in hippocampal formation [4,6]. Ultrastructural study also shows the distribution of MORs in axons and terminals of GABA containing neurons using dual-labeling electron microscopy [5]. While the presence and the function of MOR in GABAergic interneurons are well studied, the presence and the role of astrocytic MOR have not been thoroughly investigated. Based on our previous report demonstrating that activation of astrocytic Gi-GPCR induces glutamate release from astrocytes [11], the presence of astrocytic MOR might be crucial for investigating the role of astrocytes in various actions of opioids targeting MOR through astrocytic glutamate. In the current study, we therefore investigated the presence of MOR in astrocytes, especially hippocampal astrocytes and demonstrate for the first time that hippocampal astrocytes, as well as astrocytes in VTA and NAc, highly express MOR.
MATERIALS AND METHODS
Animals
GFAP-GFP (Stock No. 003257), MOR knockout (KO) (Stock No. 007559) and MOR-mCherry mice (Stock No. 029013) were obtained from Jackson Laboratory. For primary culture of hippocampal astrocytes, P0-P3 C57BL/6J mice were used. For histological analysis, 7 to 9-week-old male mice were used. All animals were maintained in a vivarium with light/dark cycle (8:00 AM~8:00 PM). Animal care and handling were performed according to the directives of the Animal Care and Use Committee and institutional guidelines of KIST (Seoul, Korea). Animals were randomly used for experiments.
Immunohistochemistry
Animals were deeply anesthetized using 2% avertin and perfused with 0.1M PBS, followed by 4% paraformaldehyde. Brains were post-fixed in 4% paraformaldehyde at 4℃ for 24 hr and 30% sucrose 4℃ for 48 hr. Brains were then cut in coronal sections of 30 µm on a cryosection. Sections were blocked in 0.1 M PBS containing 0.3% Triton X-100 (Sigma) and 2% donkey serum (Genetex) for 30 min at room temperature. Primary antibody used are as follow: chicken anti-GFAP (1:500, ab5541, Millipore), rabbit anti-S100β (1:200, NB110-57478, Novus), rabbit anti-MOR (1:200, sc-15310, Santa Cruz Biotechnology), rabbit anti-MOR (1:200, RA10104, Neuromics), goat anti-TH (1:500, ab101853, Abcam), mouse anti-NeuN (1:1,000, MAB377, Millipore), and mouse anti-vGAT (1:200, 131011, Synaptic systems). The brain samples with primary antibodies were incubated overnight at 4℃. Then, the sections were washed three times in 0.1 M PBS and incubated in proper secondary antibodies from the Jackson Laboratory for 1.5 hr. After three rinses in 0.1 M PBS and DAPI staining at 1:3000 (PIERCE), the sections were mounted on polysine microscopic slide glass (Thermo Scientific). Images were acquired using a Nikon A1R confocal microscope. We repeated each experiment at least three times.
Image quantification
Confocal microscopic images were analyzed using the ImageJ program (NIH). For analyzing MOR intensity in an astrocyte, the images were converted into binary and every GFAP+ astrocyte was picked as region of interest (ROI). Then the mean intensity value of MOR in every ROI was measured. For colocalization analysis, we first converted the MOR-mCherry+ and vGAT+ images into 8-bit and then calculated the pearson's correlation by utilizing colocalization threshold tool from ImageJ program. Using this method, there was no correlation between MOR-mCherry+ and NeuN+ at all.
Production of MOR-shRNA lentiviral vector and virus injection
The MOR nucleotides from 1197 to 1215 (5′-gac tgt ttc ctg gca ctt c-3′) was selected for the target region of shRNA. The pSicoR-MOR-shRNA was synthesized using the complementary oligomers, 5′-tga ctg ttt cct ggc act tct tca aga gag aag tgc cag gaa aca gtc ttt ttt c-3′ and 3′-tcg aga aaa aag act gtt tcc tgg cac ttc tct ctt gaa gaa gtg cca gga aac agt ca-5′. The annealed double-stranded oligomer was inserted into HpaI-XhoI restriction enzyme sites of pSicoR lentiviral vector (Addgene) and verified by sequencing. The virus titer was 1.0×10¹² GC. We used stereotaxis to deliver a certain gene into CA1 of dorsal hippocampus (coordinates: AP −1.8 mm, ML±1.5 mm, DV −1.7 mm). We injected 2 µl of virus at a rate of 0.2 µl/min and waited for 1 or 2 weeks for the knockdown to occur for lentivirus or AAV virus, respectively.
Primary astrocytes culture
The cerebral cortex was dissected free of adherent meninges, minced and dissociated into single cell suspension by trituration through a Pasteur pipette. Dissociated cells were plated onto either 12 mm glass coverslips or six-well plates coated with 0.1 mg/ml poly d-lysine. Cells were grown in Dulbecco's modified Eagle's medium (DMEM; Gibco) supplemented with 25 mM glucose, 10% heat-inactivated horse serum, 10% heat-inactivated fetal bovine serum, 2 mM glutamine and 1,000 units/ml penicillin-streptomycin. After three days later, cells were vigorously washed with repeated pipetting using medium and the media was replaced to get rid of debris and other floating cell types.
Western blotting
Cultured astrocytes were lysed with RIPA buffer (50 mM Tris-HCl, pH 7.4, 150 mM NaCl, 5 mM EDTA, 1 mM PMSF, and 1% NP-40) containing a protease-inhibitor cocktail. Total-cell lysates were incubated on ice for 30 min and then cleared at 13,000 rpm for 20 min at 4℃. The protein samples were separated by SDS-PAGE using 10% gels and blotted onto PVDF membranes. The blots incubated overnight at 4℃ with anti-MOR antibody (1:1,000; sc-15310, Santa Cruz Biotechnology) or anti-β-actin antibody (1:2,000; ab133626, Abcam). Blots were then washed and incubated with horseradish peroxidase-conjugated anti-goat IgG or anti-rabbit IgG, followed by washing and detection of immunoreactivity with enhanced chemiluminescence (Amersham Biosciences).
Electron microscopic immunohistochemistry
Three GFAP-GFP transgenic mice (20~25 g) were deeply anesthetized with sodium pentobarbital (80 mg/kg, i.p.) and perfused transcardially with heparinized normal saline (10 ml for mouse and 100 ml for rat), followed by freshly prepared mixture (50 ml) of 4% paraformaldehyde and 0.01% glutaraldehyde in 0.1 M phosphate buffer (PB), pH 7.4. Hippocampus was removed and post-fixed in the same fixative for 2 hours at 4℃. Sections were cut sagittally on a Vibratome at 60 µm and cryoprotected in 30% sucrose in PB overnight at 4℃. Sections were frozen on dry ice for 20 minutes, thawed in phosphate-buffered saline (PBS; 0.01 M, pH 7.2) to enhance penetration. They were pretreated with 1% sodium borohydride for 30 minutes to quench glutaraldehyde and then blocked with 3% H2O2 for 10 minutes to suppress endogenous peroxidases and with 10% normal donkey serum (NDS, Jackson ImmunoResearch, West Grove, PA) for 30 minutes to mask secondary antibody binding sites. For double immunostaining for GFP and MOR, sections of hippocampus pretreated as above were incubated overnight in a mixture of antibodies. Primary antibodies used are as follow: mouse anti-GFP (1:400, MAB3580, Millipore, Temecula, CA) and rabbit anti-MOR (1:2,500, RA10104, Neuromics, Edina, MN) [12,13]. After rinsing in PBS, sections were incubated with a mixture of biotinylated donkey anti-mouse (1:200, Jackson ImmunoResearch) and 1 nm gold-conjugated donkey anti-rabbit (1:50, EMS, Hatfield, PA) for 2~3 hours. The sections were post-fixed with 1% glutaraldehyde in PB for 10 minutes, rinsed in PB several times, incubated for 4 minutes with HQ silver enhancement solution (Nanoprobes, Yaphank, NY), and rinsed in 0.1 M sodium acetate and PB. After rinsing in PBS, sections were incubated with a biotinylated donkey anti-rabbit (1:200, Jackson ImmunoResearch) antibody for 2~3 hours. The sections were rinsed in PB several times, and were incubated with ExtrAvidin peroxidase (1:5,000, Sigma, St. Louis, MO) for 1 hour and the immunoperoxidase was visualized by nickel-intensified 3,3′-diaminobenzidine tetrahydrochloride (DAB). Sections were further rinsed in PB, osmicated (in 1% osmium tetroxide in PB) for 1 hour, dehydrated in graded alcohols, flat-embedded in Durcupan ACM (Fluka, Buchs, Switzerland) between strips of Aclar plastic film (EMS), and cured for 48 hours at 60℃. Chips containing prominent staining for MOR in the hippocampus were cut out of the wafers and glued onto blank resin blocks with cyanoacrylate. Serially cut thin sections were collected on Formvar-coated single-slot nickel grids and stained with uranyl acetate and lead citrate. Grids were examined on a Hitachi H7500 electron microscope (Hitachi, Tokyo, Japan) at 80 kV accelerating voltage. Images were captured with Digital Micrograph software driving a cooled CCD camera (SC1000; Gatan, Pleasanton, CA, USA) attached to the microscope, and saved as TIFF files.
To determine the astrocytic microdomain, a synapse composed of a presynaptic axon terminal and a postsynaptic dendrite was first identified as colored in the EM image. And then, fine extensions of astrocytes, 1) which are located near the synapse or encircling the synapse, 2) with clear cytoplasm, 3) highly irregular outline, 4) no mitochondria or microtubule endoplasmic reticulum, are considered as astrocytic microdomains.
RESULTS
Expression of MOR in CA1 hippocampal astrocytes and interneurons
To investigate the distribution of MOR in CA1 hippocampal neurons and astrocytes, we first utilized MOR-mCherry mice, in which the reporter mCherry was tagged to the C-terminus of MOR (Fig. 1A) [14]. The advantage of using this reporter mouse is that MOR-mCherry is expressed under the native MOR promoter, ensuring the endogenous level of MOR with its native distribution pattern. We determined the cell-type of mCherry expressing cells in the hippocampus after immunostaining with the astrocytic markers, GFAP and S100β, and the neuronal marker NeuN. We found that 100% of the interneurons in the CA1 stratum radiatum expressed MOR-mCherry signals as previously reported [4,6]. In addition to interneurons, we discovered that 83.2% of the S100β-positive astrocytes (yellow arrowheads) in stratum radiatum of hippocampal CA1 showed MOR-mCherry signals (Fig. 1B). These findings provide the very first evidence of astrocytic MOR in the hippocampus.
Fig. 1. Expression of MOR in CA1 hippocampal interneurons and astrocytes in MOR-mCherry mice. (A) Genetic background of MOR-mCherry knock-in mouse. Triangle, FRT; mCh, mcherry cDNA; neo, flanked neomycin cassette. (B) Expression of MOR-mCherry signal in GFAP+/S100β+ astrocytes (yellow arrowheads) and NeuN+ interneurons (white arrowheads) in hippocampal CA1 stratum radiatum of MOR-mCherry mouse. (C) Quantification of the portion of MOR+ astrocytes and MOR+ interneurons. Numbers on the bar graph indicate the cell numbers.

We also detected MOR-mCherry signals in CA1 pyramidal layer. We found that most of the mCherry signals do not localize in the soma of CA1 pyramidal neurons, but localize around the soma (Fig. 2A). Based on the previous report that MOR is expressed at the inhibitory presynaptic terminals in hippocampus [5], we hypothesized that the MOR-mCherry localizes to axon terminals of inhibitory neurons. To test this idea, we performed immunohistochemistry with hippocampal tissues of MOR-mCherry mice using an antibody against the vesicular GABA transporter, vGAT, which is a well-known marker for GABAergic axon terminals [15]. We found that MOR in the pyramidal layer was in part co-localized with vGAT (Fig. 2), whereas there was no correlation with the NeuN-labeled nuclei of pyramidal neurons at all. This finding indicates that MOR expression in the pyramidal layer is partly due to axon terminals of GABAergic interneurons.
Fig. 2. Colocalization between MOR and vGAT in CA1 pyramidal layer. (A) Representative confocal images. (B) Pearson's coefficient of colocalizations of both MOR-mCherry - vGAT and MOR-mCherry - NeuN measured by Colocalization Threshold tool from ImageJ.

Expression of MOR in CA1 hippocampal astrocytes using two different antibodies
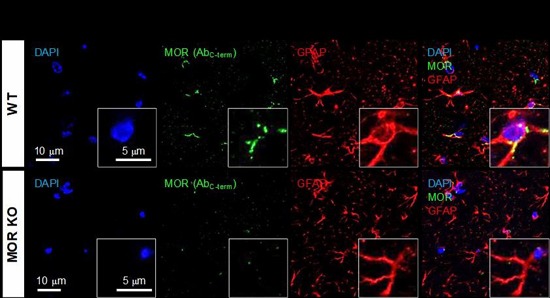
Using the MOR-mCherry mouse, we unexpectedly found the expression of MOR in the CA1 hippocampal astrocytes. To verify the presence of astrocytic MOR by an independent method, we performed immunohistochemistry in wildtype (WT) and MOR KO mice by using two different commercially available MOR antibodies: AbN-term (targeting the N-terminus of human MOR, 1~80) and AbC-term (targeting the C-terminus of MOR, 1359~1403). We found that most of the hippocampal astrocytes in WT mice showed noticeable MOR immunoreactivity for both antibodies (Fig. 3). On the other hand, MOR KO mice did not show MOR immunoreactivity, implying that these two antibodies specifically bind to MOR protein (Fig. 3). These findings indicate that astrocytes in hippocampal CA1 region highly express MOR.
Fig. 3. Expression of MOR in hippocampal astrocytes immunostained by two different antibodies. (A, C) Representative confocal images of the expression of MOR (green; antibodies targeting amino acids 1~80 mapping near the N-terminus (A) or 1359~1403 of the C-terminus of MOR (C)) in GFAP-positive astrocytes (red) of hippocampal CA1 area. (B, D) Bar graph showing the comparison of the average pixel intensity of MOR immunoreactivity signal in GFAP-positive cells of WT and MOR KO mice. Numbers in the bar graph indicate examined cells from 3 mice for each group. Unpaired two-tailed t-test (**p<0.01, ***p<0.001).

Validation of MOR antibody by using MOR-shRNA
To further validate the MOR antibodies, we first developed a lentivirus carrying MOR-shRNA, which should significantly reduce the protein level by removing the entire mRNA, thus providing an advantage over the use of KO mouse in which a truncated form of a target protein might exist. Next, we injected the lentivirus carrying MOR-shRNA into the hippocampal CA1 region and investigated the expression of MOR by immunohistochemistry with AbN-term, one of the two antibodies. We found that MOR-shRNA virus-infected cells expressed markedly low MOR-positive signals, whereas scrambled-shRNA virus-infected cells did not (Fig. 4A). We measured the knockdown efficiency in cultured astrocytes which were infected with pSicoR-MOR-shRNA by a western blot. We found that MOR-shRNA significantly reduced the protein expression of MOR by 75.2% (Fig. 4B). In addition, we measured the knockdown efficiency in vivo by western blot with the hippocampi which were infected with pSicoR-MOR-shRNA. We found that MOR-shRNA significantly reduced the protein expression of MOR in vivo by 39.9% (Fig. 4C). These findings validate the specificity of the MOR antibody as well as the specificity of MOR shRNA, which is used for the investigation of MOR distribution in the hippocampus.
Fig. 4. Validation of antibody using MOR shRNA. (A) Confocal images of MOR (green) after infection of lentivirus carrying MOR-shRNA-katushka (upper) or scrambled-shRNA-katushka (lower), respectively. (B) In vitro knockdown efficiency test of MOR shRNA in cultured hippocampal astrocytes by western blot. Upper band indicates MOR immunoactivity and lower band indicates actin immunoactivity. (C) In vivo knockdown efficiency test of MOR shRNA in CA1 hippocampus by western blot.

MOR is expressed in astrocytic soma and processes, but not in microdomain
To further investigate the subcellular localization of MOR in astrocytes, we performed electron microscopy (EM) with hippocampal tissues from GFAP-GFP mice to visualize astrocytes with GFP staining with immunoperoxidase (dark amorphous deposits, arrows in Fig. 5). We stained MOR with immunogold labeling using AbC-term (dark specks, arrowheads in Fig. 5). We found that MOR was highly expressed in the soma and processes of astrocytes. On the other hand, we could detect only very few immunogold-MOR signals in the microdomains, the astrocytic compartments close to synapses (Fig. 5). These data indicate that MOR is expressed in astrocytic soma and processes, but not in microdomains.
Fig. 5. Subcellular distribution (soma, process, and microdomain) of MOR in astrocyte (indicated in blue). MOR is stained with immunogold with silver enhancement (dark specks, arrowheads), and GFP, representing astrocyte, is stained with immunoperoxidase (dark amorphous deposits, arrows). The soma, process, and microdomain of the astrocyte were colored blue. Presynaptic axon terminal (pre) and postsynaptic dendrite (post) were colored red and green, respectively. N is nucleus. Scale bar indicates 500 nm.

MOR is expressed in astrocytes of NAc and VTA
MOR has been known to be expressed in NAc and VTA, which are the main brain regions of mesocorticolimbic dopaminergic system of the reward circuitry. Like in hippocampus, MOR has been believed to be exclusively expressed in neurons in NAc and VTA [3,16]. To investigate the presence of astrocytic MOR in these regions, we used the MOR-mCherry mouse and performed immunostaining with tyrosine hydroxylase (TH) antibody to identify the neurons of NAc and VTA. Using the antibody against S100β, we also found that the S100β-positive astrocytes in VTA and NAc also expressed MOR-mCherry (Fig. 6). These results indicate that in addition to hippocampal astrocytes, the astrocytes in NAc and VTA also express MOR. These findings suggest that astrocytes might have a role in opioid-associated addictive behaviors.
Fig. 6. MOR expression in S100β-positive astrocytes in mesolimbic area. S100β+ astrocytes in NAc and VTA which were marked by tyrosine hydroxylase (TH) express MOR-mCherry signals. Arrowheads indicate MOR-mcherry+/S100β+ astrocytes.

DISCUSSION
We provide the comprehensive lines of evidence for the presence of MOR in the astrocytes through various tools including MOR-mCherry transgenic mice, immunohistochemistry with two different antibodies, and immunogold electron microscopy. Firstly, we utilized MOR-mCherry knock-in mouse that shows a stable fluorescent signal of MOR with a low background signal, thus allowing us to clearly characterize the distribution of MOR at the single cell level. Secondly, most of commercially available antibodies targeting MOR have shown to be not very specific. To distinguish the non-specific staining by the two antibodies, we validated the specificity of each antibody using MOR KO mice. Thirdly, we performed EM for subcellular localization of MOR, and determined a primary localization of MOR in the soma and processes of hippocampal astrocytes.
Consistent with previous results [4,5,6], we also observed the expression of MOR in GABAergic interneurons in hippocampal CA1 region. The expression of MOR in axon terminal of GABAergic interneurons stained by vGAT antibody in pyramidal layer (Fig. 2) supports the previous electrophysiological studies showing that MOR activation increases the activity of excitatory neurons through GABAergic disinhibition in the hippocampus [8,9,10]. However, the expression of MOR in astrocytes has been inconclusive in the past. A previous EM study reported that very small fraction (1~10%) of total distribution of MOR labeling contributes to the expression in glial cells of the hippocampal region [5]. In contrast, other studies suggested a significant expression of MOR in primary cultured astrocytes [17,18]. Here, we demonstrate that over 80% of total astrocytes in the CA1 hippocampus express MOR (Fig. 1).
What is the potential role of astrocytic MOR? In our previous report, we have demonstrated that an activation of astrocytic Gi-GP-CR causes a dissociation of G-proteins into Gαi and Gβγ subunits. Gβγ directly binds to the TREK-1 containing two-pore potassium channel to open the channel. We have further demonstrated that opening of TREK-1 channel allows glutamate to be released to extracellular space from astrocytes in a Ca2+-independent fashion [11]. Furthermore, activation of well-known Gi-GPCRs, such as GABAB, adenosine receptor A1, and cannabinoid receptor CB1, is capable of inducing glutamate release from astrocytes [11]. It will be interesting to test the possibility that activation of astrocytic MOR, which is a classical Gi-GPCR, causes a glutamate release from astrocytes in the future.
Morphine, a prototypical MOR agonist, is a frequently used pain medication which is highly addictive. Morphine addiction has been mainly attributed to Gi-GPCR-mediated GABAergic disinhibition of VTA dopaminergic neurons [19] and glutamatergic input to VTA [20] in mesocorticolimbic dopaminergic system. In recent years, accumulating lines of evidence have suggested that hippocampus might play a critical role in the development of addiction-related behaviors [7,21,22,23], through MOR-mediated GABAergic disinhibition of glutamatergic neurons in hippocampus to facilitate the propagation of excitatory activity [7,22]. While MOR in the interneurons has been highlighted as the key modulator of opioid addiction, the role of astrocytes in the development of opioid-induced addictive behaviors have not been thoroughly investigated due to the lack of evidence for astrocytic MOR. If activation of astrocytic MOR can induce glutamate release from astrocytes, the activity of pyramidal neurons would be enhanced, contributing to opioid addiction. These exciting possibilities await future investigations. Our findings on the presence of astrocytic MOR in hippocampus and mesocorticolimbic dopaminergic system should incite future studies to clarify the role of astrocytic MOR in opioid addiction.
ACKNOWLEDGEMENTS
This work was supported by the Creative Research Initiative Program (2015R1A3A2066619), World Class Institute (WCI 2009-003), MRC (2012-0000305), and Basic Science Research (2010-0029460) Programs of the National Research Foundation (NRF) funded by the Korean Ministry of Science and Technology (MEST).
References
- 1.Saidak Z, Blake-Palmer K, Hay DL, Northup JK, Glass M. Differential activation of G-proteins by mu-opioid receptor agonists. Br J Pharmacol. 2006;147:671–680. doi: 10.1038/sj.bjp.0706661. [DOI] [PMC free article] [PubMed] [Google Scholar]
- 2.Arvidsson U, Riedl M, Chakrabarti S, Lee JH, Nakano AH, Dado RJ, Loh HH, Law PY, Wessendorf MW, Elde R. Distribution and targeting of a mu-opioid receptor (MOR1) in brain and spinal cord. J Neurosci. 1995;15:3328–3341. doi: 10.1523/JNEUROSCI.15-05-03328.1995. [DOI] [PMC free article] [PubMed] [Google Scholar]
- 3.Garzón M, Pickel VM. Plasmalemmal mu-opioid receptor distribution mainly in nondopaminergic neurons in the rat ventral tegmental area. Synapse. 2001;41:311–328. doi: 10.1002/syn.1088. [DOI] [PubMed] [Google Scholar]
- 4.Svoboda KR, Adams CE, Lupica CR. Opioid receptor subtype expression defines morphologically distinct classes of hippocampal interneurons. J Neurosci. 1999;19:85–95. doi: 10.1523/JNEUROSCI.19-01-00085.1999. [DOI] [PMC free article] [PubMed] [Google Scholar]
- 5.Drake CT, Milner TA. Mu opioid receptors are in somatodendritic and axonal compartments of GABAergic neurons in rat hippocampal formation. Brain Res. 1999;849:203–215. doi: 10.1016/s0006-8993(99)01910-1. [DOI] [PubMed] [Google Scholar]
- 6.Drake CT, Milner TA. Mu opioid receptors are in discrete hippocampal interneuron subpopulations. Hippocampus. 2002;12:119–136. doi: 10.1002/hipo.1107. [DOI] [PubMed] [Google Scholar]
- 7.McQuiston AR, Saggau P. Mu-opioid receptors facilitate the propagation of excitatory activity in rat hippocampal area CA1 by disinhibition of all anatomical layers. J Neurophysiol. 2003;90:1936–1948. doi: 10.1152/jn.01150.2002. [DOI] [PubMed] [Google Scholar]
- 8.Nicoll RA, Alger BE, Jahr CE. Enkephalin blocks inhibitory pathways in the vertebrate CNS. Nature. 1980;287:22–25. doi: 10.1038/287022a0. [DOI] [PubMed] [Google Scholar]
- 9.Zieglgänsberger W, French ED, Siggins GR, Bloom FE. Opioid peptides may excite hippocampal pyramidal neurons by inhibiting adjacent inhibitory interneurons. Science. 1979;205:415–417. doi: 10.1126/science.451610. [DOI] [PubMed] [Google Scholar]
- 10.Madison DV, Nicoll RA. Enkephalin hyperpolarizes interneurones in the rat hippocampus. J Physiol. 1988;398:123–130. doi: 10.1113/jphysiol.1988.sp017033. [DOI] [PMC free article] [PubMed] [Google Scholar]
- 11.Woo DH, Han KS, Shim JW, Yoon BE, Kim E, Bae JY, Oh SJ, Hwang EM, Marmorstein AD, Bae YC, Park JY, Lee CJ. TREK-1 and Best1 channels mediate fast and slow glutamate release in astrocytes upon GPCR activation. Cell. 2012;151:25–40. doi: 10.1016/j.cell.2012.09.005. [DOI] [PubMed] [Google Scholar]
- 12.He Y, Yang C, Kirkmire CM, Wang ZJ. Regulation of opioid tolerance by let-7 family microRNA targeting the mu opioid receptor. J Neurosci. 2010;30:10251–10258. doi: 10.1523/JNEUROSCI.2419-10.2010. [DOI] [PMC free article] [PubMed] [Google Scholar]
- 13.Wang HB, Zhao B, Zhong YQ, Li KC, Li ZY, Wang Q, Lu YJ, Zhang ZN, He SQ, Zheng HC, Wu SX, Hokfelt TG, Bao L, Zhang X. Coexpression of delta- and mu-opioid receptors in nociceptive sensory neurons. Proc Natl Acad Sci U S A. 2010;107:13117–13122. doi: 10.1073/pnas.1008382107. [DOI] [PMC free article] [PubMed] [Google Scholar]
- 14.Erbs E, Faget L, Scherrer G, Matifas A, Filliol D, Vonesch JL, Koch M, Kessler P, Hentsch D, Birling MC, Koutsourakis M, Vasseur L, Veinante P, Kieffer BL, Massotte D. A mudelta opioid receptor brain atlas reveals neuronal co-occurrence in subcortical networks. Brain Struct Funct. 2015;220:677–702. doi: 10.1007/s00429-014-0717-9. [DOI] [PMC free article] [PubMed] [Google Scholar]
- 15.Chaudhry FA, Reimer RJ, Bellocchio EE, Danbolt NC, Osen KK, Edwards RH, Storm-Mathisen J. The vesicular GABA transporter, VGAT, localizes to synaptic vesicles in sets of glycinergic as well as GABAergic neurons. J Neurosci. 1998;18:9733–9750. doi: 10.1523/JNEUROSCI.18-23-09733.1998. [DOI] [PMC free article] [PubMed] [Google Scholar]
- 16.Svingos AL, Moriwaki A, Wang JB, Uhl GR, Pickel VM. mu-Opioid receptors are localized to extrasynaptic plasma membranes of GABAergic neurons and their targets in the rat nucleus accumbens. J Neurosci. 1997;17:2585–2594. doi: 10.1523/JNEUROSCI.17-07-02585.1997. [DOI] [PMC free article] [PubMed] [Google Scholar]
- 17.Ruzicka BB, Fox CA, Thompson RC, Meng F, Watson SJ, Akil H. Primary astroglial cultures derived from several rat brain regions differentially express mu, delta and kappa opioid receptor mRNA. Brain Res Mol Brain Res. 1995;34:209–220. doi: 10.1016/0169-328x(95)00165-o. [DOI] [PubMed] [Google Scholar]
- 18.Zou S, Fitting S, Hahn YK, Welch SP, El-Hage N, Hauser KF, Knapp PE. Morphine potentiates neurodegenerative effects of HIV-1 Tat through actions at mu-opioid receptor-expressing glia. Brain. 2011;134:3616–3631. doi: 10.1093/brain/awr281. [DOI] [PMC free article] [PubMed] [Google Scholar]
- 19.Johnson SW, North RA. Opioids excite dopamine neurons by hyperpolarization of local interneurons. J Neurosci. 1992;12:483–488. doi: 10.1523/JNEUROSCI.12-02-00483.1992. [DOI] [PMC free article] [PubMed] [Google Scholar]
- 20.Chen M, Zhao Y, Yang H, Luan W, Song J, Cui D, Dong Y, Lai B, Ma L, Zheng P. Morphine disinhibits glutamatergic input to VTA dopamine neurons and promotes dopamine neuron excitation. Elife. 2015;4:e09275. doi: 10.7554/eLife.09275. [DOI] [PMC free article] [PubMed] [Google Scholar]
- 21.Fan GH, Wang LZ, Qiu HC, Ma L, Pei G. Inhibition of calcium/calmodulin-dependent protein kinase II in rat hippocampus attenuates morphine tolerance and dependence. Mol Pharmacol. 1999;56:39–45. doi: 10.1124/mol.56.1.39. [DOI] [PubMed] [Google Scholar]
- 22.Corrigall WA, Linseman MA. Conditioned place preference produced by intra-hippocampal morphine. Pharmacol Biochem Behav. 1988;30:787–789. doi: 10.1016/0091-3057(88)90100-1. [DOI] [PubMed] [Google Scholar]
- 23.Roy DS, Kitamura T, Okuyama T, Ogawa SK, Sun C, Obata Y, Yoshiki A, Tonegawa S. Distinct neural circuits for the formation and retrieval of episodic memories. Cell. 2017;170:1000–1012.e19. doi: 10.1016/j.cell.2017.07.013. [DOI] [PMC free article] [PubMed] [Google Scholar]