Abstract
Gliomas are the most prevalent type of primary brain tumors in adults, accounting for more than 40% of neoplasms in the central nervous system. The spen paralogue and orthologue C-terminal domain containing 1 (SPOCD1) has been recently identified and found to discriminate progressive from non-progressive bladder cancers. In this study, we detected high-level of SPOCD1 expression in glioma and its high expression significantly associated with advanced tumor grade and poor prognosis. In vitro assays showed that knockdown of SPOCD1 significantly inhibited cell proliferation and colony formation capacities in U373 and U87 cells. In a xenograft model of glioma, SPOCD1 was also found to inhibit tumor growth. In addition, knockdown of SPOCD1 was shown to inhibit cell migration and invasion in glioma U373 and U87 cells. SPOCD1 positively regulated the expression of Pentraxin 3 (PTX3), whereas overexpression of PTX3 attenuated SPOCD1 knockdown-mediated inhibition of cell proliferation, migration and invasion in glioma cells. Our observations suggest that SPOCD1 promotes the proliferation and metastasis of glioma cells through regulating PTX3. Our data might provide novel evidence for the diagnosis and treatment of glioma in clinic.
Keywords: SPOCD1, proliferation, metastasis, glioma, PTX3
Introduction
Glioma is the most common form of brain tumor, accounting for over 40% of all tumors in the center nervous system [1]. A recent cohort investigation has revealed that the overall median survival for patients with malignant glioma is about 15 months [2]. Current therapeutic strategies for glioma consist of neurosurgical resection, chemotherapy and radiotherapy. However, all these strategies have failed to yield a good prognosis of malignant glioma. The poor prognosis may be primarily due to the properties that glioma cells are highly aggressive and capable of infiltrating into adjacent normal brain tissue [3,4]. Recurrence and resistance to chemotherapy are also two influential factors that are to be claimed for dire prognosis [5]. Therefore, it is always an urgency to develop novel strategies for timely diagnosis and to search for innovative therapeutic agents for patients suffering from glioma.
Spen paralogue and orthologue C-terminal (SPOC) domain containing 1 (SPOCD1) is a recently identified novel gene that encodes a protein belonging to the transcription factor S-II (TFIIS) family of transcription factors [6]. SPOCD1 was initially found to interact with testis protein phosphatase 1 which is a major eukaryotic serine/threonine-specific phosphatase regulating cellular signaling in 2011 [7]. It was also speculated that SPOCD1 should be involved in developmental regulation since it contains the SPOC domain normally involved in developmental signaling [7]. However, the function of SPOCD1 has remained to be a mystery since then and received no experimental exploration.
It is until recently that SPOCD1 has received its recognition as a tumor-related factor. An illumine microarray study has shown that SPOCD1 could independently discriminate progressive from non-progressive bladder cancer patients with a sensitivity of 79% and a specificity of 86% (AUC=0.83) [8]. Moreover, SPOCD1 was overexpressed in gastric tumors. Knockout of SPOCD1 reduced gastric cancer cell proliferation, invasive activity, and migration, as well as growth of xenograft tumors in nude mice [9]. An exome array analysis has further identified that a low-frequency missense variant (rs1127549280) in the SPOCD1, at 1p35.2, was reproducibly associated with reduced risk of gastric cancer (odds ratio, 0.56; P=3.48 × 10⁻⁸) [9]. Similarly, it has been recently found that SPOCD1 expression is significantly upregulated in human masticatory mucosa during wound healing [10], placing a possibility for SPOCD1 regulating cell migration processes. These pioneer reports implicated the biological significance of SPOCD1 in human tumorigenesis.
In view of the emerging evidence showing the biological activities of SPOCD1 in human cancers, it is reasonable to investigate the expression profile and functional roles of SPOCD1 in gliomas. To this end, we initially examined expression of SPOCD1 from databases and verified these findings using clinical tissues and in vitro cell line models. Effects of SPOCD1 knockdown on cell proliferation and metastasis were then systemically investigated in this study. Molecular mechanisms of how SPOCD1 exerts its function were also explored. Our data suggest that SPOCD1 promotes the proliferation and metastasis of glioma cells by up-regulating PTX3. Our study might provide novel evidence for the early diagnosis and treatment of glioma in clinic.
Materials and methods
Human glioma tissue collection and ethical statements
A total of 36 glioma tissues and 10 normal brain tissues were collected from the department of The Fourth Affiliated Hospital of Guangxi Medical University during 2010-2017. Their adjacent non-tumor tissues were synchronously obtained for each glioma patients. The Clinical data such as age, gender, tumor size and WHO grade were recorded for statistical analysis. All patients were notified the purpose of this study and each patient showed their full consent to participate in our study. The use of human tissues and protocols of animal experiments were in accordance with regulations made by the Ethical Review Board at The Fourth Affiliated Hospital of Guangxi Medical University hospital.
Cell lines and cell culture
Human glioma cell lines, including U373, U87, T98G, SHG44, A172 and U251 were purchased from the cell bank of Shanghai Biological Institute, Chinese Academy of Science (Shanghai, China). All culture media were supplied with 10% fetal bovine serum (FBS, Hyclone, Logan, UT, USA). U87, U373 and T98G were cultured in Eagle’s Minimum Essential Medium (MEM; Hyclone), while U251 and SHG44 cells were cultured in Dulbecco’s modified Eagle’s medium (DMEM; Hyclone). Cells were maintained at 37°C in a humidified atmosphere of 5% CO2.
Histology analysis
For histology analysis, collected tissues were immediately fixed in formalin for 24 h, embedded in paraffin and cut into 5-μm thick sections. Sections were then dewaxed in xylene and rehydrated gradually through 3 alcohol changes (100%, 95%, and 85% for 5 min each). Sections were firstly stained with eosin, followed by counterstaining with hematoxylin (HE staining). For immunohistochemistry (IHC) analysis, rehydrated sections were subject to microwave irradiation for 3 min in pH 6.0 citric buffer and cooling at room temperature for 60 min to unmask the antigens. Slides were then incubated in phosphate-buffered saline (PBS) containing 3% H2O2 for 10 min to block endogenous peroxidase activity. Thereafter, primary antibodies were incubated with slides overnight at 4°C. After secondary antibody incubation, tissue antigens were visualized using 3,3-diaminobenzidine (DAB) solution and counterstained with hematoxylin. Omission of primary antibodies was used to create negative control slides for all assays. Based on IHC staining, the expression of SPOCD1 in each case was divided into two classes according to the extent of positivity: low expression, <25% of tumor cells showed positive staining; high expression, <25% of tumor cells showed positive staining.
RNAi, plasmid and transfection
The pGV144-PTX3 expression plasmid were constructed by Genechem; for transfection, 1.0 × 10⁵ cells were seeded on 60-mm culture plates to allow for a monolayer extension. Cells were then transfected with oligonucleotides or plasmids using Lipofectamine 2000 (Invitrogen, Carlsbad, CA, USA) according to the manufacturer’s instructions. Transfected cells were incubated at 37°C with 5% CO2 for 48 hours. Efficiency of transfection was evaluated by quantitative real-time polymer chain reaction (qRT-PCR) and western blot analysis.
RNA isolation and qRT-PCR analysis
Total RNAs were extracted using a standard Trizol reagent (Invitrogen). RNAs were immediately reversely transcribed into cDNA using Prime Script TM Master Mix (Takara, Tokyo, Japan) according to the manufacturer’s instructions. Then, qRT-PCR was performed with SYBR Premix EX Taq TM II (Takara) according to its product manual on the real-time PCR detection system ABI7900 (Thermo Fisher Scientific, California, USA). β-actin was used as the internal reference, and gene mRNA expression were calculated by 2-ΔΔCt method.
Western blot analysis
Cells or tissues were lysed in lysis buffer (2% mercaptoethanol, 20% glycerol, 4% SDS in 100 mM Tris-HCl buffer, pH 6.8) with a freshly added protease inhibitor cocktail (Roche Applied Science, Indianapolis, IN, USA). The total protein extracts were quantified using a BCA assay kit (Thermo Fisher Scientific). An equal amount of 50 ng protein extracts were loaded to 12% sodium dodecyl sulfatepolyacrylamide gel electrophoresis (SDS-PAGE) apparatus and transferred to a nitrocellulose membrane (Millipore; Bedford, MA, USA). Next, proteins were detected by specific antibodies using an enhanced chemiluminescence (ECL, Millipore, Bredford, USA). The immunoreactive bands were quantified by the densitometry with Image J software when necessary.
Cell viability determination
Cell viability was determined using the methylthiazoletetrazolium (MTT) assay. Briefly, after corresponding treatments, U373 and U87 cells were trypsinized and reseeded in triplicate in 96-well plates at an initial density of 4,000 cells per well. Cell numbers were monitored for a total of 5 consecutive days. At each indicated time points, cells culture were added with 10 μl of MTT solution (5 mg/mL) per well. After 2 h incubation at room temperature, the absorbance of plate was recorded at 595 nm. Cell viability was defined as the cell number ratio of experimental groups to control cells.
Colony formation assay
To observe the relative long-term effect of SPOCD1 on cell proliferation, colony formation assay was performed. In brief, U373 and U87 cells with different treatments were re-seeded in 6-well plates at an initial density of 900 cells/well and allowed to grow for 14 days to form natural colonies. At the end of monitored time, cells were washed by PBS for three times, treated with crystal violet for 30 min, and washed twice by deionized water. Then, colonies in each group of cells were photographed using a digital camera and the number of colonies was counted.
Transwell migration and invasion assays
In vitro cell migration and invasion assays were performed using Boyden chambers containing polycarbonate filters with a pore size of 8 μm (Coring Incorporated, NY, USA). For migration assay, 1 × 10⁴ cells suspended in 100 μl FBS-free MEM medium were seeded into the upper chamber. In the lower chamber, 500 μl of MEM with 10% FBS was added as chemoattractant.
After incubation for 24 h at 37°C in a 5% CO2 atmosphere, cells on the upper surface of the insert scraped with a cotton swab. Cells adhering to the lower surface were fixed with crystal violet for 15 min and then manually counted under microscope in five fields (× 200). The procedure for cell invasion assay was basically similar to the cell migration assay except that the transwell membranes were precoated with Matrigel for 30 min prior to cells seeding (BD Biosciences, Germany).
A xenograft model of glioma
Briefly, after receiving different treatments, a total of 2 × 10⁶ logarithmically growing U87 cells in 0.1 ml PBS were subcutaneously innoculated into the right flank of 3-week-old male BALB/c nude mice (n=5 per group) (SLAC laboratory animal Center, Shanghai, China). Tumor dimensions were measured for each group of mice once a week for a total of 7 weeks. Tumor volume was calculated using the formula: tumor volume =L × W2/2 where L represents the longer diameter and W represents the shorter diameter of tumors. At the end of experimental period, all neoplasia were excised and weighed. The excised neoplastic tissues were formalin-fixed, paraffin-embedded, sectioned and subject to HE staining for tissue confirmation and IHC analysis using a specific antibody against Proliferating Cell Nuclear Antigen (PCNA). All efforts were made to minimize suffering.
Analysis of microarray data
Initially, the ONCOMINE Cancer Microarray database (http://www.oncomine.org) was queried to study gene expression of SPOCD1 in glioma samples. Gene expression data were also obtained from NCBI Gene Expression Omnibus (GEO) database (accession numbers: GSE4290, GSE7696, GSE4536 and GSE2223) and The Cancer Genome Atlas (TCGA) dataset. Expression data for SPOCD1 were log transformed, median centered per array, and the standard deviation was normalized to one per array. The correlation analysis of SPOCD1 and Pentraxin 3 (PTX3) were performed in GSE4290 and GSE4536 datasets. The univariate analysis of survival data within the glioblastoma dataset of the TCGA was performed using the Kaplan-Meier analysis module of the R2 microarray analysis and visualization platform (http://r2.amc.nl).
Statistical analysis
GraphPad Prism version 5.0 (GraphPad Software, La Jolla, CA, USA) software was used for statistical analysis. Data are shown as mean ± standard deviation (SD). The two-tailed Student’s t-test was used for comparisons between groups. Chi-square test was used to compare differences among categorical variables. The prognostic significance analysis was performed using Kaplan-Meier method and log-rank tests. Differences were considered statistically significant when a two-sided p value was less than 0.05.
Results
SPOCD1 is upregulated in human glioma and its level positively correlates with advanced tumor stage
Initially, we tested the expression of SPOCD1 in glioma by querying the ONCOMINE database (http://www.oncomine.org) [11]. Four microarray expression studies reported the expression of SPOCD1 [12-15] and found that SPOCD1 was consistently elevated in glioma tissues (Supplementary Figure 1). Gene expression data were also obtained from NCBI GEO database (accession numbers: GSE4536, GSE4290, GSE7696 and GSE2223). In the four studies, the mRNA level of SPOCD1 was significantly higher in glioma tissues than that in the adjacent non-tumor tissues with the SPOCD1 mRNA increase ranging from 2.5 to 36.3-fold (Figure 1A). We further verified the SPOCD1 expression in 60 glioma tissues and 10 normal control tissues using qPCR. It was shown that the average mRNA of SPOCD1 in the glioma tissues was over 2-fold of that in normal control tissues (Figure 1B). In the randomly selected 5 glioma cases, western blotting also showed that the protein levels of SPOCD1 were remarkably elevated in all of the tumor tissues as compared with their adjacent non-tumor tissues (Figure 1C). Moreover, in the cell line culture, it was found that U373 and U87 exhibited the highest protein levels of SPOCD1, whereas A172 had the least expression of SPOCD1 (Figure 1D). These results suggest that SPOCD1 is upregulated in human glioma.
Figure 1.
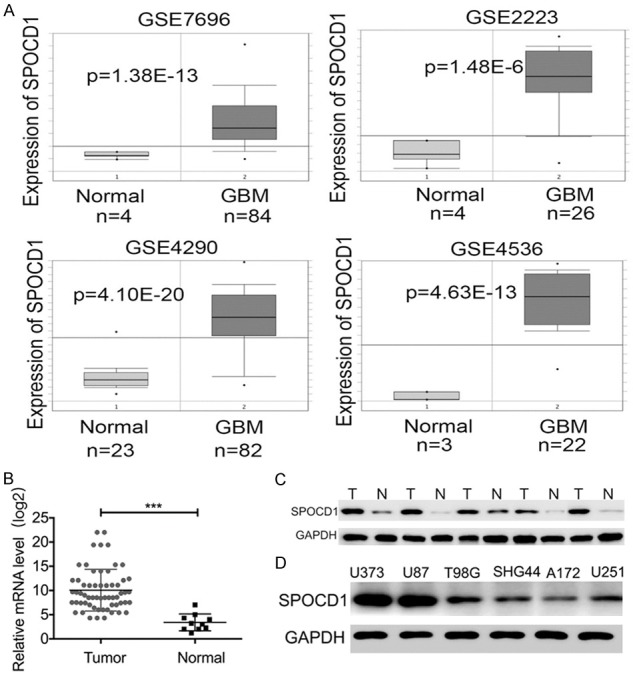
SPOCD1 is upregulated in human glioma. A: Gene expression data were obtained from NCBI Gene Expression Omnibus (GEO) database (accession numbers: GSE7696, GSE2223, GSE4290 and GSE4536). The mRNA level of SPOCD1 was significantly higher in glioma tissues than that in the adjacent non-tumor tissues with the SPOCD1 mRNA increase ranging from 2.5 to 36.3-fold. B: Quantitative PCR analysis of SPOCD1 mRNA in 60 glioma tissues and 10 normal control tissues. C: Total proteins were extracted from 5 randomly selected glioma tissues (T) and their adjacent non-tumor tissues (N), and subject to western blot analysis. D: Western blot analysis of SPOCD1 protein levels in serial glioma cell lines (U373, U87, T98G, SHG44, A172 and U251).
Particularly, it was shown in the GEO database (GSE4290) that along with the glioma turning into higher grade, expression of SPOCD1 mRNA significantly increased (Figure 2A) [13]. The clinical outcome of glioblastoma patients was then analyzed in TCGA datasets. The univariate analysis of survival within the TCGA dataset was performed using the Kaplan-Meier analysis module of the R2 microarray analysis and visualization platform (http://r2.amc.nl). It this dataset, patients with glioblastoma (grade IV of glioma) were divided into SPOCD1 high expression group (n=7) and SPOCD1 low expression group (n=128). It was revealed that glioblastoma patients with high expression of SPOCD1 had a median survival month of 4.53, whereas patients with low expression of SPOCD1 had a median survival month of 13.76 (Figure 2B; p=0.0044). In addition, the correlation between expression pattern of SPOCD1 in glioma and their clinical outcome was analyzed in our study cohort (Table 1). Our results revealed that SPOCD1 overexpression was significantly correlated with WHO tumor grade (p=0.0075). About 72% (26 of 36) of high-grade gliomas (grades III and IV) were found to overexpress SPOCD1. No significant association was found between SPOCD1 expression and other categories, including patients’ age, gender and tumor size. This finding suggests that SPOCD1 level associates with a poor prognosis and correlates with advanced tumor stage in glioma.
Figure 2.
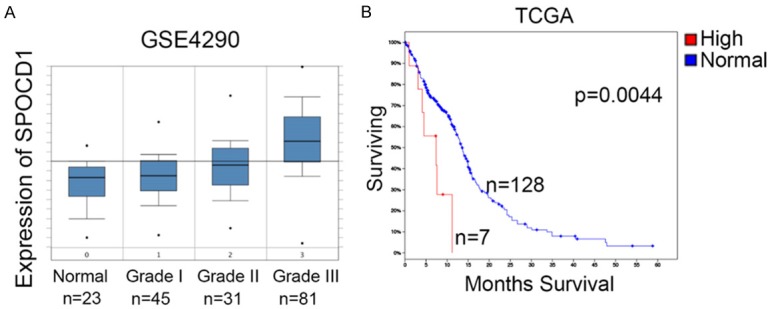
SPOCD1 expression indicates a poor clinical outcome of glioma. A: In the GEO database (GSE4290), the mRNA levels of SPOCD1 were reported in non-tumor tissues and glioma tissues with different grading. With the glioma turning into higher grade, expression of SPOCD1 mRNA significantly increased. B: Kaplan-Meier analysis of glioblastoma patients (grade IV of glioma) in TCGA dataset. Patients with high expression of SPOCD1 had a median survival month of 4.53, whereas patients with low expression of SPOCD1 had a median survival month of 13.76. High expression of SPOCD1 indicates a worse overall survival (P=0.0044).
Table 1.
Association of SPOCD1 expression with clinical parameters
| Parameters | Characteristic | SPOCD1 expression | P value | |
|---|---|---|---|---|
|
| ||||
| High | Low | |||
| Age (years) | ≥54 | 22 | 12 | 0.3948 |
| <54 | 14 | 12 | ||
| Gender | Male | 12 | 10 | 0.4306 |
| Female | 24 | 14 | ||
| Tumor size | ≥4 cm | 21 | 10 | 0.2057 |
| <4 cm | 15 | 14 | ||
| WHO grade | I/II | 10 | 15 | 0.0075* |
| III/IV | 26 | 9 | ||
Knockdown of SPOCD1 inhibits glioma cell proliferation in vitro and in vivo
To evaluate the functional role of SPOCD1 in glioma, we examined the effect of SPOCD1 knockdown on the proliferation of U373 and U87 cells. These cells were stably transfected with either specific shRNAs targeting SPOCD1 (shSPOCD1 group) or a negative control shRNA (NC group). These two cell lines were selected due to their properties of high SPOCD1 levels. Cell proliferation was assessed by MTT assay and colony formation assay in vitro. After transfection of either the first (termed shSPOCD1#1) or the second (shSPOCD1#2) shRNA against SPOCD1, the mRNA levels of SPOCD1 were significantly decreased by up to 60-70% in both cell lines (Figure 3A). The first shSPOCD1 (shSPOCD1#1) was relatively more effective and thus utilized for the subsequent assays (short for shSPOCD1). Western blot analysis further verified that the shSPOCD1 efficiently silenced the expression of SPOCD1 in both U373 and U87 cells (Figure 3B). In the MTT assay, cell viability was continuously monitored for consecutive 5 days. It was observed that three days after transfection of shSPOCD1, knockdown of SPOCD1 caused significant loss of proliferative capacities in both U373 (Figure 3C) and U87 cells (Figure 3D). Similarly, colonies were visually less observed in SPOCD1-silenced cells in the colony formation assay (Figure 3E). Quantification of formed colonies showed that only approximate 30 colonies were observed in SPOCD1-depleted U373 cells, whereas approximate 120 colonies were present after staining of control U373 cells. In U87 cells, only an average of 18 colonies were observed after SPOCD1 depletion, which was an 80% decrease relative to those in control U87 cells (Figure 3F).
Figure 3.
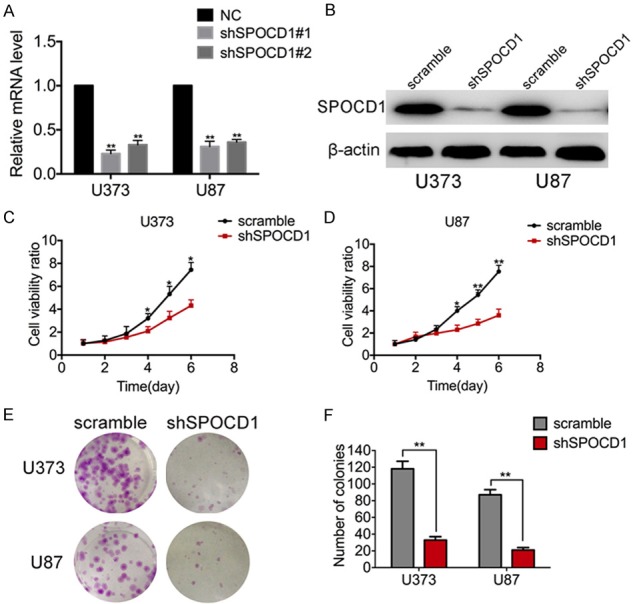
Knockdown of SPOCD1 inhibits glioma cell proliferation in vitro. A: Two specific shRNAs against SPOCD1 were synthesized and transfected into both U373 and U87 cells. A negative control shRNA (NC group) was synchronously used as an experimental control. qPCR analysis verified that both shSPOCD1s worked effectively to deplete the mRNA level of SPOCD1. The first shSPOCD1 was relatively more effective. B: Western blot analysis verified that the first shSPOCD1 was effective to deplete the protein levels of SPOCD1 in U373 and U87 cells. C, D: U373 and U87 cells transfected with scramble shRNA (scramble group) or shSPOCD1 were subject to MTT assay. Cell numbers were monitored for consecutive 5 days. E, F: U373 and U87 cells transfected with scramble shRNA (scramble group) or shSPOCD1 were subject to colony formation assay. Colonies were stained with crystal violet and counted for each group.
We further confirmed the above findings in vivo in a xenograft glioma model. U87 cells transfected with shSPOCD1 (shSPOCD1 group) or scramble shRNA (NC group) were injected subcutaneously into two groups of nude mice (n=5 per group). As expected, tumor growth curve showed that tumors derived from shSPOCD1 group grew more slowly than those from the NC group. Seven weeks after injection, the tumor volume of shSPOCD1 group was 400 ± 21 mm3, whereas the tumor volume of control group was over 800 ± 89 cm3 (Figure 4A). Resected tumors were also visually less sized in the shSPOCD1 group (Figure 4B). Moreover, mean tumor weight at the end of the experiment was significantly lower in the SPOCD1-depleted group (0.19 ± 0.02 g) compared to that in the control group (0.62 ± 0.18 g; Figure 4C). Histology analysis also revealed that PCNA, a cell proliferating biomarker, was less expressed in shSPOCD1 group (Figure 4D). The in vivo experiments support the above in vitro findings and collectively suggest that Knockdown of SPOCD1 inhibits glioma cell proliferation in vitro and in vivo.
Figure 4.
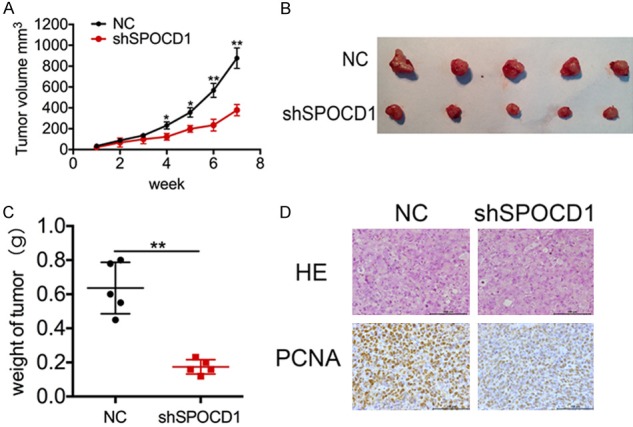
Knockdown of SPOCD1 inhibits tumor growth in vivo in a xenograft glioma model. U87 cells transfected with shSPOCD1 (shSPOCD1 group) or vector alone (NC group) were injected subcutaneously into two groups of nude mice (n=5 per group). A: Tumor volumes were measured for 7 weeks and the tumor growth curve was calculated. Tumors derived from shSPOCD1 group grew more slowly than those from the NC group. B: At the end of the experiment, all tumors were resected. C: Resected tumors were weighed. Tumor weight was significantly lower in the SPOCD1-depleted group (0.19 ± 0.02 g) compared to that in the control group (0.62 ± 0.18 g). D: Tissues from the in vivo model were subject to HE staining and IHC staining using primary antibody against PCNA. PCNA was less expressed in shSPOCD1 group.
Knockdown of SPOCD1 inhibits cell migration and invasion in glioma
Next, effects of SPOCD1 knockdown on cell metastasis were assessed in vitro. U373 and U87 cells transfected with shSPOCD1 or scramble shRNA were subject to transwell migration and invasion assays. After staining, it was observed that both SPOCD1-depleted U373 and U87 cells showed significantly decreased migratory and invasive abilities (Figure 5A). Particularly, U373 cells were decreased of migration abilities by up to 80% and invasion abilities by 81.5% after knockdown of SPOCD1 (Figure 5B). Likewise, knockdown of SPOCD1 caused decreases of migration abilities by up to 80.7% and invasive abilities by 70% in U87 cells (Figure 5C). These results suggest a role of SPOCD1 in the promotion of cell metastasis.
Figure 5.
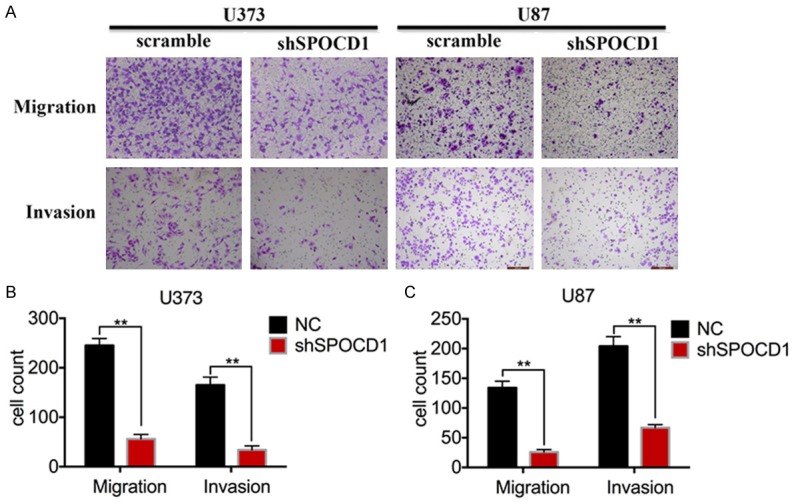
Knockdown of SPOCD1 inhibits cell migration and invasion in glioma. U373 and U87 cells transfected with shSPOCD1 or scramble shRNA were subject to transwell migration and invasion assays. Invasion assay was basically following the protocols for migration assay except for using a Matrigel-coat. A: All transmigrated cells were stained with crystal violet and photographed. B, C: Transmigrated cells were counted in each group of cells for both migration and invasion assays. The data was drawn from five randomly selected fields photographed under microscopy.
SPOCD1 upregulates PTX3 in glioma cells
To study the underlying molecular mechanisms by which SPOCD1 promotes glioma cells aggressiveness, we analyzed the downstream targets of SPOCD1. A coexpression analysis of SPOCD1 was performed using the GEO datasets (Figure 6A and 6B), which showed that PTX3 is one of the targets most significantly associated with SPOCD1 (R=0.719, p<0.01 in GSE4290 and R=0.619, p<0.01 in GSE4536). To confirm this finding, we further examined the expression of SPOCD1 and PTX3 in independent assays using clinically collected 36 cases of glioma. Linear regression analysis showed that the mRNA of SPOCD1 positively associated with that of PTX3 in our clinical tissues (R=0.634, p<0.01, Figure 6C). Moreover, knockdown of SPOCD1 in glioma cells significantly decreased expression of PTX3 at both the mRNA (Figure 6D) and protein levels (Figure 6E). These findings suggest that PTX3 may be targeted by SPOCD1 in glioma.
Figure 6.
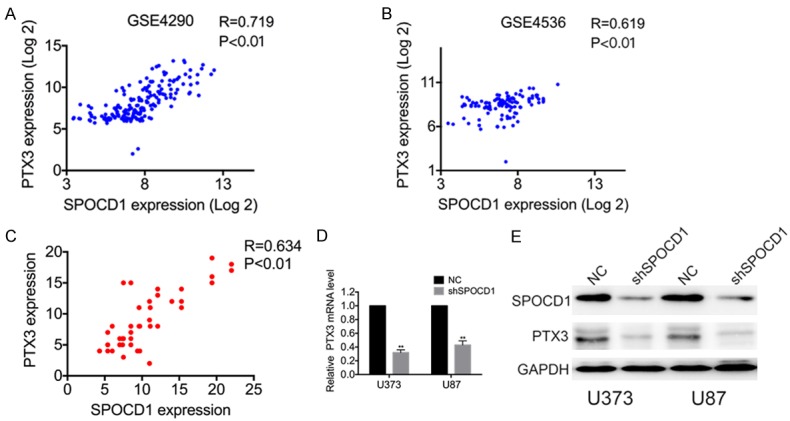
SPOCD1 upregulates PTX3 in glioma cells. (A) The correlation analysis of SPOCD1 and TPTX3 were performed in GSE4290 (A) and GSE4536 datasets (B) using the gene correlation module of the R2 microarray analysis and visualization platform. (C) Linear regression analysis showed the correlation of SPOCD1 mRNA with PTX3 in 36 clinical glioma tissues. (D, E) knockdown of SPOCD1 in U373 and U87 cells caused decreased of PTX3 at both the mRNA level and protein level.
SPOCD1 promotes cell proliferation and metastasis in glioma by regulating PTX3
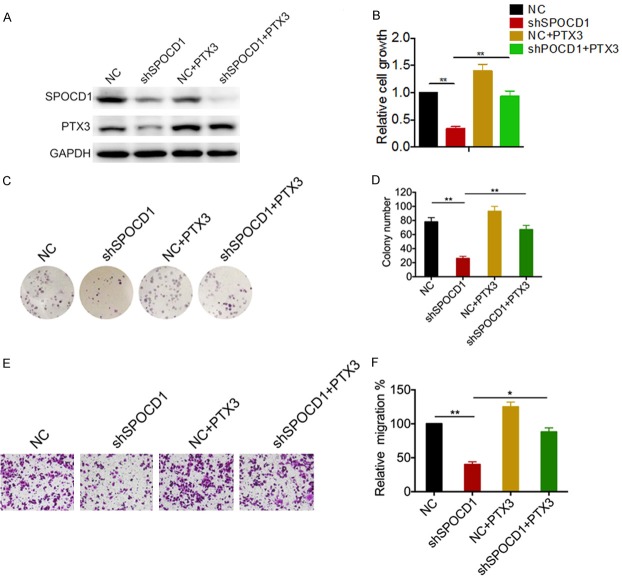
To determine whether SPOCD1 promotes proliferation and metastasis of glioma cells through upregulation of PTX3, we re-expressed the PTX3 in SPOCD1-depleted U87 cells. Western blot analysis confirmed the efficiency of transfection of either shSPOCD1 or PTX3 expression plasmid (Figure 7A). According to the MTT results, re-expression of PTX3 significantly attenuated the growth disadvantage conferred by SPOCD1 depletion in U87 cells (Figure 7B). The colony formation assay also showed that re-expression of PTX3 dramatically attenuated the growth disadvantage conferred by SPOCD1 depletion in U87 cells (Figure 7C). Relative to almost 80 colonies in control group, there was only approximate 20 colonies in sh-SPOCD1 group, but almost 72 colonies were counted in PTX3 re-expressed group (Figure 7D). We also conducted transwell migration assays to assess effects of PTX3 re-expression on SPOCD1-mediated cell metastasis. It was observed that more cells transmigrated in PTX3 re-expression group as compared with SPOCD1-depleted group (Figure 7E). Relative to almost 100 cells that transmigrated in control group, SPOCD1 knockdown decreased migrated cells to be only 40 counts. However, re-expression of PTX3 increased transmigrated cells to a level insignificantly different from the control group (Figure 7F). Taken together, these results suggest that PTX3 is essential for SPOCD1-induced glioma cell proliferation and migration.
Figure 7.
SPOCD1 promotes cell proliferation and metastasis in glioma by regulating PTX3. (A) PTX3 expression plasmid was utilized to re-express PTX3 in SPOCD1-depleted U87 cells. Western blot analysis was performed to confirm transfection efficiency (A). U87 cells transfected with a negative control shRNA (NC), shSPOCD1 and/or PTX3 expression plasmid were then subject to MTT assay (B), colony formation assay (C, D) and transwell migration assay (E, F).
Discussion
As the most common brain tumor, glioma is well-known not only for its rapid growth but also for invading the surrounding brain tissues [16]. Glioma is unfortunately resistant to the current therapeutic strategies which leads to an extremely poor prognosis [5]. Current reports have identified many key mediators that may serve as promising therapeutic targets or as a biomarker for early diagnosis [16,17]. All these studies have enhanced our understanding of glioma development and progression.
The present study investigated the expression and function of a novel gene SPOCD1 in glioma progression. SPOCD1 belongs to the transcription factor S-II (TFIIS) family that is implicated in developmental regulation [6]. Emerging evidence has shown the clinical significance of SPOCD1. It has been shown that SPOCD1 independently discriminates progressive from non-progressive bladder cancer patients with a sensitivity of 79% and a specificity of 86% (AUC=0.83) [8]. Knockout of SPOCD1 reduced gastric cancer cell proliferation, invasive activity, and migration, as well as growth of xenograft tumors [9]. A missense variant of SPOCD1 at 1p35.2 reproducibly associated with reduced risk of gastric cancer [9]. However, whether SPOCD1 plays any role in glioma remains to be elucidated.
We found in the present study that SPOCD1 was overexpressed in glioma tissues in four datasets and in our independent verification tests. The overexpression of SPOCD1 in glioma is consistently observed in gastric tumors [9] and in human masticatory mucosa during wound healing [10], but is in great distinction from that in bladder cancer where an eightfold down-regulation of SPOCD1 was observed as compared with normal tissues [8]. Inconsistent expression of SPOCD1 might implicate different transcription profiles across tissue types. More importantly, high expression of SPOCD1 correlated significantly with poor tumor grading and a shortened survival time. The clinical significance of SPOCD1 was also supported by observations where knockdown of SPOCD1 caused cell proliferation inhibition in vitro and in vivo, and cell migration and invasion abilities were dampened by depletion of SPOCD1 in U373 cells and U87 cells. Hence, these strong evidences suggest that SPOCD1 plays a critical role in promoting cell proliferation and metastasis in glioma. In view of its biological importance elsewhere, previous reports and our current data might suggest that SPOCD1 exerts wide regulatory roles in human tumorigenesis.
Interestingly, we identified PTX3 as a downstream target by which SPOCD1 exerts its cancer-promotion effects in glioma. PTX3, also called tumor necrosis factor (TNF)-inducible gene 14 protein (TSG-14), is a member of the superfamily of acute-phase proteins [18]. PTX3 activates the JNK signaling and regulates the epithelial-to-mesenchymal transition process [19], which is always accompanied with tumor metastasis [20]. In fact, mounting evidence has focused on the potential relationship between PTX3 and various malignancies. Increased plasma levels of PTX3 are associated with poor prognosis of colorectal carcinoma patients [21]. Overexpression of PTX3 might be related to poor prognosis in lung cancer via local inflammation mechanism [22]. Our data showed that SPOCD1 correlated well with PTX3 in both online datasets and clinical tissues. Knockdown of SPOCD1 decreased the expression of PTX3. Re-expression of PTX3 attenuated the cell proliferation and metastasis inhibition conferred by SPOCD1 knockdown. Therefore, PTX3 is essential for SPOCD1-induced glioma cell proliferation and migration. However, the detailed mechanisms of how SPOCD1 regulated PTX3 remains to be uncovered. It is possible that SPOCD1 regulated PTX3 via a direct transcriptional regulation since SPOCD1 is identified as the TSIIS transcription factor family member [6]. It is also plausible that SPOCD1 indirectly regulates PTX3 via a posttranslational modification since evidence has shown that SPOCD1 could interact with protein phosphatase 1 [7]. It merits further investigation of how SPOCD1 concisely regulates PTX3 in promoting cell proliferation and metastasis in glioma.
In all, the present study identified SPOCD1 as a critical mediator of cell proliferation and metastasis in glioma. SPOCD1 was significantly elevated in glioma tissues. Knockdown of SPOCD1 significantly dampened cell proliferation, migration and invasion. PTX3 was a downstream target whereby SPOCD1 exerted its cancer promotion effects in glioma. Drugs targeting either PTX3 or SPOCD1 might be a promising way to develop novel therapeutic strategies against glioma. Our data might provide novel evidence for the diagnosis and treatment of glioma in clinic.
Acknowledgements
This research was supported by Liuzhou Science and Technology Foundation (2015J030511) and Guangxi Natural Science Foundation (2016GXNSFBA380133).
Disclosure of conflict of interest
None.
Supporting Information
References
- 1.Taylor LP. Diagnosis, treatment, and prognosis of glioma: five new things. Neurology. 2010;75(Suppl 1):S28–S32. doi: 10.1212/WNL.0b013e3181fb3661. [DOI] [PubMed] [Google Scholar]
- 2.Erdem-Eraslan L, Gravendeel LA, de Rooi J, Eilers PH, Idbaih A, Spliet WG, den Dunnen WF, Teepen JL, Wesseling P, Sillevis SP, Kros JM, Gorlia T, van den Bent MJ, French PJ. Intrinsic molecular subtypes of glioma are prognostic and predict benefit from adjuvant procarbazine, lomustine, and vincristine chemotherapy in combination with other prognostic factors in anaplastic oligodendroglial brain tumors: a report from EORTC study 26951. J. Clin. Oncol. 2013;31:328–336. doi: 10.1200/JCO.2012.44.1444. [DOI] [PMC free article] [PubMed] [Google Scholar]
- 3.Hu B, Emdad L, Bacolod MD, Kegelman TP, Shen XN, Alzubi MA, Das SK, Sarkar D, Fisher PB. Astrocyte elevated gene-1 interacts with Akt isoform 2 to control glioma growth, survival, and pathogenesis. Cancer Res. 2014;74:7321–7332. doi: 10.1158/0008-5472.CAN-13-2978. [DOI] [PMC free article] [PubMed] [Google Scholar]
- 4.He ZQ, Duan H, Ke C, Zhang XH, Guo CC, Al-Nahari F, Zhang J, Chen ZH, Chen YS, Liu ZG, Wang J, Chen ZP, Jiang XB, Mou YG. Evaluation of cumulative prognostic score based on pretreatment plasma fibrinogen and serum albumin levels in patients with newly diagnosed high-grade gliomas. Oncotarget. 2017;8:49605–49614. doi: 10.18632/oncotarget.17849. [DOI] [PMC free article] [PubMed] [Google Scholar]
- 5.Steeg PS, Camphausen KA, Smith QR. Brain metastases as preventive and therapeutic targets. Nat Rev Cancer. 2011;11:352–363. doi: 10.1038/nrc3053. [DOI] [PMC free article] [PubMed] [Google Scholar]
- 6.Kimura K, Wakamatsu A, Suzuki Y, Ota T, Nishikawa T, Yamashita R, Yamamoto J, Sekine M, Tsuritani K, Wakaguri H, Ishii S, Sugiyama T, Saito K, Isono Y, Irie R, Kushida N, Yoneyama T, Otsuka R, Kanda K, Yokoi T, Kondo H, Wagatsuma M, Murakawa K, Ishida S, Ishibashi T, Takahashi-Fujii A, Tanase T, Nagai K, Kikuchi H, Nakai K, Isogai T, Sugano S. Diversification of transcriptional modulation: large-scale identification and characterization of putative alternative promoters of human genes. Genome Res. 2006;16:55–65. doi: 10.1101/gr.4039406. [DOI] [PMC free article] [PubMed] [Google Scholar]
- 7.Fardilha M, Esteves SL, Korrodi-Gregorio L, Vintem AP, Domingues SC, Rebelo S, Morrice N, Cohen PT, da Cruz e Silva OA, da Cruz e Silva EF. Identification of the human testis protein phosphatase 1 interactome. Biochem Pharmacol. 2011;82:1403–1415. doi: 10.1016/j.bcp.2011.02.018. [DOI] [PubMed] [Google Scholar]
- 8.van der Heijden AG, Mengual L, Lozano JJ, Ingelmo-Torres M, Ribal MJ, Fernandez PL, Oosterwijk E, Schalken JA, Alcaraz A, Witjes JA. A five-gene expression signature to predict progression in T1G3 bladder cancer. Eur J Cancer. 2016;64:127–136. doi: 10.1016/j.ejca.2016.06.003. [DOI] [PubMed] [Google Scholar]
- 9.Zhu M, Yan C, Ren C, Huang X, Zhu X, Gu H, Wang M, Wang S, Gao Y, Ji Y, Miao X, Yang M, Chen J, Du J, Huang T, Jiang Y, Dai J, Ma H, Zhou J, Wang Z, Hu Z, Ji G, Zhang Z, Shen H, Shi Y, Jin G. Exome array analysis identifies variants in SPOCD1 and BTN3A2 that affect risk for gastric cancer. Gastroenterology. 2017;152:2011–2021. doi: 10.1053/j.gastro.2017.02.017. [DOI] [PubMed] [Google Scholar]
- 10.Wang Y, Tatakis DN. Human gingiva transcriptome during wound healing. J Clin Periodontol. 2017;44:394–402. doi: 10.1111/jcpe.12669. [DOI] [PubMed] [Google Scholar]
- 11.Rhodes DR, Yu J, Shanker K, Deshpande N, Varambally R, Ghosh D, Barrette T, Pandey A, Chinnaiyan AM. ONCOMINE: a cancer microarray database and integrated data-mining platform. Neoplasia. 2004;6:1–6. doi: 10.1016/s1476-5586(04)80047-2. [DOI] [PMC free article] [PubMed] [Google Scholar]
- 12.Lee J, Kotliarova S, Kotliarov Y, Li A, Su Q, Donin NM, Pastorino S, Purow BW, Christopher N, Zhang W, Park JK, Fine HA. Tumor stem cells derived from glioblastomas cultured in bFGF and EGF more closely mirror the phenotype and genotype of primary tumors than do serum-cultured cell lines. Cancer Cell. 2006;9:391–403. doi: 10.1016/j.ccr.2006.03.030. [DOI] [PubMed] [Google Scholar]
- 13.Sun L, Hui AM, Su Q, Vortmeyer A, Kotliarov Y, Pastorino S, Passaniti A, Menon J, Walling J, Bailey R, Rosenblum M, Mikkelsen T, Fine HA. Neuronal and glioma-derived stem cell factor induces angiogenesis within the brain. Cancer Cell. 2006;9:287–300. doi: 10.1016/j.ccr.2006.03.003. [DOI] [PubMed] [Google Scholar]
- 14.Murat A, Migliavacca E, Gorlia T, Lambiv WL, Shay T, Hamou MF, de Tribolet N, Regli L, Wick W, Kouwenhoven MC, Hainfellner JA, Heppner FL, Dietrich PY, Zimmer Y, Cairncross JG, Janzer RC, Domany E, Delorenzi M, Stupp R, Hegi ME. Stem cell-related “self-renewal” signature and high epidermal growth factor receptor expression associated with resistance to concomitant chemoradiotherapy in glioblastoma. J. Clin. Oncol. 2008;26:3015–3024. doi: 10.1200/JCO.2007.15.7164. [DOI] [PubMed] [Google Scholar]
- 15.Bredel M, Bredel C, Juric D, Harsh GR, Vogel H, Recht LD, Sikic BI. Functional network analysis reveals extended gliomagenesis pathway maps and three novel MYC-interacting genes in human gliomas. Cancer Res. 2005;65:8679–8689. doi: 10.1158/0008-5472.CAN-05-1204. [DOI] [PubMed] [Google Scholar]
- 16.Wang XQ, Tao BB, Li B, Wang XH, Zhang WC, Wan L, Hua XM, Li ST. Overexpression of TREM2 enhances glioma cell proliferation and invasion: a therapeutic target in human glioma. Oncotarget. 2016;7:2354–2366. doi: 10.18632/oncotarget.6221. [DOI] [PMC free article] [PubMed] [Google Scholar]
- 17.Qiu X, Jiao J, Li Y, Tian T. Overexpression of FZD7 promotes glioma cell proliferation by upregulating TAZ. Oncotarget. 2016;7:85987–85999. doi: 10.18632/oncotarget.13292. [DOI] [PMC free article] [PubMed] [Google Scholar]
- 18.Imai N, Nishi S, Yoshita K, Ito Y, Osawa Y, Takahashi K, Nakagawa Y, Saito K, Takahashi K, Narita I. Pentraxin-3 expression in acute renal allograft rejection. Clin Transplant. 2012;26(Suppl 24):25–31. doi: 10.1111/j.1399-0012.2012.01641.x. [DOI] [PubMed] [Google Scholar]
- 19.Hung TW, Tsai JP, Lin SH, Lee CH, Hsieh YH, Chang HR. Pentraxin 3 activates JNK signaling and regulates the epithelial-to-mesenchymal transition in renal fibrosis. Cell Physiol Biochem. 2016;40:1029–1038. doi: 10.1159/000453159. [DOI] [PubMed] [Google Scholar]
- 20.Nieto MA, Huang RY, Jackson RA, Thiery JP. Emt: 2016. Cell. 2016;166:21–45. doi: 10.1016/j.cell.2016.06.028. [DOI] [PubMed] [Google Scholar]
- 21.Zhang J, Wang TY, Niu XC. Increased plasma levels of pentraxin 3 are associated with poor prognosis of colorectal carcinoma patients. Tohoku J Exp Med. 2016;240:39–46. doi: 10.1620/tjem.240.39. [DOI] [PubMed] [Google Scholar]
- 22.Infante M, Allavena P, Garlanda C, Nebuloni M, Morenghi E, Rahal D, Roncalli M, Cavuto S, Pesce S, Monari M, Valaperta S, Montanelli A, Solomon D, Bottoni E, Errico V, Voulaz E, Bossi M, Chiesa G, Passera E, Mantovani A, Alloisio M. Prognostic and diagnostic potential of local and circulating levels of pentraxin 3 in lung cancer patients. Int J Cancer. 2016;138:983–991. doi: 10.1002/ijc.29822. [DOI] [PubMed] [Google Scholar]
Associated Data
This section collects any data citations, data availability statements, or supplementary materials included in this article.


