Abstract
Objective: This study aims to investigate the effects of co-transfection of the genes for connective tissue growth factor (CTGF) and tissue inhibitor of metalloproteinase-1 (TIMP1) mediated by adeno-associated virus 2 (AAV2) on degenerative lumbar intervertebral discs in a primate model. Methods: Twelve 4-7 year-old rhesus monkeys weighing 4.5-7.0 kg were utilized. CTGF and TIMP1 genes carried by AAV2 were injected into the degenerative lumbar intervertebral discs. Cytokine expression and biological effects were determined using quantitative reverse transcriptase-polymerase chain reaction (RT-PCR) and 35S-sulfate incorporation assays. A rhesus monkey model of intervertebral disc degeneration was successfully established. Results: At post-transfection, CTGF mRNA expression was higher in the transfection group than in the control group (P < 0.05). Furthermore, TIMP1 mRNA expression in the transfection group was several times the levels observed in the control group (P < 0.05). Moreover, type-II collagen mRNA expression was higher in the transfection group than in the control group (P < 0.05). In addition, higher aggrecan mRNA expression and synthesis were observed in the transfection group, compared to that in the control group (P < 0.05). Conclusion: The stable expression of CTGF and TIMP1 genes in vivo promoted the synthesis of aggrecan and type II collagen in the nucleus pulposus in the rhesus monkey model of intervertebral disc degeneration, which has a potential for intervertebral disc regeneration.
Keywords: Adeno-associated virus, connective tissue growth factor, tissue inhibitor of metalloproteinases 1, rhesus monkey, intervertebral discs
Introduction
Intervertebral disc (IVD) degeneration is a major cause of low back pain in humans [1]. Patients with symptomless early degeneration do not ordinarily receive medical treatment, while those exhibiting symptoms of low back pain with late IVD degeneration are usually treated conservatively or by surgical intervention. However, neither of these treatments regenerates IVDs or prevents the further degeneration of IVDs. The IVD comprises of a gel-like structure, the nucleus pulposus (NP), and a tensile outer layer, the annulus fibrosus (AF). Together, these provide biomechanical stability to the spine [2]. The presence of appropriate amounts of type II collagen and aggrecan in the NP is believed to be essential for the optimal function of IVDs. The loss of type II collagen or aggrecan affects the biomechanical function of IVDs, which alters the loading of the facet joint or other structures, causing degenerative changes in the spine [3].
Recent rapid advances in molecular biology have enabled gene therapy to achieve a place at the forefront of medical science. Combination therapies, in which more than one gene is transferrd into a patient, may have high therapeutic potential with fewer side effects compared to conventional treatments for disc degeneration [4-8]. In order to achieve maximal anabolic effects in terms of proteoglycan and type II collagen synthesis, the selection of optimal genes for combination therapy is essential. In previous studies, we were able to established an in vitro cell culture model using rhesus monkey lumbar IVDs. With this in vitro system, we investigated the biological effects of using adeno-associated virus (AAV) to deliver connective tissue growth factor (CTGF) and tissue inhibitor of metalloproteinases 1 (TIMP1) to the disc cells [9,10].
In the present study, an in vivo rhesus monkey model was used as the concept of preclinical and translational research that require large animals with similar anatomy and biomechanical properties to humans. Computed tomography (CT)-guided percutaneous annulus fibrosus puncture is a minimally invasive procedure that induces the early stages of disc degeneration, mimicking the natural degenerative process [11]. This technique was used to establish a rhesus monkey degenerative lumbar IVD model. Using this model, we investigated the effects of employing AAV2 to transfer CTGF and TIMP1 genes into degenerative lumbar IVDs [12-14].
Materials and methods
Animals
Twelve 4-7 year-old rhesus monkeys (average age, 5.2 years old), weighing 4.5-7.0 kg, were provided by the Centre for Laboratory Animals, Affiliated Hospital, Medical College of Qingdao University. Among these 12 rhesus monkeys, five monkeys were female and seven monkeys were male. The use of rhesus monkeys as experimental animals was permitted under the present ethical guidelines. The Institutional Ethics Committee reviewed the protocol and monitored each of the phases of this experiment.
Degenerative IVD model
General anesthesia was induced in these monkeys by intramuscular injections of ketamine (10 mg/kg) and midazolam (0.5 mg/kg). The skin was prepared for surgery by shaving and disinfecting the middle left area of the back of these anesthetized animals. The degenerative IVD model was initiated by percutaneous annulus fibrosus injury using 20G needles [15]. First, the monkeys were immobilized in the right lateral decubitus position, and an IVD (L1-2, L2-3, L3-4, L4-5 and L5-6) CT scan (Siemens, Germany) determined the appropriate angle and puncture depth. Then, CT-guided puncture was conducted. When the CT scan confirmed that the needle point was located at the center of the NP, the needle was rotated 360° before withdrawal (Figure 1).
Figure 1.
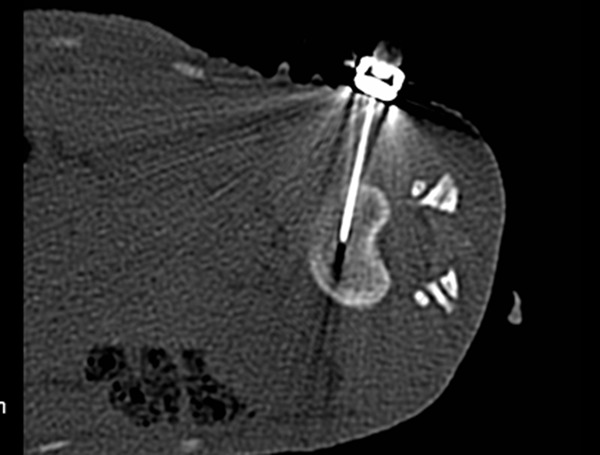
CT scan guided the needle point and confirmed that the needle entered the NP.
Next, 1.5 T magnetic resonance imaging (MRI) examinations at 4, 8 and 12 weeks after annular puncture provided the average signal intensity of the punctured IVDs, which was used to assess the IVD degeneration based on the Pfirrmann classification [16]. Three rhesus monkeys were humanely sacrificed to obtain the IVDs (L1-2, L2-3, L3-4, L4-5, L5-6, L6-7 and L7-S1) for hematoxylin and eosin (H&E), Masson, safranin-O and immunohistochemical staining for type II collagen.
Animals groups and in vivo transduction
Nine rhesus monkeys were left go 12 weeks after needle puncture to induce disc degeneration, and were injected with the virus or phosphate-buffered saline (PBS). These monkeys were randomly divided into three time-point groups (each group includes three monkeys and 21 IVDs) when the samples were collected at 8, 16 and 24 weeks after treatment with genes or PBS, respectively (equivalent to a total of 20, 28 and 36 weeks after needle puncture). In each animal, the L1/2, L2/3 and L3/4 discs was assigned as the gene therapy group, the L4-5 and L5-6 discs was assigned as the negative control group injected with PBS (PBS control group), while the L6-7 and L7-S1 discs that received no puncture and injection treatment was assigned as the blank control group (normal control group). Next, 50 μl of the AAV2 vectors carrying CTGF and TIMP1 genes were injected into the 27 IVDs of monkeys in the gene therapy group using a microinjector guided by CT (1×10¹²/L, constructed and packaged by Vector Gene Technology Company Ltd., Beijing, China). PBS (50 μl, 0.01 mol/L) was injected in 18 IVDs of monkeys in the PBS control group. The remaining 18 IVDs of monkeys in the normal control group were not treated.
Collection of IVDs
The animals were sacrificed at 8, 16, or 24 weeks by injection of an overdose of ketamine (50 mg/kg), and the L1-2, L2-3, L3-4, L4-5, L5-6, L6-7 and L7-S1 IVDs were collected.
H&E staining
The hematoxylin solution was added and left standing for five minutes. After the samples were washed with distilled water, ethanol hydrochloride was added for differentiation. After 30 seconds, the samples were soaked in distilled water for 15 minutes. Then, the eosin solution was added and left standing for 30 seconds, followed by conventional dehydration and xylene treatment. The number of NP cells were counted under an optical microscope.
Masson staining
One-hundred μL of Masson staining solution was added to the hydrated sections. After five minutes, the Masson staining solution was washed off with distilled water, followed by the addition of 100 μL of phosphomolybdic acid for five minutes. Then, 100 μL of aniline blue was added, and the sections were allowed to stand for five minutes. After washing with distilled water, 100 μL of differentiation solution was added to the sections for 30-60 seconds, followed by dehydration with 95% ethanol until transparent. The structural changes of the annulus fibrosus were observed under a light microscope.
Safranin O staining
The sections were stained with Weigert’s solution for 3-5 minutes. Then, acetic acid differentiation liquid was added for 15 seconds. After washing with PBS for one minute, the sections were treated with fast green stain solution for five minutes, and washed with PBS for one minute. Then, Safranin O staining was performed for 1-2 minutes, and washed with PBS for one minute. Subsequently, the sections were washed with acetic acid solution for 1-2 minutes and PBS for one minute.
This was followed by dehydration until transparent. Positive cells that were stained pink presented as aggrecan. A light microscope was used to count the positively stained cells.
Immunohistochemical staining
The sections were treated with 3% H2O2 in deionized water, incubated for 10 minutes, washed three times with distilled water for one minute, and soaked three times in PBS for five minutes. Then, the sections were treated with 0.05% trypsin at 37°C for 30 minutes, and washed four times with PBS for one minute. Next, the primary antibody was added (rabbit anti-human polyclonal antibodies; Beijing Zhongshan Golden Bridge Biotechnology Co, Ltd., Beijing, China). Then, the sections were incubated for two hours, and washed four times with PBS for one minute at 37°C in a humidified chamber. Afterwards, horseradish peroxidase-conjugated PV-6000 IgG antibody was added, and the sections were incubated at 37°C for 30 minutes. The sections were stained using a diaminobenzidine coloration kit after washing in PBS, washed four times in distilled water for two minutes, hematoxylin staining was performed for five minutes, and washed four times with distilled water for two minutes. Differentiation using hydrochloric acid in ethanol was performed for 30 seconds. Then, the sections were washed three times in distilled water for five minutes, followed by dehydration, xylene treatment and oil seal. Positively stained cells had a pale-brown dye, which represents the type II collagen. Positively stained cells were counted from 10 randomly selected high power fields to calculate the positive rate.
mRNA expression detected by RT-PCR
Total RNA from normal and degenerative IVDs was extracted using TRIzol A+RNA reagent (Tiangen Biotech (Beijing) CO., Ltd., China), according to manufacturer’s instructions. Using ultraviolet spectrophotometry, A60 values were used to calculate the total RNA concentration, and OD260/280 were used to determine the purity of the samples. Then, the mRNA was reverse-transcribed into cDNA using a PrimeScript™ RT Reagent kit (Takara, Japan). The cDNA reaction system contained 0.5 μl of Prime-Script™ RT Enzyme Mix I, 0.5 μl of oligo dT Primer, 0.5 μl of random 6-mers, 1 μg of total RNA and RNase-free dH20, up to a total volume of 10 μl. The reagents were mixed, initially incubated at 37°C for 15 minutes, and subsequently incubated at 85°C for five seconds to inactivate the enzyme. The samples were amplified using a quantitative fluorescence-polymerase chain reaction (PCR) instrument (System 7500; ABI, USA). The reaction system contained 10 μl of Premix Ex Taq™ (Takara Company) (2×), 0.8 μl of forward primer, 0.8 μl of reverse primer, 0.8 μl of TaqMan probe, 0.4 μl of ROX reference dye II (50×), 2 μl of template cDNA, and 5.2 μl of dH20. The reaction conditions were 40 cycles (95°C for 10 seconds, 95°C for five seconds, and 62°C for 45 seconds). The sequences of these primers and probes are shown in Table 1.
Table 1.
Sequences of the primers and fluorescent probes
| Sequence | ||
|---|---|---|
| Type II Collagen | Sense | GAGGTGGATGCCACACTCAAG |
| Antisense | CCACTCAGGATGGCAGAGTTTC | |
| Taqman probe | AACCAGATTGAGAGCATCCGCAGCC | |
| CTGF | Sense | GGCAAAAAGTGCATCCGTACTC |
| Antisense | ATCGGCCGTCGGTACATACTC | |
| Taqman probe | TTTGAGCTTTCTGGCTGCACCAGCA | |
| TIMP-1 | Sense | GCTTCTGGCATCCTGTTGTTG |
| Antisense | CTTCTGGTGTCCCCACGAACT | |
| Taqman probe | AGACGGCCTTCTGCAATTCCGACCT | |
| Aggrecan | Sense | GGACTTCCGCTGGTCAGATG |
| Antisense | GGCGGCAAAGAAGTTGTCA | |
| Taqman probe | ATTTGAGAACTGGCGCCCCAACCA | |
Upstream and downstream primers were synthesized by the Shanghai Bioengineering Technology Service Co., Ltd. (Shanghai, China) Fluorescent probes were synthesized by the Dalianbao Biological Company (Dalian, China).
Evaluating aggrecan synthesis efficiency
NP tissues obtained from IVDs were cut into approximately l-mm3 sections using scissors, and weighed. Then, the samples were incubated in 3 ml of serum-free Dulbecco’s modified Eagle’s medium containing 35S (10 μCi/ml), 100 μg of streptomycin and 100 U/ml of penicillin at 37°C with a 5% CO2 atmosphere for 48 hours. The NP sections were washed in running water for three days in sealed dialysis bags, after which 1.0 ml of papain solution containing 0.005 mol/L of elhylene diamine tetraacetic acid (EDTA) and 0.005 mol/L of cysteine hydrochloride were added. Then, the bags were placed in an incubator at 60°C for 24 hours, and opened and transferred to an incubator at 67°C for additional 24 hours. The sections of the dried bag were placed in scintillation vials containing scintillation fluid to determine the counts per minute using a liquid scintillation counter.
Western-blotting
The NP from each group were collected, the cells were lysed using 3 ml/g radioimmunoprecipitation assay (RIPA) solution into the NP tissue, and protein was extracted by ultrasonication in mammalian protein extraction reagent and protease inhibitor. The mixture was incubated on ice for 30 minutes, then centrifuged at 4°C for 10 minutes at 15,000 r/min. The supernatant was stored at -70°C. Total protein was separated by sodium dodecyl sulfate polyacrylamide gel electrophoresis (SDS-PAGE) and the separated proteins were transferred by electroblotting in PBST for 1 hour at room temperature. Following removal of the secondary antibody, a bioluminescent substrate was added and the membrane was developed using a chemiluminescence imaging system. β-actin served as an internal control.
Data processing and statistical analysis
RT-PCR results were assessed using the relative quantitative method. Endogenous glyceraldehyde 3-phosphate dehydrogenase (GAPDH) levels were determined for sample standardization. The relative expression levels of the target genes were calculated using 2-ΔΔct [17] and ΔΔCt = (CtTarget-CtGAPDH)Time0. Ct values indicate the cycle number when the fluorescent signals from the amplification products reached the fluorescence threshold, as determined automatically by the fluorescence PCR instrument. The efficiency of the aggrecan synthesis was calculated according to the following formula: efficiency of aggrecan synthesis = counts per minute (CPM) from 35S-sulfate incorporation assay/sample weight (mg). Statistical analyses were performed using SPSS 13.0 software. Single factor analysis of variance was used for comparison between groups. Statistical significance was established at P < 0.05.
Results
Observations of the IVD model
The MRI images of all IVDs revealed Pfirrmann grade I scores on T2-weighted signals pre-puncture, and at 4, 8 and 12 weeks post-puncture (Figure 2). In untreated animals at 12 weeks post-puncture, H&E staining revealed a decrease in the number of NP cells, compared to normal discs (Figure 3A and 3E). The Masson staining revealed wide cracks between annulus fibrosi at 12 weeks post-puncture (Figure 3B), while normal discs revealed no apparent fibrous cracks (Figure 3F). Furthermore, Safranin-O staining indicated a lower amount of positive cells for aggrecans at 12 weeks post-puncture, compared with normal discs (Figure 3C and 3G). Immunohistochemical staining for type II collagen revealed that the number of positive cells significantly decreased at 12 weeks post-puncture, when compared to normal discs (Figure 3D and 3H).
Figure 2.
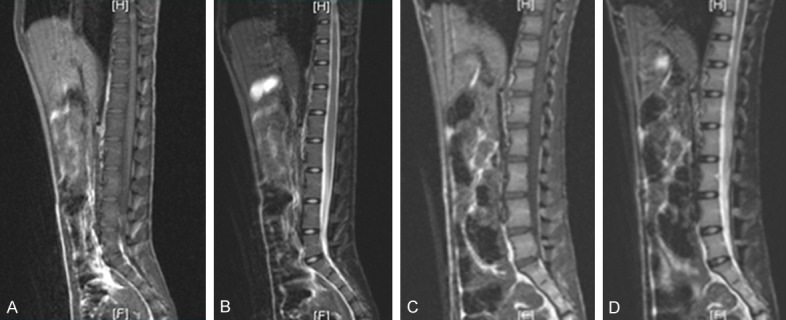
MRI for discs (A) T1-weighted signals of normal disc. (B) T2-weighted signals of normal disc. (C) T1-weighted signals at 12 weeks post-puncture. (D) Pfirrmann level I scores on MR T2-weighted signals at 12 weeks.
Figure 3.
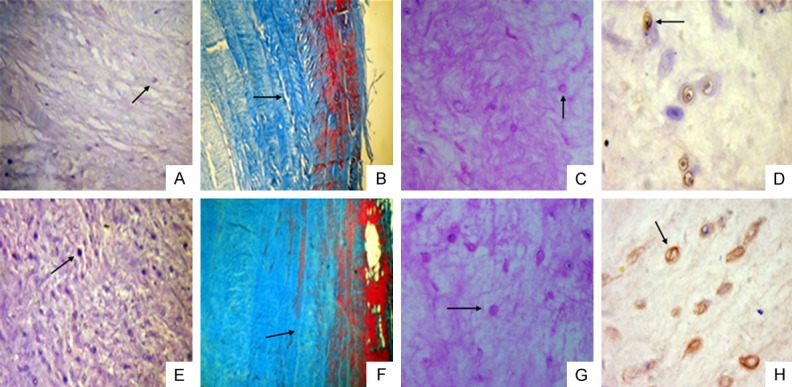
Histological and immunohistochemical staining of the intervertebral disc at 12 weeks post-puncture in the rhesus monkey model of disc degeneration and normal disc. A. H&E staining shows a decreased number of NP cells (indicated by the arrow) at 12 weeks post-puncture (×10). B. Masson staining of the annulus fibrosus indicates that widening of the fibrous cracks (indicated by the arrow) between annulus fibrosi occurred at 12 weeks post-puncture (×40). C. Safranin-O staining indicates sparse positive cells (indicated by the arrow) of the NP for aggrecans at 12 weeks post-puncture (×20). D. Immunohistochemical staining for type II collagen indicates a decreased number of positive cells (indicated by the arrow) at 12 weeks post-puncture (×40). E. H&E staining of the normal disc shows a large number of NP cells (indicated by the arrow) (×10). F. Masson staining of the normal disc shows no apparent fibrous cracks (indicated by the arrow) between fibrous rings in the annulus fibrosus (×40). G. Safranin-O staining of the normal disc indicates more positive cells (indicated by the arrow) (×20). H. Immunohistochemical staining of the normal disc indicates a large number of positive cells (indicated by the arrow) (×40).
Histology after transduction
H&E staining
The number of NP cells was higher at eight weeks (22.50 ± 1.97) and 16 weeks (24.83 ± 1.83) in the gene therapy group, compared with that at eight weeks (15.83 ± 1.72) and 16 weeks (14.83 ± 2.31) in the PBS control group; and the difference was statistically significant (n = 6, P < 0.05). Furthermore, the number of cells in the gene therapy group slightly decreased at 24 weeks (19.67 ± 2.58), but remained higher than that in the PBS control group (13.33 ± 2.10) (n = 6, P < 0.05) (Figure 4).
Figure 4.
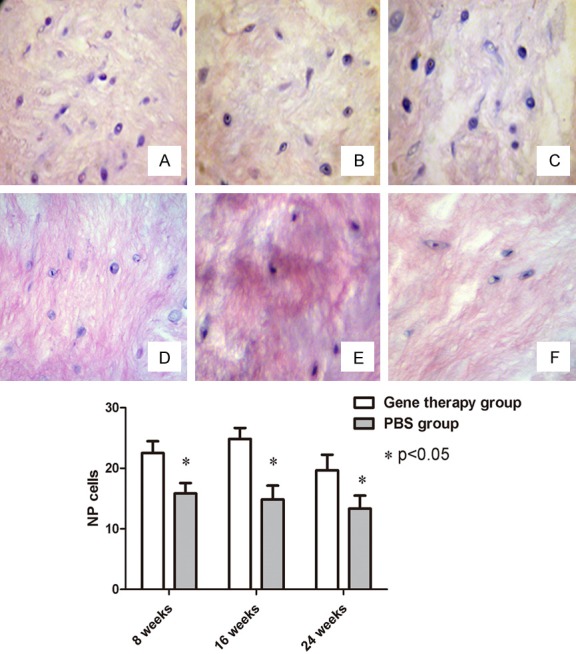
H&E staining of the NP cells (×20). (A) At 8 weeks; (B) At 16 weeks; and (C) At 24 weeks after co-transfection of genes. (D) At 8 weeks; (E) At 16 weeks; and (F) At 24 weeks after treatment of PBS. The quantified data showed that these differences in NP cells were significant between the gene therapy group and PBS control group (P < 0.05).
Safranin O staining
The number of positive cells of the NP for aggrecans increased at eight weeks (19.80 ± 2.71) and 16 weeks (22.50 ± 4.23) after co-transfection, and was higher than that in the PBS control group at eight weeks (14.67 ± 3.60) and 16 weeks (14.10 ± 2.78) (n = 6, P < 0.05). This exhibited a decreasing trend at 24 weeks. The number of positive cells in the gene therapy group and PBS control group were 18.20 ± 1.72 and 11.80 ± 1.94, respectively; and the difference between these two groups was statistically significant (n = 6, P < 0.05) (Figure 5).
Figure 5.
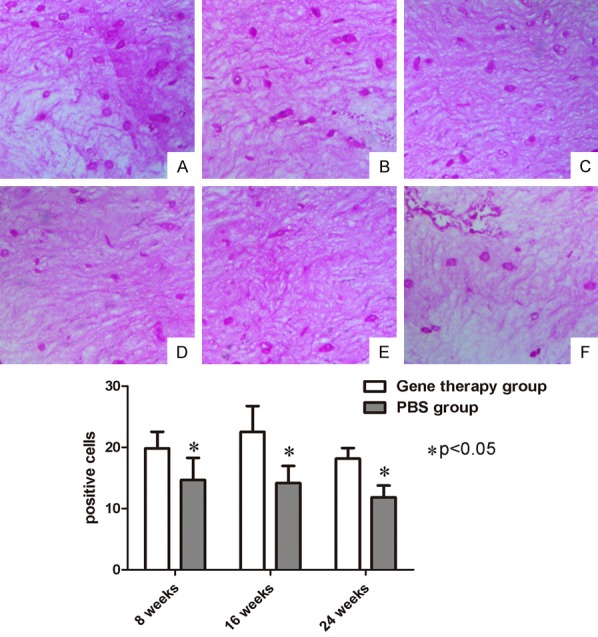
Safranin O staining (×20). (A) At 8 weeks; (B) At 16 weeks; and (C) At 24 weeks after co-transfection of genes. (D) At 8 weeks; (E) At 16 weeks; and (F) At 24 weeks after treatment of PBS. The quantified data showed that these differences in positive cells were significant between the gene therapy group and PBS control group (P < 0.05).
Immunohistochemical staining
Immunohistochemical staining revealed the ability of NP cells to synthesize and secrete type II collagen. At 8, 16 and 24 weeks, the positive rates in the gene therapy group were 73.00 ± 4.56%, 80.83 ± 6.64% and 76.83 ± 6.28%, respectively; while the positive rates in the PBS control group were 61.50 ± 6.09%, 58.50 ± 3.25% and 56.33 ± 3.90%, respectively. Although the number of positive NP cells exhibited a downward trend at 24 weeks, the difference between the gene therapy group and PBS control group remained statistically significant (n = 6, P < 0.05) (Figure 6).
Figure 6.
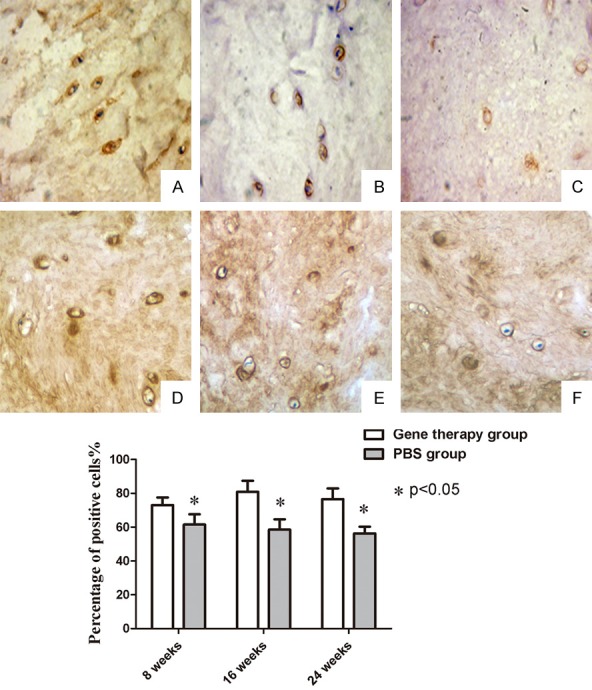
Immunohistochemical staining (×40). (A) at 8 weeks; (B) at 16 weeks; and (C) at 24 weeks after co-transfection. (D) at 8 weeks; (E) at 16 weeks; and (F) at 24 weeks after treatment of PBS. The quantified data showed that these differences in positive rates were significant between the gene therapy group and PBS control group (P < 0.05).
CTGF mRNA levels
CTGF mRNA levels relative to the GAPDH mRNA internal control at 8, 16 and 24 weeks were 3.4826 ± 0.5016, 2.06217 ± 0.3875, and 1.3781 ± 0.2426, respectively, in the co-transfection group (n = 9), 0.3652 ± 0.0198, 1.00260 ± 0.2131, and 1.6721 ± 0.1359, respectively, in the PBS control group (n = 6), and 0.8435 ± 0.1217, 1.14320 ± 0.2901, and 1.1632 ± 0.1325, respectively, in the normal control group (n = 6). When compared at 8, 16 and 24 weeks, significant differences were found between the co-transfection and normal control group (P < 0.05). Significant differences were also found between the co-transfection and PBS control group, when compared at 8 and 16 weeks (P < 0.05). However, there was no significant differences between the co-transfection group and PBS control group, when compared at 24 weeks (P > 0.05).
TIMP1 mRNA levels
TIMP1 mRNA levels relative to the GAPDH mRNA internal control at 8, 16 and 24 weeks were 1.9281 ± 0.3623, 1.2542 ± 0.1436, and 1.1936 ± 0.2354, respectively, in the co-transfection group (n = 9), 0.2876 ± 0.0672, 0.3432 ± 0.0876, and 0.4532 ± 0.1108, respectively, in the PBS control group (n = 6), and 0.7321 ± 0.1986, 0.8925 ± 0.1129, and 1.1801 ± 0.1432 in the normal control group (n = 6). Furthermore, TIMP1 mRNA levels increased in the co-transfection group at 8, 16 and 24 weeks. Moreover, when compared at 8, 16 and 24 weeks, significant differences were found between the co-transfection group and PBS control group (P < 0.05). Significant differences were also found between the co-transfection group and normal control group, when compared at 8 and 16 weeks (P < 0.05). However, there was no significant differences between the co-transfection group and normal control group, when compared at 24 weeks (P > 0.05).
Type II collagen mRNA levels
Type II collagen mRNA levels relative to the GAPDH mRNA internal control at 8, 16 and 24 weeks were 0.6132 ± 0.1459, 0.5231 ± 0.1329, and 0.3368 ± 0.1167, respectively, in the co-transfection group (n = 9), 0.3709 ± 0.0325, 0.3178 ± 0.0439, and 0.3128 ± 0.0429 in the PBS control group (n = 6), and 0.7629 ± 0.1336, 0.8587 ± 0.1421, and 0.8238 ± 0.1167 in the normal control group (n = 6). When compared at 8, 16 and 24 weeks, significant differences were found between the co-transfection group and normal control group (P < 0.05). Furthermore, significant differences were also found between the co-transfection group and PBS control group, when compared at 8 and 16 weeks (P < 0.05). However, there was no significant differences between the co-transfection group and PBS control group, when compared at 24 weeks (P > 0.05).
Aggrecan mRNA levels
Aggrecan mRNA levels relative to the GAPDH mRNA internal control at 8, 16 and 24 weeks were 2.4301 ± 0.1106, 0.8122 ± 0.2076, and 0.4663 ± 0.1029, respectively, in the co-transfection group (n = 9), 0.5186 ± 0.0134, 0.4281 ± 0.0325, and 0.1568 ± 0.0421, respectively, in the PBS group (n = 6), and 1.1526 ± 0.1631, 1.0984 ± 0.1827, and 0.9632 ± 0.1138, respectively, in the normal control group (n = 6). When compared at 8, 16 and 24 weeks, there were significant differences between the co-transfection group and PBS control group (P < 0.05). Furthermore, significant differences were also found between co-transfection group and normal control group, when compared at 8, 16 and 24 weeks (P < 0.05).
Efficiency of aggrecan synthesis
The efficiency of aggrecan synthesis (CPM values) from 35S-sulfate incorporation assays at 8, 16 and 24 weeks were 245.2361 ± 6.9123, 149.3762 ± 7.3264, and 89.9523 ± 6.7871, respectively, in the co-transfection group (n = 9), 54.2563 ± 6.2459, 53.0673 ± 4.8524, and 53.2137 ± 5.0624, respectively, in the PBS control group (n = 6), and 93.2219 ± 8.4623, 89.9015 ± 7.0621, and 92.9850 ± 5.6926, respectively, in the normal control group (n = 6). When compared at 8, 16 and 24 weeks, there were significant differences between the co-transfection group and PBS control group (P < 0.05). Furthermore, significant differences were also found between the co-transfection group and normal control group, when compared at 8 and 16 weeks (P < 0.05). However, there was no significant differences between the co-transfection group and normal control group, when compared at 24 weeks (P > 0.05).
Protein expression of TIMP1 and CTGF
The expression of CTGF and TIMP1 was detected by Western blot (Figures 7, 8) at 8, 16 and 24 weeks after gene therapy, the protein of TIMP1 and CTGF was able to express continuously at 8, 16 and 24 weeks after gene therapy.
Figure 7.
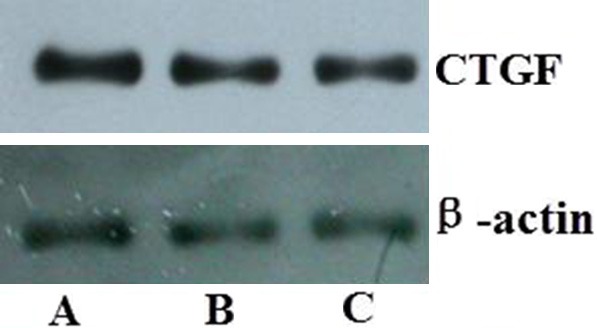
Protein expression of CTGF detected by Western blot. A. 8 weeks after gene therapy; B. 16 weeks after gene therapy; C. 24 weeks after gene therapy.
Figure 8.
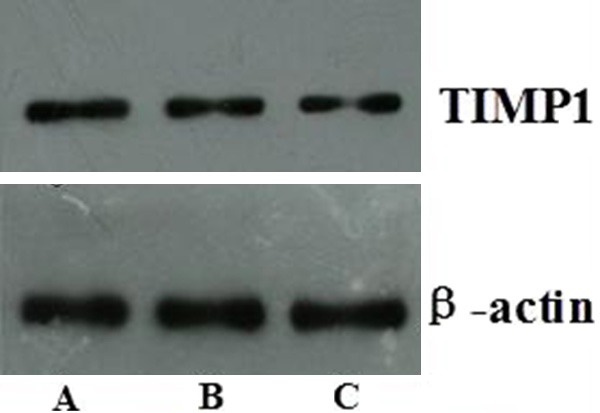
Protein expression of TIMP1 detected by Western blot. A. 8 weeks after gene therapy; B. 16 weeks after gene therapy; C. 24 weeks after gene therapy.
Discussion
The CTGF gene is a member of the CCN gene family that includes Ctgf, Cefl0/cyr and Nov, among others. In vitro studies have confirmed that CTGF can promote fibroblastic mitosis, chemotaxis, adhesion and proliferation [18], as well as expression of types I, III and IV collagen and fibronectin, in human skin fibroblasts [19]. Nakanishi et al. [20] reported that in chondrocytes, CTGF can promote expression of proteoglycan, types II and X collagen, and alkaline phosphatase in a dose-dependent manner. CTGF can also promote cell matrix synthesis, which may inhibit the progression of IVD degeneration. It has been suggested that notochordal cells in IVDs secrete CTGF cytokines to promote the proteoglycan synthesis of cartilage-like cells [4,21]. In addition, CTGF may inhibit matrix degradation and promote neovascularization [5].
TIMP1, a member of the family of metalloproteinase tissue inhibitors, plays a biological role in normal extracellular matrix remodeling and various pathological processes. It inhibits matrix metalloproteinases and apoptosis, and increases extracellular matrix production [6].
The AAV gene delivery system was used in this study, because it offered several advantages over other options. AAV is a single-stranded DNA virus. HCMV is the promoter used to drive gene expression [22]. In the present in vitro study, cells obtained from rhesus monkeys were incubated with rAAV2-EGFP in medium at multiplicities of infection (MOIs). These results revealed that there were no significant cellular morphological changes, and high-titer rAVV infection did not cause a dramatic cytopathic effect [9,12,23,24]. AAV can achieve high viral titers, infect a variety of cells (including non-dividing ones), facilitate the long-term stable expression of exogenous genes by genomic integration into cells, has low toxicity and pathogenicity, and integrates into chromosome 19 of human cells; but the recombinant AAV vectors are stable, episomal concatemers. AAV carrier-transfection efficiency varies in different cell types [13]. For example, higher AAV2 carrier transfection efficiencies are achieved in neurons, hepatic cells and photoreceptors, compared to pulmonary epithelial cells [25-28]. In 1999, Summerford et al. [7] reported that rAAV transfection efficiency could be determined by the type of receptors on the cell surface. These receptors include sulfate-proteoglycan receptors and co-receptors such as integrin αVB5 [29]. Furthermore, rAAV transfection efficiency depends on the abundance of receptors on the cell surface, because rAAV entry into cells is mediated by basic receptors and co-receptors [30]. More recent studies have demonstrated that several viruses including human immunodeficiency virus type 1 (32), herpes simplex virus type 1 (35), adenovirus (Ad) and AAV use cell receptors for attachment and entry1. Among these, AAV and Ad appear to use αV integrins for entry [31]. In the present study, NP cells were targeted by transfection. Since the amount of cell surface receptors is relatively stable, in order to increase the number of genes into the target cells, we used a virus that encoded both genes (CTGF and TIMP1). Furthermore, since our experiment was for the purpose of future human clinic gene therapy, the AAV characteristics of safety and long-term gene expression were very important. The AAV carrier has potential for the long-term expression of a foreign gene in vivo. In animals with normal immunity, AVV expression in the skeletal muscle has been shown to last for less than 12 weeks. In contrast, in “immuno-protected” sites, such as IVDs, AAV expression can persist much longer. Encouragingly, the injection of AAV-carrying LacZ-labeled genes into rabbit IVDs produced a stable gene expression that lasted for more than a year [8]. Lattermann et al. [32] observed that in rabbits, AAV-carrying gene expression was low during the first two weeks of post-transfection, but continuously increased between the 4th and 6th week. Taken together, these studies indicate that AAV-carrying gene transfection has strong potential for delivering stable gene expression over relatively long time periods, as well as having low immunogenicity in the recipient. Hence, it appears likely that the AAV system offers greater potential for gene therapy than vectors based on the adenovirus.
Long-term and stable gene expression is important in gene therapy for IVD degeneration. In the present study, we observed the CTGF and TIMP1 gene expression in the NP at 8, 16 and 24 weeks post-transfection. Our results revealed that the gene expression was highest at 8 and 16 weeks post-transfection, but decreased at 24 weeks. There may be two explanations for the observed decrease in gene expression at 24 weeks. First, the virus-encoded genes were transfected into cells only once, as opposed to being continuously transfected, and apoptosis reduced the number of transfected cells over time. Second, it is possible that changes in the cytokine profile of tissues at 24 weeks post-transfection may have affected the expression of these transfected genes. Nevertheless, TIMP1 expression remained higher at 24 weeks post-transfection in the gene therapy group than in the PBS control group.
In the present study, we sought to investigate the therapeutic potential of the CTGF gene, which promotes cell matrix synthesis in the NP of IVDs, and the TIMP1 gene, which inhibits matrix degradation. AAV2 was used as a delivery vehicle for both genes. AAV2-CTGF-TIMP1 was injected into the NP of rhesus monkey IVDs, and its effects on proteoglycan and collagen synthesis were assessed. The minimally invasive technique used for introducing these target genes into cells has been proven to be both accurate and safe, thereby providing a new approach for gene therapy. With the success of single-agent gene therapy, further experiments have assessed the effect of the transfer of multiple growth factors in the gene therapy cocktail. Comparison studies between the single-agent and combination gene transfer of transforming growth factor (TGF)-β1, IGF-1 and BMP-2 [11] revealed an additional effect in amplifying proteoglycan synthesis [33]. We previously used TGF-β1 and TGF β2 genes to transfect IVDs, and observed that the matrix synthesis improved in the group that received both genes, compared to the group that received only one gene [34]. In addition, our previous study, which used both TGF β1 and vascular endothelial growth factor (VEGF) genes to transfect IVDs, yielded similar results [22]. In vitro experiments were the basis of the in vivo experiments in the present study. However, the environmental condition differences for cell survival between these two continue to exist. The in vivo experiments performed in animals allowed this to be one step closer to clinical application [10,14,35]. Due to the complexity of the minimally invasive method used in this in vivo gene therapy research, certain risks may present for these experimental animals. Since AAV has the advantage of long-term expression, gene therapy observation time could be lengthened and additional indicators could be added in future animal studies. In order to lay a good foundation for future human clinical studies, it is necessary to fully examine the stability and safety of this gene expression.
Conclusion
In the present study, we co-transfected CTGF and TIMP1 genes into IVDs, and found that type II collagen and proteoglycan mRNA levels were higher in the gene therapy group than in the PBS control group at 8, 16, 24 weeks post-transfection. Furthermore, at 8, 16 weeks post-transfection, the levels of aggrecan synthesis were even higher in the gene therapy group than the normal control group. The present study demonstrated that double-gene transfection may promote the synthesis of type II collagen and aggrecan for an extended period of time, which may provide a foundation of gene therapy to retard or reverse disc degeneration.
Acknowledgements
We are particularly grateful to all the people who have given us help on our article. This study was supported by a grant from the National Natural Science Foundation of China (No. 30471750). The authors acknowledge Doctor Howard S. An for his assistance to this study.
Disclosure of conflict of interest
None.
References
- 1.Wu X, Li H, Chen B. Tandem repeats of aggrecan gene and susceptibility of disc degeneration diseases: a case-control study and meta-analysis. Int J Clin Exp Med. 2017;10:5892–5902. [Google Scholar]
- 2.Palmer EI, Lotz JC. The compressive creep properties of normal and degenerated murine intervertebral discs. J Orthop Res. 2004;22:164–169. doi: 10.1016/S0736-0266(03)00161-X. [DOI] [PubMed] [Google Scholar]
- 3.Butler D, Trafimow JH, Andersson GB, McNeill TW, Huckman MS. Discs degenerate before facets. Spine. 1990;15:111–113. doi: 10.1097/00007632-199002000-00012. [DOI] [PubMed] [Google Scholar]
- 4.Erwin WM, Ashman K, O’Donnel P, Inman RD. Nucleus pulposus notochord cells secrete connective tissue growth factor and up-regulate proteoglycan expression by intervertebral disc chondrocytes. Arthritis Rheum. 2006;54:3859–3867. doi: 10.1002/art.22258. [DOI] [PubMed] [Google Scholar]
- 5.McLennan SV, Wang XY, Moreno V, Yue DK, Twigg SM. Connective tissue growth factor mediates high glucose effects on matrix degradation through tissue inhibitor of matrix metalloproteinase type 1: implications for diabetic nephropathy. Endocrinology. 2004;145:5646–5655. doi: 10.1210/en.2004-0436. [DOI] [PubMed] [Google Scholar]
- 6.Lambert E, Dassé E, Haye B, Petitfrère E. TIMPs as multifacial proteins. Crit Rev Oncol Hematol. 2004;49:187–198. doi: 10.1016/j.critrevonc.2003.09.008. [DOI] [PubMed] [Google Scholar]
- 7.Summerford C, Bartlett JS, Samulski RJ. AlphaVbeta5 integrin: a co-receptor for adeno-associated virus type 2 infection. Nat Med. 1999;5:78–82. doi: 10.1038/4768. [DOI] [PubMed] [Google Scholar]
- 8.Levicoff EA, Gilbertson LG, Kang JD. Gene therapy for disc repair. Spine J. 2005;5(Suppl):287S–296S. doi: 10.1016/j.spinee.2005.02.018. [DOI] [PubMed] [Google Scholar]
- 9.Liu Y, Kong J, Chen BH, Hu YG. Combined expression of CTGF and tissue inhibitor of metalloprotease-1 promotes synthesis of proteoglycan and collagen type II in rhesus monkey lumbar intervertebral disc cells in vitro. Chin Med J. 2010;123:2082–2087. [PubMed] [Google Scholar]
- 10.Xiang H, Lin Y, Shen N, Wang Y, Wu X, Zhang G, Ma X, Chen B. Construction and assessment of bio-engineered intervertebral discs. Exp Ther Med. 2017;14:929–1934. doi: 10.3892/etm.2017.4764. [DOI] [PMC free article] [PubMed] [Google Scholar]
- 11.Lian C, Gao B, Wu Z, Qiu X, Peng Y, Liang A, Xu C, Su P, Huang D. Collagen type II is downregulated in the degenerative nucleus pulposus and contributes to the degeneration and apoptosis of human nucleus pulposus cells. Mol Med Rep. 2017;16:4730–4736. doi: 10.3892/mmr.2017.7178. [DOI] [PMC free article] [PubMed] [Google Scholar]
- 12.Tao H, Lin Y, Zhang G, Gu R, Chen B. Experimental observation of human bone marrow mesenchymal stem cell transplantation into rabbit intervertebral discs. Biomed Rep. 2016;5:357–360. doi: 10.3892/br.2016.731. [DOI] [PMC free article] [PubMed] [Google Scholar]
- 13.Lin Y, Yue B, Xiang H, Liu Y, Ma X, Chen B. Survivin is expressed in degenerated nucleus pulposus cells and is involved in proliferation and the prevention of apoptosis in vitro. Mol Med Rep. 2015;13:1026–1032. doi: 10.3892/mmr.2015.4605. [DOI] [PMC free article] [PubMed] [Google Scholar]
- 14.Centeno C, Markle J, Dodson E, Stemper I, Williams CJ, Hyzy M, Ichim T, Freeman M. Treatment of lumbar degenerative disc disease-associated radicular pain with culture-expanded autologous mesenchymal stem cells: a pilot study on safety and efficacy. J Transl Med. 2017;15:197. doi: 10.1186/s12967-017-1300-y. [DOI] [PMC free article] [PubMed] [Google Scholar]
- 15.Kong J, Wang ZX, Ji AY, Wang DC, Qi ZH, Xu WJ, Hao DP, Duan F, Hu YG. [A model of lumbar disc degeneration on the early stage in rhesus monkey with minimally invasive technique] . Zhonghua Wai Ke Za Zhi. 2008;46:835–838. [PubMed] [Google Scholar]
- 16.Pfirrmann CW, Metzdorf A, Zanetti M, Hodler J, Boos N. Magnetic resonance classification of lumbar intervertebral disc degeneration. Spine. 2001;26:1873–1878. doi: 10.1097/00007632-200109010-00011. [DOI] [PubMed] [Google Scholar]
- 17.Livak KJ, Schmittgen TD. Analysis of relative gene expression data using real-time quantitative PCR and the 2(-Delta Delta C(T)) Method. Methods. 2001;25:402–408. doi: 10.1006/meth.2001.1262. [DOI] [PubMed] [Google Scholar]
- 18.Moussad EE, Brigstock DR. Connective tissue growth factor: what’s in a name? Mol Genet Metab. 2000;71:276–292. doi: 10.1006/mgme.2000.3059. [DOI] [PubMed] [Google Scholar]
- 19.Xiao R, Liu FY, Luo JY, Yang XJ, Wen HQ, Su YW, Yan KL, Li YP, Liang YS. Effect of small interfering RNA on the expression of connective tissue growth factor and type I and III collagen in skin fibroblasts of patients with systemic sclerosis. Br J Dermatol. 2006;155:1145–1153. doi: 10.1111/j.1365-2133.2006.07438.x. [DOI] [PubMed] [Google Scholar]
- 20.Nakanishi T, Nishida T, Shimo T, Kobayashi K, Kubo T, Tamatani T, Tezuka K, Takigawa M. Effects of CTGF/Hcs24, a product of a hypertrophic chondrocyte-specific gene, on the proliferation and differentiation of chondrocytes in culture. Endocrinology. 2000;141:264–273. doi: 10.1210/endo.141.1.7267. [DOI] [PubMed] [Google Scholar]
- 21.Erwin WM, Inman RD. Notochord cells regulate intervertebral disc chondrocyte proteoglycan production and cell proliferation. Spine. 2006;31:1094–1099. doi: 10.1097/01.brs.0000216593.97157.dd. [DOI] [PubMed] [Google Scholar]
- 22.Dong YF, Hu YG, Wang DC. Construction of AAV- hVEGF165 and the biological effect of hVEGF165 and TGFβ1 in degenerative annulus fibrosus cell of intervertebral disc. Chin J Orthop. 2006;26:409–414. [Google Scholar]
- 23.Yue B, Lin Y, Ma X, Zhang G, Chen B. Effect of Survivin gene therapy via lentivirus vector on the course of intervertebral disc degeneration in an in vivo rabbit model. Mol Med Rep. 2016;14:4593–4598. doi: 10.3892/mmr.2016.5830. [DOI] [PMC free article] [PubMed] [Google Scholar]
- 24.Yue B, Lin Y, Ma X, Xiang H, Qiu C, Zhang J, Li L, Chen B. Survivin-TGFB3-TIMP1 gene therapy via lentivirus vector slows the course of intervertebral disc degeneration in an in vivo rabbit model. Spine. 2016;41:926–934. doi: 10.1097/BRS.0000000000001474. [DOI] [PubMed] [Google Scholar]
- 25.Choi VW, Asokan A, Haberman RA, Samulski RJ. Production of recombinant adeno-associated viral vectors for in vitro and in vivo use. Curr Protoc Mol Biol. 2007;Chapter 16 doi: 10.1002/0471142727.mb1625s78. Unit 16.25. [DOI] [PubMed] [Google Scholar]
- 26.Madry H, Cucchiarini M, Terwilliger EF, Trippel SB. Recombinant adeno-associated virus vectors efficiently and persistently transduce chondrocytes in normal and osteoarthritic human articular cartilage. Hum Gene Ther. 2003;14:393–402. doi: 10.1089/104303403321208998. [DOI] [PubMed] [Google Scholar]
- 27.Ivanova E, Pan ZH. Evaluation of the adeno-associated virus mediated long-term expression of channelrhodopsin-2 in the mouse retina. Mol Vis. 2009;15:1680–1689. [PMC free article] [PubMed] [Google Scholar]
- 28.Wang C, Ruan DK, Zhang C, Wang DL, Xin H, Zhang Y. Effects of adeno-associated virus-2-mediated human BMP-7 gene transfection on the phenotype of nucleus pulposus cells. J Orthop Res. 2011;29:838–845. doi: 10.1002/jor.21310. [DOI] [PubMed] [Google Scholar]
- 29.Ma X, Lin Y, Yang K, Yue B, Xiang H, Chen B. Effect of lentivirus-mediated survivin transfection on the morphology and apoptosis of nucleus pulposus cells derived from degenerative human disc in vitro. Int J Mol Med. 2015;36:186–194. doi: 10.3892/ijmm.2015.2225. [DOI] [PMC free article] [PubMed] [Google Scholar]
- 30.Yuan Y, Zhou Z, Jiao Y, Li C, Zheng Y, Lin Y, Xiao J, Chen Z, Cao P. Histological identification of propionibacterium acnes in nonpyogenic degenerated intervertebral discs. Biomed Res Int. 2017:6192935. doi: 10.1155/2017/6192935. [DOI] [PMC free article] [PubMed] [Google Scholar]
- 31.Nemerow GR, Stewart PL. Role of alpha(v) integrins in adenovirus cell entry and gene delivery. Microbiol Mol Biol Rev. 1999;63:725–734. doi: 10.1128/mmbr.63.3.725-734.1999. [DOI] [PMC free article] [PubMed] [Google Scholar]
- 32.Lattermann C, Oxner WM, Xiao X, Li J, Gilbertson LG, Robbins PD, Kang JD. The adeno associated viral vector as a strategy for intradiscal gene transfer in immune competent and pre-exposed rabbits. Spine (Phila Pa 1976) 2005;30:497–504. doi: 10.1097/01.brs.0000154764.62072.44. [DOI] [PubMed] [Google Scholar]
- 33.Moon SH, Nishida K, Gilbertson LG, Lee HM, Kim H, Hall RA, Robbins PD, Kang JD. Biologic response of human intervertebral disc cells to gene therapy cocktail. Spine (Phila Pa 1976) 2008;33:1850–1855. doi: 10.1097/BRS.0b013e31817e1cd7. [DOI] [PMC free article] [PubMed] [Google Scholar]
- 34.Sai J, Hu Y, Wang D. Effects of adeno-associated virus (AAV) of transforming growth factors beta1 and beta3 (TGFbeta1,3) on promoting synthesis of glycosaminoglycan and collagen type II of dedifferentiated nucleus pulposus (NP) cells. Sci China C Life Sci. 2007;50:605–610. doi: 10.1007/s11427-007-0066-5. [DOI] [PubMed] [Google Scholar]
- 35.Zioła-Frankowska A, Kubaszewski Ł, Dąbrowski M, Frankowski M. Interrelationship between silicon, aluminum, and elements associated with tissue metabolism and degenerative processes in degenerated human intervertebral disc tissue. Enviro Sci Pollut Res Int. 2017;24:19777–19784. doi: 10.1007/s11356-017-9588-y. [DOI] [PMC free article] [PubMed] [Google Scholar]


