Abstract
The wealth of the combinatorics of nucleotide base pairs enables RNA molecules to assemble into sophisticated interaction networks, which are used to create complex 3D substructures. These interaction networks are essential to shape the 3D architecture of the molecule, and also to provide the key elements to carry molecular functions such as protein or ligand binding. They are made of organised sets of long-range tertiary interactions which connect distinct secondary structure elements in 3D structures. Here, we present a de novo data-driven approach to extract automatically from large data sets of full RNA 3D structures the recurrent interaction networks (RINs). Our methodology enables us for the first time to detect the interaction networks connecting distinct components of the RNA structure, highlighting their diversity and conservation through non-related functional RNAs. We use a graphical model to perform pairwise comparisons of all RNA structures available and to extract RINs and modules. Our analysis yields a complete catalog of RNA 3D structures available in the Protein Data Bank and reveals the intricate hierarchical organization of the RNA interaction networks and modules. We assembled our results in an online database (http://carnaval.lri.fr) which will be regularly updated. Within the site, a tool allows users with a novel RNA structure to detect automatically whether the novel structure contains previously observed RINs.
INTRODUCTION
RNA tertiary structures are highly modular. Canonical Watson–Crick base pairs form what is called the secondary structure, composed of helices interspersed with other secondary structure elements (SSEs) such as multiloops, interior loops, bulges, terminal loops. Additional long-range interactions, those that connect distinct SSEs in 3D structures and non-canonical base pairs or interactions make the molecule adopt its three-dimensional tertiary structure.
RNA modules are small substructures which appear in multiple locations in a variety of different RNA molecules, and which fold identically or almost identically. They are formed of assemblies of non-Watson–Crick base pairs, they mediate the folding of the molecule and they can also constitute specific protein or ligand binding sites (1–6). Well known RNA modules are, for example, GNRA loops, Kink-turns, G-bulges and the A-minor interactions. Identifying, characterizing RNA modules, understanding how they form and what are their relationships are key points for a better understanding of how RNA folds and interact with other molecules. RNA modules can be classified in two classes:
Local modules are located within SSEs: they are mainly formed of non-Watson–Crick base pairings inside the loops (internal, multiple or terminal loops, or bulges) of the secondary structure. Most known modules are built mainly locally, as the G-bulges and the Kink-turn loops (1,3), but they can also constitute an element of an interaction module.
Interaction modules connect two distinct SSEs (helices, loops or local modules). A well-known element of this class is the ‘A-minor’ Type I/II (5,7).
Here we distinguish recurrent interaction networks (RINs) from interaction modules. As specified below, an RIN does not contain any sequence information, but only topological information about the interactions between nucleotides and the nature of these interactions. Thus, a given RIN may be a constituent element of several other RINs. Further, when embedded in sequence space, a given RIN may participate in several types of interaction modules. In other words, when mapped onto sequence information, an identical RIN can give rise to one or several interaction modules.
A number of computational approaches have been developed so far for finding automatically RNA modules in tertiary structures, either by geometric methods, or by algorithms based on graph theory (8–20). Most of these methods aim to find known modules in new structures. A few methods aim to search for modules without any prior knowledge of their geometry or topology (11,15), but they only consider local interactions. Databases, as the RNA 3D Motif Atlas (6), and RNA Bricks (21) store information on the RNA modules which have been found in experimentally determined RNA tertiary structures.
Regarding especially RINs, apart a preliminary attempt (22), no automated method has been developed up to now to detect them in tertiary structures and to classify them without any a priori knowledge of their geometry or topology.
We developed a graph-based methodology to extract all RINs in crystallized RNA tertiary structures and to cluster them according to their similarity. We applied our methodology to a large set of experimentally resolved RNA structures. Not only we retrieved the known RINs (as the different types of A-minors), but we also extracted new ones. Our method gives a global view on interaction networks and their modularity, by organizing them in families according to their inclusion relations. The publicly accessible database CaRNAval http://carnaval.lri.fr allows to visually explore and study all the interaction networks and their intricate relationships.
We further analyze our data and expose the remarkable diversity of the well known A-minor networks. In particular, we show that an unexpected number of unrelated structures form the exact same intricate network of interactions. Furthermore, the diversity of the molecules in which several of these networks are found (e.g. ribosomes, ribozymes and other non-functionally related RNAs) underlines the universality and fundamental nature of these recurrent architectures.
MATERIALS AND METHODS
Given an mmCIF file from the PDB describing an RNA chain, the method presented here works in five steps.
We first build for the chain a directed graph such that the edges represent the phosphodiester bonds as well as the canonical and non-canonical interactions.
From the annotations all canonical base pairs are identified and used to determine the secondary structure. The secondary structure is used to add on each edge a label to indicate whether it is local (inside one SSE) or long-range (between two SSEs).
Each pair of SSEs connected by a long-range interaction is extracted as a separate graph. These graphs are called interaction graphs.
For each pair of interaction graphs, we compute all maximal common subgraphs which obey some other constraints which are developed below. These subgraphs are called interaction networks.
Finally we cluster the identical interaction networks together and create a network of direct inclusions.
We present in Supplementary Figure S1 a schema of the method, and we detail it below.
Data
The non-redundant RNA database maintained on RNA3DHub (23) on 9 September 2016, version 2.92, was used. It contains 845 all-atom molecular complexes with a resolution of at most 3Å. From these complexes, we retrieved all RNA chains also marked as non-redundant by RNA3DHub. Each chain was annotated by FR3D. Because FR3D cannot analyze modified nucleotides or those with missing atoms, our present method does not include them either. If several models exist for a same chain, the first one only was considered. For the rest of this paper, the base pairs extracted from the FR3D annotations are those defined in the Leontis–Westhof geometric classification (24). They are any combination of the orientation cis (c) (resp. trans (t)) with the name of the side which interacts for each of the two nucleotides: Watson–Crick (W) cis • (or ○ for trans), Hoogsteen (H) ▪ (or □) or Sugar-Edge (S) ▸ (resp. ▹). Thus, each base pair is annotated by a string from the set: {c,t}×{W,S,H}2 or by combining previous symbols. To represent a canonical cWW interaction, a double line is generally used instead of (• •).
Secondary structure
For each chain a secondary structure without pseudoknots was deduced from the annotated interactions, as follows. First all canonical Watson–Crick and wobble base pairs (i.e. A-U, G-C and G-U) were identified. Then, since many structures are naturally pseudoknotted, we used the K2N (25) implementation in the PyCogent (26) Python module to remove pseudoknots. Problems arise when a nucleotide is involved in several Watson–Crick base pairs (which is geometrically not feasible), probably due to an error of the automatic annotation. Those discrepancies were removed with a ad hoc algorithm such that if a nucleotide is involved in several Watson–Crick base pairs, we remove the base pair which belongs to the shortest helix.
Secondary structure elements and skeleton graph
From the secondary structure, four types of SSEs are defined. The simplest SSE is a stem, which is a stack of canonical Watson–Crick and Wobble base pairs, containing at least 2 bp. The others are the loops of the secondary structure, classified by the number of strands inside them. The hairpins are single stranded and closed by a canonical base pair. An interior loop has two stranded elements and is closed by two canonical base pairs; we consider bulges as particular interior loops. Finally multi loops are composed of three or more strands. Any loop can also be seen as a cycle in the graph of the secondary structure, because the loops contain the closing canonical base pairs. The only exceptions are the two external loops, that is the dangling ends of the structure.
The non-pseudoknotted secondary structure is then represented as a skeleton graph (27) where the nodes are the SSEs, and there is an edge between two nodes if the two SSEs are consecutive in the secondary structure. Three observations must be done: (i) given any two consecutive SSEs, one and only one must be a stem; (ii) any two consecutive SSEs share one canonical base pair and (iii) any nucleotide can at most belong to two SSEs, which must be consecutive.
For each pair of SSEs with at least two base pair interactions between them, the interaction graph is built, as described in the following section. In the case of consecutive SSEs, the nucleotides in the shared canonical base pair belong to both SSEs.
Interaction graphs
For each pair of SSEs with at least two interactions between them, an ensemble of interaction graphs is identified. An interaction graph g is a directed graph defined as follows: each node represents a nucleotide in an SSE, and each edge represents an interaction or a phosphodiester bond between two nucleotides. Every edge e in g has two attributes:
The relation between the two nucleotides, i.e. a phosphodiester bond or an interaction, canonical or not. The interactions are annotated, as will be seen below.
Whether the relation is local or long-range. Local interactions are the ones occurring between nucleotides of the same SSE. Long-range interactions connect two distinct SSEs.
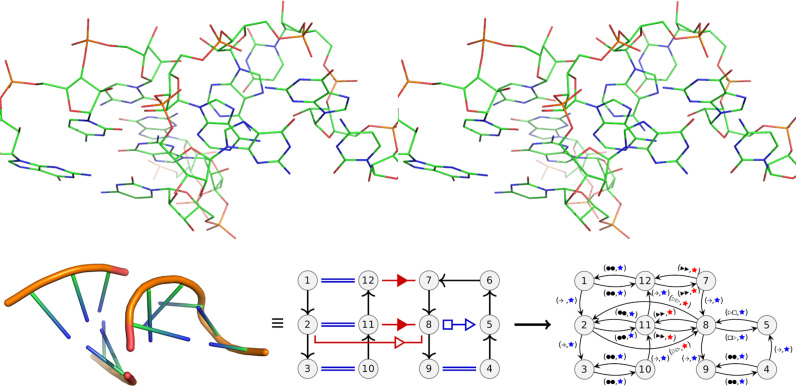
The ensemble of interaction graphs of an SSE pair is built as follows. First a directed graph G is built. A node is added to G for each nucleotide in the SSEs. For each canonical or non-canonical interaction inside each SSE, two edges are added to the graph, in both directions. Each of these edges has a label indicating the type of interaction, in the order of its direction (e.g. cSH). Then, an edge for each phosphodiester bond is added to G in the 5′ → 3′ direction, with its corresponding label. All these edges have a second attribute indicating that they are local (to one SSE). Finally, for each interaction between the SSEs two edges are added to G, one in each direction with the appropriate label. These edges second attributes are marked as long-range. The nodes which are connected to the rest of the graph only through phosphodiester bonds are removed. The weakly connected components of G containing at least one long-range edge are the interaction graphs between the two SSEs. The set of all interaction graphs for all pairs of SSEs is denoted  . We present in Figure 1 an example of an atomic structure with its annotated structure and its corresponding interaction graph. We additionally define two subsets of the set of interaction graphs: adjacent interaction graphs involve two SSEs which are adjacent in the secondary structure, that is they share a cWW pair. The other interaction graphs are called distant interaction graphs.
Figure 1.
Up: a stereo view of a GNRA tetraloop interacting with two Watson–Crick pairs of a helical fragment (from chain A in 4QCN). Below:left: the same substructure, coarse grained. Middle: the annotated substructure, with the Leontis–Westhof representation. In all figures, the long-range interaction are shown in red, local in blue with their Leontis–Westhof annotations, cWW are shown as double lines. The sugar–phosphate backbone is in black, connected by arrows and directed 5′ → 3′. The nucleotides belonging to a network are numbered sequentially. Right: the interaction graph. To build the interaction graph there are two main operations. First the nucleotides without any interaction are removed (nucleotide 6), then the interactions are replaced by labeled doubled directed edges. Nodes with only backbone interactions are removed. The first label of each edge indicates the type of interaction of the base pair, first the interacting face of the source followed by the interacting face of the target. The second label indicates if the interaction is local to an SSE (blue) or long-range (red). This interaction graph is provided in larger size in the Supplementary Figure S3.
Interaction networks
The interaction networks are the RNA structural building blocks that capture the long-range interactions. They are subgraphs of the interaction graphs. We define here the notion of interaction network.
Given two distinct interaction graphs g and h belonging to  , m is a common interaction network of g and h if:
It is a common edge-labeled subgraph of g and h.
It is connected and each node belongs to a cycle in the non-directed graph induced by m. (The non-directed graph induced by m is obtained by replacing every directed edge of m by a non-directed edge and merging those between the same nodes.)
It contains at least two long-range interactions, i.e. four edges labeled as long-range since each interaction is described with two edges.
Each node in m is involved in a canonical or a non-canonical interaction.
If two nodes, a and b in m, form a local canonical base pair, there exists a node c in m such that c is a neighbor to a or b, and c is involved in a long-range or non-canonical interaction. In other words we do not extend stacks whose nucleotides are involved in canonical base pairs only.
Each of the above constraints is justified as follows:
We are searching for recurrent sub-structures, whose geometry is constrained by the labeled edges.
This natural condition is to enforce the cohesiveness of the interaction network.
This is a property of all known interaction networks (as the A-minor and the ribose zipper).
The interaction networks are intended to capture a representation of the geometry. Non interacting nucleotides do not have geometric constraints.
Stacks of canonical base pairs (i.e. at least two consecutive cWW with no other interaction) form the core of the structure and are either embedded in the secondary structure with little geometric variation or result from the folding of the tertiary structure (co-axial stacking between helices, loop–loop interactions or pseudoknots) with often a larger geometric variation.
Searching for recurrent interaction networks (RINs)
We are interested in finding the maximal common interaction networks of two graphs, that is the common interaction networks which cannot be extended in either graph. This problem is an instance of the problem of finding a maximum edge isomorphism and has been shown to be induced by the node isomorphism when the degree is bounded by at least 5 (28). The maximal subgraph isomorphism has been proven to be NP-hard (29) even for many particular classes of graphs including planar graphs (30), and the labels do not create any evident restriction to leverage. We developed an algorithm to solve the problem. Obviously it is exponential in the worst case, but it performs well for our problem. Nevertheless, it requires over 200 GB of RAM for some of the largest comparisons. In the following, maximal common interaction networks will be called recurrent interaction networks (RINs) since they are found in more than one structure.
We describe here the procedure to detect automatically all the maximal common interaction networks between two interaction motifs g and h belonging to  .
.
Given a graph g, a graph n is defined as being a subgraph of g, denoted as n⊆g, if n is isomorphic to a subgraph of g, taking into account the edges labels (the type of interaction and whether it is a long-range interaction or not).
The strategy implemented consists in starting from a smallest common subgraph of g and h, and adding to it one neighboring edge at the time while considering all possibilities, until maximality is obtained. The method whose full procedure is detailed in Algorithm 1 takes as input two graphs g and h such that the number of edges in h is smaller (or equal) than in g without loss of generality, and a set of graphs such that each of them is a subgraph of g and h. We are only interested in the graphs containing long-range interactions, thus the initial set of smallest common subgraphs, sete will be the set of long-range interactions shared between them. Finally each maximal common subgraph computed which has some of its nodes not involved in a cycle is removed to fulfill specification (ii) of an interaction network. The weakly connected components with at least two long-range interactions (i.e. four long-range edges) are returned, to fulfill specification (iii) of an interaction network. Note that, for any pair of interaction graphs, there can be several different maximal common interaction networks.
The main algorithm is based on the following observation: consider the three graphs g, h and n which is a subgraph of g and h (noted as n⊆g, n⊆h) and e ∈ Edges(g). If the graph n augmented with the edge e, n + e, is not a subgraph of h, then for all graphs n′ such that n⊆n′ we know that n′ + e is not a subgraph of h.
To leverage the observation, the algorithm uses a set N of pairs of graphs  , such that each graph n being grown is associated with the set of unexplored admissible edges
  . At the beginning,
  is g minus the edges composing n.
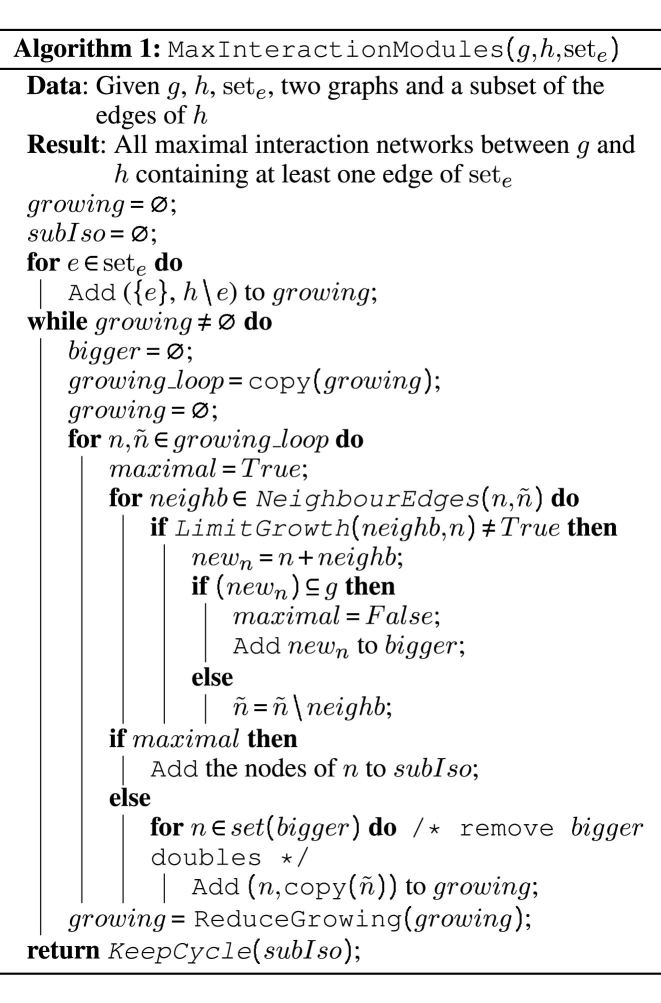
In each round, for each pair of graphs  in N, each edge neighbor of n in
  is independently added to n. If it breaks the subgraph isomorphism property, the edge is removed from
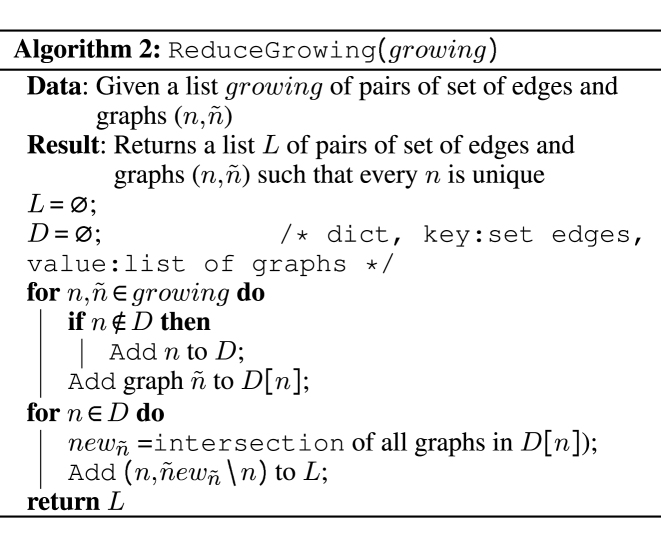
  , else the updated graph n with its additional edge is kept for the next round. After each pair in N has been processed, N is updated with the new ensemble of pairs of graphs. In order to limit, in the next round, the set of neighbor edges admissible to grow the subgraph isomorphism, we pull together all identical subgraphs of g and compute the intersection of their sets of admissibles edges. The implementation is presented in Algorithm 2 which receives as input a list of tuples of graphs with their associated sets of admissibles edges.
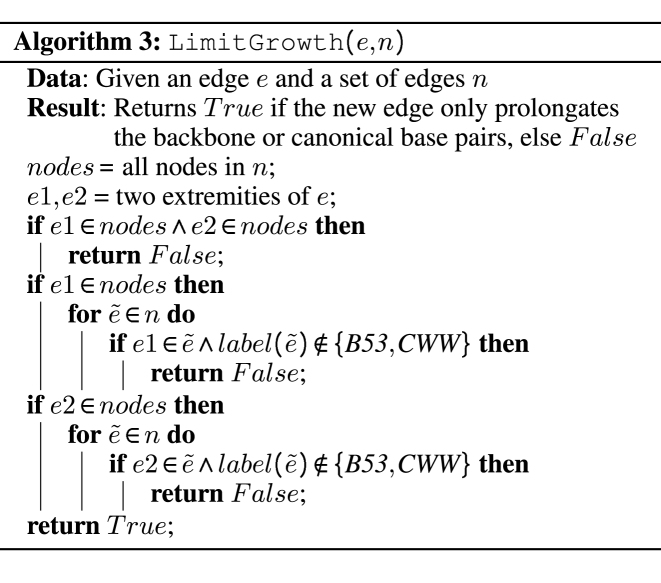
Another algorithm is needed to impede both the growth of stacks of cWW base pairs, and prolongating the backbone chain with non interacting nucleotides, as specified in Section Interaction Networks, item (v). An implementation, shown in Algorithm 3, impedes the growth of stacks of cWW base pairs unless there exists at least one additional interaction in the previous base pair. It similarly impedes the prolongation of the backbone chain if previous nucleotides are not involved in interactions. Given a graph n and a new edge e, it returns False if these conditions are not met, that is to say if the new edge can be added to the graph.
Implementation and web server
The program is implemented in Python2.7 using the networkx (31) Python module which implements the VF2 algorithm (32) for subgraph isomorphism testing. Software and results are accessible through the website http://carnaval.lri.fr.
Visualization
Each RIN has its own page which provides the nucleobase composition over all observations, the secondary structures in which the RIN has been observed and the other RINs that either include or are included in the current RIN. In addition we provide for each RIN a 3D display tool to align and compare the different observations, a 2D extensive display of the observations with PDB files of the RIN with or without its context. We also provide a research tool allowing the user to restrain the display to observations compatible with a sequence specified with the IUPAC nomenclature.
The RINs can be accessed and browsed from two different perspectives. The first one is the catalog, a list of all the RINs (which can be restrained to distant SSE RINs or adjacent SSE RINs by the user). The second one is a graph which represents the network of RINs: a RIN r1 is linked to a RIN r2 if r1 is included in r2 and there is no other RIN which includes r1 and is included in r2. This network of RINs can also be restrained to distant SSEs RINs or adjacent SSEs RINs by the user. In both views, pictures representing the RINs are clickable and open the RIN specific page.
Older versions of the database are kept indexed and accessible. At the present time, the version of RNA3DHub 2.92 is available.
RIN search by interaction features
The large amount of RINs makes the exploration of the results difficult. To ease this process we offer a filter by type of interactions. A minimal or maximal amount of any type of edge—long-range or not, combined with the Leontis–Westhof classification—can be chosen. A catalog with only those RINs fulfilling the ensemble of constraints is then built.
RIN identification in novel structures
As an additional utility, we provide an automatic pipeline in which a structure file, in the mmCIF format, can be uploaded with the name of a specific chain it contains. The structure is annotated by FR3D and all RINs found are extracted. An additional parameter allows to consider, or not, the annotations marked as ‘near’ by FR3D. (We remind the reader that ‘near’ interactions are never considered for identifying the RINs in the CaRNAval database.) The identified RINs in the provided structure are presented in a similar interface as described in Section Visualization.
Code availability
The code is freely available at: http://jwgitlab.cs.mcgill.ca/vreinharz/carnaval_code.
RESULTS
The full graph of recurrent interaction networks
The 845 structures extracted from the PDB contain 912 RNA chains identified as non-redundant. From those all 1426 pairs of SSEs having FR3D annotated interactions between them were identified, belonging to 165 chains. In total 337 RINs were identified, corresponding to 6056 occurrences inside the non-redundant dataset. This number contains duplicate locations: if a RIN has as subgraph another interaction networks, both are counted.
By connecting two RINs if one is a subgraph of the other, a graph can be drawn. The complete graph of RINs of direct inclusions can be visualized at http://carnaval.lri.fr. This graph is constituted of 28 connected components. Among them, 25 components are of small size: from 1 to 9 RINs each. The three other components are much larger and are discussed in detail below.
Ad hoc rules for naming RINs
As discussed above, a RIN does not contain any sequence information, but only topological information about the interactions between nucleotides and the nature of these interactions. The naming of a given RIN brings along potential confusion with the usual names for interaction modules. For simplification, we adopted usual names but in a restrictive way. Thus, the largest component of the complete graph contains 201 RINs and we named it the A-minor mesh because it contains all occurrences of at least one A-minor contact.
The second largest contains nested Watson–Crick base pairs and, consequently, was named the pseudoknot mesh. The third largest component contains always one trans Watson–Crick/Hoogsteen pair and was named accordingly. Within the A-minor mesh several RINs are present (see Figure 2A) and we named them according to the basic interaction they contain. It must be noticed that the GNRA RIN (see Figure 4, top left) does not contain only tetraloop hairpins; it contains the typical trans Hoogsteen/Sugar edge of the GNRA tetraloop.
Figure 2.
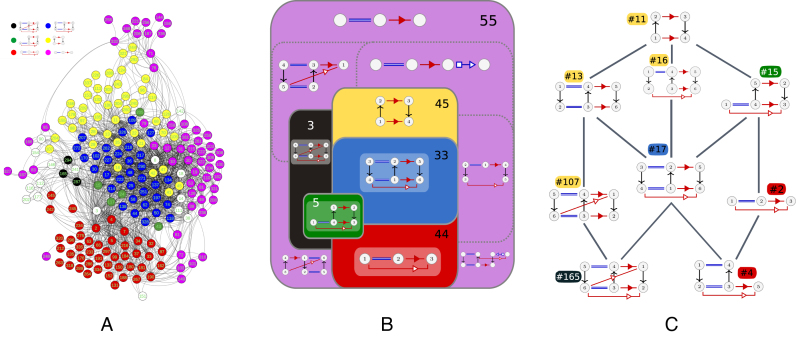
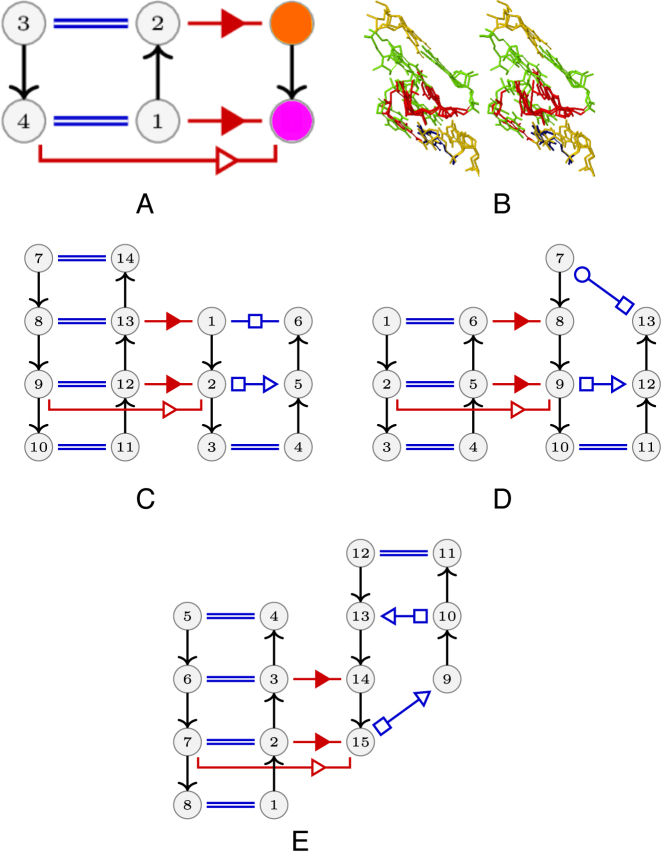
(A) The A-minor mesh. In blue the A-minor Type I/II, in black the same RIN with an additional tSS. A ribose zipper (in yellow) on top of an A-minor type I (red). And in pink the A-minor type II. (B) A synthetic view of the A-minor mesh. All RINs in a same set share a common maximal subgraph which is shown in each set, and two sets have a common boundary if there are edges between some RINs of both sides in the A-minor mesh (i.e. if there are inclusion relations between these RINs). Each set is colored according to the color of its nodes in A. The number of RINs is given for each set. The pink set is subdivided in several parts corresponding to different common maximal subgraphs. (C)The shortest path subgraph between some ‘canonical’ RINs : ribose zipper (RIN 11), A-minor type I (RIN 2), A-minor Type I/II (RIN 17) and A-minor Type I/II with an additional tSS (RIN 165).
Figure 4.
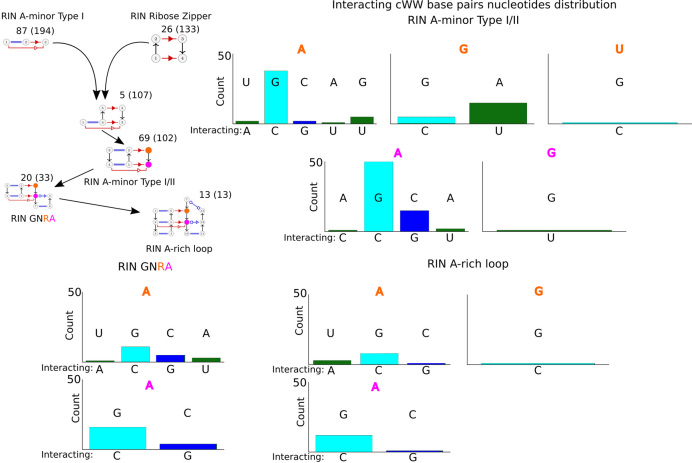
At the top left, connections between the major RINs, the minimal RINs A-minor Type I and ribose zipper, lead to the complete RIN A-minor Type I/II, which can further lead to the RINs GNRA and A-rich loop (the total number of occurrences in the database are indicated between parentheses next to the number excluding their occurrences in other shown RINs). Note that the RIN GNRA is also included into the RIN A-rich loop. For each of these three RINs, we present how the nucleotides in orange and magenta influence the distribution of nucleotides in the interacting cWW pair. Each histogram has below the bar the nucleotide in the cWW base adjacent to the colored one, and the paired one above.
The A-minor mesh
We show the A-minor mesh in Figure 2A. Each vertex is labeled with the number of the RIN it represents. Two vertices have an edge between them if one of them is included in the other (directly or not). We used the ForceAtlas2 algorithm (33) for drawing this graph. This algorithm is a force-directed layout: nodes tend to repulse each other, like charged particles, while edges tend to make nodes closer, like springs. It was proved in (34) that such layouts tend to cluster the nodes by minimizing the so-called modularity of the clusters. In other words, they put together sets of nodes which are interconnected by many edges. The nodes are colored according to the largest type of known RINs they contain among: the A-minor Type I/II (blue), the A-minor Type I/II with an additional tSS interaction (black), the ribose zipper (yellow),the ribose zipper on top of an A-minor type I (red). And in pink the A-minor type II. The ribose zippers do not formally form base pairs, but geometrically they can be categorized in the cis Sugar/Sugar family introduced in (35).
Figure 2B presents a synthetic view of the mesh, by partitioning it in several sets of RINs, according to their closeness in the layout of Figure 2A and to common subgraphs. All RINs in a same set share a common maximal subgraph which is shown in each set, and two sets have a common boundary if there are edges between some RINs of both sides in the A-minor mesh (i.e. if there are inclusion relations between these RINs). Each node in Figure 2B is colored according to the color of its set in Figure 2A, and the cardinality of each set is given.
Figure 2C shows more precisely the variations around the four main RINs of the A-minor mesh: ribose zipper (RIN 11), A-minor type I (RIN 2), A-minor Type I/II (RIN 17) and A-minor Type I/II with an additional tSS (RIN 165). The figure represents the graph of the shortest path between these RINs. More precisely, there is an edge between two RINs if (i) there is a direct inclusion relation between them, and (ii) this edge belongs to a shortest path between two of the four RINs listed above.
RINs contain only topological information about the interacting nucleotides. Thus, the sets shown in the A-minor mesh of Figure 2 can represent (i) the various components of the standard A-minor interaction network, (ii) molecular instances of incomplete configurations present in the crystal structures or (iii) molecular instances of complete sets of interaction networks (e.g. in ribose zipper, only contacts between the riboses occur depending on the sequence).
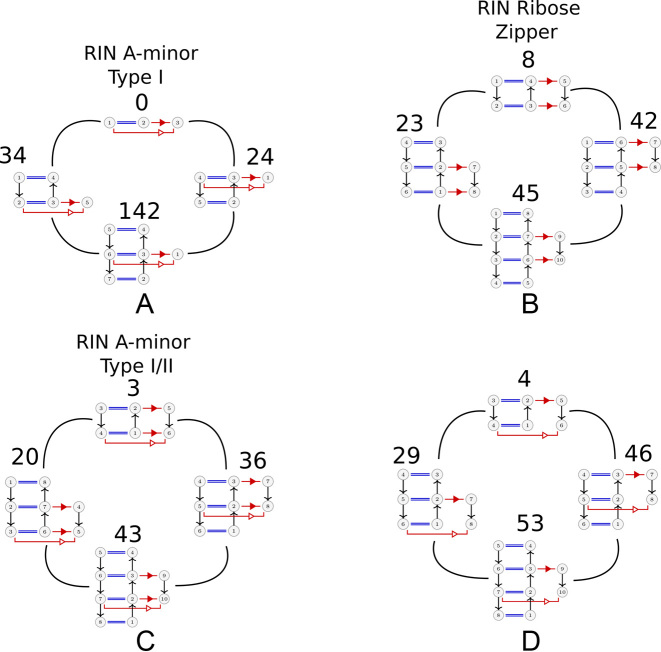
We present in Figure 3 connections between some frequent RINs of the A-minor mesh. The RINs are annotated with the number of unique occurrences. At the top of each subfigure is shown the isolated long-range contact and below the same long-range contact surrounded by two canonical base pairs. In the ribose zipper (Figure 3B) and A-minor (type I/II) (Figure 3A and C), framing with one base pair above or below or on both sides leads to the same order of magnitude in occurrences. However, for the A-minor (type I), framing on both sides is one order of magnitude more frequent than framing with a single base pair. In Figure 3D, on the bottom right, we show the A-minor Type I/II with one missing contact. This situation may occur transiently during the formation of the contact or reflects a contact not fully formed or a lack of resolution in the structures. It has been suggested (36) that A-minor contacts play an important role in the dynamics of internal movements in large RNA molecules and such phenomena would require transient states. From the statistics presented in Figure 3, it is also clear that A-minor type I/II and ribose zipper prefer to bind internally to base pairs within a helix instead of binding at helical ends.
Figure 3.
Connections between some frequent RINs that are annotated with the number of unique occurrences. The subfigures represent three known interaction networks, the A-minor type I (A), the A-minor type I/II (C) and the ribose zipper (B). One can see that the RIN A-minor Type I/II is included within the RIN ribose zipper. In (D) is shown the A-minor type I/II with a missing long-range interaction. Please note that for the ribose zipper, a single long-range contact cannot be deduced by the algorithm since two contacts are required per interaction network (see above Interaction Networks (C)). In each subfigure the top RIN shows the minimal contact and the one at the bottom the same surrounded by canonical base pairs. The middle row shows the RIN with only one additional cWW base pair stacked on either side.
The A-minor Type I/II motif requires two As at the positions interacting with the cWW base pairs (Figure 3C, topmost) and our general method recovered 102 occurrences of the A-minor (type I/II) RIN. All have one A involved in the double cSS/tSS interactions, except one with a G. The position with a single cSS interaction has an A only in 80 occurrences, 21 others have a G and one a U. We show in the Supplementary Figure S2 the RMSD values between the elements of this RIN, dividing them in two groups, depending whether they have a GNRA stem loop or not. Most instances pairs are below 1.5Å.
In Figure 4 we present a more complete and detailed view of the RIN interconnections. The adjunction of A-minor Type I with the ribose zipper contacts gives rise to three modes of long-range contacts via the terminal GNRA hairpin loop, the A-minor type I/II or the internal A-rich loop module.
For each of them, depending on the nucleotides in the colored positions, some preferences are exhibited in the nucleotide composition and order of the interacting cWW base pairs. In the A-minor type I/II long-range contacts, the position in magenta is almost always an A that binds preferentially in cSS the C of a C=G pair (there is one occurrence of a G at the magenta position and it also binds to the C of a C=G pair). At the orange position an A occurs 80 times and binds mainly the C of a C=G pair also, but when the orange position is a G it binds preferentially to the U of a U-A pair. In the GNRA long-range contacts, the preferences are identical. In the A-rich loop again there is a strong preference for an A at positions orange and magenta with both contacting in cSS the C of a C=G pair.
We conclude the analysis of the A-minor component with observations on the GNRA RIN (see also Figure 1). This RIN is presented in Figure 5 with two superimposed occurrences of three dimensional structures found in different contexts, the c-di-gmp riboswitch 3UCZ and the Deinococcus radiodurans large ribosomal subunit 5DM6. The GNRA tetraloop is operationally defined by a sequence and its context, with a potential imprecision in the experimental structure determination and base pair annotation. We focused on a sub-element of the the GNRA RIN, the A-minor type I/II to study its three dimensional diversity. This stresses the points made above: (i) a given RIN may be a constituent element of several other RINs; and (ii) a given RIN may participate in several types of interaction modules. In short, the same RIN can lead to one or several interaction modules. In Figure 5D and E, the diversity of contacts made by A-rich loop (37) is shown; when in the closing pair there is a U, a Watson-Crick/Hoogsteen trans and when there is a G, it forms a Hoogsteen/Sugar edge trans. At the same time the long-range contacts interact with the module differently, but still maintaining the central contact. There is an apparent tendency for the type I A-minor contact to occur with a base (most preferred is a G, see Figure 4) interacting through the Hoogsteen edge with another nucleotide.
Figure 5.
Two superimposed occurrences of (A) are shown in a stereo view (B) as example of the sequence diversity within the RIN GNRA. In the 3UCZ c-di-GMP riboswitch bound to GpG (A), the RIN GNRA occurs between a GAAA tetraloop in contact with two Watson–Crick pairs of a neighboring helix. However, in 5DM6 Deinococcus radiodurans large ribosomal subunit (C), an A-rich loop yields the same interaction contacts. Other RINs leading to similar types of contacts and with a common trans Hoogsteen/Sugar-edge are shown in (D) and (E).
The pseudoknot mesh
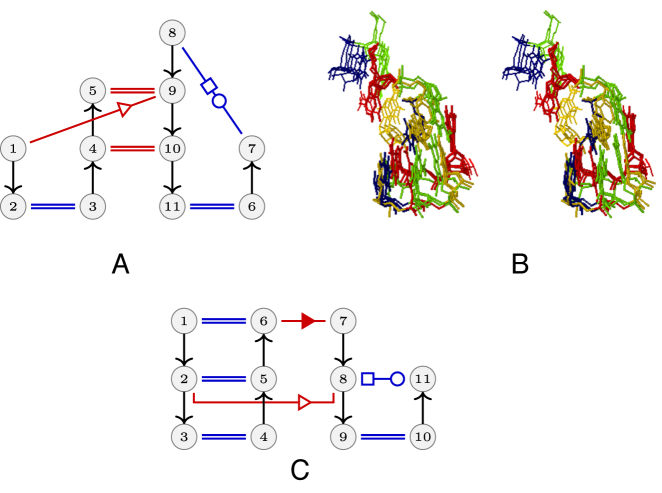
The second main component of the RINs contains 59 RINs and can be named the pseudoknot mesh since most of its RINs are parts of pseudoknots. The simplest of these RINs is a stack of two canonical cWW base pairs, and is the most frequent interaction motif. The pair of SSEs most found in this configuration, 28% of the time, occurs between two hairpin loops, stressing the importance of kissing hairpins as a structural feature in large RNA assemblies. Several more original RINs belong to this component, as the one shown in Figure 6. It shows an interaction network with two cWW and a tSS long-range interaction occurring 10 times in ribozymes, riboswitches and ribosomal subunits. This RIN can be described as T-loop-like, with similar sequence conservations (residues 4 and 10 form always a C=G pair and 1 and 11 are always A and U). This RIN belongs to the UA-handle family (38) and it is part of the trans Watson–Crick–Hoogsteen mesh also.
Figure 6.
An interaction found 10 times is shown on top left and, on the right, a stereo view of the superposition of its occurrences in the 4V9F Haloarcula marismortui large ribosomal subunit, the 4FRG cobalamin and FMN riboswitches and the twister ribozyme. The nucleotides 1 and 11 form a trans Watson–Crick/Hoogsteen pair and can close an hairpin (with a variable number of nucleotides) or can even belong to different strands. The trans Watson–Crick/Hoogsteen pair stacks upon the 4–10 Watson–Crick pair with residues 2 and 3 bulging out and forming a two-stack Watson–Crick pairs. Another example is shown below with a T-loop-like containing 5 nt in the loop (two are not shown) instead of the 7 nt present in the usual T-loops.
The trans-Watson–Crick/Hoogsteen mesh and other RINs
The third large component contains 22 RINS, we name it the trans-Watson–Crick–Hoogsteen mesh because all of its members have such a long-range interaction (see Supplementary Figure S4 for a major constituent of this mesh). The triple base pair involves the trans Watson–Crick/Hoogsteen between the conserved U8 and A14 in tRNAs, as well as the Watson–Crick/Sugar edge between A14 and A21. All instances of this RIN occur in structures of tRNAs either alone or in protein complexes.
Other interesting RINs can also be found in the smaller connected components. In Figure 7, left we present a RIN composed of five nucleotides and three interactions, a cWW, a long-range cWS and a long-range tWS interaction. It is the smallest RIN in a component of four RINs and it has been observed 25 times in a variety of context, tRNAs, riboswitches, ribozymes and ribosomal subunits, hinting at its universality. Residues 4 and 5 are mostly As and, unlike the A-minor contacts, the two As present the Watson–Crick edge for contacting the minor groove of two stacked base pairs. The same figure contains, right, the smallest RIN in a component of nine RINs, with a local cWW and two long-range interactions, a tWW and a cSS. It has been observed 11 times in ribosomal RNAs, signal recognition particle RNAs and a riboswitch. In these RINs, the typical trans Watson–Crick–Hoogsteen pair is disrupted so that the Watson–Crick edge of the A forms a trans Watson–Crick/Watson–Crick pair with another A.
Figure 7.
(Left) Smallest RIN in a component of 4 RINs. Residue 2 is Watson–Crick base paired to a residue that is not shown. This RIN is found in 25 RNAs, riboswitches/ribozyme/ribosomal subunit. (Right) Smallest RIN in a network in a component of 9 RINs, found in 11 RNAs, ribosomal/signal recognition particle RNA/riboswitch
DISCUSSION
In this work, we present a fully automated method for extracting and classifying RNA substructures based on their interactions rather than sequence or context. Through a rigorous mathematical description of the RNA interactions, making a distinction of those within an SSE (local) and those between two SSEs (long-range), our automatic ab initio method detects all RINs between two structure elements. The collection of all RINs is presented in a database called CaRNAval, freely accessible at http://carnaval.lri.fr.
The principal novelty and key element of our methodology is to cluster motifs solely on the base of the similarity of their interaction networks, regardless of the nucleotide composition. This approach enables us to demonstrate the extraordinary versatility and diversity of the well known A-minor contacts, where an unsuspected variety of sequences fold into the exact same intricate network of interactions. We also show that the diversity of RINs is more limited than expected. Only 337 families have been found in all known and annotated RNA structures. The number of structurally non redundant families is even smaller because several RINs are included within others or are part of larger ones. Further, because of lack of crystallographic resolution or molecular dynamics within crystals, one or more contact(s) in similar RINs may be missing leading to the appearance of a distinct RIN. In any case, these long-range contacts display an amazing potential in molecular accommodation and evolution with several neutral intermediate states. Finally, the fact that several complex RINs are found in ribosomes and ribozymes as well as in tRNAs and riboswitches, or other non-functionally related RNAs, demonstrates how fundamental they are for RNA architecture. The extent to which a small number of such structures is found, can be key for the design of novel artificial RNAs and structures.
DATA AVAILABILITY
The collection of all RINs is presented in a database called CaRNAval, freely accessible at http://carnaval.lri.fr. The code is freely available at: http://jwgitlab.cs.mcgill.ca/vreinharz/carnaval_code.
Supplementary Material
ACKNOWLEDGEMENTS
We thank Mahassine Djelloul, Alexis Lamiable, Alexis Delabrière for their help at a very early stage of the work; Yann Ponty for the RIN drawing software; Anton Petrov for the 3D alignment tool; Neocles Leontis for fruitful discussions; and Laurent Darré for technical help.
SUPPLEMENTARY DATA
Supplementary Data are available at NAR Online.
FUNDING
Natural Sciences and Engineering Research Council of Canada [RGPIN-2015-03786, RGPAS 477873-15]; Genome Canada [BCB 2015]; Canadian Institutes of Health Research [BOP-149429]; Fonds de recherche du Québec [211485, FQ-175959]; Erasmus Mundus, Azrieli and Fonds de recherche du Québec Postdoctoral Fellowship (to V.R.); French National Research Agency grant [ANR-15-CE11-0021-01] and Labex [ANR-10-LABX-0036_NETRNA] (to E.W); French Fondation pour la Recherche Médicale [FRM DBI20141423337] (to J.W. and A.D.). Funding for open access charge: French National Research Agency.
Conflict of interest statement. None declared.
REFERENCES
- 1. Leontis N.B., Stombaugh J., Westhof E.. Motif prediction in ribosomal RNAs lessons and prospects for automated motif prediction in homologous RNA molecules. Biochimie. 2002; 84:961–973. [DOI] [PubMed] [Google Scholar]
- 2. Leontis N.B., Westhof E.. Analysis of RNA motifs. Curr. Opin. Struct. Biol. 2003; 13:300–308. [DOI] [PubMed] [Google Scholar]
- 3. Lescoute A., Leontis N.B., Massire C., Westhof E.. Recurrent structural RNA motifs, isostericity matrices and sequence alignments. Nucleic Acids Res. 2005; 33:2395–2409. [DOI] [PMC free article] [PubMed] [Google Scholar]
- 4. Lescoute A., Westhof E.. The A-minor motifs in the decoding recognition process. Biochimie. 2006; 88:993–999. [DOI] [PubMed] [Google Scholar]
- 5. Lescoute A., Westhof E.. The interaction networks of structured RNAs. Nucleic Acids Res. 2006; 34:6587–6604. [DOI] [PMC free article] [PubMed] [Google Scholar]
- 6. Petrov A.I., Zirbel C.L., Leontis N.B.. Automated classification of RNA 3D motifs and the RNA 3D motif atlas. RNA. 2013; 19:1327–1340. [DOI] [PMC free article] [PubMed] [Google Scholar]
- 7. Nissen P., Ippolito J.A., Ban N., Moore P.B., Steitz T.A.. RNA tertiary interactions in the large ribosomal subunit: the a-minor motif. Proc. Natl. Acad. Sci. U.S.A. 2001; 98:4899–4903. [DOI] [PMC free article] [PubMed] [Google Scholar]
- 8. Apostolico A., Ciriello G., Guerra C., Heitsch C.E., Hsiao C., Williams L.D.. Finding 3D motifs in ribosomal RNA structures. Nucleic Acids Res. 2009; 37:e29. [DOI] [PMC free article] [PubMed] [Google Scholar]
- 9. Appasamy S.D., Hamdani H.Y., Ramlan E.I., Firdaus-Raih M.. InterRNA: a database of base interactions in RNA structures. Nucleic Acids Res. 2015; 44:D266–D271. [DOI] [PMC free article] [PubMed] [Google Scholar]
- 10. Cruz J.A., Westhof E.. Sequence-based identification of 3D structural modules in RNA with RMDetect. Nat. Methods. 2011; 8:513–519. [DOI] [PubMed] [Google Scholar]
- 11. Djelloul M., Denise A.. Automated motif extraction and classification in RNA tertiary structures. RNA. 2008; 14:2489–2497. [DOI] [PMC free article] [PubMed] [Google Scholar]
- 12. Duarte C.M., Wadley L.M., Pyle A.M.. RNA structure comparison, motif search and discovery using a reduced representation of RNA conformational space. Nucleic Acids Res. 2003; 31:4755–4761. [DOI] [PMC free article] [PubMed] [Google Scholar]
- 13. Gendron P., Lemieux S., Major F.. Quantitative analysis of nucleic acid three-dimensional structures. J. Mol. Biol. 2001; 308:919–936. [DOI] [PubMed] [Google Scholar]
- 14. Harrison A.-M., South D.R., Willett P., Artymiuk P.J.. Representation, searching and discovery of patterns of bases in complex RNA structures. J. Comput. Aided Mol. Des. 2003; 17:537–549. [DOI] [PubMed] [Google Scholar]
- 15. Huang H.-C., Nagaswamy U., Fox G.E.. The application of cluster analysis in the intercomparison of loop structures in RNA. RNA. 2005; 11:412–423. [DOI] [PMC free article] [PubMed] [Google Scholar]
- 16. Petrov A.I., Zirbel C.L., Leontis N.B.. WebFR3D—a server for finding, aligning and analyzing recurrent RNA 3D motifs. Nucleic Acids Res. 2011; 39(Suppl. 2):W50–W55. [DOI] [PMC free article] [PubMed] [Google Scholar]
- 17. Sargsyan K., Lim C.. Arrangement of 3D structural motifs in ribosomal RNA. Nucleic Acids Res. 2010; 38:3512–3522. [DOI] [PMC free article] [PubMed] [Google Scholar]
- 18. Sarver M., Zirbel C.L., Stombaugh J., Mokdad A., Leontis N.B.. FR3D: finding local and composite recurrent structural motifs in rna 3d structures. J. Math. Biol. 2008; 56:215–252. [DOI] [PMC free article] [PubMed] [Google Scholar]
- 19. Wadley L.M., Pyle A.M.. The identification of novel RNA structural motifs using COMPADRES: an automated approach to structural discovery. Nucleic Acids Res. 2004; 32:6650–6659. [DOI] [PMC free article] [PubMed] [Google Scholar]
- 20. Zhong C., Tang H., Zhang S.. RNAMotifScan: automatic identification of RNA structural motifs using secondary structural alignment. Nucleic Acids Res. 2010; 38:e176. [DOI] [PMC free article] [PubMed] [Google Scholar]
- 21. Chojnowski G., Waleń T., Bujnicki J.M.. RNA Bricks—a database of RNA 3D motifs and their interactions. Nucleic Acids Res. 2014; 42:D123–D131. [DOI] [PMC free article] [PubMed] [Google Scholar]
- 22. Djelloul M. Algorithmes de graphes pour la recherche de motifs récurrents dans les structures tertiaires d’ARN. 2009; Laboratoire de Recherche en Informatique (LRI), Computer Science Department, Université Paris Sud-Paris XI; Ph.D Thesis. [Google Scholar]
- 23. Petrov A. RNA 3D motifs: identification, clustering, and analysis. 2012; Biological Sciences Department, Bowling Green State University; Ph.D Thesis. [Google Scholar]
- 24. Leontis N.B., Westhof E.. Geometric nomenclature and classification of RNA base pairs. RNA. 2001; 7:499–512. [DOI] [PMC free article] [PubMed] [Google Scholar]
- 25. Smit S., Rother K., Heringa J., Knight R.. From knotted to nested RNA structures: a variety of computational methods for pseudoknot removal. RNA. 2008; 14:410–416. [DOI] [PMC free article] [PubMed] [Google Scholar]
- 26. Knight R., Maxwell P., Birmingham A., Carnes J., Caporaso J.G., Easton B.C., Eaton M., Hamady M., Lindsay H., Liu Z. et al. PyCogent: a toolkit for making sense from sequence. Genome Biol. 2007; 8:R171. [DOI] [PMC free article] [PubMed] [Google Scholar]
- 27. Lamiable A., Quessette F., Vial S., Barth D., Denise A.. An algorithmic game-theory approach for coarse-grain prediction of RNA 3D structure. IEEE/ACM Trans. Comput. Biol. Bioinform. 2013; 10:193–199. [DOI] [PubMed] [Google Scholar]
- 28. Gardner M.L. Hypergraphs and Whitney’s theorem on edge-isomorphisms of graphs. Discrete Math. 1984; 51:1–9. [Google Scholar]
- 29. Cook S.A. Harrisson MA, Banerji RB, Ullman JD. The complexity of theorem-proving procedures. Proceedings of the third annual ACM symposium on Theory of computing. 1971; NY: ACM; 151–158. [Google Scholar]
- 30. De La Higuera C., Janodet J.-C., Samuel É., Damiand G., Solnon C.. Polynomial algorithms for open plane graph and subgraph isomorphisms. Theor. Comput. Sci. 2013; 498:76–99. [Google Scholar]
- 31. Hagberg A., Swart P., Chult D.C.. Exploring network structure, dynamics, and function using networkx. 2008; Theoretical Division, Los Alamos National Laboratory (LANL)Technical report. [Google Scholar]
- 32. Cordella L.P., Foggia P., Sansone C., Vento M.. A (sub)graph isomorphism algorithm for matching large graphs. IEEE Trans. Pattern Anal. Mach. Intell. 2004; 26:1367–1372. [DOI] [PubMed] [Google Scholar]
- 33. Jacomy M., Venturini T., Heymann S., Bastian M.. Forceatlas2, a continuous graph layout algorithm for handy network visualization designed for the gephi software. PLoS One. 2014; 9:e98679. [DOI] [PMC free article] [PubMed] [Google Scholar]
- 34. Noack A. Modularity clustering is force-directed layout. Phys. Rev. E. 2009; 79:026102. [DOI] [PubMed] [Google Scholar]
- 35. Leontis N.B., Stombaugh J., Westhof E.. The non-Watson-Crick base pairs and their associated isostericity matrices. Nucleic Acids Res. 2002; 30:3497–3531. [DOI] [PMC free article] [PubMed] [Google Scholar]
- 36. Zhou J., Lancaster L., Donohue J.P., Noller H.F.. How the ribosome hands the A-site tRNA to the P site during EF-G–catalyzed translocation. Science. 2014; 345:1188–1191. [DOI] [PMC free article] [PubMed] [Google Scholar]
- 37. Lee J.C., Gutell R.R., Russell R.. The UAA/GAN internal loop motif: a new rna structural element that forms a cross-strand AAA stack and long-range tertiary interactions. J. Mol. Biol. 2006; 360:978–988. [DOI] [PubMed] [Google Scholar]
- 38. Jaeger L., Verzemnieks E.J., Geary C.. The UA_handle: a versatile submotif in stable RNA architectures. Nucleic Acids Res. 2008; 37:215–230. [DOI] [PMC free article] [PubMed] [Google Scholar]
Associated Data
This section collects any data citations, data availability statements, or supplementary materials included in this article.
Supplementary Materials
Data Availability Statement
The collection of all RINs is presented in a database called CaRNAval, freely accessible at http://carnaval.lri.fr. The code is freely available at: http://jwgitlab.cs.mcgill.ca/vreinharz/carnaval_code.


