

Abstract
Peroxisomes account for ~35% of total H2O2 generation in mammalian tissues. Peroxisomal ACOX1 (acyl‐CoA oxidase 1) is the first and rate‐limiting enzyme in fatty acid β‐oxidation and a major producer of H2O2. ACOX1 dysfunction is linked to peroxisomal disorders and hepatocarcinogenesis. Here, we show that the deacetylase sirtuin 5 (SIRT5) is present in peroxisomes and that ACOX1 is a physiological substrate of SIRT5. Mechanistically, SIRT5‐mediated desuccinylation inhibits ACOX1 activity by suppressing its active dimer formation in both cultured cells and mouse livers. Deletion of SIRT5 increases H2O2 production and oxidative DNA damage, which can be alleviated by ACOX1 knockdown. We show that SIRT5 downregulation is associated with increased succinylation and activity of ACOX1 and oxidative DNA damage response in hepatocellular carcinoma (HCC). Our study reveals a novel role of SIRT5 in inhibiting peroxisome‐induced oxidative stress, in liver protection, and in suppressing HCC development.
Keywords: ACOX1, liver cancer, oxidative stress, SIRT5, succinylation
Subject Categories: Cancer; Physiology; Post-translational Modifications, Proteolysis & Proteomics
Introduction
Peroxisomes are ubiquitous and highly dynamic organelles, which are involved in the catabolism of very‐long‐chain fatty acids (VLCFAs), branched‐chain fatty acids, D‐amino acids, polyamines, and the biosynthesis of ether lipids and bile acids 1, 2. Dysfunctions in peroxisomal metabolism are linked to inherited peroxisomal disorders, age‐related diseases, and human cancers 3, 4. Clinically, peroxisomal disorders refer to either peroxisome biogenesis disorders or single peroxisomal enzyme deficiencies 5. The former group is mainly associated with mutations in the genes encoding for peroxisomal biogenesis factors (also known as peroxins or PEX), which are involved in the import of peroxisomal proteins from the cytoplasm 6. The latter group is caused by defects in peroxisomal matrix enzymes or membrane proteins which can affect specific peroxisome‐dependent metabolic pathways 7, 8.
In peroxisomes, ACOX1 (acyl‐CoA oxidase 1, EC 1.3.3.6) is the first and a rate‐limiting enzyme which catalyzes the desaturation of very‐long‐chain acyl‐CoAs to 2‐trans‐enoyl‐CoAs, and transfers electrons in the form of H− from their prosthetic group FADH2 to molecular oxygen to generate hydrogen peroxide (H2O2) 9. This step is distinguished from the desaturation of long‐, middle‐ and short‐chain acyl‐CoAs to trans 2,3‐dehydroacyl‐CoA catalyzed by acyl‐CoA dehydrogenases (ACADs) in mitochondria, which transfers electrons to flavin adenine dinucleotide (FAD) and generates FADH2 used for ATP production in the respiratory chain 10. H2O2 is relatively stable and less reactive as compared to other reactive oxygen species (ROS), such as superoxide anion (), hydroxyl radicals (OH·), and peroxyradicals (ROO·). Lack of electric charge enables H2O2 to cross membranes. Several previous studies have reported that H2O2 generated by peroxisomes can rapidly (within seconds) diffuse across lipid bilayer membranes and enter into nuclei 11, 12, 13. H2O2 is known to be implicated in redox regulation of multiple signal transduction pathways when produced at low levels 14, 15, 16. Once entering into nuclei, H2O2 can induce stalled replication forks and DNA double‐strand breaks and cause oxidative DNA damage, and is thus involved in the processes of mutagenesis, aging, and carcinogenesis 17, 18, 19, 20.
Previous studies have shown that the ACOX1 gene is under the control of peroxisome proliferator‐activated receptor alpha (PPARα) 21. Abnormal upregulation of ACOX1 by PPAR activation was reported to stimulate hepatic fatty acid oxidation, accompanied by H2O2 accumulation, resulting in excess energy burning in the liver and contributing to the development of liver cancer in rodents 22, 23. Acox1‐null mice exhibit growth retardation, infertility, excess VLCFAs in the blood, and develop progressive liver diseases with increased intrahepatic H2O2 levels derived from mitochondrial and microsomal fatty acid oxidation and other sources 22, 24, 25, 26. Together, these findings suggest that peroxisomal ACOX1 is crucial for fatty acid oxidation and H2O2 homeostasis in liver tissue and that ACOX1 dysfunction contributes to the development of chronic liver disease and hepatocarcinogenesis.
Thus far, how ACOX1 is regulated to meet the need for VLCFA catabolism and to control cellular H2O2 levels and redox homeostasis is poorly understood. Much of efforts on understanding the regulation of ACOX1 have been focused at its transcriptional control, while the post‐translational modifications of ACOX1 are greatly unknown. Large‐scale proteomic studies of cellular proteins have revealed that acetylation, succinylation, malonylation, and glutarylation can regulate multiple metabolic processes 27. Among these acylations, lysine succinylation, malonylation, and glutarylation are commonly regulated by the deacylase sirtuin 5 (SIRT5) 28, 29, 30. All these post‐translational modifications occur on the ε group of a Lys residue, suggesting the possibility that different modification may compete or block each other, allowing signals from different physiological conditions or pathways to be integrated on or sensed by a common protein. Notably, multiple succinylation sites in ACOX1 have been identified in SIRT5 knockout (KO) versus wild‐type HeLa cells and mouse livers 30, 31, implying that ACOX1 may be a potential substrate of SIRT5. In this study, we discover that ACOX1 is a physiological substrate of SIRT5 as SIRT5‐dependent desuccinylation inhibits ACOX1 activity by suppressing its active dimer formation. We show that SIRT5 loss is associated with increased succinylation and activity of ACOX1 in cultured cells, mouse liver tissues, and human HCC cancer samples.
Results
SIRT5 can localize in peroxisomes where it regulates H2O2 metabolism and cellular redox status
As mentioned above, significant amount of H2O2 is produced during the ACOX1‐catalyzed reaction, raising the question how cells balance the need for VLCFA catabolism and control of cellular H2O2 levels and redox homeostasis. Several recent proteomic studies in mouse liver and skeletal muscle have identified a large number of succinylated proteins as potential substrates of SIRT5 30, 31, 32, including ACOX1 and other peroxisomal proteins (Appendix Table S1). This promoted us to investigate whether SIRT5 can regulate ACOX1 succinylation and activity and control cellular H2O2 levels.
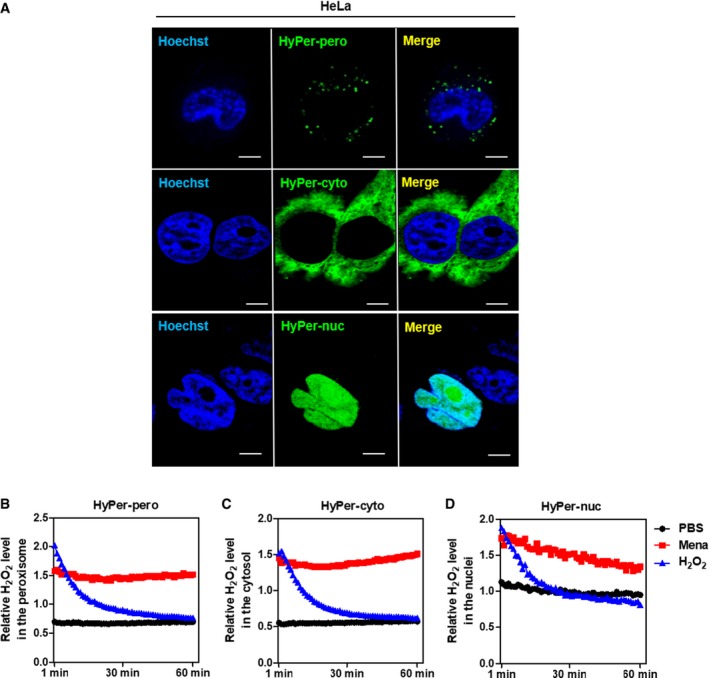
First, we applied a genetically encoded H2O2 sensor, HyPer, which can be stably expressed in the cell and allow real‐time visualization of H2O2 in different cellular compartments 11. As shown in Fig EV1A, ectopically expressed HyPer‐pero, HyPer‐cyto, and HyPer‐nuc were found to be located in the peroxisome, cytosol, and nuclei of transfected HeLa cells, respectively. By using this sensor, we observed that H2O2 levels in the peroxisome, cytosol, and nuclei peaked immediately after H2O2 exposure, followed by a rapid full recovery (Fig EV1B–D). The H2O2 signal was increased steadily in these subcellular compartments after exposure to another potent ROS inducer, menadione (Fig EV1B–D). By using two different shRNAs, SIRT5 was depleted in Huh7 and HepG2 cells (Appendix Figs S1 and S2A). Interestingly, we found that endogenous levels of H2O2 were significantly increased (P < 0.01) in the peroxisome, cytosol, and nuclei of SIRT5 knockdown Huh7 and HepG2 cells (Fig 1A and B). Given that H2O2 serves as an important member of cellular ROS, we examined and found that ROS level was elevated by as much as 2‐fold (P < 0.001) in SIRT5 knockdown HepG2 cells (Appendix Fig S2B). In SIRT5 knockdown HepG2 cells, classical DNA damage response markers were increased, such as histone H2A histone family, member X (H2AX) phosphorylation (γH2AX), p53 serine‐15 phosphorylation, and serine/threonine kinase (ATM) serine‐1981 phosphorylation (Appendix Fig S2A). These findings are in agreement with our previous study 33, re‐affirming that SIRT5 plays a key role in controlling cellular redox status.
Figure EV1. Application and identification of a genetically encoded sensor to detect H2O2 in the peroxisome, cytosol, and nucleus.
-
AHyPer‐pero, HyPer‐cyto, and HyPer‐nuc were ectopically expressed in HeLa cells, and their subcellular localization was determined by immunofluorescence staining. Representative immunofluorescence images (original magnification, 630×; a single focal plane, scale bar, 5 μm) are shown.
-
B–DHEK293 cells overexpressing the Hyper biosensor were treated with PBS, 500 μM H2O2, or 50 μM menadione for the indicated periods. The H2O2 level in the peroxisome (B), cytosol (C), and nucleus (D) was monitored as described in Materials and Methods.
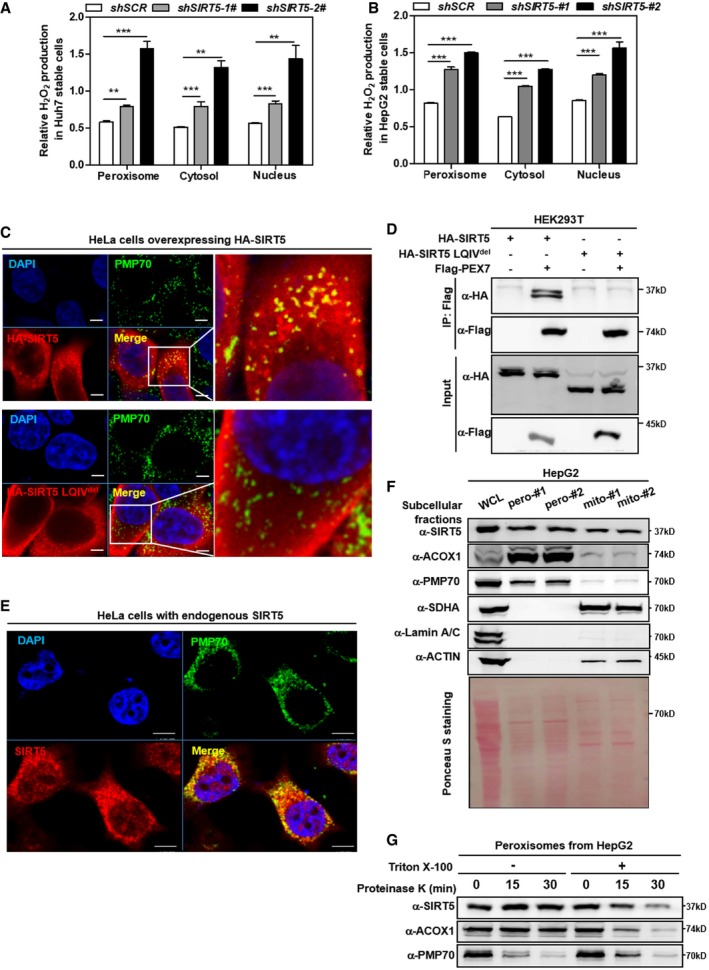
Figure 1. SIRT5 can localize in peroxisomes where it regulates H2O2 metabolism.
-
A, BKnockdown of SIRT5 stimulates H2O2 production in the peroxisome, cytosol, and nucleus. In Huh7 and HepG2 stable cells with SIRT5 knockdown, endogenous H2O2 production in the indicated cellular compartments was determined by using the Hyper biosensor as described in Materials and Methods. Note: Given that the level of endogenous H2O2 does not change over time (within 30 min, data not shown), we have collected the excitation ratio (490/420 nm) at single time point (at 5 min). Shown are average values with standard deviation (SD) of triplicated experiments. **P < 0.01, and ***P < 0.001 for the indicated comparisons by two‐tailed unpaired Student's t‐test.
-
CWild‐type SIRT5, but not SIRT5 LQIVdel mutant, co‐localizes with peroxisomal membrane protein PMP70. Immunofluorescence staining was performed in HeLa cells overexpressing HA‐tagged wild‐type or mutant SIRT5 using the indicated antibodies as described in Materials and Methods. Representative immunofluorescence images (original magnification, 630×; a single focal plane, scale bar, 5 μm) are shown.
-
DPEX7 interacts with SIRT5, but not SIRT5 LQIVdel mutant. Flag‐PEX7 was co‐expressed with HA‐tagged wild‐type or mutant SIRT5 in HEK293T cells. Proteins were purified by immunoprecipitation (IP) with Flag beads, followed by Western blot to detect SIRT5 or SIRT5 LQIVdel mutant with an HA antibody.
-
EEndogenous SIRT5 co‐localizes with peroxisomal membrane protein PMP70 in cells. Immunofluorescence staining was performed in HeLa cells using the indicated antibodies as described in Materials and Methods. Representative immunofluorescence images (original magnification, 630×; a single focal plane, scale bar, 5 μm) are shown.
-
FSIRT5 distributes in the peroxisomal fraction. Cellular fractionation was conducted in HepG2 cells to isolate peroxisomes and mitochondria as described in Materials and Methods. The indicated proteins were determined by Western blot analysis. #1 and #2 refer to two repeats from single fractionation.
-
GSIRT5 is a matrix protein rather than a membrane protein in peroxisomes. Isolated peroxisomes from HepG2 cells were subjected to proteinase K (100 μg/ml) digestion with or without 1% Triton X‐100 pre‐treatment as indicated. Harvest the samples at indicated time points to perform Western blot assay. The indicated proteins were determined by Western blot analysis.
Source data are available online for this figure.
The observed effect of SIRT5 knockdown on increasing H2O2 in the peroxisome is of particular interest, since SIRT5 localizes in the mitochondria, cytosol, and nuclei 31, but has not been reported to localize in the peroxisome. Peroxisomes contain no DNA, and all their constituent matrix proteins are imported from the cytoplasm 6, 34, 35, 36. The peroxisomal import machinery consists of PEX proteins, which are integrated into peroxisome membranes via type 1 or type 2 peroxisomal targeting signal (PTS1, PTS2), and are essential for the assembly of functional peroxisomes 37, 38. Amino acid sequence alignment and analysis demonstrated that SIRT5 has a putative PTS2 sequence LQIVXXXL (Fig EV2A), implying that SIRT5 may localize in the peroxisome. To confirm this prediction, we co‐expressed Flag‐SIRT5 with HA‐PEX7 which is a peroxisomal biogenesis factor acting as a cytosolic receptor for PTS2 containing peroxisomal proteins, or with HA‐PEX5 which recognizes PTS1 containing peroxisomal proteins, and examined their interaction. We found that ectopically expressed Flag‐PEX7, but not Flag‐PEX5, was readily detected in the SIRT5 immune complex (Fig EV2B). In addition, we also generated a mutation in SIRT5 which disrupts its predicted PTS2 sequence, named SIRT5 LQIVdel (LQIV amino acid deletion). Immunofluorescence staining demonstrated that unlike wild‐type SIRT5, HA‐tagged SIRT5 LQIVdel mutant could not co‐localize with the 70‐kDa peroxisomal membrane protein (PMP70) in HeLa cells (Fig 1C). Furthermore, HA‐tagged SIRT5 LQIVdel mutant could no longer interact with Flag‐PEX7 (Fig 1D). Using a specific antibody against SIRT5 (Appendix Fig S3), we found that a significant fraction of endogenous SIRT5 was co‐localized with PMP70 in HeLa cells (Fig 1E). To provide direct evidence to support the peroxisomal location of SIRT5, we performed cellular fractionation in HepG2 cells and found that as expected, ACOX1 and PMP70 were detected predominantly in the peroxisomal fraction. Succinate dehydrogenase A (SDHA) was detected primarily in the mitochondrial fraction, and could not be detected in the peroxisomal fraction. Additionally, β‐actin and Lamin A/C supported no contamination of the cytoplasmic and nuclear fractions, respectively, in the peroxisomal fraction (Fig 1F). Importantly, endogenous SIRT5 was detected in both the peroxisomal and mitochondrial fractions (Fig 1F), supporting the localization of SIRT5 in both subcellular compartments. Furthermore, we permeabilized the membrane of purified peroxisomes with Triton X‐100 39, followed by proteinase K treatment and Western blotting analyses. This experiment showed that proteinase K could rapidly (within 15 min) degrade the peroxisome membrane protein PMP70, but not the peroxisome matrix protein ACOX1 unless peroxisome was permeabilized by Triton (Fig 1G). Like ACOX1, SIRT5 was not degraded by proteinase K treatment alone, but was degraded by proteinase K after pre‐treatment with Triton. These results clearly suggest that SIRT5 is a matrix protein rather than a membrane protein in peroxisomes.
Figure EV2. SIRT5 harbors a predicted PTS2 sequence and interacts with PEX7 but not PEX5.
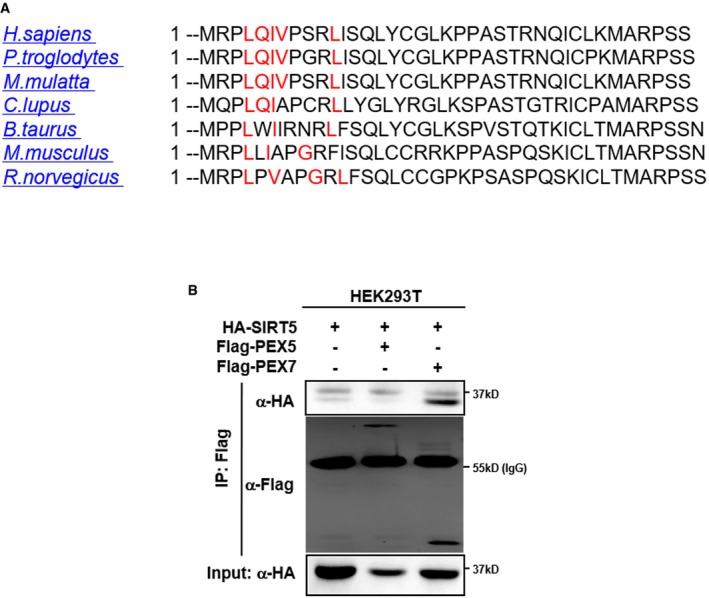
- The amino acid sequence of SIRT5 protein from the indicated species was imported into “PTSs predictor” of PEROXISOME database (PeroxisomeDB). As shown, SIRT5 contains a predicted PTS2 sequence (marked in red).
- SIRT5 interacts with PEX7, but not PEX5. HA‐SIRT5 was co‐expressed with Flag‐PEX5 or Flag‐PEX7 in HEK293T cells. Proteins were purified by immunoprecipitation (IP) with Flag beads, followed by Western blot to detect PEX5 or PEX7 with an HA antibody.
Source data are available online for this figure.
SIRT5 catalyzes lysine desuccinylation of ACOX1
Peroxisomes account for up to 35% of total H2O2 generation in mammalian tissues 40. To counterbalance the damaging effect of this ROS source, peroxisomes in many cell types contain abundant amounts of the antioxidant enzyme catalase, which reduces H2O2 to water. We found that the catalase activity was not affected by SIRT5 knockdown in HepG2 liver cells (Appendix Fig S4), indicating that the observed increase in H2O2 in the peroxisome of SIRT5 knockdown cells is most likely caused by increased production rather than impaired clearance of H2O2. In peroxisomes, ACOX1 is the first rate‐limiting enzyme which catalyzes the desaturation of very‐long‐chain acyl‐CoAs to 2‐trans‐enoyl‐CoAs, producing H2O2 as a byproduct. Co‐immunoprecipitation experiment demonstrated that HA‐tagged ACOX1 could interact with Flag‐tagged PEX5 but not PEX7 (Fig EV3A). In addition, we also generated a mutation in ACOX1 which disrupts the PTS1 peroxisome targeting signal comprising of a C‐terminal tripeptide serine–lysine–leucine (SKL), named ACOX1 SKLdel. When co‐overexpressed in cells, ACOX1 SKLdel mutant could still interact with SIRT5 (Fig EV3B), but failed to co‐localize with PMP70 in HeLa cells (Fig EV3C). ACOX1 was found to co‐localize with PMP70, but it did not co‐localize with the mitochondrial marker protein SDHA (Fig EV3D), supporting the notion that ACOX1 is present predominantly in peroxisomes.
Figure EV3. ACOX1 is localized in the peroxisome.
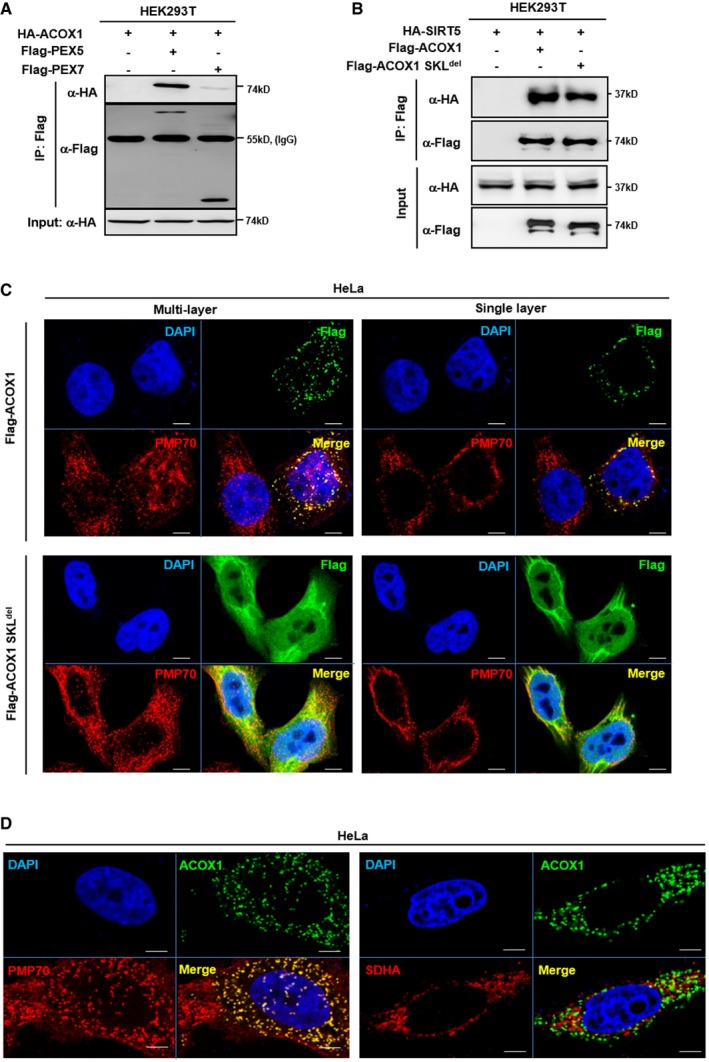
- ACOX1 interacts with PEX5. HA‐ACOX1 was co‐overexpressed with Flag‐PEX5 or Flag‐PEX7 in HEK293T cells. PEX proteins were purified by IP with Flag beads, followed by Western blot to detect ACOX1 with an HA antibody.
- Both ACOX1 and ACOX1 SKLdel interact with SIRT5. HA‐SIRT5 was co‐overexpressed with Flag‐ACOX1 or Flag‐ACOX1 SKLdel in HEK293T cells, followed by IP with Flag beads and Western blot to detect SIRT5 with an HA antibody.
- ACOX1 but not ACOX1 SKLdel mutant is localized in peroxisomes. Flag‐tagged wild‐type or mutant ACOX1 was transiently overexpressed in HeLa cells. Immunofluorescence assay was performed to detect the indicated proteins as described in Materials and Methods. Representative immunofluorescence images (original magnification, 630×; a single focal plane, scale bar, 5 μm) are shown.
- ACOX1 co‐localizes with the peroxisomal marker PMP70, but not the mitochondrial marker SDHA. Flag‐ACOX1 was transiently overexpressed in HeLa cells. Immunofluorescence assay was performed to detect the indicated proteins as described in Materials and Methods. Representative immunofluorescence images (original magnification, 630×; a single focal plane, scale bar, 5 μm) are shown.
Source data are available online for this figure.
Next, we set out to investigate whether ACOX1 is a physiological substrate of SIRT5. When co‐expressed with HA‐tagged SIRT proteins in HEK293T cells, Flag‐ACOX1 was found to interact with HA‐tagged SIRT4 and SIRT5, but not any of the other SIRT proteins (Fig 2A). The ACOX1 protein is present as the unprocessed A‐chain (72 kDa), processed B‐chain (51 kDa), and C‐chain (21 kDa) in cells 41. In this study, only the A‐chain of endogenous ACOX1 could be immunoprecipitated by the commercial ACOX1 antibody (data not shown), so we mainly focused on the modification of the A‐chain of ACOX1 in the continuation. The interaction between endogenous ACOX1 and SIRT5 proteins was readily detected in both Huh7 and HepG2 liver cells (Fig 2B). Additionally, we observed that part of HA‐SIRT5 co‐localized with endogenous peroxisomal ACOX1 in HeLa cells (Appendix Fig S5), supporting that SIRT5 and ACOX1 are co‐localized in peroxisomes and interact with each other.
Figure 2. SIRT5 interacts with and desuccinylates ACOX1.
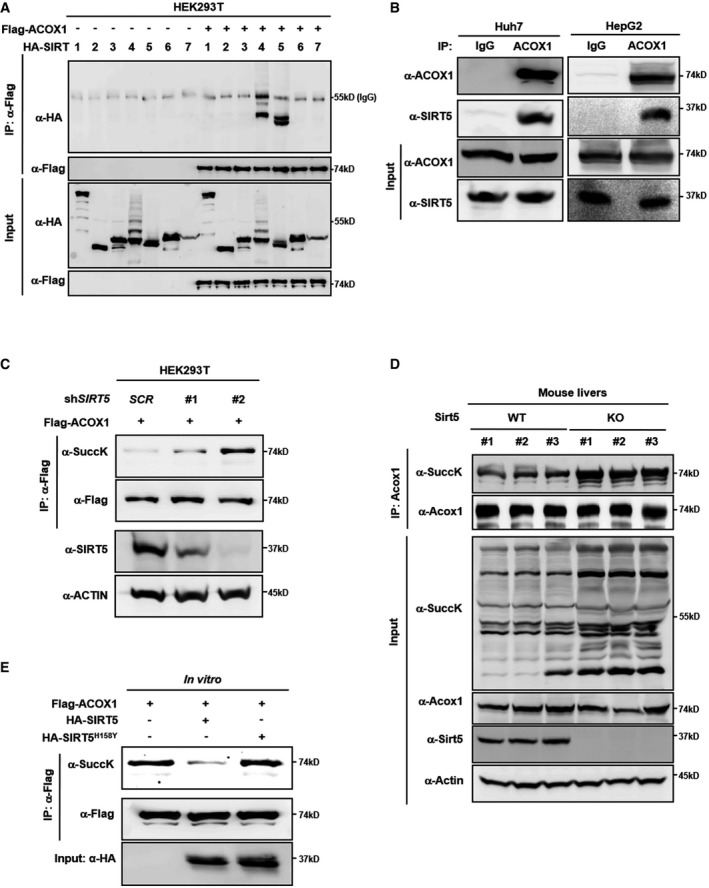
- Ectopically expressed ACOX1 interacts with SIRT5. Flag‐ACOX1 was overexpressed in HEK293T cells together with the individual HA‐tagged SIRT proteins as indicated. Proteins were purified by IP with Flag beads, following Western blot to detect SIRT proteins with an HA antibody.
- Endogenous ACOX1 interacts with SIRT5. SIRT5 protein in Huh7 and HepG2 liver cells was purified by IP with an anti‐ACOX1 antibody, followed by Western blot to detect SIRT5 with an anti‐SIRT5 antibody.
- Knockdown of SIRT5 increases ACOX1 succinylation. In stable HEK293T cells with SIRT5 knockdown, Flag‐ACOX1 was overexpressed. ACOX1 protein was purified by IP with Flag beads and Western blot to detect its succinylation level.
- Knockout of Sirt5 increases Acox1 succinylation in mouse livers. Acox1 protein in the liver of Sirt5 KO and wild‐type littermates (n = 3 per group) was purified by IP with an anti‐ACOX1 antibody. ACOX1 succinylation was determined by anti‐succinyl‐lysine antibody.
- SIRT5 dessucinylates ACOX1 in vitro. Flag‐ACOX1, HA‐tagged wild‐type SIRT5 and a catalytic inactive mutant SIRT5H158Y were separately overexpressed in HEK293T cells. Proteins were purified by IP with Flag or HA beads, and then eluted with Flag or HA peptide. After incubation with wild‐type or mutant SIRT5 in vitro, the succinylation level of ACOX1 was determined by Western blot analysis.
Source data are available online for this figure.
SIRT5 is a global regulator of lysine succinylation, malonylation, and glutarylation 27, 28, 29. Knockdown of SIRT5 by using two different shRNAs increased the succinylation level of Flag‐ACOX1 in HEK293T cells, and the levels of ACOX1 succinylation were associated with the efficiency of SIRT5 depletion (Fig 2C and Appendix Fig S6). In contrast, SIRT5 knockdown did not obviously affect lysine malonylation, glutarylation, and acetylation of Flag‐ACOX1 in HEK293T cells, implying that the major effect of SIRT5 depletion on ACOX1 post‐translational modification is lysine succinylation (Appendix Fig S6). Importantly, the succinylation level of endogenous Acox1 was increased in the liver of Sirt5 knockout (KO) mice compared to wild‐type (WT) littermates (Fig 2D). On the other hand, we found that the catalytic inactive mutant SIRT5H158Y mutant could still interact with ACOX1 (Appendix Fig S7) and that in vitro incubation with wild‐type SIRT5, but not SIRT5H158Y mutant, could decrease the succinylation level of Flag‐ACOX1 (Fig 2E). Hence, these results suggest that peroxisomal ACOX1 is a substrate of SIRT5 desuccinylase.
ACOX1 enzyme activity is stimulated by lysine succinylation
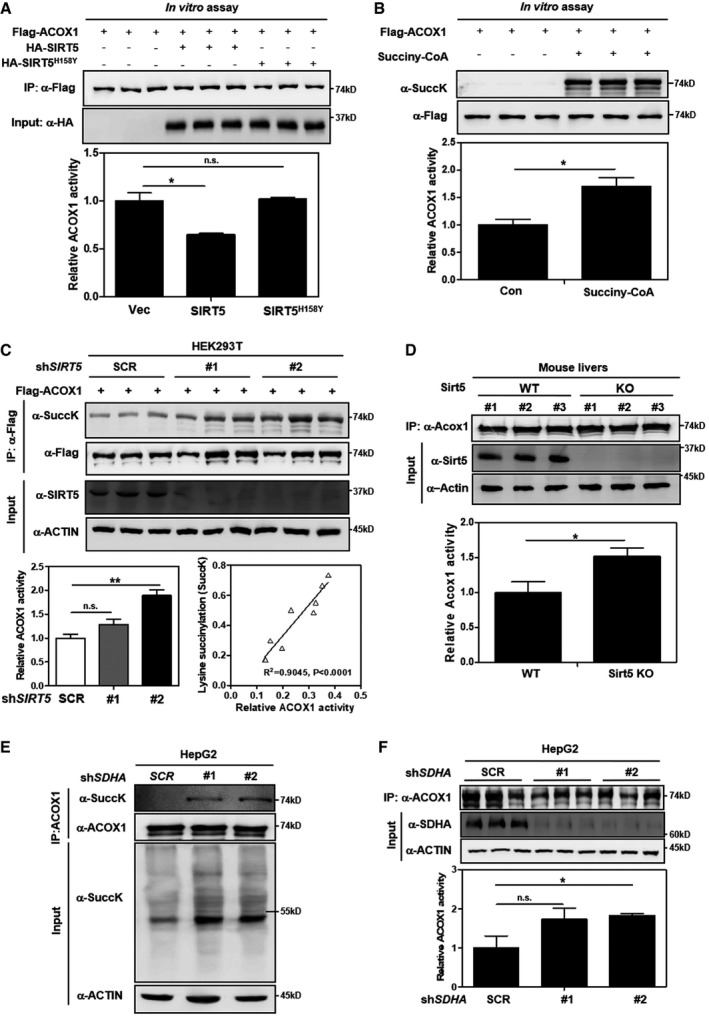
To determine the functional consequence of SIRT5‐catalyzed lysine succinylation on ACOX1, we expressed and immunopurified Flag‐ACOX1 with HA‐tagged wild‐type or catalytic mutant SIRT5. The purified Flag‐ACOX1 was incubated with HA‐SIRT5, followed by the ACOX1 enzymatic activity assays. The methodology for ACOX1 activity assay was verified in ACOX1 knockdown HepG2 cells (Appendix Fig S8). We found that in vitro incubation with wild‐type, but not catalytic inactive SIRT5H158Y mutant, reduced ACOX1 enzyme activity by 35% (P < 0.05) (Fig 3A). Moreover, in vitro incubation with succinyl‐CoA (0.1 mM) led to a profound increase in the succinylation level of Flag‐ACOX1, which was associated with enzyme activation of ACOX1 by 1.7‐fold (P < 0.05) (Fig 3B). In accord, the activity of Flag‐ACOX1 was stimulated by 1.9‐fold (P < 0.05) in stable HEK293T cells with SIRT5 knockdown, and the increase in ACOX1 activity was correlated with the knockdown efficiency of SIRT5, as well as the increased ACOX1 succinylation level (Fig 3C). In addition, we observed that the activity of endogenous Acox1 was significantly increased by 1.5‐fold (P < 0.05) in the liver of Sirt5 KO mice compared to WT controls (Fig 3D). These results show that SIRT5 negatively regulates ACOX1 activity by lysine desuccinylation.
Figure 3. Lysine succinylation increases ACOX1 activity.
-
ASIRT5 inactivates ACOX1 in vitro. Flag‐ACOX1, HA‐tagged wild‐type SIRT5, and a catalytic inactive mutant SIRT5H158Y were separately overexpressed in HEK293T cells. Proteins were purified by IP with Flag or HA beads, and then eluted with Flag or HA peptide. After incubation with wild‐type or mutant SIRT5 in vitro, the enzyme activity of ACOX1 was determined as described in Materials and Methods.
-
BACOX1 activity is increased by lysine succinylation. Purified Flag‐ACOX1 was incubated with or without succinyl‐CoA (0.1 mM) at 37°C for 30 min, followed by measurement of the enzyme activity of ACOX1 as described in Materials and Methods.
-
CKnockdown of SIRT5 increases ACOX1 activity. In stable HEK293T cells with SIRT5 knockdown, Flag‐ACOX1 was ectopically expressed. ACOX1 protein was purified by IP with Flag beads and then eluted with Flag peptide, followed by measurement of its succinylation level and enzyme activity as described in Materials and Methods. The correlation between ACOX1 succinylation level and its enzyme activity is shown.
-
DKnockout of Sirt5 increases Acox1 activity in mouse livers. Acox1 protein in the liver of Sirt5 KO and wild‐type littermates (n = 3 per group) was purified by IP with an anti‐ACOX1 antibody. Acox1 enzyme activity was measured as described in Materials and Methods.
-
E, FSDHA knockdown leads to increased succinylation and activity of ACOX1. In HepG2 cells with stable SDHA knockdown, ACOX1 protein was purified by IP with an anti‐ACOX1 antibody, followed by measurement of its succinylation level (E) and enzyme activity (F) as described in Materials and Methods.
Previously, it has been reported that protein succinylation can be a nonenzymatic reaction and that inactivation of succinate dehydrogenase (SDH) results in hypersuccinylation in U87GM and HEK293 cells 42. We next evaluated whether SDH inactivation could affect ACOX1 succinylation and enzyme activity. Our data demonstrated that knockdown of SDHA by shRNAs in HepG2 cells led to a reduction of fumarate and an increase in succinate, as determined by GC‐MS assay (Appendix Fig S9A and B). The elevated level of succinate by SDHA knockdown resulted in a remarkable increase in global lysine succinylation also in the input (Fig 3E). As a result, the succinylation of endogenous ACOX1 was increased in HepG2 cells with stable SDHA knockdown, and this was concomitantly associated with enzymatic activation of ACOX1 as much as by 1.8‐fold (Fig 3E and F).
Furthermore, each of putative succinylated lysine residues in ACOX1 31, 32 was mutated to arginine (R), which retains a positive charge and is often used as a desuccinylated mimetic, and the enzyme activity of these ACOX1 mutants was individually assayed. We found that K‐to‐R mutation at multiple lysine residues decreased the enzyme activity of ACOX1, including K89R, K437R, K488R, K500R, K537R, and K637R (Appendix Fig S10). These results indicate that ACOX1 activity may be controlled by combination of multiple lysine residues.
Succinylation stimulates the formation of active ACOX1 dimer
The crystal structure of ACOX1 reveals that this enzyme acts as a homodimer bound to a fatty acid and FAD cofactor 43, 44, 45, 46. We observed that overexpression of wild‐type, but not the catalytic inactive mutant SIRT5H158Y mutant, could impair the protein interaction between Flag‐ACOX1 and HA‐ACOX1 (Fig 4A), suggesting that SIRT5‐dependent desuccinylation may negatively regulate ACOX1 activity through influencing its active dimer formation. Indeed, glutaraldehyde cross‐linking assay confirmed that Flag‐ACOX1 formed a dimer (Fig 4B). Importantly, this dimer formation was severely impaired when co‐expressed with HA‐SIRT5, while co‐expression of the catalytic inactive mutant SIRT5 had no effect on ACOX1 dimer formation (Fig 4B). Moreover, knockdown of SIRT5 was found to enhance the protein interaction between Flag‐ACOX1 and HA‐ACOX1 (Fig 4C), suggesting an enhancing effect to the ACOX dimerization by lysine succinylation. Glutaraldehyde cross‐linking assay showed that SIRT5 knockdown increased Flag‐ACOX1 dimer formation (Fig 4D). The degree of dimeric ACOX1 formation appears to correlate with the relative SIRT5 knockdown efficiency, as shRNA‐2 was more potent in both SIRT5 depletion and ACOX1 dimer formation than the shRNA‐1. In agreement with our observations in cultured cells, the dimer formation of endogenous Acox1 protein was higher in primary hepatocytes from Sirt5 KO mice compared to WT littermates (Fig 4E). Taken together, our results indicate that succinylation promotes ACOX1 dimerization and that SIRT5 negatively regulates ACOX1 activity by inhibiting the formation of active ACOX1 homodimer.
Figure 4. SIRT5‐regulated succinylation activates ACOX1 through promoting its dimer formation.
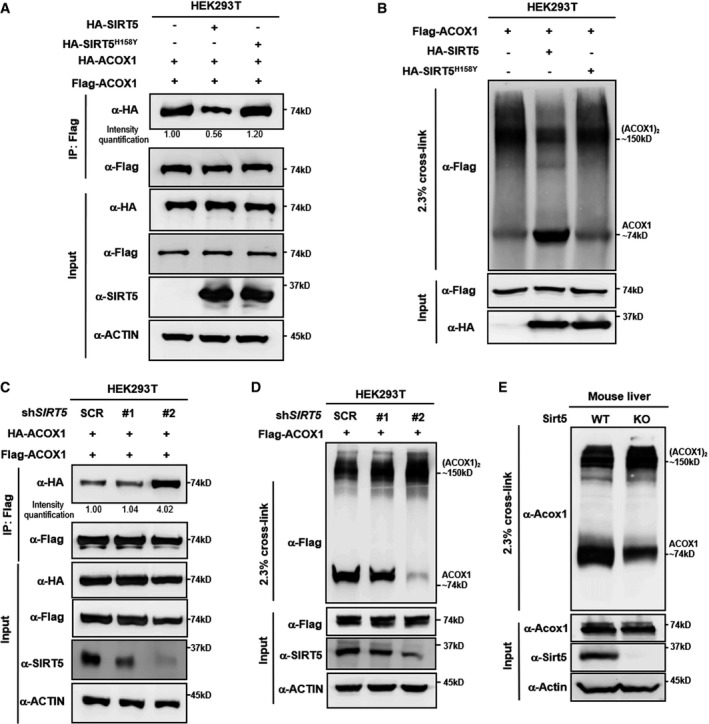
- SIRT5 impairs subunit interaction of ACOX1 protein. HA‐tagged wild‐type SIRT5 and a catalytic inactive mutant SIRT5H158Y were each expressed in HEK293T cells co‐expressing HA‐ACOX1 and Flag‐ACOX1. Flag‐ACOX1 was purified by IP with Flag beads, and then, Western blot was performed to detect the interaction with HA‐ACOX1 by an HA antibody.
- SIRT5 inhibits the formation of dimeric ACOX1. HA‐tagged wild‐type SIRT5 and a catalytic inactive mutant SIRT5H158Y were each expressed in HEK293T cells co‐expressing Flag‐ACOX1, followed by treatments with or without 2.3% (v/v) glutaraldehyde. The formation of ACOX1 monomer and dimer was determined by Western blotting.
- SIRT5 knockdown enhances the interaction of ACOX1 protein subunits. HA‐ACOX1 and Flag‐ACOX1 were transiently co‐expressed in HEK293T cells with stable SIRT5 knockdown. Flag‐ACOX1 was purified by IP with Flag beads, followed by Western blot to detect its interaction with HA‐ACOX1 with an HA antibody.
- SIRT5 knockdown promotes the formation of dimeric ACOX1. Flag‐ACOX1 was expressed in HEK293T cells with stable SIRT5 knockdown. The transfected cell lysates were treated with 2.3% (v/v) glutaraldehyde. The formation of ACOX1 monomer and dimer was determined by Western blotting.
- Knockout of Sirt5 promotes the formation of dimeric Acox1 in mouse livers. Acox1 protein in the liver of Sirt5 KO and wild‐type littermate was purified by IP with an anti‐ACOX1 antibody, followed by treatment with 2.3% (v/v) glutaraldehyde. The formation of Acox1 monomer and dimer was determined by Western blotting.
Source data are available online for this figure.
ACOX1 is required for SIRT5 to regulate H2O2 production, ROS, and DNA damage response
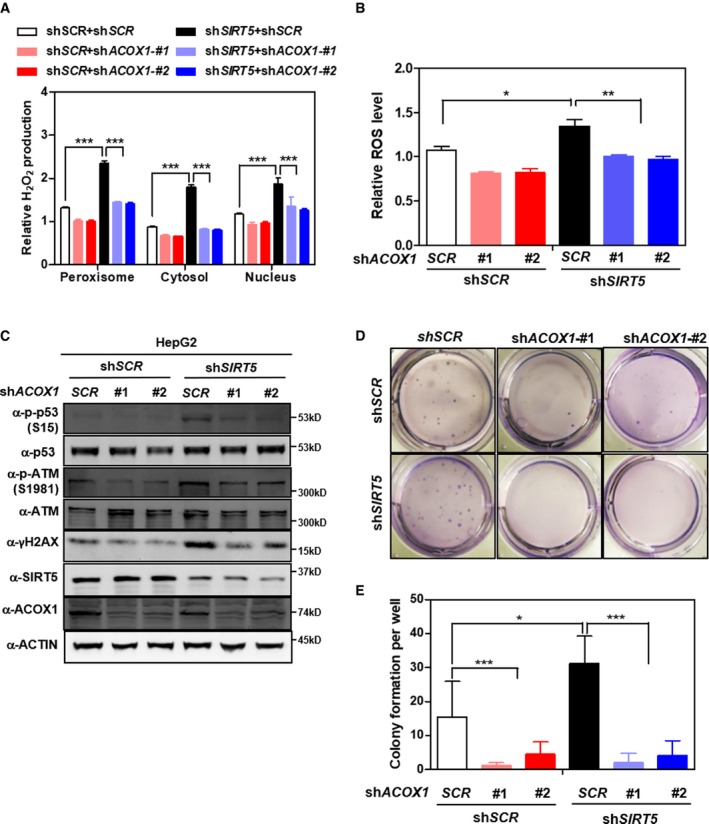
We hypothesize that SIRT5 controls peroxisomal H2O2 production by regulating ACOX1 activity. To test this model, we generated HepG2 cells with single or double knockdown of SIRT5/ACOX1 by shRNAs. As expected, the levels of H2O2 and ROS were significantly increased in SIRT5 knockdown cells (Fig 5A and B). It is known that ROS participate in the regulation of various oncogenic signaling pathways, such as the Ras‐Raf‐MEK‐ERK and PI3K‐Akt‐mTOR pathways 47, 48. The phosphorylation of ERK or AKT was, however, not changed in SIRT5 knockdown HepG2 cells (Appendix Fig S11). Nevertheless, these cells exhibited increased DNA damage response markers (as indicated by Ser15‐phosphor‐p53, S1981‐phosphor‐ATM, and γH2AX) (Fig 5C). Strikingly, we found that depletion of ACOX1 effectively diminished SIRT5 knockdown‐induced H2O2 production in peroxisomes (Fig 5A), suggesting that ACOX1 is either the primary producer of H2O2 or the major substrate of SIRT5 in the peroxisome of HepG2 cells. Moreover, we observed that SIRT5 knockdown‐induced elevations of ROS and DNA damage response markers were similarly reversed upon co‐depletion of ACOX1 (Fig 5B and C). It has previously been shown that H2O2‐induced oxidative damage to cellular DNA plays a potential oncogenic role during cellular transformation 18, 49, 50. We found that SIRT5 knockdown, which leads to high H2O2 accumulation, increased anchorage‐independent growth of HepG2 cells, and this effect of SIRT5 loss was blunted by depletion of ACOX1 (Fig 5D and E, Appendix Fig S12).
Figure 5. SIRT5‐regulated lysine succinylation stimulates ACOX1 to promote anchorage‐independent growth in HepG2 liver cells.
-
AACOX1 knockdown diminishes the effect of SIRT5 knockdown on increasing H2O2 production. In HepG2 stable cells with single or double knockdown of SIRT5/ACOX1, H2O2 production in the indicated cellular compartments was determined by using the Hyper biosensor as described in Materials and Methods.
-
BACOX1 knockdown impairs the effect of SIRT5 knockdown on increasing ROS. In HepG2 stable cells with single or double knockdown of SIRT5/ACOX1, ROS level was determined in cell extracts as described in Materials and Methods.
-
CACOX1 knockdown impairs the effect of SIRT5 knockdown on inducing oxidative DNA damage response. In HepG2 stable cells with single or double knockdown of SIRT5/ACOX1, the indicated classical oxidative DNA damage response markers were determined by Western blot analysis, completed in biological triplicate.
-
D, EACOX1 knockdown impairs the effect of SIRT5 knockdown on promoting anchorage‐independent growth in HepG2 liver cells. The capability of HepG2 cells with single or double knockdown of SIRT5/ACOX1 to exhibit anchorage‐independent growth was determined by performing soft‐agar colony formation assay as described in Materials and Methods. Representative images for soft‐agar colony formation (D) and the related quantified result (E) are shown. The other images are presented in Appendix Fig S11.
Furthermore, we found that H2O2 levels in the peroxisome, cytosol, and nuclei were increased in SDHA knockdown cells (Fig EV4A). This was associated with elevated ROS as well as increased protein levels of DNA damage response markers (Fig EV4B and C). Additionally, we generated HepG2 cells with single or double knockdown of SDHA/ACOX1 by shRNAs and found that depletion of ACOX1 partially blocked SDHA knockdown‐induced H2O2 and ROS production in different cellular compartments (Fig EV5A and B). The phosphorylation level of ERK or AKT was not affected by single or double knockdown of SDHA/ACOX1 in HepG2 cells (Appendix Fig S13).
Figure EV4. SDHA knockdown leads to increased H2O2 and ROS, and induced oxidative DNA damage response.
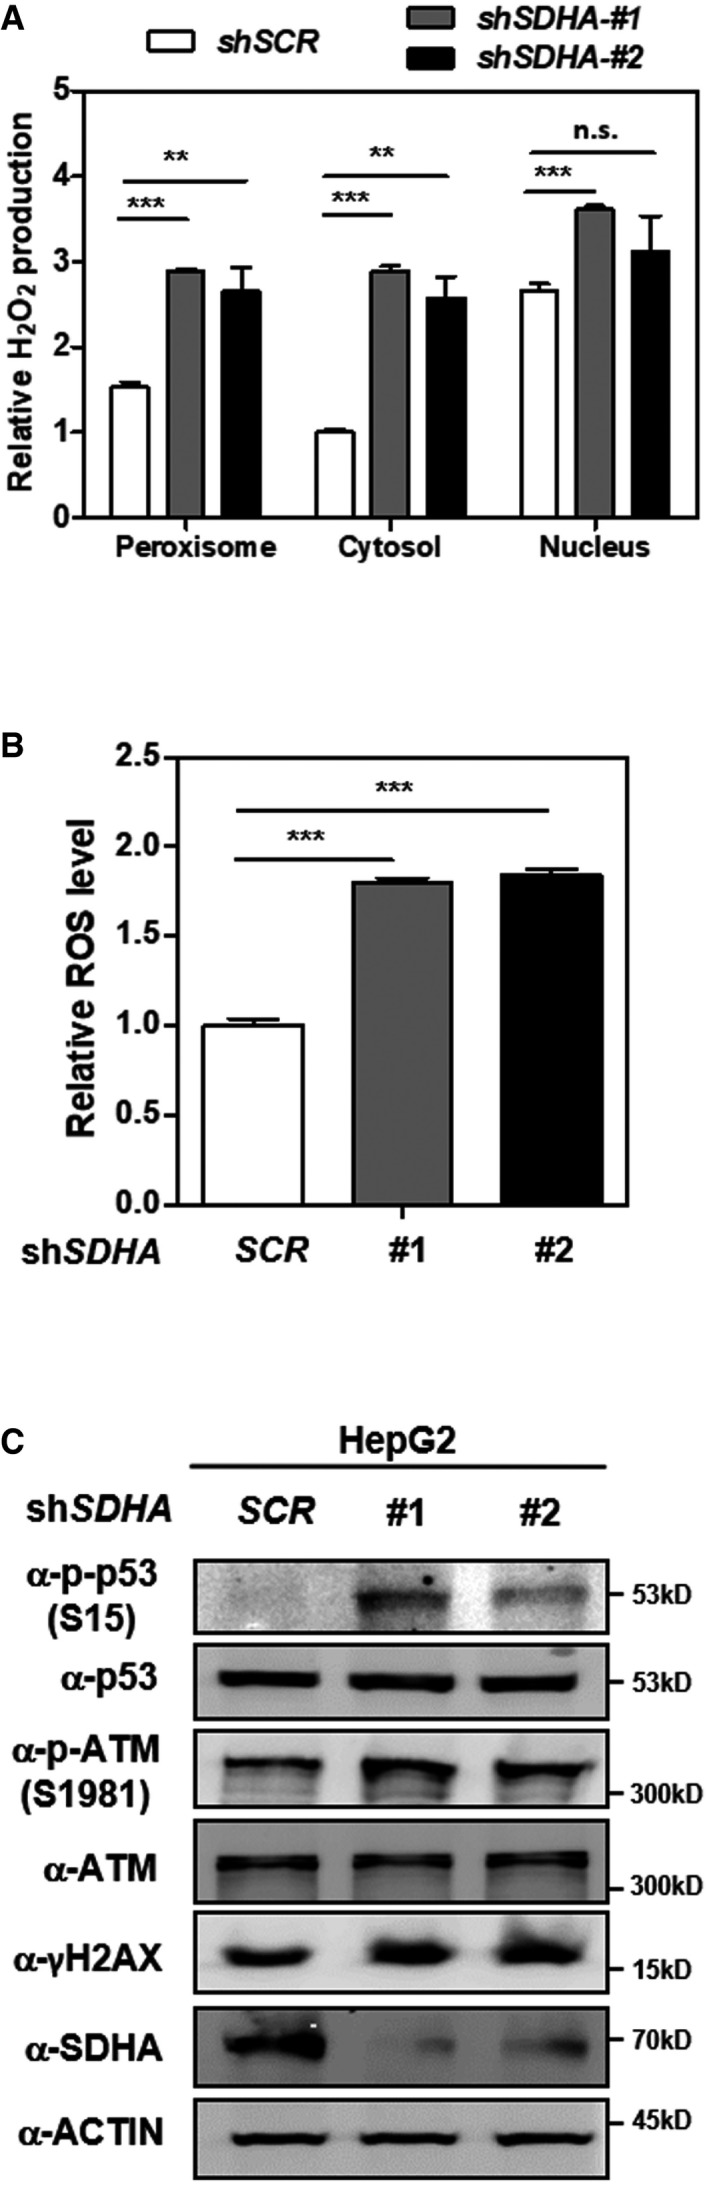
- Knockdown of SDHA stimulates H2O2 production in the peroxisome, cytosol, and nucleus. In HepG2 cells with stable SDHA knockdown, endogenous H2O2 production in the indicated cellular compartments was determined by using the Hyper biosensor as described in Materials and Methods. Note: Given that the level of endogenous H2O2 does not change over time, we have collected the excitation ratio (490/420 nm) at single time point (at 5 min).
- Knockdown of SDHA increases cellular ROS. In HepG2 cells with stable SDHA knockdown, ROS level was determined in cell extracts as described in Materials and Methods.
- Knockdown of SDHA induces oxidative DNA damage response. In HepG2 cells with stable SDHA knockdown, the indicated classical oxidative DNA damage response markers were determined by Western blot analysis.
Figure EV5. ACOX1 knockdown partially blocks the effect of SDHA knockdown on increasing cellular H2O2 and ROS in HepG2 cells.
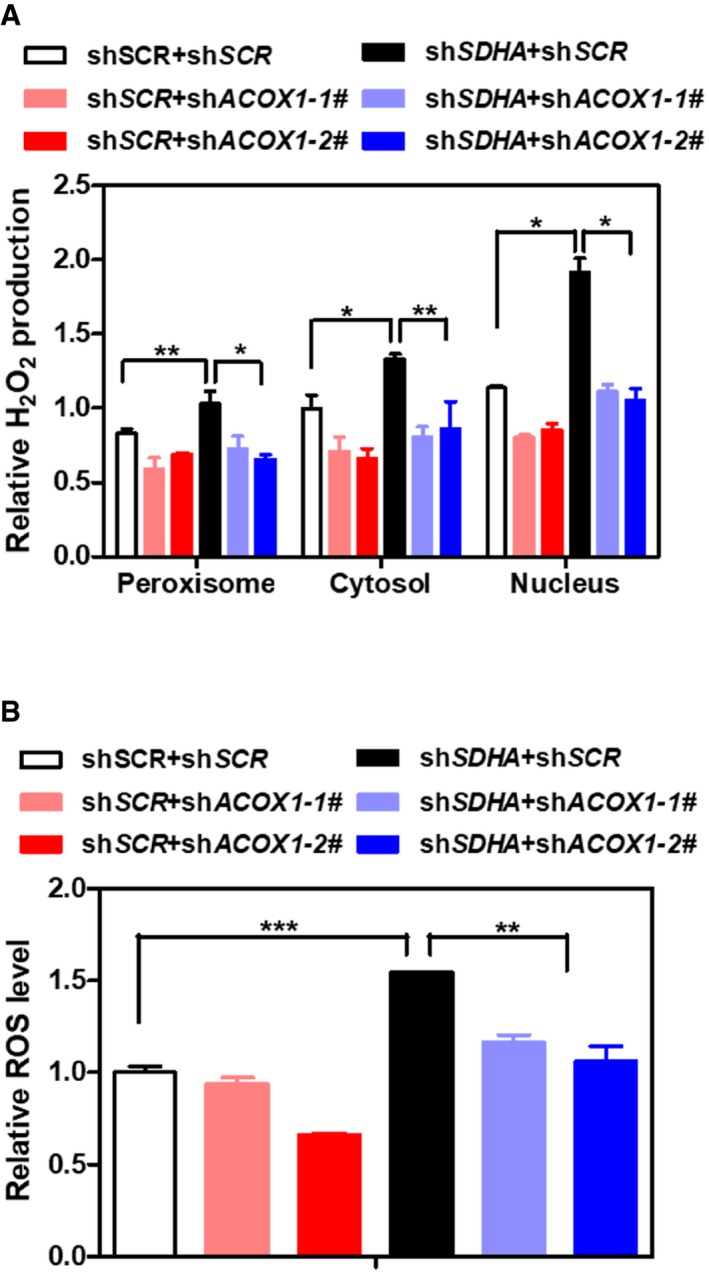
- ACOX1 knockdown partially diminishes the effect of SDHA knockdown on increasing H2O2. In HepG2 stable cells with single or double knockdown of SDHA/ACOX1, endogenous H2O2 level in the indicated cellular compartments was determined by using the Hyper biosensor as described in Materials and Methods. Note: given that the level of endogenous H2O2 does not change over time, we have collected the excitation ratio (490/420 nm) at single time point (at 5 min).
- ACOX1 knockdown partially impairs the effect of SDHA knockdown on increasing ROS. In HepG2 stable cells with single or double knockdown of SDHA/ACOX1, ROS level was determined in cell extracts as described in Materials and Methods.
Together, these findings provide independent and in vivo data supporting that lysine succinylation can activate ACOX1 activity, which influences cellular ROS and DNA damage response.
Downregulation of SIRT5 correlates with high ACOX1 succinylation and activity, and poor HCC survival
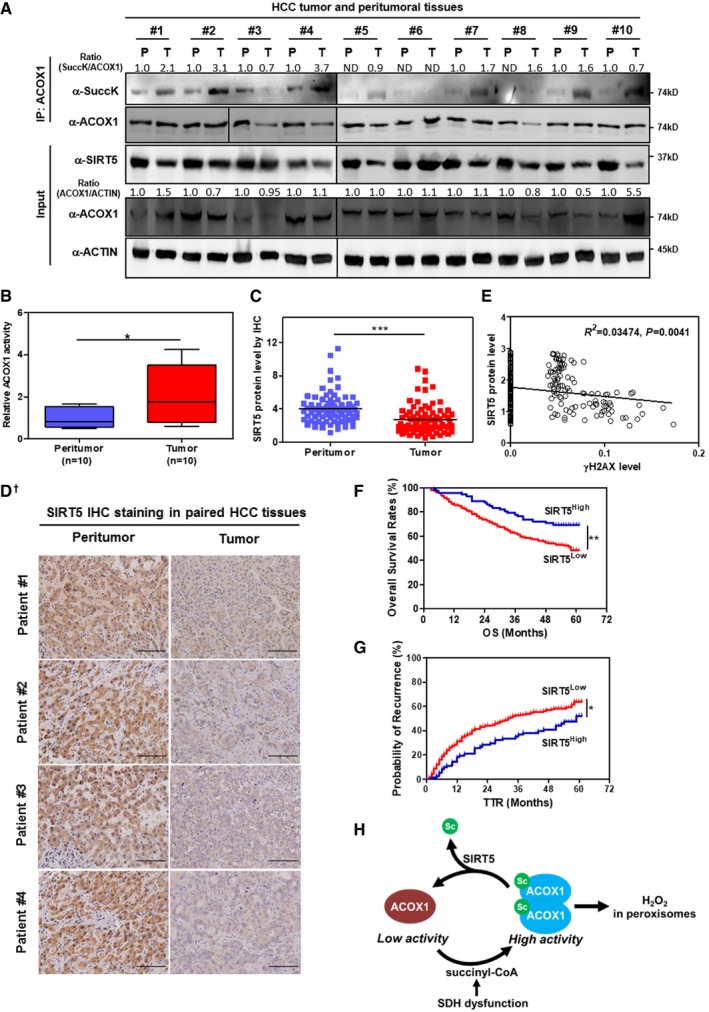
Liver hepatocytes contain a larger number of peroxisomes that are also larger sized as compared to other cell types, and as in other cell types, the major pathways in hepatic peroxisomes are α‐ and β‐oxidation 51. This suggests active β‐oxidation activity and a demand of SIRT5 function in liver cells. As noted in the introduction, defects in peroxisomal metabolism are closely linked to progressive liver diseases including HCC. In a panel of 10 pairs of primary HCC tumors and their adjacent normal tissues, we observed that SIRT5 protein was decreased in six cases of HCC tissues when compared to peritumor tissues (Fig 6A). The succinylation level of ACOX1 was generally increased, and the enzyme activity of ACOX1 was significantly increased by as much as 2.1‐fold (P < 0.05) in HCC tissues (Fig 6B). To confirm the observed downregulation of SIRT5 protein in HCC tissues, we used a specific antibody against SIRT5 and performed IHC staining in liver tissues in a study cohort consisting of 78 HCC patients. Our data demonstrated that SIRT5 protein was significantly (P < 0.001) downregulated in HCC tumors compared to adjacent normal tissues (Fig 6C and D). In another study cohort consisting of 118 HCC patient samples, IHC staining revealed that γH2AX was broadly increased in HCC tissues than peritumor tissues (P < 0.001) (Appendix Fig S14) and that the γH2AX levels exhibited a negative correlation with SIRT5 protein levels (R 2 = 0.03474, P = 0.0041; Fig 6E). These findings indicate that SIRT5 downregulation is associated with ACOX1 activation and H2O2‐induced oxidative DNA damage response in HCC.
Figure 6. Increased ACOX1 succinylation and activity are associated with reduced SIRT5 expression in HCC tumors.
-
AHCC tumors show reduced SIRT5 expression and increased ACOX1 succinylation. In total, 10 pairs of HCC tumor tissues (T) and peritumoral tissues (P) paired samples, ACOX1 protein was immunopurified with an anti‐ACOX1 antibody, followed by Western blot to detect its succinylation. Protein levels of ACOX1 and SIRT5 were determined by direct Western blot. Relative ACOX1 and SIRT5 protein levels were normalized against β‐actin protein.
-
BACOX1 activity is increased in HCC tumors. Purified ACOX1 protein in 10 pairs of HCC tumors and peritumoral tissues in (A) was subjected to its enzyme activity assay as described in Materials and Methods. The graph boxes delimit the first and third quartiles. The horizontal lines represent the data medians. Whiskers delimit the lowest and the highest value within 1.5 of the interquartile range (IQR) of the lower and the upper quartiles, respectively.
-
C, DSIRT5 protein expression is downregulated in HCC tumors. In a study cohort consisting of 78 HCC patients, the SIRT5 protein was detected by IHC staining as described in Materials and Methods (D). Representative IHC images (original magnification, 200×; a single focal plane, scale bar, 50 μm) are shown.
-
EγH2AX levels show a negative correlation with SIRT5 protein levels in HCC tumors. In a cohort consisting of 118 HCC patients (each has two repeats), the γH2AX and SIRT5 protein levels in the same samples were detected by IHC staining as described in Materials and Methods, followed by quantitative assessment.
-
F, GHigh SIRT5 expression is associated with favorable prognosis in HCC patients. In a tissue microarray composed of primary tumors from 316 consecutive curative HCC patients, the SIRT5 protein was detected by IHC staining as described in Materials and Methods. The correlation between SIRT5 staining intensity and OS (overall survival) or TTR (time to recurrence) was assessed by Kaplan–Meier method and log‐rank test, respectively.
-
HA proposed model illustrating SIRT5‐dependent lysine succinylation in regulating ACOX1 activity. As shown, lysine succinylation is increased by either SIRT5 loss or SDH dysfunction. Lysine succinylation can activate ACOX1 by promoting the formation of dimeric ACOX1, thereby stimulating H2O2 production in peroxisomes.
In order to gain further insight into how SIRT5 expression is associated with prognosis of HCC patients, a tissue microarray composed of primary tumors from 316 consecutive curative HCC patients was analyzed. Of these patients, the demographic and clinicopathological data were shown in Appendix Table S2. SIRT5 staining intensity was scored using a 4‐point scale (0 to +++) based on the number of positive cells 52. These 316 patients were divided by staining intensity as SIRT5Low (0 and “+”) (n = 244) and SIRT5High (“++” and “+++”) (n = 62), respectively. Univariate analysis revealed that α‐fetoprotein (AFP), γ‐glutamyltransferase (γ‐GT), tumor number, tumor size, microvascular invasion, tumor differentiation, tumor–nodes–metastasis (TNM) stage, and Barcelona Clinic Liver Cancer (BCLC) stage were associated with overall survival (OS), whereas AFP, γ‐GT, liver cirrhosis, tumor number, tumor size, microvascular invasion, tumor differentiation, TNM stage, and BCLC stage were associated with disease‐free survival (DFS). In multivariate analysis, γ‐GT and tumor differentiation were associated with overall survival OS, whereas γ‐GT, liver cirrhosis, and tumor differentiation were associated with disease‐free survival DFS (Table 1). Univariate and multivariate analyses showed that SIRT5 expression in tumor cells served as an independent protective factor for both OS (P = 0.003, Hazard ratio (HR) = 0.49) and time to recurrence (TTR) (P = 0.002, HR = 0.539) (Fig 6F and G). Together, these results suggest that high SIRT5 expression is associated with favorable prognosis and that SIRT5 may represent an independent protective factor for HCC patients.
Table 1.
SIRT5 is an independent prognostic factor in HCC patients
| Factor | OS | TTR | ||||||
|---|---|---|---|---|---|---|---|---|
| Multivariate | Multivariate | |||||||
| Univariate P | Hazard Ratio | 95% CI | P † | Univariate P | Hazard Ratio | 95% CI | P † | |
| Sex (female versus male) | 0.657 | NA | 0.331 | NA | ||||
| Age, years (≤ 50 versus > 50) | 0.436 | NA | 0.260 | NA | ||||
| HBsAg (negative versus positive) | 0.248 | NA | 0.655 | NA | ||||
| AFP, ng/ml (≤ 20 versus > 20) | 0.003 | NS | 0.035 | NS | ||||
| γ‐GT, U/l (≤ 54 versus > 54) | < 0.001 | 1.702 | 1.192–2.430 | 0.003 | < 0.001 | 1.676 | 1.229–2.284 | 0.001 |
| Liver cirrhosis (no versus yes) | 0.154 | NA | 0.023 | 1.639 | 1.067–2.517 | 0.024 | ||
| Tumor number (single versus multiple) | < 0.001 | NS | 0.001 | NS | ||||
| Tumor size, cm (≤ 5 versus > 5) | < 0.001 | NS | < 0.001 | NS | ||||
| Tumor encapsulation (complete versus none) | 0.210 | NA | 0.163 | NA | ||||
| Microvascular invasion (no versus yes) | 0.004 | NS | 0.002 | NS | ||||
| Tumor differentiation (I‐II versus III‐IV) | 0.002 | 1.550 | 1.056–2.275 | 0.025 | 0.004 | 1.458 | 1.038–2.048 | 0.030 |
| TNM stage (I versus II III) | < 0.001 | NS | < 0.001 | NS | ||||
| BCLC stage (0/A versus B/C) | < 0.001 | NS | < 0.001 | NS | ||||
| SIRT5 (low versus high) | 0.008 | 0.490 | 0.307–0.782 | 0.003 | 0.018 | 0.539 | 0.365–0.795 | 0.002 |
AFP, α‐fetoprotein; BCLC, Barcelona Clinic Liver Cancer; CI, confidence interval; γ‐GT, γ‐glutamyl transferase; HR, hazard ratio; NA, not adopted; OS, overall survival; TNM, tumor–nodes–metastasis; TTR, time to recurrence.
†Cox proportional hazards regression.
Discussion
Recent proteomic studies have discovered that lysine succinylation is present in a wide range of mitochondrial, cytosolic, and nuclear proteins 30, 53. For a long time, the mammalian cellular transferase for lysine succinylation has not been well characterized, while succinylation was regarded as a nonenzymatic modification. Recently, Wang et al 54 showed that histone acetyltransferase KAT2A coupled with α‐ketoglutarate dehydrogenase complex (α‐KGDH) can succinylate nuclear histone H3. However, the succinyl‐transferase in non‐nuclear compartments still remains unknown. So far, investigation on the regulation of lysine succinylation and its biological relevance has mainly been focusing on the SIRT5 desuccinylase. In the current study, we discover for the first time to our knowledge that SIRT5 is localized in the peroxisome except other subcellular compartments previously reported. Another uniqueness of this study is that we show ACOX1, as a rate‐limiting enzyme involved in peroxisomal fatty acid β‐oxidation, is a physiological substrate of SIRT5, and that SIRT5‐mediated lysine desuccinylation causes enzymatic inhibition of ACOX1 by impairing its active dimer formation. It is known that fatty acid β‐oxidation occurs in both peroxisomes and mitochondria. These two organelles act in synergy to promote fatty acid catabolism, as VLCFAs (greater than C‐22) and branched fatty acids undertake initial oxidation till octanoyl‐CoA is formed, at which point it undergoes mitochondrial oxidation 55. Of note, Sirt5‐null mice exhibit remarkably high levels of medium‐ and long‐chain acylcarnitines in the liver and skeletal muscle, which is associated with impaired mitochondrial fatty acid β‐oxidation 31. Whether or not the observed high accumulation of β‐oxidation intermediates in Sirt5‐null mouse tissues is caused by activated peroxisomal β‐oxidation still needs further investigations.
Previously, we have shown that SIRT5 controls NADPH production in cells, at least in part, through regulating IDH2 succinylation and G6PD glutarylation 33. Moreover, SIRT5 was recently reported to regulate the succinylation level of PKM2 56. Inhibition of PKM2 by succinylation was proposed to divert glucose flux into the pentose phosphate pathway, which includes NADPH‐producing metabolic enzymes G6PD and 6PGD, and thereby control NADPH homeostasis 56. In the current study, we have provided both biochemical evidence and cellular evidence, demonstrating that SIRT5 modulates the succinylation and enzyme activity of peroxisomal ACOX1 (Fig 6H), which is a major producer of H2O2 in multiple tissues, especially livers. Besides catalase, SIRT5 is most likely another important antioxidant gene in peroxisomes through regulating H2O2 production. It is potentially interesting to further investigate whether inhibition of both catalase and SIRT5 would lead to more severe accumulation of H2O2 in peroxisomes. Taken together, these findings support the notion that SIRT5 exerts a crucial antioxidative role in diverse subcellular compartments by multiple mechanisms.
Finally, we find that SIRT5 expression is frequently downregulated in primary hepatocellular carcinoma cancer samples when compared to adjacent normal tissues. Furthermore, downregulation of SIRT5 is associated with increased succinylation and enzyme activation of ACOX1 in HCC tissues, revealing a potential link between SIRT5 downregulation and increased oxidative damage response in HCC patient samples. In a large cohort of HCC patients, our results point out that low SIRT5 expression is associated with unfavorable prognosis, indicating that SIRT5 may represent an independent protective factor for HCC patients. It is worthy of explore whether or not SIRT5 downregulation and/or inhibition is a driving force factor for initiation and progression of HCC in animal models. It has to be noted that SIRT5 downregulation may not the sole reason causing the increase in ACOX1 succinylation. Other factors may also change the lysine succinylation level of ACOX1 by different mechanisms. For instance, NAD+ concentration is normally lower in cancer cells than in nontransformed cells 57, 58. It is thus possible that catalytic inhibition of SIRT5, due to lack of NAD+, may also contribute to the observed increased lysine succinylation and enzyme activation of ACOX1 in HCC tissues. Besides, SDH expression and/or activity will also change the level of succinate and subsequently lysine succinylation of substrates including ACOX1.
In conclusion, our study uncovers a previously unknown function of SIRT5 in peroxisome and new mechanism that regulates peroxisomal H2O2 and ROS homeostasis. We anticipate that these findings will trigger future investigation on the role of SIRT5 in balancing fatty acid β‐oxidation and ROS homeostasis and in peroxisomal disorders and liver protection.
Materials and Methods
Antibodies
Antibodies specific to HA (Santa Cruz), Flag (Shanghai genomic), SIRT5 (CST), ACOX1 (Proteintech), pan‐Acetyl‐lysine (CST), pan‐Succinyl‐lysine (PTM Biolabs), pan‐Malonyl‐lysine (PTM Biolabs), pan‐Glutaryl‐lysine (PTM Biolabs), ERK (CST), p‐ERK (CST), AKT (Proteintech), p‐AKT (CST), p53 (Santa Cruz), p‐p53 Ser15 (CST), ATM (GeneTex), p‐ATM Ser1981 (Abcam), p‐H2AX Ser139 (CST), β‐actin (CST) PMP70 (Sigma), SDHA (CST), and Lamin A/C (Genscript) were purchased commercially. Secondary antibodies for goat anti‐mouse IgG light chain specific (Jackson ImmunoResearch) and mouse anti‐rabbit IgG light chain specific (Jackson ImmunoResearch) were purchased commercially.
Plasmids
The cDNA encoding full‐length human SIRT5, ACOX1, PEX5, and PEX7 were cloned into Flag‐ or HA‐tagged vectors (pcDNA‐Flag; pcDNA‐3HA). SIRT5H158Y point mutation was generated by QuikChange Site‐Directed Mutagenesis kit (Stratagene).
Cell culture transfection and treatment
HEK293T, HepG2, Huh7, and HeLa cell lines were obtained from the American Type Culture Collection. These cell lines were cultured in Dulbecco's Modified Eagle's Medium (DMEM) (Invitrogen) supplemented with 10% fetal bovine serum (Gibco) in the presence of 100 units/ml penicillin and 100 μg/ml streptomycin at 37°C with 5% CO2.
Plasmid transfection was carried out by either PEI (1 mg/ml, pH 7.0) (Polysciences, Inc) or Lipofectamine 2000 (Invitrogen).
Animals
Sirt5 knockout (KO) mice (129‐strain background) were purchased from the Jackson Laboratory (https://www.jax.org/strain/012757). These animals were backcrossed for four generations onto the C57BL/6J background. Animals were given unrestricted access to a standard diet and tap water. Animal experiments were performed at Fudan Animal Center in accordance with the Animal Welfare guidelines.
Generation of stable cell lines
To generate stable cells with SIRT5 knockdown cells, shRNA oligos targeting SIRT5 were custom‐synthesized, annealed, and inserted into the pMKO.1 plasmid, according to standard cloning protocol. The two shRNA sequences targeting SIRT5 are 5′‐GCCCTTGAACATTTCCCAATG‐3′ and 5′‐GCATTAGAACTACAGACAAC‐3′ 33. Retrovirus was produced using a two‐plasmid packing system as previously described 59. Briefly, pMKO.1 shRNA plasmid was co‐transfected with vsvg and gag packing plasmids into HEK293T cells. Retroviral supernatant was harvested from HEK293T cells at 36 h after transfection and mixed with 8 μg/ml polybrene to increase infection efficiency. The infected cells were selected in 2 μg/ml puromycin for 1 week.
To generate stable HepG2 cells with single or double knockdown of ACOX1 and SDHA, shRNA oligos targeting ACOX1 or SDHA were custom‐synthesized, annealed, and inserted into the pMKO.1‐hygro plasmid. The shRNA sequences targeting ACOX1 are 5′‐CCTGCCTGAGTGGACAGCTGTAAAT‐3′; 5′‐CGCTGAGTAACAAGCTGACTT‐3′. The shRNA sequences targeting SDHA are 5′‐ATGCAGGCCTGGAGATAAA‐3′ and 5′‐GCGATATGATACCAGCTATTT‐3′ 42. Retrovirus was produced using a two‐plasmid packing system as mentioned above. The infected HepG2 cells were selected with 50 μg/ml hygromycin for 1 week.
Immunoprecipitation and Western blotting
Cells were lysed in ice‐cold NP‐40 buffer, containing 50 mM Tris–HCl (pH 7.4), 150 mM NaCl, 0.1–0.5% NP‐40, and protease inhibitor cocktail (Roche) with rotation at 4°C for 30 min. A particle‐free supernatant solution was obtained by centrifugation at 13,600 × g for 15 min at 4°C. Immunoprecipitation was carried out either by incubating Flag beads (Sigma) or HA beads (Sigma) at 4°C with lysate for 3 h or by incubating appropriate antibody with cell lysate for 1 h, followed by incubating with Protein‐A/G beads (Upstate) for another 2–3 h at 4°C before beads were washed three times with ice‐cold NP‐40 buffer. Western blotting was performed, and the membrane was blocked with 5% fat‐free milk (BD Biosciences). Primary and secondary antibodies were diluted in 5% fat‐free milk. For succinylation Western blotting, buffer containing 50 mM Tris (pH 7.5) with 10% (v/v) Tween‐20 and 1% peptone (Sigma) was used for blocking. The pan‐Succinyl‐lysine antibody was diluted in 5% BSA or buffer containing 50 mM Tris (pH 7.5) with 0.1% peptone.
Frozen HCC tissues and mouse livers were homogenized in ice‐cold 0.3% NP‐40 buffer containing 50 mM Tris–HCl (pH 7.4), 150 mM NaCl, and protease and phosphatase inhibitor cocktail by the Tissuelyser‐24 (Shanghai JingXin). ACOX1 protein was immunoprecipitation with an anti‐ACOX1 antibody, followed by direct Western blot analyses as described above.
Subcellular fractionation
Cellular fractionation was conducted in HepG2 cells by using the Peroxisome Isolation Kit (Sigma, Product Code PEROX1). Briefly, 2 × 10⁸ HepG2 cells were harvested in PBS, and the cell suspension was centrifuged at 250 × g for 5 min. Peroxisome Extraction Buffer (5 mM MOPS, pH 7.65, with 0.25 M sucrose, 1 mM EDTA, and 0.1% ethanol, Protease Inhibitor Cocktail) was added, following vortex to achieve an even suspension. Next, the cells were homogenized in a 7 ml Dounce homogenizer (Product Code T0566) using Pestle B. Centrifuged the sample at 1,000 × g for 10 min, and then at 2,000 × g for 10 min to obtain the pellet (i.e., the mitochondrial fraction). Transferred the supernatant to a new centrifuge tube, centrifuged at 25,000 × g for 20 min to obtain the suspension (i.e., the crude peroxisomal fraction), and then performed the density gradient centrifugation in Optiprep solution. After centrifugation for 1.5 h at 100,000 × g, the bottom layer (i.e., the purified peroxisomes) was harvested for further analysis.
Catalase activity assay
HepG2 stable cells (90‐mm dish) were harvested in 1 ml NP‐40 lysis buffer, 5 μl lysate was added into 35 μl H2O2 detection buffer, then added 10 μl hydrogen peroxide (250 mM). The mixture was incubated at 25°C for 3 min and immediately added 450 μl stop solution. 10 μl reaction buffer from above was subjected to catalase activity assay as described in the instruction by measuring A520 using a Spectra Max M5 microplate Reader (Molecular Devices).
Glutaraldehyde cross‐linking experiment
The whole cell lysis (100 μl) containing 0.5% NP‐40 and 20 mM HEPES buffer (pH 7.5) was treated with 5 μl of freshly prepared 2.3% (v/v) glutaraldehyde (Sangon Biotech) at 37°C for 5 min. The reaction was terminated by adding 10 μl of 1 M Tris–HCl (pH 8.0) and then subjected to Western blot analysis.
ACOX1 enzyme activity assay
ACOX1 enzyme activity was determined as described previously 60. Briefly, the reaction mixture (150 μl) consisted of 0.8 mM 4‐aminoantipyrine, 11 mM phenol solution, 0.04% Triton X‐100, 0.05% (w/v) palmitoyl‐CoA (Sigma), 5 μM FAD, 1 purpurogallin units' peroxidase enzyme in 50 mM 2‐(N‐morpholino) ethanesulfonic acid (MES) buffer (pH 8.0). Reactions were initiated by adding 5 μl of ACOX1 protein and analyzed at 30°C. Activities were measured spectrophotometrically by recording oxidation of 4‐aminoantipyrine (4‐AA)/phenol to quinoneimine dye by peroxidase (POD) at A500 nm (HITACHI F‐4600 fluorescence spectrophotometer). The activity of ACOX1 was calculated by the ratio of A500 change in total 15 min. Each sample was analyzed in triplicate.
For in vitro enzyme assay, Flag‐ACOX1 was immunoprecipitated with anti‐Flag M2 affinity resin (Sigma) and eluted with Flag peptide. The eluted proteins were incubated with HA‐tagged wild‐type or mutant SIRT5 in reaction buffer (80 μl) containing 25 mM Tris–HCl (pH 8.0), 1 mM MgCl2, 200 mM NaCl, 5 mM KCl, 0.1% PEG8000, and 3.125 mM NAD+ at 37°C for 1 hr, and then subjected to ACOX1 activity assay and Western blot analysis.
Measurement of intracellular ROS
Intracellular ROS production was determined by using a fluorescent dye 2′,7′‐dichlorofluorescein diacetate (H2DCF‐DA, Sigma‐Aldrich). Briefly, cells were washed with PBS and incubated with 10 μM H2DCF‐DA at 37°C for 30 min to load the fluorescent dye. Cells were washed with PBS and harvested to measure the fluorescence (Ex.488 nm, Em.525 nm), which was monitored by a SpectraMax M5 Microplate Reader (Molecular Devices).
Measurement of H2O2 production in living cells
The H2O2 level was monitored in HEK293 and HepG2 stable cells transfected with the Hyper biosensor (pcDNA3.1‐Cyto‐hyper, PIRES‐Neo2‐Nucleus‐hyper, PIRES‐Neo2‐peroxisome‐hyper) as previously described 61, 62, 63. Transfected cells were harvested by trypsinization, washed, and re‐suspended in PBS containing 25 mM glucose. The aliquots of cells were incubated at 37°C without or with 500 μM H2O2 or 50 μM menadione. The H2O2 level was measured by a Spectra Max M5 microplate Reader (Molecular Devices) at one time point (at 5 min) and calculated by determining the excitation ratio (490/420 nm). Fluorescence values were background corrected by subtracting the intensity of cell samples not expressing the Hyper biosensor. All the samples were run in triplicate.
Metabolite extraction and GC‐MS analysis
Upon harvest, cells were fixed by immediate addition of 1 ml 80% (v/v) pre‐cold (−80°C) methanol into culture plates. Lyophilized samples were oximated with 30 μl pyridine containing 20 mg/ml methoxyamine hydrochloride (Sigma‐Aldrich, 226904) at 37°C overnight and further derivatized with 20 μl N‐tert‐butyldimethylsilyl‐N‐methyltrifluoroacetamide (Sigma‐Aldrich, 394882) at 70°C for 30 min. After filtration, 1 μl aliquot of the derivatized sample was injected into Agilent 7890A gas chromatography coupled with Agilent 5975C mass spectrometer. Separation was achieved on a HP‐5 ms fused‐silica capillary column (30 m × 250 μm i.d.; 5% diphenyl ‐ 95% methylpolysiloxane bonded and crosslinked) with helium as the carrier gas at a constant flow rate of 1 ml/min through the column. The temperature of front injection, MSD transfer interface, and electron impact (EI) ion source were set to 280, 290 and 230°C, respectively. The GC oven temperature was set to 100°C for 3 min, with an increment rate of 10°C/min to 140°C, 8°C/min to 260°C, 10°C/min to 310°C, and a final 5‐min maintenance at 310°C. The electron impact ionization was 70 eV. Relative concentrations of succinate and fumarate were represented by calculating succinate (26.48 min) and fumarate (27.06 min) peak areas.
Cell proliferation analysis
HepG2 stable cells were seeded in triplicate in 6‐well plates at a density of 1 × 10⁵ cells per well. Culture medium was refreshed every 2 days. Cell numbers were counted every 3 days over a period of 9 days.
Soft‐agar colony formation assay
1.5 ml medium containing 0.7% agar was poured into 6‐well plates at first and acted as bottom layer to segregate the cells from touching with the surface of plate bottom. After solidifying, a top layer medium containing 0.35% agar and 3,000 cells was poured. The plates were placed in the incubator, and the medium was changed every 3 for 30 days. Then, the colonies were fixed by 4% paraformaldehyde in PBS and stained with 0.01% crystal violet solution. The colonies larger than 0.1 mm were counted per well as described previously 64. Every group was completed in biological triplicate.
Human hepatocellular carcinoma (HCC) cancer samples
HCC cancer samples were collected by the Department of Liver Surgery, Liver Cancer Institute, Zhongshan Hospital, Fudan University. A physician obtained informed consent from the patients. The procedures related to human subjects were approved by the Ethics Committee of the Institutes of Biomedical Sciences (IBS), Fudan University. Direct immunoprecipitation and Western blotting for these samples were performed as described in “Immunoprecipitation and Western blotting”.
Immunofluorescence assay
Cells were fixed with 4% PMSF (Sangon) for 12 h overnight at room temperature before washing with cold PBS and then were treated with 0.3% Triton X‐100 for cell perforation at room temperature for 15 min. Afterward, the cells were incubated with blocking buffer (3% BSA in PBS) for 1 h, followed by incubation at 4°C overnight with primary antibodies against Flag (Sigma‐Aldrich, dilution at 1:500) and PMP70 (Sigma‐Aldrich, dilution at 1:1,000 for rabbit anti‐PMP70, or at 1:100 for mouse anti‐PMP70), SIRT5 (Sigma‐Aldrich, dilution at 1:250), and SDHA (CST, dilution at 1:300). Alex Fluor 488 (Red) and Alex Fluor 594 (Green)‐conjugated secondary antibodies (Invitrogen) were then applied and incubated at room temperature for 1 h. Cell nuclei were stained with DAPI (Invitrogen) or Hoechst (Thermo Fisher). Images were captured using Leica fluorescence optical microscope (P5). Original magnification, 630×.
Immunohistochemistry (IHC) analysis
Mouse livers were fixed in 4% neutral buffered formalin (Sangon), mounted in paraffin, and then were cut into 5 μm thin sections. Human HCC samples were mounted in paraffin and then were cut into 5 μm thin sections. Sections were normally deparaffinized and incubated with 3% H2O2 in PBS for 30 min to eliminate the endogenous peroxidase activity. After microwave repair for 10 min, the sections were incubated with blocking buffer (5% goat serum and 0.3% Triton X‐100 in PBS) at 25°C for 1–2 h, followed by incubation at 4°C overnight with the primary antibody against SIRT5 (Sigma‐Aldrich, dilution at 1:500), or γH2AX (CST, dilution at 1:500), PBS (without the primary antibody) was used as a negative control. A horseradish peroxidase (HRP)‐conjugated secondary antibody (MXB) was then applied and incubated at 37°C for 1 h. Sections were developed with a 3,3′‐diaminobenzidine tetrahydrochloride (DAB) kit (Vector Laboratories) and stopped with water according to the manufacturer's instructions. Images were captured using OLYMPUS digital camera (DP71), original magnification, 200×; a single focal plane, scale bar, 50 μm are shown, and immunohistochemical scores were calculated by three independent pathologists without knowledge of the patient characteristics, discrepancies were resolved by discussion. The immunostains were scored using a 4‐point scale (0 to +++) based on the number of positive cells and the intensity of the staining. SIRT5 staining intensity was scored using a 4‐point scale (0 to +++) based on the number of positive cells and the intensity of the staining.
Statistics
Statistical analyses were performed with a two‐tailed unpaired Student's t‐test, except when indicated. All data shown represent the results obtained from triplicated independent experiments with standard deviation of the mean (mean ± SD). The values of P < 0.05 were considered statistically significant.
Author contributions
X‐FC, Y‐HS, K‐LG, YX, and DY conceived the general framework of this study. X‐FC designed experiments. X‐FC, M‐XT, R‐QS, M‐LZ, L‐SZ, LJ, L‐LC, W‐JZ, K‐LD, Y‐JC, CG and Z‐LC performed experiments. FW and H‐XY provided SIRT5 KO mice. Y‐ZZ and YY provided unique biosensor reagents. W‐RL collected human liver cancer samples. J‐YZ and Y‐PS provided other experimental materials and equipment. X‐FC, K‐LG, YX, and DY prepared the manuscript.
Conflict of interest
The authors declare that they have no conflict of interest.
K.L.G. is a co‐founder and has an equity interest in Vivace Therapeutics, Inc. The terms of this arrangement have been reviewed and approved by the University of California, San Diego, in accordance with its conflict of interest policies.
Supporting information
Appendix
Expanded View Figures PDF
Source Data for Expanded View
Review Process File
Source Data for Figure 1
Source Data for Figure 2
Source Data for Figure 3
Source Data for Figure 4
Source Data for Figure 5
Source Data for Figure 6
Acknowledgements
We thank members of the Fudan MCB laboratory for discussions and support throughout this study. This work was supported by the National Key R&D Program of China (No. 2016YFA0501800 to D.Y. and Y.X.), the NSFC grant (No. 81372198 to D. Y.), the 973 Program (No. 2015CB910401 to Y.X.), and the Shanghai Committee of Science and Technology, China (No. 16JC1404000 to D.Y.). This work was also supported by NIH grants (GM067113 and CA063834 to Y.X.; CA196878 and GM51586 to K.L.G.).
EMBO Reports (2018) 19: e45124
Note
†Correction added on 4 May 2018 after first online publication: In the previous version of Figure 6D SIRT5 IHC stained tissues labeled as Patient #1 and #2 were actually from the same patient sample. The new Figure 6D shows the correct information.
References
- 1. Poirier Y, Antonenkov VD, Glumoff T, Hiltunen JK (2006) Peroxisomal beta‐oxidation–a metabolic pathway with multiple functions. Biochem Biophys Acta 1763: 1413–1426 [DOI] [PubMed] [Google Scholar]
- 2. Wanders RJ, Ferdinandusse S, Brites P, Kemp S (2010) Peroxisomes, lipid metabolism and lipotoxicity. Biochem Biophys Acta 1801: 272–280 [DOI] [PubMed] [Google Scholar]
- 3. Shimozawa N (2011) Molecular and clinical findings and diagnostic flowchart of peroxisomal diseases. Brain Develop 33: 770–776 [DOI] [PubMed] [Google Scholar]
- 4. Lazarow PB (2003) Peroxisome biogenesis: advances and conundrums. Curr Opin Cell Biol 15: 489–497 [DOI] [PubMed] [Google Scholar]
- 5. Delille HK, Bonekamp NA, Schrader M (2006) Peroxisomes and disease ‐ an overview. Int J Biomed Sci 2: 308–314 [PMC free article] [PubMed] [Google Scholar]
- 6. Heiland I, Erdmann R (2005) Biogenesis of peroxisomes. Topogenesis of the peroxisomal membrane and matrix proteins. FEBS J 272: 2362–2372 [DOI] [PubMed] [Google Scholar]
- 7. Wanders RJ, Waterham HR (2006) Peroxisomal disorders: the single peroxisomal enzyme deficiencies. Biochem Biophys Acta 1763: 1707–1720 [DOI] [PubMed] [Google Scholar]
- 8. Steinberg SJ, Dodt G, Raymond GV, Braverman NE, Moser AB, Moser HW (2006) Peroxisome biogenesis disorders. Biochem Biophys Acta 1763: 1733–1748 [DOI] [PubMed] [Google Scholar]
- 9. Zeng J, Li D (2004) Expression and purification of his‐tagged rat peroxisomal acyl‐CoA oxidase I wild‐type and E421 mutant proteins. Protein Expr Purif 38: 153–160 [DOI] [PubMed] [Google Scholar]
- 10. Fidaleo M (2010) Peroxisomes and peroxisomal disorders: the main facts. Exp Toxicol Pathol 62: 615–625 [DOI] [PubMed] [Google Scholar]
- 11. Costa A, Drago I, Behera S, Zottini M, Pizzo P, Schroeder JI, Pozzan T, Lo Schiavo F (2010) H2O2 in plant peroxisomes: an in vivo analysis uncovers a Ca(2+)‐dependent scavenging system. Plant J 62: 760–772 [DOI] [PMC free article] [PubMed] [Google Scholar]
- 12. Bienert GP, Moller AL, Kristiansen KA, Schulz A, Moller IM, Schjoerring JK, Jahn TP (2007) Specific aquaporins facilitate the diffusion of hydrogen peroxide across membranes. J Biol Chem 282: 1183–1192 [DOI] [PubMed] [Google Scholar]
- 13. Bienert GP, Schjoerring JK, Jahn TP (2006) Membrane transport of hydrogen peroxide. Biochem Biophys Acta 1758: 994–1003 [DOI] [PubMed] [Google Scholar]
- 14. Corpas FJ, Barroso JB, del Rio LA (2001) Peroxisomes as a source of reactive oxygen species and nitric oxide signal molecules in plant cells. Trends Plant Sci 6: 145–150 [DOI] [PubMed] [Google Scholar]
- 15. Lismont C, Nordgren M, Van Veldhoven PP, Fransen M (2015) Redox interplay between mitochondria and peroxisomes. Front Cell Dev Biol 3: 35 [DOI] [PMC free article] [PubMed] [Google Scholar]
- 16. Rhee SG (2006) Cell signaling. H2O2, a necessary evil for cell signaling. Science 312: 1882–1883 [DOI] [PubMed] [Google Scholar]
- 17. Rao MS, Reddy JK (1991) An overview of peroxisome proliferator‐induced hepatocarcinogenesis. Environ Health Perspect 93: 205–209 [DOI] [PMC free article] [PubMed] [Google Scholar]
- 18. Chu R, Lin Y, Reddy KC, Pan J, Rao MS, Reddy JK, Yeldandi AV (1996) Transformation of epithelial cells stably transfected with H2O2‐generating peroxisomal urate oxidase. Can Res 56: 4846–4852 [PubMed] [Google Scholar]
- 19. Dadras SS, Thorgeirsson SS, Rao MS, Reddy JK (1998) Implication of hydrogen peroxide generation and apoptosis in the neoplastic transformation of mouse fibroblasts overexpressing peroxisomal fatty acyl‐CoA oxidase. Int J Oncol 12: 37–44 [DOI] [PubMed] [Google Scholar]
- 20. Hockberger PE, Skimina TA, Centonze VE, Lavin C, Chu S, Dadras S, Reddy JK, White JG (1999) Activation of flavin‐containing oxidases underlies light‐induced production of H2O2 in mammalian cells. Proc Natl Acad Sci USA 96: 6255–6260 [DOI] [PMC free article] [PubMed] [Google Scholar]
- 21. Lake BG (1995) Mechanisms of hepatocarcinogenicity of peroxisome‐proliferating drugs and chemicals. Annu Rev Pharmacol Toxicol 35: 483–507 [DOI] [PubMed] [Google Scholar]
- 22. Misra P, Reddy JK (2014) Peroxisome proliferator‐activated receptor‐alpha activation and excess energy burning in hepatocarcinogenesis. Biochimie 98: 63–74 [DOI] [PubMed] [Google Scholar]
- 23. Yeldandi AV, Rao MS, Reddy JK (2000) Hydrogen peroxide generation in peroxisome proliferator‐induced oncogenesis. Mutat Res 448: 159–177 [DOI] [PubMed] [Google Scholar]
- 24. Huang J, Viswakarma N, Yu S, Jia Y, Bai L, Vluggens A, Cherkaoui‐Malki M, Khan M, Singh I, Yang G et al (2011) Progressive endoplasmic reticulum stress contributes to hepatocarcinogenesis in fatty acyl‐CoA oxidase 1‐deficient mice. Am J Pathol 179: 703–713 [DOI] [PMC free article] [PubMed] [Google Scholar]
- 25. Fan CY, Pan J, Chu R, Lee D, Kluckman KD, Usuda N, Singh I, Yeldandi AV, Rao MS, Maeda N et al (1996) Hepatocellular and hepatic peroxisomal alterations in mice with a disrupted peroxisomal fatty acyl‐coenzyme A oxidase gene. J Biol Chem 271: 24698–24710 [DOI] [PubMed] [Google Scholar]
- 26. Fan CY, Pan J, Usuda N, Yeldandi AV, Rao MS, Reddy JK (1998) Steatohepatitis, spontaneous peroxisome proliferation and liver tumors in mice lacking peroxisomal fatty acyl‐CoA oxidase. Implications for peroxisome proliferator‐activated receptor alpha natural ligand metabolism. J Biol Chem 273: 15639–15645 [DOI] [PubMed] [Google Scholar]
- 27. Hirschey MD, Zhao Y (2015) Metabolic regulation by lysine malonylation, succinylation, and glutarylation. Mol Cell Proteomics 14: 2308–2315 [DOI] [PMC free article] [PubMed] [Google Scholar]
- 28. Du J, Zhou Y, Su X, Yu JJ, Khan S, Jiang H, Kim J, Woo J, Kim JH, Choi BH et al (2011) Sirt5 is a NAD‐dependent protein lysine demalonylase and desuccinylase. Science 334: 806–809 [DOI] [PMC free article] [PubMed] [Google Scholar]
- 29. Tan M, Peng C, Anderson KA, Chhoy P, Xie Z, Dai L, Park J, Chen Y, Huang H, Zhang Y et al (2014) Lysine glutarylation is a protein posttranslational modification regulated by SIRT5. Cell Metab 19: 605–617 [DOI] [PMC free article] [PubMed] [Google Scholar]
- 30. Park J, Chen Y, Tishkoff DX, Peng C, Tan M, Dai L, Xie Z, Zhang Y, Zwaans BM, Skinner ME et al (2013) SIRT5‐mediated lysine desuccinylation impacts diverse metabolic pathways. Mol Cell 50: 919–930 [DOI] [PMC free article] [PubMed] [Google Scholar]
- 31. Rardin MJ, He W, Nishida Y, Newman JC, Carrico C, Danielson SR, Guo A, Gut P, Sahu AK, Li B et al (2013) SIRT5 regulates the mitochondrial lysine succinylome and metabolic networks. Cell Metab 18: 920–933 [DOI] [PMC free article] [PubMed] [Google Scholar]
- 32. Weinert BT, Scholz C, Wagner SA, Iesmantavicius V, Su D, Daniel JA, Choudhary C (2013) Lysine succinylation is a frequently occurring modification in prokaryotes and eukaryotes and extensively overlaps with acetylation. Cell Rep 4: 842–851 [DOI] [PubMed] [Google Scholar]
- 33. Zhou L, Wang F, Sun R, Chen X, Zhang M, Xu Q, Wang Y, Wang S, Xiong Y, Guan KL et al (2016) SIRT5 promotes IDH2 desuccinylation and G6PD deglutarylation to enhance cellular antioxidant defense. EMBO Rep 17: 811–822 [DOI] [PMC free article] [PubMed] [Google Scholar]
- 34. Girzalsky W, Saffian D, Erdmann R (2010) Peroxisomal protein translocation. Biochem Biophys Acta 1803: 724–731 [DOI] [PubMed] [Google Scholar]
- 35. Kim PK, Hettema EH (2015) Multiple pathways for protein transport to peroxisomes. J Mol Biol 427: 1176–1190 [DOI] [PMC free article] [PubMed] [Google Scholar]
- 36. Subramani S (1998) Components involved in peroxisome import, biogenesis, proliferation, turnover, and movement. Physiol Rev 78: 171–188 [DOI] [PubMed] [Google Scholar]
- 37. Schluter A, Fourcade S, Domenech‐Estevez E, Gabaldon T, Huerta‐Cepas J, Berthommier G, Ripp R, Wanders RJ, Poch O, Pujol A (2007) PeroxisomeDB: a database for the peroxisomal proteome, functional genomics and disease. Nucleic Acids Res 35: D815–D822 [DOI] [PMC free article] [PubMed] [Google Scholar]
- 38. Schluter A, Real‐Chicharro A, Gabaldon T, Sanchez‐Jimenez F, Pujol A (2010) PeroxisomeDB 2.0: an integrative view of the global peroxisomal metabolome. Nucleic Acids Res 38: D800–D805 [DOI] [PMC free article] [PubMed] [Google Scholar]
- 39. Zhang J, Kim J, Alexander A, Cai S, Tripathi DN, Dere R, Tee AR, Tait‐Mulder J, Di Nardo A, Han JM et al (2013) A tuberous sclerosis complex signalling node at the peroxisome regulates mTORC1 and autophagy in response to ROS. Nat Cell Biol 15: 1186–1196 [DOI] [PMC free article] [PubMed] [Google Scholar]
- 40. Boveris A, Oshino N, Chance B (1972) The cellular production of hydrogen peroxide. Biochem J 128: 617–630 [DOI] [PMC free article] [PubMed] [Google Scholar]
- 41. Chu R, Varanasi U, Chu S, Lin Y, Usuda N, Rao MS, Reddy JK (1995) Overexpression and characterization of the human peroxisomal acyl‐CoA oxidase in insect cells. J Biol Chem 270: 4908–4915 [DOI] [PubMed] [Google Scholar]
- 42. Li F, He X, Ye D, Lin Y, Yu H, Yao C, Huang L, Zhang J, Wang F, Xu S et al (2015) NADP(+)‐IDH mutations promote hypersuccinylation that impairs mitochondria respiration and induces apoptosis resistance. Mol Cell 60: 661–675 [DOI] [PubMed] [Google Scholar]
- 43. Nakajima Y, Miyahara I, Hirotsu K, Nishina Y, Shiga K, Setoyama C, Tamaoki H, Miura R (2001) Crystallization and preliminary X‐ray characterization of rat liver acyl‐CoA oxidase. Acta Crystallogr D Biol Crystallogr 57: 1680–1681 [DOI] [PubMed] [Google Scholar]
- 44. Pedersen L, Henriksen A (2005) Acyl‐CoA oxidase 1 from Arabidopsis thaliana. Structure of a key enzyme in plant lipid metabolism. J Mol Biol 345: 487–500 [DOI] [PubMed] [Google Scholar]
- 45. Zhang X, Li K, Jones RA, Bruner SD, Butcher RA (2016) Structural characterization of acyl‐CoA oxidases reveals a direct link between pheromone biosynthesis and metabolic state in Caenorhabditis elegans . Proc Natl Acad Sci USA 113: 10055–10060 [DOI] [PMC free article] [PubMed] [Google Scholar]
- 46. Zhang X, Feng L, Chinta S, Singh P, Wang Y, Nunnery JK, Butcher RA (2015) Acyl‐CoA oxidase complexes control the chemical message produced by Caenorhabditis elegans . Proc Natl Acad Sci USA 112: 3955–3960 [DOI] [PMC free article] [PubMed] [Google Scholar]
- 47. Blanc A, Pandey NR, Srivastava AK (2003) Synchronous activation of ERK 1/2, p38mapk and PKB/Akt signaling by H2O2 in vascular smooth muscle cells: potential involvement in vascular disease (review). Int J Mol Med 11: 229–234 [PubMed] [Google Scholar]
- 48. Mehdi MZ, Azar ZM, Srivastava AK (2007) Role of receptor and nonreceptor protein tyrosine kinases in H2O2‐induced PKB and ERK1/2 signaling. Cell Biochem Biophys 47: 1–10 [DOI] [PubMed] [Google Scholar]
- 49. Chu S, Huang Q, Alvares K, Yeldandi AV, Rao MS, Reddy JK (1995) Transformation of mammalian cells by overexpressing H2O2‐generating peroxisomal fatty acyl‐CoA oxidase. Proc Natl Acad Sci USA 92: 7080–7084 [DOI] [PMC free article] [PubMed] [Google Scholar]
- 50. Okamoto M, Reddy JK, Oyasu R (1997) Tumorigenic conversion of a non‐tumorigenic rat urothelial cell line by overexpression of H2O2‐generating peroxisomal fatty acyl‐CoA oxidase. Int J Cancer 70: 716–721 [DOI] [PubMed] [Google Scholar]
- 51. Van Veldhoven PP (2010) Biochemistry and genetics of inherited disorders of peroxisomal fatty acid metabolism. J Lipid Res 51: 2863–2895 [DOI] [PMC free article] [PubMed] [Google Scholar]
- 52. Shi YH, Ding WX, Zhou J, He JY, Xu Y, Gambotto AA, Rabinowich H, Fan J, Yin XM (2008) Expression of X‐linked inhibitor‐of‐apoptosis protein in hepatocellular carcinoma promotes metastasis and tumor recurrence. Hepatology 48: 497–507 [DOI] [PMC free article] [PubMed] [Google Scholar]
- 53. Sadhukhan S, Liu X, Ryu D, Nelson OD, Stupinski JA, Li Z, Chen W, Zhang S, Weiss RS, Locasale JW et al (2016) Metabolomics‐assisted proteomics identifies succinylation and SIRT5 as important regulators of cardiac function. Proc Natl Acad Sci USA 113: 4320–4325 [DOI] [PMC free article] [PubMed] [Google Scholar]
- 54. Wang Y, Guo YR, Liu K, Yin Z, Liu R, Xia Y, Tan L, Yang P, Lee JH, Li XJ et al (2017) KAT2A coupled with the alpha‐KGDH complex acts as a histone H3 succinyltransferase. Nature 552: 273–277 [DOI] [PMC free article] [PubMed] [Google Scholar]
- 55. Lazarow PB (1978) Rat liver peroxisomes catalyze the beta oxidation of fatty acids. J Biol Chem 253: 1522–1528 [PubMed] [Google Scholar]
- 56. Xiangyun Y, Xiaomin N, Linping G, Yunhua X, Ziming L, Yongfeng Y, Zhiwei C, Shun L (2017) Desuccinylation of pyruvate kinase M2 by SIRT5 contributes to antioxidant response and tumor growth. Oncotarget 8: 6984–6993 [DOI] [PMC free article] [PubMed] [Google Scholar]
- 57. Djouder N (2015) Boosting NAD(+) for the prevention and treatment of liver cancer. Mol Cell Oncol 2: e1001199 [DOI] [PMC free article] [PubMed] [Google Scholar]
- 58. Mederacke I, Schwabe RF (2014) NAD(+) supplementation as a novel approach to cURIng HCC? Cancer Cell 26: 777–778 [DOI] [PubMed] [Google Scholar]
- 59. Christofk HR, Vander Heiden MG, Harris MH, Ramanathan A, Gerszten RE, Wei R, Fleming MD, Schreiber SL, Cantley LC (2008) The M2 splice isoform of pyruvate kinase is important for cancer metabolism and tumour growth. Nature 452: 230–233 [DOI] [PubMed] [Google Scholar]
- 60. Small GM, Burdett K, Connock MJ (1985) A sensitive spectrophotometric assay for peroxisomal acyl‐CoA oxidase. Biochem J 227: 205–210 [DOI] [PMC free article] [PubMed] [Google Scholar]
- 61. Zhao Y, Hu Q, Cheng F, Su N, Wang A, Zou Y, Hu H, Chen X, Zhou HM, Huang X et al (2015) SoNar, a highly responsive NAD+/NADH sensor, allows high‐throughput metabolic screening of anti‐tumor agents. Cell Metab 21: 777–789 [DOI] [PMC free article] [PubMed] [Google Scholar]
- 62. Belousov VV, Fradkov AF, Lukyanov KA, Staroverov DB, Shakhbazov KS, Terskikh AV, Lukyanov S (2006) Genetically encoded fluorescent indicator for intracellular hydrogen peroxide. Nat Methods 3: 281–286 [DOI] [PubMed] [Google Scholar]
- 63. Zhao Y, Jin J, Hu Q, Zhou HM, Yi J, Yu Z, Xu L, Wang X, Yang Y, Loscalzo J (2011) Genetically encoded fluorescent sensors for intracellular NADH detection. Cell Metab 14: 555–566 [DOI] [PMC free article] [PubMed] [Google Scholar]
- 64. Jiang C, Pecha J, Hoshino I, Ankrapp D, Xiao H (2007) TIP30 mutant derived from hepatocellular carcinoma specimens promotes growth of HepG2 cells through up‐regulation of N‐cadherin. Can Res 67: 3574–3582 [DOI] [PubMed] [Google Scholar]
Associated Data
This section collects any data citations, data availability statements, or supplementary materials included in this article.
Supplementary Materials
Appendix
Expanded View Figures PDF
Source Data for Expanded View
Review Process File
Source Data for Figure 1
Source Data for Figure 2
Source Data for Figure 3
Source Data for Figure 4
Source Data for Figure 5
Source Data for Figure 6