

Abstract
Background
The extensive keeping of companion animals and the substantial monetary amount we spend on these animals indicate that they are highly valued. Although the benefits humans derive from keeping cats and dogs have been extensively studied, how we conceptualize these animals has received limited attention. How people conceptualize cats and dogs is important as it influences human behavior and the well-being of humans as well as animals. The objective of this paper was to examine the conceptual meaning of dogs and cats and the relative importance of meanings assigned to these species.
Methods
Based on a Swedish on-line survey (n = 2028) the free-elicitation method was used to measure the salience of conceptualizations for dogs and cats as this method measures the accessibility of the focal object in people’s memory. An R-index approach was used to analyze the importance and dominance of attributes on the premise that the order in which attributes were listed by respondents reflects their relative importance. The sum of the choice probability was used to evaluate the stochastic rank order of attributes and Somers’ D was used to examine difference in rankings between groups of respondents.
Results
For dogs, human well-being in terms of emotional and social support, and emotional attachment (friendship, love, companionship, joy and loyalty) were found to be most important while elements related to the animals themselves (e.g. personality of the animal) were found to be less important. For cats, personality of the animal was along with love found to be most important. The results were largely consistent across different types of households.
Conclusions
The results provide information on the relative importance of salient attributes and thus indicate which attributes that are important to consider, for example, when analyzing human-animal interaction, animal welfare, human health and subjective-well-being, or the economic value of cats and dogs.
Electronic supplementary material
The online version of this article (10.1186/s40359-018-0228-1) contains supplementary material, which is available to authorized users.
Keywords: Attribute importance, Salience, Conceptualization, Cat, Dog, Companion animal
Background
Cats and dogs are extensively kept as companion and working animals around the world. In Sweden and in Europe approximately one fourth [1, 2] and in the U.S. about one third of the households kept a cat or a dog [3] in 2012. In Europe, approximately € 35 billion was in 2016 spent on food products for companion animals and pet-related products and services [1]. Corresponding figure for the U.S. was approximately $ 67 billion [4].
The benefits humans derive from keeping cats and dogs have been extensively studied. For example, cats and dogs have been found to promote psychological health and well-being by providing companionship, emotional and social support, a sense of safety and security, entertainment, happiness, and relaxation (see e.g., [5–7]). Dogs have also been found to promote exercise and outdoor activities, affect the physical health of humans, and are used in different types of therapeutic settings (see e.g., [8, 5]). However, the scientific support for several of these benefits is disputed [9–11].
With different familiarity, and on the range from a specific animal to animals in general, people make associations between the identity of a focal object (e.g. a specific animal) and other conceptual associations held in mind. For example, a certain dog breed might be thought of as ‘caring’ or ‘cute’; another dog breed can be associated with being ‘aggressive’. These types of associations might be obtained as social constructs or successively learnt from internal experiences. At some point, the identity of the object and the associated conceptualizations become aligned in the mind of us as individuals. When considered in relation to a certain focal object the conceptualization establishes bearers of assigned meaning which, in turn, can be decomposed into three dimensions: functional; emotional; and abstract [12, 13]. In this way, this meaning may influence human behavior and well-being in relation to the focal object, and may therefore have the potential to ultimately affect how animals are treated, selected and cared for. Furthermore, not all bearers of assigned meaning are of equal importance.
Previous studies have examined the reasons people keep companion animals [14, 15], the different roles companion animals play in peoples’ lives [16, 17], the dimensions underlying the dog-human relationship [18], the types of economic values they provide [19], the consumption opportunities that they provide [20], and consumption values [21]. Previous studies have mainly focused on animal owners, most of them are qualitative in nature, but to our knowledge there are no previous studies on the conceptualization of cats and dogs.
The objective of this paper was to examine the conceptual meaning of dogs and cats, to explore how such meaning can be decomposed into abstract, emotional, and functional dimensions, and to examine the order of importance given to the identified elements of conceptual meaning.
Methods
The free-elicitation method was used to measure the salience of conceptualizations for dogs and cats because it measures the accessibility of the focal object in people’s memory [22, 23]. In this respect, the concept of salience refers to the ease to which certain aspects (henceforth: attributes) of the focal object come to mind when thinking about the object. The free-elicitation method uses open-ended questions to let individuals indicate which features of an object are considered important [24]. Although importance can be influenced by different factors (e.g. distinctiveness) it is in this method assumed that the order of elicitation reflects importance, i.e. the top-of-mind features are the most important [25]. Salient attributes are more important than non-salient attributes [24, 26], i.e. attributes that come to mind are more important than those that do not and all non-salient attributes are equally (un)important.
Questionnaire
An on-line questionnaire was designed to capture the attributes people associate with cats and dogs, respectively, as well as the relative importance of these attributes, and characteristics of respondents (see Additional file 1 for details on the questionnaire). Respondents answered questions either related to cats or to dogs and were, in an open-ended question, asked to list what came to mind when thinking of the species, describing each aspect in one or a few words. This question was phrased as openly as possible, to capture salience and minimize the problem of framing effects. Specifically, the question for dogs was: “Which aspects come to mind when you think of dogs? Describe separately each aspect in one word (or a few words)”. Respondents were initially provided two lines but for each response the respondent filled in, an additional line was provided. At most ten different responses could be listed. This structure was adopted to encourage respondents to only list the most salient aspects.
The dog questionnaire (cat questionnaire) included subsequent questions concerning whether the respondent kept a dog (cat), and if not if they had been thinking of doing so; which breeds they kept or had been thinking of keeping; reasons for keeping or not keeping a dog (cat); and if they had previously had a dog (cat) in the household. The last section of the questionnaire concerned socio-demographic information including age and gender of the respondent, size of the household, and whether the household included children.
Data collection
Data consisted of a convenience sample of the Swedish population. Data was collected via an online questionnaire between the 10th of July and the 29th of September 2014. A link to the questionnaire was distributed via Facebook. No specific group of society was targeted. Although some self-selection bias was expected, in terms of a higher response rate among those positive towards dogs and cats, the data was expected to reflect many of the attributes that Swedes associate with cats and dogs. Respondents answered anonymously. The final sample, excluding respondents younger than 20 years old, consisted of 1267 respondents answering the dog questionnaire and 760 respondents answering the cat questionnaire. Descriptive statistics of the samples are presented in Table 1.
Table 1.
Descriptive characteristics of the samples, percentages
| Dog questionnaire | Cat questionnaire | |||
|---|---|---|---|---|
| (n = 1267) | (n = 760) | |||
| Number of animals in household | ||||
| 0 | …dogs | 20 | …cats | 23 |
| ≥ 1 | …dog | 80 | …cat | 77 |
| 1 | …dogs | 41 | …cats | 32 |
| 2 | …dogs | 23 | …cats | 23 |
| ≥ 3 | …dogs | 13 | …cats | 18 |
| N/A | 3 | 4 | ||
| Both cat and dog in household | 31 | 13 | ||
| Do not keep but has | ||||
| …previously kept a | …a doga | 71 | … a cata | 83 |
| …have thought of keeping | …a doga | 70 | … a cata | 66 |
| Age, years | ||||
| 20–29 | 17 | 14 | ||
| 30–39 | 12 | 10 | ||
| 40–49 | 16 | 18 | ||
| 50–65 | 37 | 38 | ||
| > 65 | 11 | 12 | ||
| N/A | 7 | 8 | ||
| Gender | ||||
| Female | 86 | 86 | ||
| Male | 7 | 6 | ||
| N/A | 7 | 8 | ||
| Persons in household | ||||
| 1 | 17 | 21 | ||
| 2 | 41 | 39 | ||
| 3–4 | 27 | 26 | ||
| > 4 | 8 | 6 | ||
| N/A | 7 | 8 | ||
| Children in household | ||||
| Yes | 31 | 30 | ||
| No | 62 | 62 | ||
| N/A | 7 | 8 | ||
Percentage in proportion of total sample except otherwise noted, aare proportion of respondents not keeping a dog (or cat) who answered whether or not previously kept and whether or not have been thinking of keeping, respectively
A large proportion, roughly four out of five, of the respondents of the dog (cat) questionnaire kept a dog (cat). Of those that did not, a majority had previously kept or had been thinking of keeping a dog (cat). Official statistics on the socio-demographic characteristics of the Swedish population that keep cats and dogs do not exist. Hence, the characteristics of the sample were compared to the distribution of the Swedish population as a whole [27]. The age groups 30–39 and older than 65 were underrepresented while the age group 50–65 was overrepresented. Women were overrepresented as were smaller household sizes (especially two person households). The proportion of households with children reflected the proportion in Sweden [28].
Categorization, classification and ranking of responses
The key question of the questionnaire was the open-ended question concerning what came to mind when thinking of dogs or cats. Responses were transformed and categorized for data analysis. First, terms with similar semantic meaning (e.g. “friendly”, “kind”, and “warm-hearted”) were grouped together. Then groups of words interpreted as having the same association and connotation (conceptual meaning) were categorized under a common heading (e.g., “stubborn”, “strong willed”, “proud”, and “integrity” were grouped under personality/mentality of the animal). When a response could be interpreted as belonging to two categories it was included in both categories. When terms with similar association and connotation (conceptual meaning) were listed separately by a large proportion of respondents, these terms were categorized separately. Finally, each category was classified as functional, emotional, or abstract according to the value dimension [14].
The attributes were ranked in the order in which they were listed. Given the large number and heterogeneity of the responses, it was inevitable that some respondents mentioned more than one attribute within a specific category. In these cases, the response with the highest rank was used in the statistical analysis. Respondents could list up to 10 attributes. Hence, attributes not mentioned by a respondent were ranked as 11 in order to account for that attributes that do not come to mind are equally unimportant and less important than attributes that do come to mind.
Data analysis
An R-index [28] approach was used to analyze the importance and dominance of attributes on the premise that the order in which attributes were listed by respondents reflects their relative importance. The R–index expresses the pairwise probability that a given attribute is preferred over another.
Aggregating the rank of each attribute over all respondents results in a response matrix as shown in Table 2, with Sm being the sum of counts of all ranks of each attribute m = 1, 2, …, M (see e.g., [29]).
Table 2.
Response matrix used for computing the R-index
| Counts ranked as | ||||||
|---|---|---|---|---|---|---|
| 1st | 2nd | … | 10th | 11th (not mentioned) | Sum | |
| Attribute 1 (A1) | a1 | b1 | … | j1 | k1 | S1 |
| Attribute 2 (A2) | a2 | b2 | … | j2 | k2 | S2 |
| … | … | … | … | … | … | … |
| Attribute 30 (A30) | a30 | b30 | … | j30 | k30 | S30 |
Let the pairwise probability that attribute m is perceived as more important than attribute n be given by Rmn, with m, n = 1, 2, …, M. The probability that attribute 1 is preferred over attribute 2 is given by with A = a1(b2 + c2 + … + k2) + b1(c2 + … + k2) + … + j1k2 while the probability of attribute 2 being preferred over attribute 1 is given by with C = a2(b1 + c1 + … + k1) + b2(c1 + … + k1) + … + j2k1. Furthermore, the probability that attribute 1 is equally preferred to attribute 2 is given by with B = (a1a2 + b1b2 + … + k1k2). The pooled probability that attribute 1 is more important than attribute 2 is then given by [29, 30].
The pairwise probability Rmn reflects the relative importance of an attribute and Table 3 shows the (m*m) matrix of the R-index values for all pairwise comparisons of attributes, with Rmm = 100. Based on the R-index values, two-tailed pairwise tests of whether attribute m was preferred over attribute n or whether attribute n was preferred over attribute m, were performed using the critical values derived by Bi and O’Mahony [31]. The null hypothesis that the R-index equals the chance value of 50% is rejected if the R-index is significantly greater than the chance value (H0: Rmn = 50). An attribute m is considered strictly dominant if it is preferred over all other attributes, i.e. Rmn – 50 > critical value for all other n≠m attributes. An attribute m is considered weakly dominant if it dominates at least one other attribute (i.e. Rmn – 50 > critical value for at least one attribute n≠m), while not being dominated by any other attribute (i.e. – Rnm – 50 < critical value is not the case for any n≠m attributes).
Table 3.
R-index matrix with choice probabilities
| Attribute Am | A1 | A2 | … | AM-1 | AM | Sum of choice probability (SCP) |
|---|---|---|---|---|---|---|
| A1 | 100 | R12 | … | R1(M-1) | R1M | SCP1 = 100 + R12 + R13 + … + R1M |
| A2 | R21 | 100 | … | R2(M-1) | R2M | SCP2 = R21 + 100 + R23+ … + R2M |
| … | … | … | … | … | … | … |
| AM-1 | R(M-1)1 | R(M-1)2 | … | 100 | R(M-1)M | SCPM = RM1 + … + 100+ R(M-1)M |
| AM | RM1 | RM2 | … | RM(M-1) | 100 | SCPM = RM1+ … + RM(M-1) + 100 |
The sum of the choice probability (SCP) that attribute m was more important than attribute n was obtained by summing the pooled pairwise probabilities by row as shown in Table 3. The SCPs can be used to evaluate the stochastic rank order of attributes [30]. They also enable pairwise comparisons of the relative importance of two attributes that goes beyond the rankings.
Rankings were obtained for different groups of respondents. Differences between subgroups were examined for specific attributes based on Somers’ D [32]. Taking potential ties in ranking into account Somers’ D was used to measure the association between a group variable and the ranking of an attribute Am. It provides information on the difference between the probability that a randomly selected person from subgroup X rank attribute Am higher than a randomly selected person from subgroup Y and the probability that a person in subgroup X rank Am lower than a person in subgroup Y. Hypotheses of no differences between subgroups were, for each of the top attributes, tested based on Somers’ D (1% level of significance) and 99% confidence intervals were presented for cases with statistically significant differences.
Results
Categorization and classification of responses
Of the respondents of the dog questionnaires, 50% listed one or two attributes, 37% three or four attributes while 14% listed five or more attributes. Corresponding figures for the cat questionnaire were 59%, 34%, and 7%. Following the procedure described in section 2.3, the responses for dogs were sorted into 25 attribute categories. The same categories were included for cats with the exceptions of physical activity, outdoor activity and leisure activities as responses in these categories were lacking. The conceptual dimensions (functional, emotional or abstract) and the percentage of responses in each of the attribute categories are presented in Table 4.
Table 4.
Attribute categories with value dimension and percentage of respondents mentioning each attribute
| Attribute category | Value dimensiona | % of respondents in | ||
|---|---|---|---|---|
| dog questionnaire | cat questionnaire | |||
| 1 | Companionship | F | 31% | 18% |
| 2 | Family | F | 7% | 2% |
| 3 | Friend | F | 35% | 4% |
| 4 | Social interaction | F | 7% | 1% |
| 5 | Relaxation | F | 2% | 6% |
| 6 | Human health | F | 4% | 4% |
| 7 | Physical activity | F | 14% | 0% |
| 8 | Outdoor activities | F | 7% | 0% |
| 9 | Leisure activities | F | 11% | 0% |
| 10 | Services provided as working animals etc. | F | 6% | 3% |
| 11 | Responsibility | F | 11% | 5% |
| 12 | Demanding | F | 6% | 3% |
| 13 | Nuisances | F | 5% | 8% |
| 14 | Safe/unsafe | E, F | 9% | 2% |
| 15 | Central in life | E, F | 5% | 2% |
| 16 | Love | E | 35% | 51% |
| 17 | Joy | E | 31% | 11% |
| 18 | Enjoyable | E | 7% | 14% |
| 19 | Loyalty | A, E | 24% | 3% |
| 20 | Honesty | A, E | 3% | 2% |
| 21 | Appearance | A, E | 3% | 18% |
| 22 | Personality (including mentality) | A, E | 3% | 56% |
| 23 | Intelligence | A | 4% | 10% |
| 24 | Breeds & other traits | A | 5% | 9% |
| 25 | Animal welfare | A | 2% | 4% |
aF refers to the functional, E refers to the emotional and A refers to the abstract value dimension
A majority of the attributes were classified as having a functional value dimension although attributes with emotional and abstract value dimensions were also found. The latter primarily concerned animal traits without a clear functional or emotional value dimension. It should be noted that the value dimensions are not distinctly separate. Some attributes had more than one potential value dimension. For example, watch dogs were classified as functional (guard the house) as well as emotional (providing a feeling of being safe).
The relative importance of dog attributes
The sum choice probabilities and the rankings of dog attributes are presented in Table 5. Based on the obtained sum choice probabilities Fig. 1 depicts the importance of each attribute relative to the chance value, i.e. a situation where each attribute has a 50–50 chance of being preferred over each of the other attributes.
Table 5.
Rank, choice probabilities and dominance based on R-index for all respondents
| Rank | Dogs (n = 1267) | Dominance | Cats (n = 760) | Dominance | ||||||
|---|---|---|---|---|---|---|---|---|---|---|
| Attributes | SCP | AD | DA | Attributes | SCP | AD | DA | |||
| 1 | Friendship | 1608 | 21 | 0 | a | Personality (incl. mentality) | 1667 | 21 | 0 | b |
| 2 | Love | 1599 | 21 | 0 | a | Love | 1600 | 20 | 1 | |
| 3 | Companionship | 1557 | 21 | 0 | a | Companionship | 1231 | 17 | 2 | |
| 4 | Joy | 1557 | 21 | 0 | a | Appearance | 1224 | 17 | 2 | |
| 5 | Loyalty | 1465 | 20 | 4 | Enjoyable | 1185 | 14 | 2 | ||
| 6 | Physical activities | 1333 | 17 | 5 | Joy | 1147 | 11 | 4 | ||
| 7 | Leisure activities | 1298 | 12 | 5 | Intelligence | 1135 | 8 | 4 | ||
| 8 | Responsibility | 1295 | 12 | 5 | Breeds & other traits | 1124 | 5 | 4 | ||
| 9 | Safe/unsafe | 1271 | 6 | 6 | Nuisances | 1121 | 5 | 5 | ||
| 10 | Family | 1254 | 2 | 6 | Relaxation | 1094 | 0 | 5 | ||
| 11 | Outdoor activities | 1252 | 2 | 6 | Responsibility | 1087 | 0 | 5 | ||
| 12 | Enjoyable | 1248 | 1 | 6 | Friendship | 1078 | 0 | 6 | ||
| 13 | Social interaction | 1245 | 1 | 6 | Health | 1076 | 0 | 6 | ||
| 14 | Demanding | 1233 | 0 | 8 | Animal welfare | 1073 | 0 | 6 | ||
| 15 | Services provided | 1228 | 0 | 8 | Services provided | 1068 | 0 | 7 | ||
| 16 | Breeds & other traits | 1227 | 0 | 8 | Demanding | 1066 | 0 | 7 | ||
| 17 | Central in life | 1222 | 0 | 8 | Loyalty | 1064 | 0 | 7 | ||
| 18 | Nuisances | 1222 | 0 | 8 | Safe/unsafe | 1056 | 0 | 9 | ||
| 19 | Health | 1213 | 0 | 8 | Honesty | 1055 | 0 | 9 | ||
| 20 | Intelligence | 1208 | 0 | 9 | Central in life | 1050 | 0 | 9 | ||
| 21 | Honesty | 1201 | 0 | 9 | Family | 1050 | 0 | 9 | ||
| 22 | Appearance | 1199 | 0 | 9 | Social interaction | 1047 | 0 | 9 | ||
| 23 | Personality (incl. mentality) | 1193 | 0 | 9 | ||||||
| 24 | Relaxation | 1190 | 0 | 11 | ||||||
| 25 | Animal welfare | 1181 | 0 | 13 | ||||||
Rank rank according to the choice probability, SCP sum choice probability, AD number of other attributes dominating, DA number of other attributes dominated by, adenotes weak dominance, and bdenotes strict dominance
Fig. 1.
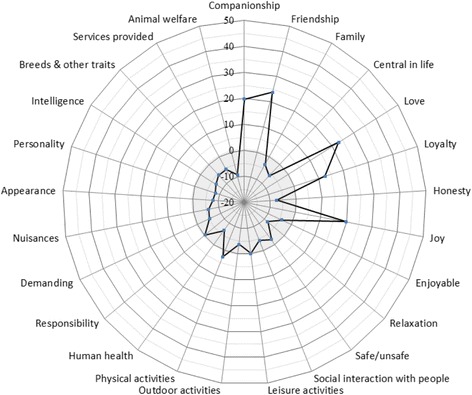
Importance of dog attributes relative to chance values. The chance value refers to the situation where each of the attributes has a 50–50 chance of being preferred over each of the other attributes. For (positive) values outside the grey circle the attribute has a probability greater than 50% to be considered important and for (negative) values inside the circle a probability less than 50%
As shown in Table 5, the five attributes ranked highest according to the sum choice probabilities were friendship, love, companionship, joy and loyalty. These dominated at least 20 other attributes and the first four attributes showed weak dominance. About half of the attributes did not dominate any other attribute. Animal welfare and several animal traits were among the less important attributes. The top ranked attribute friendship was 36% more likely than the least important attribute (animal welfare) to be considered important while the attributes love (35%), companionship (32%), friendship (32%), and loyalty (24%) were more than 20% more likely to be considered important. Attributes related to the abstract value dimension (e.g. animal welfare and characteristics of the animal) were generally ranked low while the highest ranked attributes primarily had functional and/or emotional value dimensions.
Subgroups of respondents were formed to examine if the attributes which individuals found important were influenced by the characteristics of the household, the characteristics of the respondent, whether the respondent had a dog or not, and if they did not, whether they had been thinking of keeping a dog or not. The sum choice probabilities, the rankings and the dominance of the attributes in each of the subgroups are presented in Table 6.
Table 6.
Dogs: Rank, choice probabilities and dominance based on R-index for different subgroups
| Keeping a dog | Gender | Household size | Children in household | |||||||||||||||
|---|---|---|---|---|---|---|---|---|---|---|---|---|---|---|---|---|---|---|
| Yes (n = 1016) | No but have thought of (n = 153) | No & have not thought of (n = 65) | Female (n = 1086) | Male (n = 90) | Single (n = 221) | Not single (n = 955) | Yes (n = 393) | No (n = 783) | ||||||||||
| Rank | Attr | SCP | Attr | SCP | Attr | SCP | Attr | SCP | Attr | SCP | Attr | SCP | Attr | SCP | Attr | SCP | Attr | SCP |
| 1 | 3a | 1618 | 17a | 1596 | 3a | 1548 | 3a | 1619 | 19a | 1575 | 1a | 1658 | 16a | 1610 | 16a | 1651 | 3a | 1608 |
| 2 | 16a | 1613 | 3a | 1593 | 16a | 1520 | 16a | 1613 | 1a | 1574 | 3a | 1638 | 3a | 1607 | 3a | 1622 | 16a | 1581 |
| 3 | 1a | 1560 | 1a | 1571 | 1a | 1474 | 17a | 1574 | 3a | 1549 | 16a | 1577 | 17a | 1567 | 1a | 1569 | 17a | 1568 |
| 4 | 17 | 1560 | 16a | 1562 | 19a | 1469 | 1a | 1566 | 16a | 1496 | 17a | 1537 | 1a | 1545 | 17a | 1548 | 1a | 1565 |
| 5 | 19 | 1460 | 19a | 1519 | 13a | 1424 | 19 | 1457 | 17a | 1412 | 19 | 1422 | 19 | 1476 | 19 | 1513 | 19 | 1443 |
| 6 | 7 | 1336 | 14 | 1334 | 17 | 1367 | 7 | 1341 | 14 | 1342 | 7 | 1361 | 7 | 1328 | 9 | 1327 | 7 | 1340 |
| 7 | 9 | 1313 | 7 | 1305 | 14 | 1356 | 11 | 1300 | 9 | 1308 | 9 | 1321 | 11 | 1307 | 7 | 1324 | 11 | 1301 |
| 8 | 11 | 1298 | 12 | 1288 | 7 | 1331 | 9 | 1296 | 10 | 1297 | 4 | 1288 | 9 | 1292 | 14 | 1308 | 9 | 1283 |
| 9 | 2 | 1259 | 11 | 1275 | 4 | 1312 | 14 | 1263 | 11 | 1283 | 8 | 1265 | 14 | 1277 | 11 | 1295 | 18 | 1255 |
| 10 | 8 | 1258 | 18 | 1269 | 11 | 1311 | 8 | 1255 | 4 | 1272 | 2 | 1262 | 2 | 1252 | 8 | 1254 | 2 | 1253 |
| 11 | 14 | 1252 | 23 | 1266 | 24 | 1293 | 2 | 1251 | 2 | 1270 | 18 | 1258 | 8 | 1249 | 2 | 1253 | 8 | 1252 |
| 12 | 4 | 1247 | 2 | 1258 | 20 | 1274 | 18 | 1245 | 24 | 1269 | 11 | 1257 | 18 | 1238 | 4 | 1240 | 14 | 1250 |
| 13 | 18 | 1245 | 13 | 1245 | 23 | 1236 | 4 | 1242 | 13 | 1267 | 10 | 1241 | 4 | 1237 | 13 | 1236 | 4 | 1247 |
| 14 | 15 | 1230 | 10 | 1241 | 22 | 1234 | 12 | 1233 | 23 | 1260 | 6 | 1236 | 12 | 1234 | 12 | 1227 | 12 | 1236 |
| 15 | 10 | 1226 | 9 | 1240 | 9 | 1233 | 15 | 1222 | 7 | 1257 | 14 | 1235 | 24 | 1228 | 10 | 1217 | 24 | 1233 |
| 16 | 12 | 1224 | 24 | 1233 | 21 | 1233 | 24 | 1222 | 12 | 1227 | 12 | 1216 | 15 | 1228 | 18 | 1216 | 10 | 1232 |
| 17 | 24 | 1224 | 21 | 1227 | 12 | 1232 | 10 | 1221 | 8 | 1216 | 24 | 1216 | 13 | 1227 | 15 | 1212 | 6 | 1226 |
| 18 | 6 | 1223 | 8 | 1224 | 25 | 1218 | 13 | 1218 | 5 | 1215 | 20 | 1200 | 10 | 1224 | 24 | 1211 | 15 | 1226 |
| 19 | 13 | 1206 | 4 | 1192 | 10 | 1217 | 6 | 1213 | 6 | 1215 | 23 | 1198 | 23 | 1209 | 20 | 1195 | 13 | 1214 |
| 20 | 20 | 1199 | 20 | 1191 | 15 | 1217 | 20 | 1201 | 15 | 1213 | 13 | 1197 | 6 | 1205 | 23 | 1189 | 23 | 1211 |
| 21 | 23 | 1196 | 22 | 1186 | 18 | 1217 | 23 | 1199 | 18 | 1203 | 15 | 1192 | 20 | 1200 | 6 | 1188 | 21 | 1206 |
| 22 | 5 | 1193 | 15 | 1177 | 5 | 1216 | 21 | 1194 | 25 | 1203 | 21 | 1191 | 21 | 1196 | 5 | 1182 | 20 | 1202 |
| 23 | 21 | 1192 | 25 | 1175 | 2 | 1196 | 22 | 1190 | 21 | 1201 | 22 | 1189 | 5 | 1193 | 25 | 1177 | 22 | 1197 |
| 24 | 22 | 1191 | 6 | 1170 | 8 | 1195 | 5 | 1186 | 20 | 1189 | 25 | 1179 | 22 | 1190 | 22 | 1174 | 5 | 1192 |
| 25 | 25 | 1180 | 5 | 1161 | 6 | 1178 | 25 | 1178 | 22 | 1189 | 5 | 1168 | 25 | 1181 | 21 | 1173 | 25 | 1182 |
Rank denotes rank according to the SCP, Attr denotes the attribute as numbered in Table 4, SCP denotes sum choice probability, adenotes weak dominance
The same top five attributes were found regardless of whether respondents were keeping a dog or not and irrespective of household size, gender, and whether the household included children or not. However, the results suggest some differences between the subgroups in the relative importance of specific attributes. In the following we focus on attributes with a probability greater than the chance value.
Fewer dominant attributes could be observed for people having a dog (friendship, love, companionship) than for people not having but that had been thinking of keeping a dog (joy, friendship, companionship, love, loyalty) or that had not been thinking of keeping a dog (friendship, love, companionship, loyalty, nuisances). The results indicated that the most important attributes for people keeping a dog were important also for people that neither had kept nor had been thinking of keeping a dog, although to a lesser extent (with the exception of loyalty). Furthermore, a larger relative importance of the attribute nuisances could be observed in the latter group and the attribute safe/unsafe was more emphasized among people not having a dog than for people having dogs. Statistical tests based on Somers’ D suggest that, given a randomly selected person who has a dog and a randomly selected person who does not have and has not been thinking of getting a dog, the former is 16%, 99% CI [3%, 28%], more likely to rank joy higher than vice versa while the latter is 16%, 99% CI [3%, 28%], more likely to rank nuisances higher than vice versa.
The results also indicate that the attributes loyalty and safe/unsafe were more important for males than females while the opposite is the case for the attributes love, joy, friendship and, physical activities. Statistical tests suggest that, given a randomly selected woman and a randomly selected man, a woman is 14%, 99% CI [3%, 25%], more likely to rank joy higher than vice versa. Furthermore, the importance of the attribute companionship was more pronounced for single person households while the attributes love and loyalty were more pronounced for households with children.
The relative importance of cat attributes
The sum choice probabilities, rankings and dominance of cat attributes are presented in Table 5 and the importance of each attribute relative to the chance value, i.e. a situation where each attribute has a 50–50 chance of being preferred over each of the other attributes, is presented in Fig. 2.
Fig. 2.
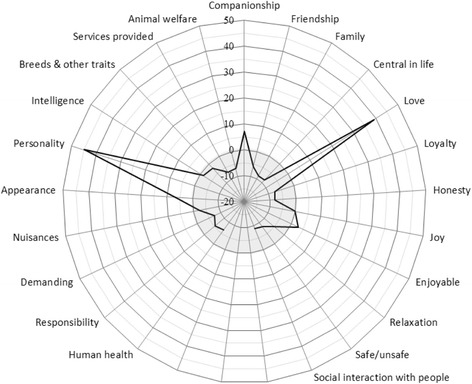
Importance of cat attributes relative to chance values. The chance value refers to the situation where each of the attributes has a 50–50 chance of being preferred over each of the other attributes. For (positive) values outside the grey circle the attribute has a probability greater than 50% to be considered important and for (negative) values inside the circle a probability less than 50%
The two top ranked attributes were personality (including mentality) of the animal and love. These attributes were considerably more important than any of the other attributes. Personality was 59% more and love was 53% more likely to be considered important than the least important attribute (social interaction), and both top attributes were at least 30% more likely to be considered important than the attribute ranked third (companionship). The attribute personality strictly dominated all other attributes and the attribute love dominated all other attributes except the top ranked. A majority of the attributes did not dominate any other attribute. The two most important attributes had both abstract and emotional value dimensions but not a clear functional dimension. Examples of less important attributes were social interaction, family, friendship, animal welfare, and loyalty.
The sum choice probabilities, rankings and dominance of attributes in different subgroups are presented in Table 7. Personality of the animal and love were the highest ranked attributes regardless of whether respondents were keeping a dog or not and irrespective of household size, gender, and whether the household included children or not. Dominance was in all of the subgroups detected for one or both of these attributes. Attributes that were less important in all subgroups included family, friendship, social interaction, and loyalty. As for dogs, the results do however suggest some differences in the relative importance of specific attributes between the subgroups.
Table 7.
Cats: Rank, choice probabilities and dominance based on R-index for different subgroups
| Keeping a cat | Gender | Household size | Children in household | |||||||||||||||
|---|---|---|---|---|---|---|---|---|---|---|---|---|---|---|---|---|---|---|
| Yes (n = 585) | No but have thought of (n = 99) | No & have not thought of (n = 51) | Female (n = 653) | Male (n = 46) | Single (n = 163) | Not single (n = 537) | Yes (n = 227) | No (n = 474) | ||||||||||
| Rank | Attr | SCP | Attr | SCP | Attr | SCP | Attr | SCP | Attr | SCP | Attr | SCP | Attr | SCP | Attr | SCP | Attr | SCP |
| 1 | 22b | 1670 | 22a | 1766 | 22a | 1519 | 22b | 1688 | 22a | 1659 | 22a | 1619 | 22b | 1705 | 22b | 1690 | 22b | 1681 |
| 2 | 16 | 1597 | 16a | 1717 | 16a | 1446 | 16 | 1613 | 16a | 1438 | 16a | 1581 | 16 | 1608 | 16 | 1567 | 16 | 1619 |
| 3 | 21 | 1227 | 1 | 1210 | 1a | 1299 | 1 | 1225 | 1 | 1236 | 21 | 1244 | 1 | 1227 | 21 | 1251 | 1 | 1233 |
| 4 | 1 | 1226 | 21 | 1200 | 13 | 1285 | 21 | 1225 | 24 | 1235 | 1 | 1229 | 21 | 1220 | 1 | 1220 | 21 | 1213 |
| 5 | 18 | 1189 | 18 | 1163 | 21 | 1259 | 18 | 1182 | 21 | 1235 | 18 | 1210 | 18 | 1170 | 13 | 1176 | 18 | 1186 |
| 6 | 17 | 1151 | 24 | 1150 | 23 | 1231 | 17 | 1143 | 23 | 1190 | 17 | 1150 | 17 | 1139 | 18 | 1163 | 17 | 1150 |
| 7 | 23 | 1126 | 23 | 1138 | 18 | 1149 | 23 | 1128 | 13 | 1182 | 24 | 1136 | 23 | 1134 | 23 | 1142 | 23 | 1127 |
| 8 | 24 | 1124 | 17 | 1125 | 17 | 1126 | 24 | 1120 | 18 | 1143 | 23 | 1126 | 24 | 1125 | 24 | 1141 | 24 | 1121 |
| 9 | 13 | 1105 | 13 | 1116 | 6 | 1108 | 13 | 1111 | 12 | 1138 | 11 | 1104 | 13 | 1120 | 5 | 1126 | 11 | 1090 |
| 10 | 5 | 1097 | 5 | 1095 | 2 | 1106 | 5 | 1097 | 17 | 1136 | 13 | 1099 | 5 | 1102 | 17 | 1123 | 2 | 1089 |
| 11 | 11 | 1090 | 6 | 1084 | 11 | 1104 | 11 | 1092 | 10 | 1115 | 25 | 1093 | 11 | 1084 | 11 | 1086 | 13 | 1086 |
| 12 | 2 | 1083 | 12 | 1072 | 10 | 1103 | 2 | 1078 | 3 | 1109 | 6 | 1092 | 2 | 1075 | 10 | 1076 | 5 | 1083 |
| 13 | 25 | 1078 | 11 | 1070 | 24 | 1084 | 25 | 1077 | 5 | 1094 | 2 | 1085 | 6 | 1070 | 6 | 1075 | 25 | 1082 |
| 14 | 6 | 1072 | 20 | 1062 | 5 | 1084 | 6 | 1076 | 6 | 1068 | 5 | 1079 | 10 | 1068 | 12 | 1074 | 6 | 1075 |
| 15 | 10 | 1067 | 10 | 1062 | 4 | 1064 | 10 | 1066 | 2 | 1065 | 12 | 1073 | 25 | 1067 | 20 | 1057 | 19 | 1069 |
| 16 | 12 | 1066 | 25 | 1052 | 14 | 1064 | 19 | 1065 | 4 | 1046 | 10 | 1072 | 12 | 1064 | 4 | 1056 | 10 | 1067 |
| 17 | 19 | 1066 | 14 | 1052 | 19 | 1064 | 12 | 1061 | 11 | 1044 | 19 | 1060 | 19 | 1064 | 25 | 1055 | 12 | 1063 |
| 18 | 3 | 1056 | 19 | 1041 | 3 | 1041 | 20 | 1056 | 20 | 1043 | 3 | 1059 | 20 | 1056 | 2 | 1052 | 14 | 1061 |
| 19 | 14 | 1056 | 4 | 1039 | 12 | 1041 | 14 | 1056 | 14 | 1042 | 14 | 1059 | 14 | 1054 | 19 | 1052 | 15 | 1054 |
| 20 | 20 | 1054 | 2 | 1038 | 15 | 1041 | 15 | 1049 | 19 | 1042 | 20 | 1053 | 4 | 1052 | 14 | 1042 | 20 | 1054 |
| 21 | 15 | 1053 | 15 | 1029 | 20 | 1041 | 4 | 1047 | 15 | 1021 | 15 | 1045 | 15 | 1048 | 3 | 1042 | 3 | 1054 |
| 22 | 4 | 1047 | 3 | 1019 | 25 | 1041 | 3 | 1045 | 25 | 1021 | 4 | 1032 | 3 | 1048 | 15 | 1033 | 4 | 1043 |
Rank denotes the rank according to the SCP, Attr denotes the attribute as numbered in Table 4, SCP denotes sum choice probability, adenotes weak dominance, and bdenotes strong dominance
Respondents that kept a cat or had been thinking of doing so emphasized the attributes personality of the animal and love more than persons who neither kept nor had been thinking of keeping a cat. Furthermore, the results indicate that nuisances, companionship, and intelligence were more important for persons who neither kept nor had been thinking of keeping a cat. Overall the relative importance of attributes was similar regardless of gender, whether or not in a single person household and whether or not there were children in the household. The results indicate that women emphasize the attribute love more than men, men emphasize the attribute breed more than women, single person households emphasize the attribute personality of the animal more than other households, and that nuisances are less important for households without children. However, no statistically significant (P < 0.01) difference between subgroups could, based on Somers’ D, be detected for the four top attributes.
Discussion
How we conceptualize and perceive cats and dogs influences human behavior and emotions, and thus the well-being of both animals and humans. In this study the conceptualization of dogs and cats was empirically examined. Respondents were asked what comes to mind when thinking of dogs (cats) and the responses were sorted into 25 attribute categories which were categorized as having functional, emotional, or abstract dimensions. The relative importance of these attributes were then examined.
The results highlight the bearers of meanings assigned to cats and dogs. Dogs and cats have long lived close to humans, reflected in the present study through many of the expressions used to describe them, for example companionship, love, and central in life. The results suggest that attributes with an emotional value dimension are important for both species (for cats top two and for dogs top four) while there is a larger emphasis on the functional value dimension related to dog attributes and a larger emphasis on the abstract value dimension related to cat attributes. The important attributes with a functional dimension relate to recreational activities important for human well-being as do many attributes with an emotional dimension.
Although the animals satisfy many different human needs, this study suggests that a limited number of attributes are more appreciated, rather than the multitude of potential benefits suggested in literature. Roughly half of the respondents mentioned one or two attributes and more than 85% listed no more than four attributes. Furthermore, the statistical analysis revealed a limited number of dominant attributes, specifically 4–5 for dogs and 1–2 for cats. That dogs fulfill a more diverse set of human needs may partly explain this difference. For example, while many respondents mentioned physical, leisure or outdoor activities in relation to dogs, none did in relation to cats. Another indication that dogs fulfill a more diverse set of human needs than do cats is a more gradual decline in the relative importance of dog attributes.
For dogs the most important attributes were companionship, friendship, love, joy, and loyalty. For cats the most important attributes were personality of the animal and love. Given the explorative approach adopted in this study it was not possible to conduct direct statistical comparisons between cats and dogs. Nevertheless, it is interesting to note that the results indicate that love was by all types of respondents ranked among the most important attributes for both cats (top two) and dogs (top four). The strong emotional connection has implications for the well-being of animals and plays a role in psychological processes that affect veterinary medicine [33]. The connection may help explain the increased spending on veterinary services related to these species [34]. Another possible consequence of a strong emotional connection is humanization of animals. In combination with owners’ lack of knowledge of animal behavior and training humanization may lead to negative outcomes such as behavioral abnormalities. These may in turn result in physical, emotional and economic costs [35]. Animals exhibiting e.g. aggressive behavior, counteracting highly ranked attributes, are often relinquished. In England, behavioral abnormalities is the most common cause of death in dogs less than 3 years old attending primary veterinary practices [36], and it is the most common cause for relinquishment to shelters in the US [37].
It is also noteworthy that the most important cat attribute (personality of the animal) was among the least important dog attributes. The latter suggests that the personality of dogs is not highly valued as an attribute per se, although it indirectly influence many other attributes valued by humans. Possibly, evolution, as well as reasons for domestication and breeding, contribute to the differences in how we perceive cats and dogs, and may also influence our expectations. Cats are solitary animals, while dogs live in social groups. Dogs have been selected for functions that to a large extent are performed in relation to humans (reflected in e.g. companionship, friendship and loyalty). Cats, on the other hand, perform their function as pest controllers independently, and are associated with attributes such as integrity.
The ranking of attributes showed a high degree of similarity between different types of individuals. Interestingly, the attributes important for people that kept a dog (cat) were also important for people not having a dog (cat), even people who had not been thinking of keeping a dog (cat). This suggests that there are potentially substantial positive externalities related to non-owners which are important to take into account when analyzing for example how humans perceive and value dogs and cats as it has implications on the well-being of humans as well as animals. Less surprising was that people who did not keep a dog (cat), especially those that had not been thinking of keeping a dog (cat), emphasized nuisances more.
Another reflection is that animal welfare as a specific attribute was ranked among the least important attributes for both dogs and for cats. This does however not mean that the well-being of cats and dogs are not perceived as important. The relative importance of attributes such as friendship and love signal strong emotional connections and as previously mention this has implications for the well-being of animals.
Regarding dogs, companionship was more important for single person households while love and loyalty were more important for households with than without children. Furthermore, men emphasized loyalty and safety more than women while love, joy, friendship and, physical activities were more important for women than for men. The differences between genders may partly be explained by respondents potentially thinking of different breeds or differences in expectations e.g. taking a more pragmatic, functional approach to dog ownership. For cats it can be noted that women emphasized the attribute love more than men while men emphasized the attribute breed more than women.
A majority of the attributes did not dominate any other attribute which can be expected given the large proportion of ties in the data set. This finding relates to the use of the open-ended format. The alternative of providing pre-specified lists are more prone to response biases in form of yea-saying (i.e. lack of discriminant validity) in allowing people to provide responses to all alternatives, irrespectively of whether they apply or not.
A potential limitation of the present study is that it is not based on a random sample. The data consist of a convenience sample collected through an online questionnaire distributed via Facebook which led to some discrepancies compared to the demographic distribution of the Swedish population. An overrepresentation of women amongst the respondents influenced the results, especially for the dog questionnaire. However, although a gender balanced sample would have altered the relative order of attributes, it most likely would not have changed the top ranked attributes. Furthermore, statistics from the US show that women to a larger extent are the primary caregivers for dogs. If this is true also for Sweden it could explain women being overrepresented in the current sample in which a majority of the respondents are caregivers. Another limitation was the low degree of resolution regarding breeds. It is likely that the results would have been different if the answers regarded specific breeds of dogs or cats, since breed differences are pronounced in both species. Furthermore, it is reasonable to assume that the reasons for and expectations of having or wanting to have a cat or a dog would influence the rankings.
Conclusion
A thorough understanding of how we conceptualize cats and dogs is important as it influences human behavior and well-being as well as how animals are treated, selected and cared for. Although further research is needed in order to fully understand the human conceptualization of cats and dogs, this study highlights the bearers of meanings assigned to cats and dogs, and the relative importance of these. The study thus provides information that can be used in future studies in a range of areas, for example, human health and subjective-wellbeing, human-animal interaction, animal welfare, and the economic value of companion animals.
Additional file
Questionnaire. Brief description of the web-based questionnaire and list of questions including response alternatives. (DOCX 15 kb)
Acknowledgements
Ragnar Söderbergs foundation is gratefully acknowledged for providing financial support for this study.
Funding
This study was supported by grants from the Ragnar Söderbergs foundation. The foundation had no role neither in the design of the study nor the collection of data, did not play any role in the analyses and interpretation of data, and was not involved in writing the manuscript.
Availability of data and materials
The datasets used in the current study is available from the corresponding author on reasonable request.
Abbreviations
- Attr
attribute
- SCP
sum of choice probability
Authors’ contributions
BSH and MHG obtained funding for this study. RH, CJL, MHG, and BSH, conceived of and designed the study. RH and CJL collected the data for the study, and performed the statistical analysis. MHG and BSH provided input on the statistical analyses and presentation of results. RH wrote the manuscript and CJL, MHG and BSH provided input on drafts of the manuscript and made revisions. All authors read and approved the final manuscript.
Ethics approval and consent to participate
Ethical approval not applicable in compliance with national regulations [38]. The respondents were provided written information that the web-based survey was part of a research project. Consent to participate was provided by responding that they wanted to answer questions related to cats or dogs.
Consent for publication
Not applicable
Competing interests
The authors declare that they have no competing interests.
Publisher’s Note
Springer Nature remains neutral with regard to jurisdictional claims in published maps and institutional affiliations.
Footnotes
Electronic supplementary material
The online version of this article (10.1186/s40359-018-0228-1) contains supplementary material, which is available to authorized users.
Contributor Information
Ruben Hoffmann, Email: Ruben.Hoffmann@slu.se.
Carl Johan Lagerkvist, Email: Carl-Johan.Lagerkvist@slu.se.
Malin Hagberg Gustavsson, Email: Malin.Gustavsson@slu.se.
Bodil S. Holst, Email: Bodil.Strom-Holst@slu.se
References
- 1.FEDIAF - The European pet food industry federation. Facts & Figures 2012. Brussels. 2013.
- 2.Statistics Sweden. (2013). Hundar, katter och andra sällskapsdjur 2012. 33 pp. Örebro. Sweden. https://www.skk.se/globalassets/dokument/om-skk/scb-undersokning-hundar-katter-och-andra-sallskapsdjur-2012.pdf.
- 3.AVMA. U.S. Pet Ownership & Demographics Sourcebook. Schaumburg: American Veterinary Medical Association. 2012.
- 4.APPA (American Pet Products Association). APPA national pet owners survey. www.americanpetproducts.org/press_industrytrends.asp. Accessed 3 Apr 2018.
- 5.Wells DL. Domestic dogs and human health: an overview. Brit J Health Psych. 2007;12:145–156. doi: 10.1348/135910706X103284. [DOI] [PubMed] [Google Scholar]
- 6.Wells DL. The effects of animals on human health and well-being. J Soc Issues. 2009;65:523–543. doi: 10.1111/j.1540-4560.2009.01612.x. [DOI] [Google Scholar]
- 7.Duvall Antonacopoulos NM, Pychyl TA. An examination of the potential role of pet ownership, human social support and pet attachment in the psychological health of individuals living alone. Anthrozoös. 2010;23:37–54. doi: 10.2752/175303710X12627079939143. [DOI] [Google Scholar]
- 8.Cutt H, Giles-Corti B, Knuiman M, Burke V. Dog ownership, health and physical activity: a critical review of the literature. Health Place. 2007;13:261–272. doi: 10.1016/j.healthplace.2006.01.003. [DOI] [PubMed] [Google Scholar]
- 9.McNicholas J, Gilbey A, Rennie A, Ahmedzai S, Dono J, Ormeriod E. Pet ownership and human health: a brief review of evidence and issues. BMJ-Brit Med J. 2005;331:1252–1254. doi: 10.1136/bmj.331.7527.1252. [DOI] [PMC free article] [PubMed] [Google Scholar]
- 10.Chur-Hansen A, Stern C, Winefield H. Gaps in the evidence about companion animals and human health: some suggestions for progress. Int J Evidence-Based Healthcare. 2010;8:140–146. doi: 10.1111/j.1744-1609.2010.00176.x. [DOI] [PubMed] [Google Scholar]
- 11.Herzog H. The impact of pets on human health and psychological well-being: fact, fiction, or hypothesis? Curr Dir Psychol Sci. 2011;20:236–239. doi: 10.1177/0963721411415220. [DOI] [Google Scholar]
- 12.Thomson DMH. Reaching out beyond liking to make new products that people want. In: MacFie HJH, Jaeger SR, editors. Consumer driven innovation in food and personal care products. Cambridge: Woodhead Publishing; 2010. [Google Scholar]
- 13.Thomson DMH, Crocker C, Marketo CG. Linking sensory characteristics to emotions: an example using dark chocolate. Food Qual Prefer. 2010;21:1117–1125. doi: 10.1016/j.foodqual.2010.04.011. [DOI] [Google Scholar]
- 14.Staats S, Sears K, Pierfelice L. Teachers’ pets and why they have them: an investigation of the human animal bond. J Appl Soc Psychol. 2006;36:1881–1891. doi: 10.1111/j.0021-9029.2006.00086.x. [DOI] [Google Scholar]
- 15.Staats S, Wallace H, Anderson T. Reasons for companion animal guardianship (pet ownership) from two populations. Soc Anim. 2008;16:279–291. doi: 10.1163/156853008X323411. [DOI] [Google Scholar]
- 16.Veevers JE. The social meaning of pets: alternative roles for companion animals. In: Sussman MB, editor. Pets and the Family. New York, NY: Haworth press; 1985. pp. 10–30. [Google Scholar]
- 17.Hirschman E. Consumers and their animal companions. J Cons Res. 1994;20:616–632. doi: 10.1086/209374. [DOI] [Google Scholar]
- 18.Dotson MJ, Hyatt EM. Understanding dog–human companionship. J Bus Res. 2008;61:457–466. doi: 10.1016/j.jbusres.2007.07.019. [DOI] [Google Scholar]
- 19.Hoffmann R, Lagerkvist CJ, Hagberg Gustavsson M, Ström Holst B. Economic Perspective on the Value of Cats and Dogs. Society & Animals. 2018; 25. doi: 10.1163/15685306-12341494.
- 20.Holbrook MB, Stephens DL, Day E, Holbrook SM, Strazar GA. Collective stereographic photo essay on key aspects of animal companionship: the truth about dogs and cats. J. Acad Mark Sci Rev. 2001;1:1–17. [Google Scholar]
- 21.Chen A, Hung K-P, Peng N. A cluster analysis examination of pet owners’ consumption values and behavior – segmenting owners strategically. J Targeting, Measurement and Analysis for Marketing. 2012;20:117–132. doi: 10.1057/jt.2012.10. [DOI] [Google Scholar]
- 22.Jaccard J, Brinberg D, Accerman LJ. Assessing attribute importance: a comparison of six methods. J Cons Res. 1986;12:463–468. doi: 10.1086/208530. [DOI] [Google Scholar]
- 23.Alba JJ, Hutchinson JW, Lynch JG., Jr . Memory and Decision making. In: Robertson TS, Kassarjian HH, editors. Handbook of consumer behavior. New Jersey: Prentice-Hall; 1991. pp. 1–49. [Google Scholar]
- 24.Van Ittersum K, Pennings JME, Wansink B, Van Trijp HCM. The validity of attribute-importance measurement: a review. J Bus Res. 2007;60:1177–1190. doi: 10.1016/j.jbusres.2007.04.001. [DOI] [Google Scholar]
- 25.Kaplan KJ, Fishbein M. The source of beliefs, their salience and predictions of attitude. J Soc Psychol. 1969;78:63–74. doi: 10.1080/00224545.1969.9922340. [DOI] [Google Scholar]
- 26.Steenkamp J-BEM, HCM VT. Attribute elicitation in marketing research: a comparison of three approaches. Mark Lett. 1997;8(2):153–165. doi: 10.1023/A:1007975518638. [DOI] [Google Scholar]
- 27.Statistics Sweden. (2015). Statistical database. http://www.statistikdatabasen.scb.se. Accessed 15 Aug, 2015.
- 28.Brown J. Recognition assessed by rating and ranking. Brit J Psychol. 1974;65:13–22. doi: 10.1111/j.2044-8295.1974.tb02766.x. [DOI] [Google Scholar]
- 29.Lee H-S, Van Hout D. Quantification of sensory and food quality: the R–index analysis. J Food Sci. 2009;74:R57–R64. doi: 10.1111/j.1750-3841.2009.01204.x. [DOI] [PubMed] [Google Scholar]
- 30.Lagerkvist CJ. Consumer preferences for food labelling attributes: comparing direct ranking and best–worst scaling for measurement of attribute importance, preference intensity and attribute dominance. Food Qual Prefer. 2013;29:77–88. doi: 10.1016/j.foodqual.2013.02.005. [DOI] [Google Scholar]
- 31.Bi J, O’Mahony M. Updated and extended table for testing the significance of the R–index. J Sens Stud. 2007;22:713–720. doi: 10.1111/j.1745-459X.2007.00132.x. [DOI] [Google Scholar]
- 32.Newson R. Confidence intervals for rank statistics: Somers' D and extensions. Stata J. 2006;6(3):309–334. [Google Scholar]
- 33.Siess S, Marziliano A, Sarma EA, Sikorski LE, Moyer A. Why psychology matters in veterinary medicine. Topics in An Compan An Med. 2015;30(2):43–47. doi: 10.1053/j.tcam.2015.05.001. [DOI] [PubMed] [Google Scholar]
- 34.Hoffmann R, Lokrantz M, Lagerkvist CJ, Hagberg Gustavsson M, Ström Holst B. Värdet av hundar och katter i Sverige. SLU Framtidens djur, natur och hälsa, Rapport. 2017;2017:1.
- 35.McBride EA, Montgomery DJ. Animal welfare: a contemporary understanding demands a contemporary approach to behaviour and training. People and Animals: The International Journal of Research and Practice (PAIJ). 2018;1
- 36.O'Neill DG, Church DB, McGreevy PD, Thomson PC, Brodbelt DC. Longevity and mortality of owned dogs in England. Vet J. 2013;198(3):638–643. doi: 10.1016/j.tvjl.2013.09.020. [DOI] [PubMed] [Google Scholar]
- 37.Scarlett JM, Salman MD, New JG, Jr, Kass PH. Reasons for relinquishment of companion animals in U.S. animal shelters: selected health and personal issues. J Appl Anim Welf Sci. 1999;2(1):41–57. doi: 10.1207/s15327604jaws0201_4. [DOI] [PubMed] [Google Scholar]
- 38.https://www.epn.se/en/start/ Accessed 15 Aug, 2015.
Associated Data
This section collects any data citations, data availability statements, or supplementary materials included in this article.
Supplementary Materials
Questionnaire. Brief description of the web-based questionnaire and list of questions including response alternatives. (DOCX 15 kb)
Data Availability Statement
The datasets used in the current study is available from the corresponding author on reasonable request.