Abstract
Background
Cellulases are enzyme which have potential applications in various industries. Researchers are looking for potential cellulolytic bacterial strains for industrial exploitation. In this investigation, cellulase production of Bacillus cereus was explored while attacking poplar twigs. The bacterium was isolated from the gut of freshwater fish, Labeo rohita and identified by 16S rRNA gene sequencing technology. Various nutritional conditions were screened and optimized through response surface methodology. Initially, Plackett-Burman design was used for screening purpose and optimization was conducted through Box-Bhenken design.
Results
The maximum cellulase production occurred at 0.5% yeast extract, 0.09% MgSO4, 0.04% peptone, 2% poplar waste biomass, initial medium pH of 9.0, and inoculum size of 2% v/v at 37 °C with agitation speed of 120 rpm for 24 h of submerged fermentation. The proposed model for optimization of cellulase production was found highly significant. The indigenously produced cellulase enzyme was employed for saccharification purpose at 50 °C for various time periods. Maximum total sugars of 31.42 mg/ml were released after 6 h of incubation at 50 °C.The efficiency of this enzyme was compared with commercial cellulase enzyme revealing significant findings.
Conclusion
These results suggested potential utilization of this strain in biofuel industry.
Keywords: Bacillus sp. 16S rRNA, Cellulase, RSM, Labeo rohita
Background
The most abundant and freely available renewable source of energy on earth is cellulose, which could be converted into valuable products such as sugars and biofuels. Conversion of cellulose into valuable products is carried out by various microbes like bacteria and fungi which secrete cellulose degrading enzymes. Complete conversion of cellulose into sugars is done by cellulase enzyme complex. This enzyme complex consists of endoglucanase (EC 3.2.1.4) which acts on internal bonds of cellulose to produce glucan, exoglucanase (EC 3.2.1.91) which acts on ends to produce cellubiose and β-glucosidase (EC 3.2.1.21) which then yields glucose units [1, 2]. The cellulase enzyme complex is produced by a variety of microbes like bacteria, yeast and actinomycetes.
Among various microbes, bacterial strains are widely used for cellulase production due to their fast growth, less energy utilization, easy genetic manipulation and ease of handling [3, 4]. Of the different bacterial genera, Bacillus genus is most widely used because it produces alkali-stable and thermostable cellulases [5–9] and other polysaccharide degrading enzyme which are extracellular in nature [10, 11]. Due to these properties of cellulases, researchers are being attracted for their utilization in various industrial sectors like detergent, pulp and paper, wine, brewery, feed and agriculture and in food [5, 12].
Production of these enzymes in labs and industries is carried out by solid state and submerged fermentations [13]. In most of the studies, submerged fermentation process is preferred over solid state fermentation because of ease in performance and efficient heat transfer [14]. For the production of industrial enzymes, cost of growth medium is very important which affects the feasibility of the process. The main factors which affects the growth and product from microbes are carbon source, nitrogen source and other inorganic salts [15, 16]. So, formulation of critical medium components plays a vital role in the production of desired products.
In most of the studies, rohita fish gut microflora showed ability to produce variety of enzymes like cellulase, lipase, protease, amylase, chitinase, tannase and phytase because gastrointestinal tract of fish have diverse nutrient flow [17–19]. The cellulolytic potential of many bacteria like Aeromonas sp., Bacillus sp. has been reported from the gut of Labeo rohita [20, 21]. It is very important to explore the gut microflora of fishes which could have association with diverse enzymes production. These bacterial isolates might play an important role in biofuel industry after degradation of cellulose of plant materials.
Various approaches such as one factor at a time (OFAT) and response surface methodology (RSM) have been employed for screening and optimization of various process parameters during fermentation process. In previous reports most of researchers used OFAT, but this approach requires more time and interaction of medium components with each other is also not studied. To overcome this problem, response surface methodology is being widely used because in this we can do more experimental trials within short time with accuracy and each medium component has interaction with each other. Now this time, response surface methodology is more widely used approach for optimization studies in various processes [22–25]. Considering these facts, we made attempt to isolate and identify cellulolytic bacterial strain originally isolated from the gut of Labeo rohita, optimize medium through response surface methodology and application of the cellulase enzyme for saccharification process.
Results and discussion
In this study a strain of Bacillus cereus was isolated from gut of fish and identified by 16S rRNA gene sequencing technology. BLAST analysis of the sequenced gene revealed 98% homology with Bacillus cereus strain as shown in Fig. 1. The isolated strain had potential for cellulase production as confirmed from growth on carboxymethyl cellulose plate stained with Congo red. For cellulase production, various process parameters were optimized and nutritional conditions were screened using placket-Burman design of response surface methodology. The main nutritional components and their levels screened are mentioned in Table 1. Twelve run experiments were conducted for screening of various nutrients for cellulase production and results are mentioned in Table 2. From this experiment the response obtained was analyzed using multiple regression and results showed that three variables i.e. concentrations of yeast extract, MgSO4 and peptone were found significant for exoglucanase production as illustrated in pareto chart (Fig. 2).
Fig. 1.
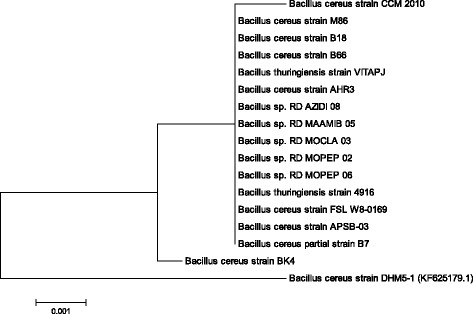
Phylogenetic analysis of Bacillus cereus isolated from gut of Labeo rhoita
Table 1.
Range of parameters used for Placket Burrman design
| Parameter | Label | Codes | |
|---|---|---|---|
| +1 | -1 | ||
| Substrate Conc. (%) | X 1 | 0.5 | 5 |
| FeSO4.7H2O (%) | X 2 | 0.07 | 0.13 |
| KH2PO4 (%) | X 3 | 0.2 | 0.6 |
| Yeast extract (%) | X 4 | 0.15 | 0.5 |
| MgSO4 (%) | X 5 | 0.06 | 0.12 |
| CaCl2 (%) | X 6 | 0.025 | 0.125 |
| Peptone (%) | X 7 | 0.03 | 0.05 |
| CoCl2 (%) | X8 | 0.05 | 0.1 |
Table 2.
Placket-Burman design for screening of parameters for exoglucanase production in submerged fermentation
| Run No. | X1 | X2 | X3 | X4 | X5 | X6 | X7 | X8 | Exoglucanase activity (IU) | Residues | |
|---|---|---|---|---|---|---|---|---|---|---|---|
| Observed | Predicted | ||||||||||
| 1 | 5.0 | 0.13 | 0.6 | 0.15 | 0.12 | 0.125 | 0.05 | 0.1 | 0.077 | 0.069 | 0.007 |
| 2 | 0.5 | 0.13 | 0.2 | 0.15 | 0.12 | 0.125 | 0.03 | 0.1 | 0.09 | 0.110 | -0.020 |
| 3 | 0.5 | 0.07 | 0.6 | 0.5 | 0.12 | 0.125 | 0.05 | 0.05 | 0.493 | 0.462 | 0.030 |
| 4 | 5.0 | 0.07 | 0.2 | 0.15 | 0.06 | 0.125 | 0.05 | 0.05 | 0.295 | 0.321 | -0.026 |
| 5 | 0.5 | 0.13 | 0.2 | 0.5 | 0.12 | 0.025 | 0.05 | 0.05 | 0.299 | 0.329 | -0.030 |
| 6 | 0.5 | 0.07 | 0.6 | 0.5 | 0.06 | 0.125 | 0.03 | 0.1 | 0.694 | 0.712 | -0.018 |
| 7 | 0.5 | 0.07 | 0.2 | 0.15 | 0.06 | 0.025 | 0.05 | 0.1 | 0.161 | 0.122 | 0.038 |
| 8 | 5.0 | 0.07 | 0.2 | 0.5 | 0.12 | 0.025 | 0.03 | 0.1 | 0.516 | 0.503 | 0.012 |
| 9 | 5.0 | 0.5 | 0.2 | 0.5 | 0.06 | 0.125 | 0.03 | 0.05 | 0.584 | 0.557 | 0.026 |
| 10 | 5.0 | 0.5 | 0.6 | 0.5 | 0.06 | 0.025 | 0.05 | 0.1 | 0.297 | 0.317 | -0.020 |
| 11 | 0.5 | 0.5 | 0.6 | 0.15 | 0.06 | 0.025 | 0.03 | 0.05 | 0.395 | 0.395 | 0.000 |
| 12 | 5.0 | 0.13 | 0.6 | 0.15 | 0.12 | 0.125 | 0.05 | 0.1 | 0.077 | 0.069 | 0.007 |
Fig. 2.
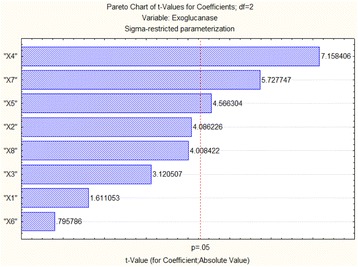
Pareto chart or significant variables for exoglucanase production from Bacillus sp
To optimize the concentrations of yeast extract, MgSO4 and peptone, Box-Behnken design of response surface methodology with three levels was employed and results are mentioned in Table 3. The response obtained was calculated by second order polynomial regression equation (Eqs.4 and 5).The results showed that maximum cellulase production was observed at concentrations of 0.5% yeast extract, 0.09% MgSO4 and 0.03% peptone using poplar biomass as carbon source. The predicted cellulase production under these conditions were almost near to the observed value depicting the accuracy of the model.
| 4 |
| 5 |
Table 3.
Box-Bhenken design for exoglucanase production
| Run No. | X4 | X5 | X7 | Exoglucanase activity | Endoglucanase activity | ||||
|---|---|---|---|---|---|---|---|---|---|
| observed | predicted | residual | observed | predicted | residual | ||||
| 1 | 0.5 | 0.12 | 0.04 | 1.60 | 1.60 | -0.00 | 1.80 | 1.83 | -0.03 |
| 2 | 0.325 | 0.06 | 0.03 | 0.860 | 0.872 | -0.012 | 0.950 | 0.983 | -0.033 |
| 3 | 0.15 | 0.09 | 0.03 | 0.080 | 0.076 | 0.004 | 0.060 | 0.059 | 0.001 |
| 4 | 0.15 | 0.06 | 0.04 | 0.430 | 0.421 | 0.008 | 0.390 | 0.357 | 0.032 |
| 5 | 0.15 | 0.12 | 0.04 | 0.048 | 0.052 | -0.004 | 0.015 | 0.043 | -0.028 |
| 6 | 0.5 | 0.09 | 0.05 | 1.260 | 1.264 | -0.004 | 1.340 | 1.340 | -0.000 |
| 7 | 0.325 | 0.12 | 0.05 | 1.360 | 1.347 | 0.012 | 1.840 | 1.807 | 0.033 |
| 8 | 0.325 | 0.09 | 0.04 | 1.660 | 1.656 | 0.003 | 1.640 | 1.646 | -0.006 |
| 9 | 0.5 | 0.09 | 0.03 | 2.200 | 2.191 | 0.008 | 2.159 | 2.154 | 0.004 |
| 10 | 0.325 | 0.09 | 0.04 | 1.660 | 1.656 | 0.003 | 1.650 | 1.646 | 0.003 |
| 11 | 0.325 | 0.12 | 0.03 | 1.770 | 1.769 | 0.0002 | 2.150 | 2.121 | 0.028 |
| 12 | 0.15 | 0.09 | 0.05 | 1.470 | 1.478 | -0.008 | 1.500 | 1.504 | -0.004 |
| 13 | 0.325 | 0.09 | 0.04 | 1.650 | 1.656 | -0.006 | 1.650 | 1.646 | 0.003 |
| 14 | 0.5 | 0.06 | 0.04 | 0.770 | 0.765 | 0.0042 | 0.530 | 0.501 | 0.028 |
| 15 | 0.325 | 0.06 | 0.05 | 1.770 | 1.770 | -0.000 | 1.900 | 1.928 | -0.028 |
Various cultural parameters such as medium’s initial pH, inoculum size and incubation temperature were also optimized for maximum exoglucanase production by Bacillus cereus in submerged fermentation. Results (Fig. 3) showed that initial medium pH of 9.0 was found most suitable for exoglucanase production in submerged fermentation. Further increase or decrease beyond this level resulted decline in exoglucanase production. Bacillus cereus C9 exhibited maximum cellulase production at incubation temperature of 30 °C in submerged fermentation [26]. Mg et al. [27] reported that bacteria isolated from cow dung and municipal solid waste showed optimized production of cellulase at initial medium pH of 6.0 and incubation temperature of 40 °C.In another study [28] an initial medium pH of 6.5 was optimized through central composite design of response surface methodology for cellulase production by Brevibacillus parabrevis (MTCC 2208). Previous studies reported that initial medium pH of 7.0–7.2 was most favorable for cellulase production by Bacillus sp. in submerged fermentation [29–31].
Fig. 3.
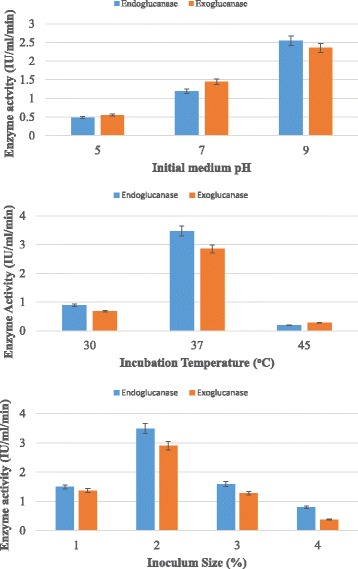
Effect of initial medium pH, temperature and inoculum size on cellulase production by B.cereus in submerged fermentation
In the present study, various inoculum sizes such as 1%, 2%, 3%, 4% and 5% v/v were tested for maximum production of exoglucanase production by Bacillus cereus in submerged fermentation using poplar as substrate. The results (Fig. 3) revealed that inoculum size of 2% (v/v) gave maximum titer of exoglucanase production. Similar findings had also been reported by Shankar and Isaiarasu [32] who documented that 2% inoculum size was best for maximum production of cellulase from Bacillus pumilus EWBCM1.Whereas Afzal et al. [33] reported that 4% v/v inoculum size was best for maximum production of cellulase by B. cereus MRLB1 in submerged fermentation. Ray et al. [34] reported that inoculum size of 3% was best for cellulase production by Bacillus sp. Bacillus subtilis BY-2 isolated from the gut of the Tibetan pig’s intestine gave maximum yield of cellulose production with inoculum size of 4% [35].
Figure 4 depicts the contour plots for exoglucanase production by Bacillus cereus in submerged fermentation showing interaction of variables. In this investigation peptone, yeast extract and MgSO4were found significant for cellulase production in submerged fermentation using Bacillus cereus. Sharma et al. [36] optimized various medium components through response surface methodology and reported that peptone (4.94 g/L), ammonium chloride (4.99 g/L), yeast extract (2.00 g/L),Tween-20 (0.53 g/L), calcium chloride (0.20 g/L) and cobalt chloride (0.60 g/L)were significant components for cellulase production using Bacillus tequilensis S28 in submerged fermentation. Thakkar and Saraf [37] statistically optimized media for cellulase production and reported that importance of MgSO4for maximum cellulase production by Bacillus amyloliquefaciens MBAA3. Ali et al. [38] screened various medium components for cellulase production and reported that peptone (0.846 g/L), yeast extract (2.14 g/L), KH2PO4 (3.05 g/L) and MgSO4.7HO4 (0.405 g/L) were significant through response surface methodology using Cellulomonas fimiNCIM-5015 in submerged fermentation. A previous study also revealed yeast extract as best nitrogen source for cellulase production by B.cereus MRLB1 [33]. Peptone and yeast extract had significant effect on cellulase production in submerged fermentation using Bacillus subtilis [39]. Ammonium sulphate and ammonium hydrogen carbonate was found best nitrogen sources for cellulase production from Bacillus licheniformis APS2 MSU and Bacillus altitudinis APSMSU isolated from the gut of fish Etroplus suratensis [40]. Bacillus aquimaris isolated from the gut of Labeo rohita utilized ammonium sulphate as nitrogen source for the production of endoglucanase in submerged fermentation [21]. Yeast extract and (NH4)2SO4 has been reported as a source of nitrogen for exoglucanase by Aeromonas bestiarum isolated from the gut of Labeo rohita [20].
Fig. 4.
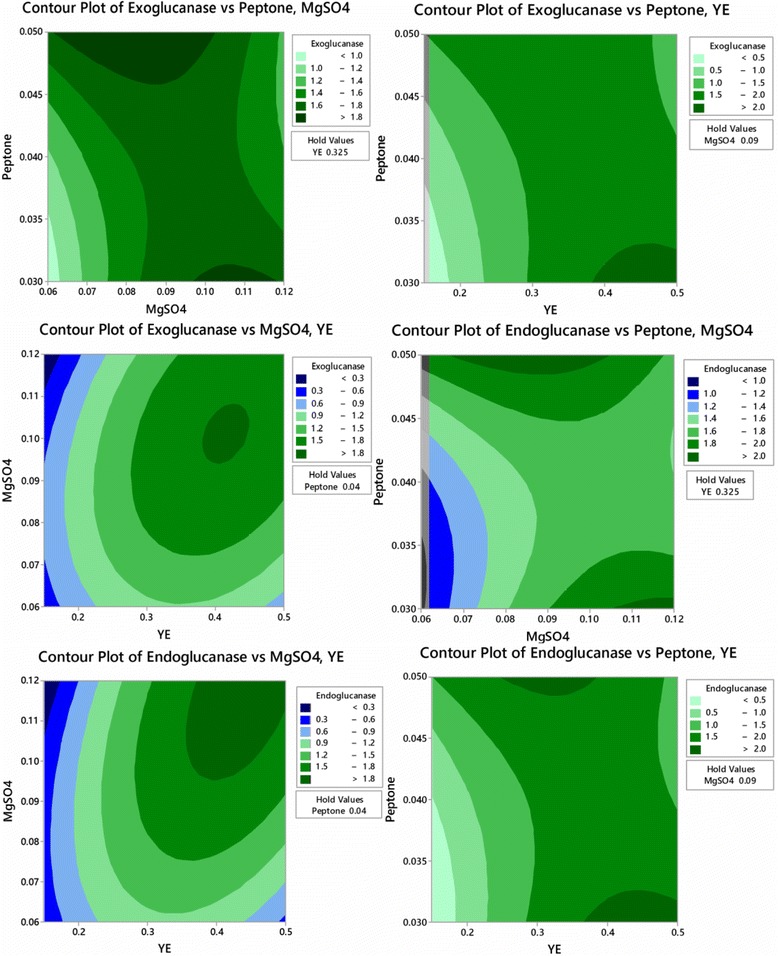
Contour plots of cellulase production from Bacillus cereus in submerged fermentation
All the data obtained through experiments were statistically analyzed by analysis of variance. Significant findings were declared on the basis of high Fischer’s test F-value and low probability P-value. The proposed model was found highly significant having F-values of4391.8 and 544.58 for exoglucanase and endoglucanase respectively as shown in Table 4. Further significance and accuracy of the model was checked by coefficient of determination (R-value) having value of 99.99% and 99.90% for exoglucanase and endoglucanase, respectively (Fig. 5). The adjusted R2 values for exoglucanase and endoglucanase were 99.96% and 99.71%, respectively revealing the goodness of fit of the proposed model. The model results were validated by repeated experimentation as predicted by the optimized values of significant parameters and results obtained were in close agreement with the predicted values of the model (Fig. 6).
Table 4.
Analysis of variance of cellulase production
| Exoglucanase (IU/ml/min) |
Sources | DF | Adj SS | Adj MS | F value | P value |
| Model | 9 | 5.98870 | 0.66541 | 4391.18 | 0.000 | |
| X4 | 1 | 1.80690 | 1.80690 | 11924.11 | 0.000 | |
| X5 | 1 | 0.11234 | 0.11234 | 741.34 | 0.000 | |
| X7 | 1 | 0.11281 | 0.11281 | 744.47 | 0.000 | |
| X42 | 1 | 1.18320 | 1.18320 | 7808.19 | 0.000 | |
| X52 | 1 | 0.52920 | 0.52920 | 3492.31 | 0.000 | |
| X72 | 1 | 0.09680 | 0.09680 | 638.81 | 0.000 | |
| X4X5 | 1 | 0.36724 | 0.36724 | 2423.47 | 0.000 | |
| X4X7 | 1 | 1.35723 | 1.35723 | 8956.61 | 0.000 | |
| X5X7 | 1 | 0.43560 | 0.43560 | 2874.62 | 0.000 | |
| Error | 5 | 0.00076 | 0.00015 | |||
| Lack of fit | 3 | 0.00069 | 0.00023 | 6.91 | 0.129 | |
| Pure error | 2 | 0.00007 | 0.00003 | |||
| Total | 14 | 5.98945 | ||||
| Endoglucanase (IU/ml/min) |
Sources | DF | Adj SS | Adj MS | F value | P value |
| Model | 9 | 7.48850 | 0.83206 | 544.58 | 0.000 | |
| X4 | 1 | 1.86631 | 1.86631 | 1221.50 | 0.000 | |
| X5 | 1 | 0.51765 | 0.51765 | 338.80 | 0.000 | |
| X7 | 1 | 0.19877 | 0.19877 | 130.09 | 0.000 | |
| X42 | 1 | 1.83040 | 1.83040 | 1198.0 | 0.000 | |
| X52 | 1 | 0.24737 | 0.24737 | 161.90 | 0.000 | |
| X72 | 1 | 0.38323 | 0.38323 | 250.82 | 0.000 | |
| X4X5 | 1 | 0.67651 | 0.67651 | 442.77 | 0.000 | |
| X4X7 | 1 | 1.27577 | 1.27577 | 834.99 | 0.000 | |
| X5X7 | 1 | 0.39690 | 0.39690 | 259.77 | 0.000 | |
| Error | 5 | 0.00764 | 0.00153 | |||
| Lack of fit | 3 | 0.00757 | 0.00252 | 75.73 | 0.013 | |
| Pure error | 2 | 0.00007 | 0.00003 | |||
| Total | 14 | 7.49614 |
Fig. 5.
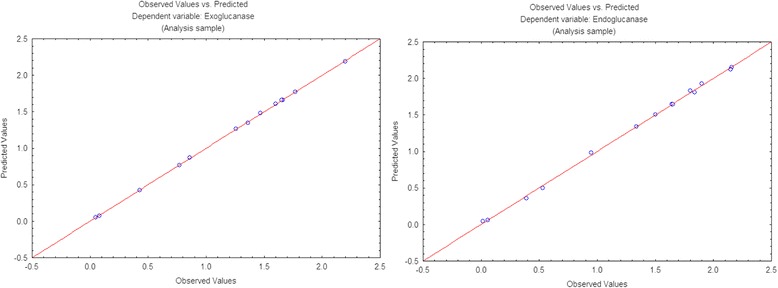
Graph between observed and predicted values
Fig. 6.
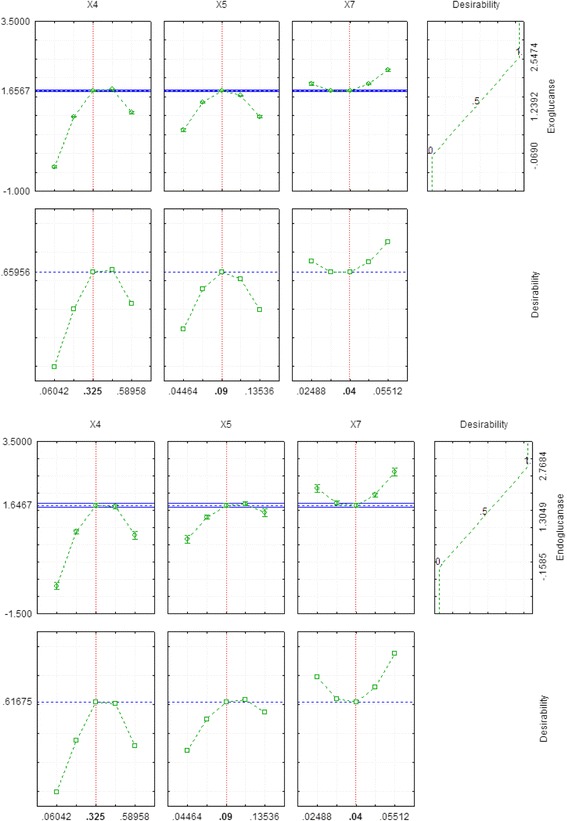
Desirability charts for exoglucanase and endoglucanase production
The cellulase enzyme produced by this strain was checked for saccharification of pretreated poplar biomass. The saccharification experiments were conducted at 50 °C for various time periods to check the optimum time for maximum sugar production. The efficiency of indigenously produced exoglucanase enzyme was compared with commercial cellulase enzyme. Results (Fig. 7) revealed that indigenously produced and commercial cellulase enzyme yielded maximum release of total sugar of 31.42 mg/ml and 41.18 mg/ml after 6 h of incubation at 50 °C using raw poplar biomass respectively. Maximum reducing sugars produced by commercial and indigenously produced cellulase were 3.85 mg/ml and 2.30 mg/ml after 6 h of incubation at 50 °C respectively. The percent hydrolysis calculated for commercial cellulase and indigenously produced cellulase was 19.25% and 11.50% respectively (Fig. 8). In this whole experiment of saccharification, untreated poplar biomass gave better results as compared to pretreated substrates. The low saccharification rate from pretreated biomass might be due to the production of some inhibitory compounds which might had restricted the enzyme action. These results showed that our in house produced cellulase enzyme gave better results suggesting for its potential utilization in saccharification process.
Fig. 7.
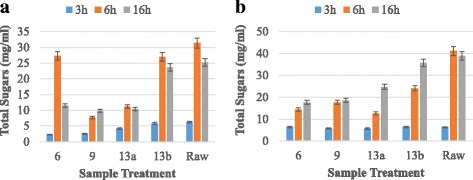
Total sugars produced from hydrolysis of poplar biomass using (a) Indigenous enzyme (b) Commercial enzyme
Fig. 8.
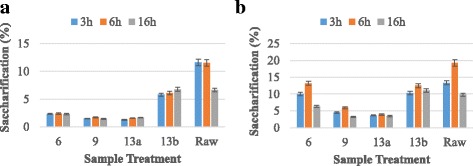
Percent saccharification from poplar biomass using (a) Indigenous enzyme (b) Commercial enzyme.
Conclusion
These results showed that B.cereus (KF625179.1) exhibited cellulolytic potential in submerged fermentation using poplar biomass as substrate. This strain produced maximum cellulase at 0.5% yeast extract, 0.09% MgSO4 and 0.03% peptone which was optimized through response surface methodology. The cellulase enzyme effectively hydrolyzed poplar biomass to sugars. These results suggested the potential utilization of this strain in saccharification purposes especially for bioethanol production from plant biomasses.
Methods
Isolation and molecular identification of bacterium
The bacterial strain was isolated from gut of Labeo rohita [41]. The isolate was identified by 16S rRNA gene sequencing technologyand complete detailed procedure was given in our earlier reports [20, 21]. The sequence obtained was aligned using CLUSTAL W 1.81 [42]. The Phylogenetic tree was constructed by Neighbor-Joining method in MEGA 5.0 (Molecular Evolutionary Genetics Analysis, version 5.0) software [43].
Fermentation methodology
Fermentation experiments were conducted in 250 ml capacity Erlenmeyer flask and the medium ingredients were used per designed from response surface methodology. The pH of the medium was adjusted to 9.0 with 1 N HCl/NaOH before sterilization. The medium components were sterilized at 121 °C, for 15 min and 15 Psi pressure. After sterilization, 2% v/v of the 24 h old vegetative cell culture was raised in nutrient broth transferred aseptically to each of the fermentation flasks. After inoculation, the flasks were incubated at 37 °C with agitation speed of 120 rpm for 24 h. After the termination of the fermentation period, the fermented broth was subjected to centrifugation (Sigma, 2-16PK, Germany) for 10 min at 10,000 rpm and 4 °C for the removal of cell mass and unwanted particles. The clear cell free liquid obtained after centrifugation was used as a crude source of enzyme. Triplicate readings were taken for each of the experiment.
Analytical methods
Exoglucanase activity was estimated as described in an earlier reports [44]. Reaction mixture containing 0.5 ml of enzyme solution and 0.5 ml of 0.05 M citrate buffer pH 5 containing 50 mg of filter paper was incubated at 50 °C for 30 min. After incubation, 1.5 ml of dinitrosalicylic acid (DNS) solution was added to stop the reaction and test tube was boiled for 10 min in a boiling water bath. Absorbance was taken at 540 nm using spectrophotometer (Spectrophotometer Cecil, CE 2042). One unit (U) of enzyme activity was defined as the quantity of enzyme, which release 1 μmol of glucose under standard assay conditions. Endoglucanase activity was measured using sodium carboxymethyl cellulose (Na-CMC) as substrate. Reaction mixture containing 0.5 ml of crude enzyme and 0.5 ml of 1% CMC (0.05 M citrate buffer, pH 5.0) was incubated at 50 °C for 30 min. After incubation, 1.5 ml of dinitrosalicylic acid (DNS) solution was added to stop the reaction and test tube was boiled for 10 min in a boiling water bath. Absorbance of the color developed was taken at 540 nm using the spectrophotometer (Spectrophotometer Cecil, CE 2042). One unit (U) of enzyme activity was defined as the quantity of enzyme, which released 1 μmol of glucose under standard assay conditions. Total sugars were measured by phenol-sulphuric acid method [45] while reducing sugars equivalent to glucose was measured by 3,5-dinitrosalicyclic acid method [46].
Enzymatic hydrolysis of substrate
Hydrolysis experiments was conducted in250 ml Erlenmeyer flask using twenty five millilitersof indigenously produced cellulase enzyme having CMCase activity of 2.20 IU/ml/min and FPase activity of 2.159 IU/ml/min. In parallel, commercial cellulase enzyme having FPU of 250 IU/g in citrate buffer pH 5 was used for saccharification at 50 °C for various time periods. The substrate loading of 2% was used for saccharification. After termination of enzymatic hydrolysis the material was centrifuged at 10,000 rpm for 10 min. The supernatant was removed for sugar analysis. Saccharification (%) was calculated using the following formulae as reported in the earlier report [47].
| 1 |
Experimental design
Plackett–Burman experimental design was used to screen out and evaluate the relative importance of the medium’s different components as twelve runs experiment for exoglucanase production in submerged fermentation. Each variable was designated and used with a high (+) and a low (−) concentration (Table 1). The nutrient factors tested included concentrations of substrate, MgSO4, Yeast Extract, CaCl2, CoCl2, Peptone, KH2PO4 and FeSO4.7H2O. Furthermore, the physical parameters like pH, inoculum size and temperature were optimized through OFAT.
In order to optimize process conditions Box-Behnken design (BBD) was used for cellulase production. The independent variables used were concentrations of yeast extract (X4), MgSO4 (X5) and peptone (X7) and their levels are mentioned in Table 3. This design is most suitable for quadratic response surface and generates second order polynomial regression model. The relation between actual and coded values was described by the following equation.
| 2 |
Where xi and Xi are the coded and actual values of the independent variable, Xo is the actual value of the independent variable at the center point and ΔXi is the change of Xi. The response is calculated from the following equation using STATISTICA software (99th edition).
| 3 |
where Y is the response, k is the number of variables, ß0 is the intercept, Xi and Xj are independent variables, ßi is the ith linear coefficient, ßii is the ith quadratic coefficient and ßij is the interaction coefficient.
Acknowledgements
The authors would like to acknowledge Higher Education Commission Pakistan.
Funding
This project was financially supported by the Higher Education Commission Pakistan as award of Ph.D. scholarship under Indigenous PhD 5000 Fellowship Program Phase-VI. The funding supported all of the research including the design of the study and collection, analysis, and interpretation of data and writing of the manuscript.
Availability of data and materials
The gene sequence data is publically available in NCBI under accession number of KF625172.
Abbreviation
- BBD
Box Bhenken Design
- DNS
Dinitrosalicyclic acid
- RSM
Response surface methodology
Authors’ contributions
Concept, design, and writing of the manuscript: MI, JIQ; data analysis, critical revision and editing of the manuscript: MI, JIQ; contribution toward the development of the protocol: FT and HAS. All authors read and approved the final manuscript.
Ethics approval and consent to participate
The data presented in this paper does not need any ethical approval.
Competing interests
The authors declare that they have no competing interests.
Publisher’s Note
Springer Nature remains neutral with regard to jurisdictional claims in published maps and institutional affiliations.
Contributor Information
Fouzia Tabssum, Email: fouziatabassum66@gmail.com.
Muhammad Irfan, Email: m.irfan@uos.edu.pk.
Hafiz Abdullah Shakir, Email: hashakir@yahoo.com.
Javed Iqbal Qazi, Email: qazi.zool@pu.edu.pk.
References
- 1.Bayer EA, Chanzy H, Lamed R, Shoham Y. Cellulose, cellulases and cellulosomes. Current Opin Struct Biol. 1998;8:548–557. doi: 10.1016/S0959-440X(98)80143-7. [DOI] [PubMed] [Google Scholar]
- 2.Singh A. Engineering enzyme properties. Indian J Microbiol. 1999;39(2):65–77. [Google Scholar]
- 3.Ma L, Yang W, Meng F, Ji S, Xin H, Cao B. Characterization of an acidic cellulase produced by Bacillussubtilis BY-4 isolated from gastrointestinal tract of Tibetan pig. J Taiwan Inst Chem Engin.2015; doi101016/jjtice2015. 04.025.
- 4.Khan JA, Ranjan RK, Rathod V, Gautam P. Deciphering cow dung for cellulase producing bacteria. European J Exper Biol. 2011;1:139–147. [Google Scholar]
- 5.Bhat MK. Cellulases and related enzymes in biotechnology. Biotechnol Adv. 2000;18:355–383. doi: 10.1016/S0734-9750(00)00041-0. [DOI] [PubMed] [Google Scholar]
- 6.Bischoff KM, Rooney AP, Li XL, Liu S, Hughes SR. Purification and characterization of a family 5 endoglucanase from a moderately thermophillic strain of Bacillus licheniformis. Biotechnol Lett. 2006;28:1761–1765. doi: 10.1007/s10529-006-9153-0. [DOI] [PubMed] [Google Scholar]
- 7.Nizamudeen S, Bajaj BK. Thermoalkali tolerant endoglucanase from Bacillus. Food Technol Biotechnol. 2009;47:435–440. [Google Scholar]
- 8.Odeniyi OA, Onilude AA, Ayodele MA. Production Characteristics and properties of endoglucanase/polygalacturonase by a Bacillus coagulans strain from a fermenting palm-fruit industrial residue. African J Microbiol Res. 2009;3:407–417. [Google Scholar]
- 9.Yin LJ, Lin HH, Purification XZR. Characterization of a cellulase from bacillus subtilisYJ1. J. Marine. Sci Technol. 2010;18:466–471. [Google Scholar]
- 10.Ozaki K, Ito S. Purification and properties of an acid endo-1,4-beta-glucanase from Bacillus sp. KSM-330. J Gen Microbiol. 1991;137:41–48. doi: 10.1099/00221287-137-1-41. [DOI] [PubMed] [Google Scholar]
- 11.Bhat M, Bhat S. Endoglucanase degrading enzymes and their potential industrial applications. Biotechnol Adva. 1997;15:583–620. doi: 10.1016/S0734-9750(97)00006-2. [DOI] [PubMed] [Google Scholar]
- 12.Karmakar M, Ray R. Current trends in research and application of microbial cellulases. Res J Microbiol. 2011;6:41–53. doi: 10.3923/jm.2011.41.53. [DOI] [Google Scholar]
- 13.Sivaramakrishnan S, Gangadharan. Edible Oil Cakes. In: A. Pandey, and P.N. Nigam, biotechnology for agro-industrial residues utilization utilisation of agro-residues: springer; 2009. p. 253–73.
- 14.Holker U, Lenz J. Solid-state fermentation—are there any biotechnological advantages? Current Opin Microbiol. 2005;8:301–306. doi: 10.1016/j.mib.2005.04.006. [DOI] [PubMed] [Google Scholar]
- 15.Beg QK, Saxena RK, Gupta R. De-repression and subsequent induction of protease synthesis by Bacillus mojavensis under fed-batch operations. Process Biochem. 2002;37:1103–1109. doi: 10.1016/S0032-9592(01)00320-X. [DOI] [Google Scholar]
- 16.do Nascimento WCA, MLL M. Production and Properties of an extracellular protease from thermophilic Bacillus sp. Brazilian J Microbiol. 2004;35:91–96. doi: 10.1590/S1517-83822004000100015. [DOI] [Google Scholar]
- 17.Bairagi A, Sarkar GK, Sen SK, Ray AK. Enzyme producing bacterial fora isolated from fish digestive tracts. Aquacul Int. 2002;10:109–121. doi: 10.1023/A:1021355406412. [DOI] [Google Scholar]
- 18.Ghosh K, Sen SK, Ray AK. Characterization of Bacilli isolated from the gut of rohu, Labeo rohita, fingerlings and its significance in digestion. J Appl Aquacul. 2002;12:33–42. doi: 10.1300/J028v12n03_04. [DOI] [Google Scholar]
- 19.Mandal S, Ghosh K. Isolation of tannase-producing microbiota from the gastrointestinal tracts of some freshwater fish. J Appl Ichthyol. 2013;29:145–143. doi: 10.1111/j.1439-0426.2012.02054.x. [DOI] [Google Scholar]
- 20.Majeed HS, Irfan M, Shakir HA, Qazi JI. Filter paper activity producing potential of Aeromonas species isolated from the gut of Labeo rohita. Pakistan J Zool. 2016;48(5):1317–1323. [Google Scholar]
- 21.Khalid S, Irfan M, Shakir HA, Qazi JI. Endoglucanase producing potential of Bacillus species isolated from the gut of Labeo rohita. J Marine Sci & Technol. 2017;25(5):581–587. [Google Scholar]
- 22.Balusu R, Paduru RR, Kuravi SK, Seenayya G, Reddy G. Optimization of critical medium components using response surface methodology for ethanol production from cellulosic biomass by Clostridium thermocellum SS19. Process Biochem. 2005;40:3025–3030. doi: 10.1016/j.procbio.2005.02.003. [DOI] [Google Scholar]
- 23.Popa O, Babeanu N, Vamanu A, Vamanu E. The utilization of the response surface methodology for the optimization of cultivation medium and growth parameters in the cultivation of the yeast strain S. cerevisiae 3.20 on ethanol. African J Biotechnol. 2007;6:2700–2707. doi: 10.5897/AJB2007.000-2432. [DOI] [Google Scholar]
- 24.Wang CM, Shyu CL, Ho SP, Chiou SH. Characterization of a novel thermophilic, cellulose-degrading bacterium Paenibacillus sp. strain B39. Lett Appl Microbiol. 2008;47:46–53. doi: 10.1111/j.1472-765X.2008.02385.x. [DOI] [PubMed] [Google Scholar]
- 25.Mei X, Liu R, Shen F, Wu H. Optimization of fermentation conditions for the production of ethanol from stalk juice of sweet sorghum by immobilized yeast using response surface methodology. Energy Fuels. 2009;23:487–491. doi: 10.1021/ef800429u. [DOI] [Google Scholar]
- 26.Yopi RN, Putri FICE, Suparto IH. Optimization of cellulase production from marine bacterium Bacillus cereus C9 by submerged fermentation. Teknologi Indon. 2016;39:15–21. [Google Scholar]
- 27.Mg ZLM, Than WM, Myint M. Study on the cellulase enzyme producing activity of bacteria isolated from manure waste and degrading soil. Int. J. Technical Res Appl2015;3:165–169.
- 28.Singh J, Banal S. Combinative impact of effectors on production of celluololytic enzyme from Brevibacillus parabrevis MTCC 2208. European. J Exp Biol. 2013;3:484–490. [Google Scholar]
- 29.Rastogi G, Muppidi GL, Gurram RN, Adhikari A, Bischoff KM, Hughes SR, Apel WA, Bang SS, Dixon DJ, Isolation SRK. Characterization of cellulose-degrading bacteria from the deep subsurface of the Homestake gold mine, lead, South Dakota, USA. J Ind Microbiol Biotechnol. 2009;36:585–598. doi: 10.1007/s10295-009-0528-9. [DOI] [PubMed] [Google Scholar]
- 30.Deka S, Das P, Sahoo N, Das D, Jawed M, Goyal D. Goyal a. Enhanced cellulase production from Bacillus subtilis by optimizing physical parameters for bioethanol production.ISRN Biotechnol. Article ID. 2013;965310:11. doi: 10.5402/2013/965310. [DOI] [PMC free article] [PubMed] [Google Scholar]
- 31.Bai S, Kumar MR, DJM K, Balashanmugam P, MDB K, Kalaichelvan PT. Cellulase production by Bacillus subtilis isolated from cow dung. Arch. Appl Sci Res. 2012;4:269–279. [Google Scholar]
- 32.Shankar T, Isaiarasu L. Cellulase production by Bacillus pumilus EWBCM1 under varying cultural conditions. Middle-East J Sci Res. 2011;8:40–45. [Google Scholar]
- 33.Afzal I, Shah AA, Makhdum Z, Hameed A, Isolation HF. Characterization of cellulase producing Bacillus cereus MRLB1 from soil. Minerva. Biotechnol. 2012;24:101–109. [Google Scholar]
- 34.Ray AK, Bairagi A, Ghosh S, Sen SK. Optimization of fermentation conditions for cellulase production by Bacillus subtilis cy5 and Bacillus circulans tp3 isolated from fish gut. Acta Ichthyol Et Piscat. 2007;37:47–53. doi: 10.3750/AIP2007.37.1.07. [DOI] [Google Scholar]
- 35.Yang W, Meng F, Peng J, Han P, Fang F, Ma L, Cao B. Isolation and identification of a cellulolytic bacterium from the Tibetanpig's intestine and investigation of its cellulase production. Electron J Biotechnol. 2014;17:262–267. doi: 10.1016/j.ejbt.2014.08.002. [DOI] [Google Scholar]
- 36.Sharma A, Tewari R, Soni SK. Application of statistical approach for optimizing CMCase production by Bacillus tequilensis S28 strain via submerged fermentation using wheat bran as carbon source. Int. J. Biol. Biomol. Agric. Food Biotechnol. Engin.2015;9, .
- 37.Thakkar A, Saraf M. Application of statistically based experimental designs to optimize Cellulase production and identification of gene. Natural Prod Bioprosp. 2014;4:341–351. doi: 10.1007/s13659-014-0046-y. [DOI] [PMC free article] [PubMed] [Google Scholar]
- 38.Ali SBR, Muthuvelayudham R, Viruthagiri T. Enhanced production of cellulase from agro-industrial residues by optimization of medium components using central composite designAsian. J FoodAgro-Ind. 2013;6:113–131. [Google Scholar]
- 39.Li W, Zhang WW, Yang MM, Chen YL. Cloning of the thermostable cellulase gene from newly isolated Bacillus subtilis and its expression in Escherichia coli. Mol Biotechnol. 2008;40:195–201. doi: 10.1007/s12033-008-9079-y. [DOI] [PubMed] [Google Scholar]
- 40.Sreeja SJ, Jeba MPW, Sharmila JFR, Steffi T, Immanuel G, Palavesam A. Optimization of cellulase production by Bacillus altitudinis APSMSU and Bacillus licheniformis APS2 MSU, gut isolates of fish Etroplus suratensis. Int J Adva Res & Technol. 2013;2(4):401–406. [Google Scholar]
- 41.Shakir HA . Enteric bacterial and heavy metals load and health status of fishes from river Ravi, Pakistan. PhD thesis, department of zoology, University of the Punjab. New campus: Lahore; 2013. [Google Scholar]
- 42.Thompson JD, Higgins DG, Gibson TJ. Clustal-W improving the sensitivity of progressive multiple sequence alignment through sequence weighting, position-specific gap penalties and weight matrix choice. Nucleic Acids Res. 1994;22:4673–4680. doi: 10.1093/nar/22.22.4673. [DOI] [PMC free article] [PubMed] [Google Scholar]
- 43.Tamura K, Peterson D, Peterson N, Stecher G, Nei M, Kumar S. MEGA5 molecular evolutionary genetics analysis using maximum likelihood, evolutionary distance and maximum parsimony methods. Mol Biol Evol. 2011;28:2731–2739. doi: 10.1093/molbev/msr121. [DOI] [PMC free article] [PubMed] [Google Scholar]
- 44.Irfan M, Gulsher M, Abbas S, Syed Q, Nadeem M, Baig S. Effect of various pretreatment conditions on enzymatic saccharification. Songklanakarin. J Sci Technol. 2011;33:397–404. [Google Scholar]
- 45.Dubois M, Gilles KA, Hamilton JK, Rebers PA, Smith F. Colorimetric method for determination of sugars and related substances. Anal Chem. 1956;28:350–356. doi: 10.1021/ac60111a017. [DOI] [Google Scholar]
- 46.Miller GL. Use of dinitrosalicylic acid reagent for determination of reducing sugar. Anal Chem. 1959;31:426–428. doi: 10.1021/ac60147a030. [DOI] [Google Scholar]
- 47.Irfan M, Asghar U, Nadeem M, Nelofer R, Syed Q, Shakir HA, Qazi JI. Statistical optimization of saccharification of alkali pretreated wheat straw for bioethanol production. Waste Biomass Valor. 2016;7:1389–1396. doi: 10.1007/s12649-016-9540-2. [DOI] [Google Scholar]
Associated Data
This section collects any data citations, data availability statements, or supplementary materials included in this article.
Data Availability Statement
The gene sequence data is publically available in NCBI under accession number of KF625172.


