Abstract
Multiple sclerosis (MS) is a chronic inflammatory demyelinating and neurodegenerative disease that disproportionately affects young adults, leading to disability and high costs to society. Infiltration of T cells and monocytes into the central nervous system (CNS) is critical for disease initiation and progression. However, despite a great deal of effort the molecular mechanisms by which immune cells initiate and perpetuate CNS damage in MS have not yet been elucidated. In experimental autoimmune encephalomyelitis (EAE), an animal model of MS, granulocyte-macrophage colony-stimulating factor (GM-CSF) produced by pathogenic Th1 and Th17 cells is critical for the recruitment of monocytes into the CNS during the initial stage of disease. We and others have recently shown that, compared with healthy individuals, MS patients have greater numbers of CD4+ and CD8+ T cells that produce GM-CSF. Here, we describe the expression of GM-CSF and its receptor, GM-CSFR, in normal brain and MS lesions. Our data show that in acute and chronic MS lesions, microglia and astrocytes have upregulated expression of GM-CSFR; in addition, we show that GM-CSF-associated molecules are also upregulated in MS lesions. These findings further strengthen the argument that GM-CSF signaling contributes to MS pathogenesis.
Keywords: multiple sclerosis, microglia, astrocytes, GM-CSFR
1. Introduction
Multiple sclerosis (MS) is an inflammatory demyelinating and neurodegenerative disease of the central nervous system (CNS). MS is characterized by infiltration of immune cells into the CNS, where they cause damage to myelin, oligodendrocytes, and axons, as well as neuronal dysfunction(Imitola, Chitnis, & Khoury, 2006). Although the etiology of MS remains elusive, the risk of developing MS is associated with genetic and environmental factors, including allelic variants in over 100 genes(International Multiple Sclerosis Genetics et al., 2011). Environmental factors that increase risk of MS include vitamin D deficiency, Epstein-Barr virus infection early in life, and smoking(Ascherio, 2013). Current views of MS pathogenesis implicate trafficking of T cells into the brain, attracting other immune cells, primarily monocytes, and causing tissue damage. The migration of Leukocytes, including activated lymphocytes, monocytes and macrophages, into the brain is necessary to initiate pathology has been verified in humans by blocking antibody against the molecule VLA-4 (Natalizumab), which is critical for leukocytes migration. Natalizumab significantly decreases infiltration of immune cells into the CNS, leading to reduced disease activity, as shown by the decline in the number of gadolinium-enhancing lesions and improvement in disease activity (Nicholas, Racke, Imitola, & Boster, 2014). Conversely, if this medication is stopped, allowing migration of T cells into the CNS, disease activity invariably returns, with, in some instances, risk of severe exacerbation and progression. This indicates that migration of T cells into the CNS and their interaction with resident cells is critical to the pathological process in MS(Kivisakk et al., 2009). The mechanisms underlying the interaction of immune cells with resident CNS cells that leads to persistent immune activation are not known. It has been suggested that upon entry into the brain, T cells interact with microglia and astrocytes, and recruit monocytes and macrophages that play a critical role in initiating and maintaining an inflammatory environment that causes CNS damage(Frohman, Racke, & Raine, 2006).
The mechanisms of T cell activation and generation of pathological T cells in MS have been elucidated in MS models such as experimental autoimmune encephalomyelitis (EAE). From this work, we have learned that granulocyte-macrophage colony-stimulating factor (GM-CSF) is critical for EAE to develop(El-Behi et al., 2011), in fact a recently described mouse model, where T cells were engineered to release GM-CSF led to invasion of inflammatory myeloid cells of the brain which was accompanied by the spontaneous development of severe neurological deficits(Spath et al., 2017).
GM-CSF is a pro-inflammatory cytokine essential for the development and progression of EAE. In EAE, monocytes infiltrate the CNS in large numbers and are critical in mediating pathogenesis by GM-CSF-producing T cells. We have recently shown than GM-CSF production by T cells is elevated in patients with MS, and that interferon-β, an approved MS medication, can reduce the production of GM-CSF in these cells(Rasouli et al., 2015).
In this study, we investigated the expression of GM-CSF receptor (GM-CSFR) in normal-appearing white matter (NAWM) and brain lesions of MS patients by gene expression analysis and immunohistochemistry. We found that both GM-CSFR subunits alpha (α) and beta (β) are highly expressed in the borders of active lesions compared with chronic lesions, NAWM and controls. Cell morphology and surface markers identified activated microglia/macrophages and astrocytes as GM-CSFR-expressing cells in MS lesions.
2. Materials and Methods
2.1 Brain tissue
Human brain tissues were obtained from the Rocky Mountain MS Center (RMMSC). Four specimens from patients with MS (two with active and two with chronic disease) and two specimens from individuals without neurological disease (controls) were investigated in this study. Clinical features are summarized in Table 1. Information about the nature of activity of the MS lesions, was obtained from the autopsy reports. Patients with active disease had MS plaques that were described as active or reactivated inflammation with predominant perivascular inflammation. Patients with chronic disease had lesions that were inactive without perivascular inflammation. In addition to the reports by the pathologist, we examined the MS plaques for inflammation and demyelination using haematoxylin & eosin staining (HE) and luxol-fast blue staining (LFB), respectively. Active lesions were characterized by areas of demyelination, perivascular inflammation with infiltration of lymphocytes and macrophages into the demyelinated areas and in their borders. Chronic inactive lesions were characterized by the lack of inflammatory infiltrates or microglial activation. We also studied normal appearing white matter (NAWM) adjacent to the MS lesions(Lassmann, Raine, Antel, & Prineas, 1998).
Table 1.
Patient demographics and disease activity in MS tissues
| Age at death | Sex | Type of lesion autopsy description | Disease duration | Clinical severity as per autopsy report |
|---|---|---|---|---|
| 43 | M | Extensive severe demyelination with chronic active smoldering lesions, moderate atrophy. | 15 years | Severe disease |
| 37 | M | Active extensive severe demyelination involving much of the supratentorial white matter, severe perivascular lymphocytosis and macrophages in the edge of the plaque with reactivation, minimal atrophy. | 6 years | Severe disease clinically active at time of dead |
| 87 | F | Chronic inactive plaques, no perivascular lymphocytes, mild cerebral atrophy | n/a | Chronic |
| 61 | F | Chronic inactive plaques, no perivascular lymphocytes, mild cerebral atrophy | n/a | Chronic |
| 45 | F | Control | - | - |
| 89 | M | Control | - | - |
2.2 Immunohistochemistry and Confocal microscopy
To identify GM-CSFR expression by different cell populations, macroscopic lesions from MS brains were identified; the lesions were demarcated by visual inspection and carefully dissected, catalogued and kept at −80°C until further use. The dissected tissue was cut in cryostat into 25 μm sections and stored on slides at −80°C until staining. Slides were fixed in acetone for 5 min; histological staining with HE and LFB was done according to routine protocols (Y. Li et al., 2007). The sections were next immunostained with anti-GM-CSFR Abs after an initial blockade with horse serum to avoid nonspecific staining. To examine the expression of GM-CSFRα subunit, two specific Abs (clone C18, rabbit Polyclonal IgG at 1:100 from Santa Cruz Biotechnology for co-staining with GFAP and CD68. To confirm the staining and upregulation, we used clone K12B7.17A at 1:100 from Abcam). To stain microglia/macrophages we used an Ab against CD68 (clone Y1/82A, Mouse monoclonal IgG), for astrocytes we used anti-GFAP Ab (Clone 4A-11, Mouse monoclonal IgG) both from BD/Pharmingen. Isotype-matched Abs were used as control. After washing in PBS, sections were incubated with primary Abs for 1 h at room temperature or overnight at 4°C. The sections were then incubated with blocking solution and with secondary Abs, Alexa Fluor 546-labelled donkey anti-rabbit and donkey anti-mouse Abs (both from Invitrogen, CA, USA). Negative controls omitting the first, then the second, primary Ab, as well as isotype control, were included in all the double-labeling experiments. The sections were then washed in phosphate-buffered saline (PBS), mounted in anti-fading mounting media and observed with a Zeiss Confocal LSM 510 microscope.
To study the expression of GM-CSFR, we used Quantitative Confocal Microscopy (QCM) methods with high resolution combined with stereology, as in our prior experiments(Imitola et al., 2011; Kivisakk et al., 2009; Pluchino et al., 2008; Rasmussen et al., 2011; Wang, Imitola, Rasmussen, O’Connor, & Khoury, 2008). Acquisition parameters for confocal microscopy were established for all experiments relative to negative control that was always included to control for non-specific staining. We used 2.5D pixel intensity analysis to determine the relative expression of GM-CSFR in a given microglia or astrocyte cell. We then used line pixel intensity to determine the expression of GM-CSFR on the surface and the processes of microglia and astrocytes (Starossom et al., 2012). Finally, we determined co-localization of GM-CSFR with orthogonal planes and a co-localization index that allows measurement of individual channels with high signal-to-noise ratio, without unspecific co-labeling.
2.3 RNA extraction and real-time PCR assay
Total RNA was extracted from cells or tissues with RNeasy Mini Kit (Qiagen, Valencia, California, USA), followed by reverse transcription with Superscript III (Invitrogen) according to the manufacturer’s protocol. Taqman real-time PCR was performed with Taqman Fast Universal PCR Master Mix (Applied Biosystems, Foster City, California, USA) on ABI 7500 system (Applied Biosystems). Primers and probes sets for human STAT5B, CEPBA, and GMCSFR were obtained from Applied Biosystems.
2.4 Human microglia isolation
The studies on human microglia were performed in accordance with the guidelines of the Thomas Jefferson University Hospital Institutional Review Board. Microglial cells were isolated from brain tissue of patients undergoing temporal lobe resection for epilepsy. In addition, we used the human microglia cell line HMG from Clonexpress Company (Gaithersburg, MD, USA). For tissue microglia purification, primary cultures of human CNS cells were prepared by digestion with collagenase; mixed glial cultures were plated immediately in culture medium containing DMEM with 10% FBS and allowed to grow for a week. At this time, microglia-enriched populations were obtained by removal of floating cells and cells that readily dislodged by shaking. Microglia were re-plated at 5 × 10⁵ cells/ml in DMEM with 10% FBS to expand the culture; the cells were cultured for another seven days and detached using trypsin (0.25%) and DNase (50 μg/ml). For immunohistochemistry, low density culture of microglia with 95% purity was stained with Abs against GM-CSFR and GFAP, as described above. We also used CD11b microbeads (Miltenyi Biotec, Germany) to prepare highly purified cultures of microglia.
2.5 Statistical Analysis
The comparisons of cell percentages are presented as mean ±SD. We used unpaired t-test with Welch’s correction for statistical analysis of percentage data and expression profiles, and Mann-Whitney test for fold difference data. Data were analyzed using Prism 6.0.
3. Results
3.1 Expression of GM-CSFR and its signaling genes is increased in MS lesions
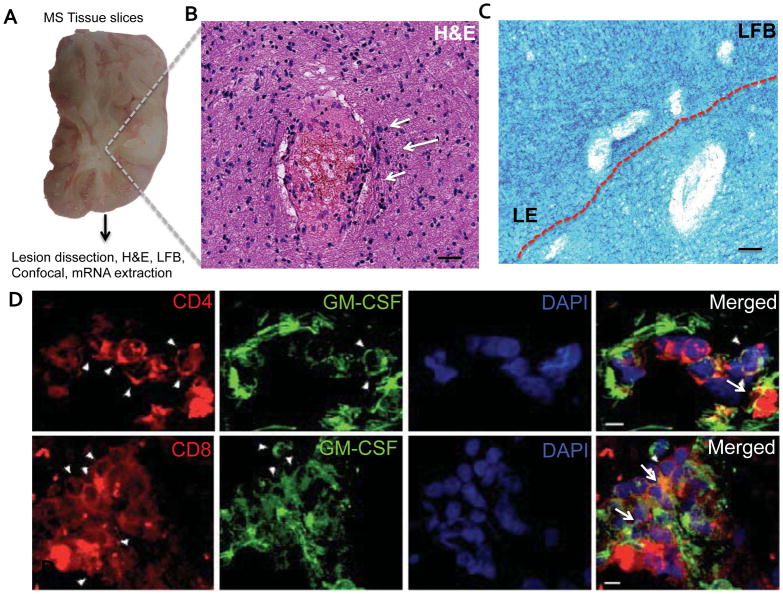
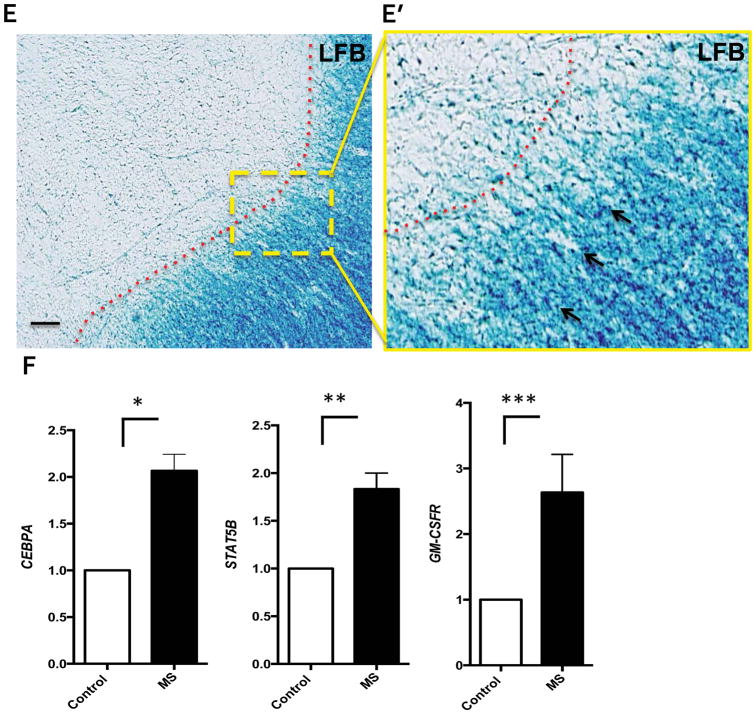
We have recently shown that MS patients have increased numbers of GM-CSF-expressing T cells in their peripheral blood compared with healthy controls, (Rasouli et al., 2015) suggesting that GM-CSF may be relevant for disease pathology. To characterize GM-CSFR expression in the CNS of MS patients, we obtained brain samples from MS patients and dissected MS lesions. Ten brain lesions were collected and cryopreserved, and four lesions per patient with macroscopic areas of demyelination were further analyzed (Table 1). Lesions were micro-dissected and inspected by microscopy after LFB and HE staining, which revealed demyelination, with pale core and distinct lesion border (LE) (Figure 1A–C); demyelinated lesions contained myelin debris and macrophages in the surrounding white matter, indicating an active lesion(Rasouli et al., 2015). We have shown previously that T cells in MS lesions express GM-CSF(Rasouli et al., 2015); to identify areas of the brain with co-localized expression of GM-CSF and GM-CSFR, we analyzed additional samples for the expression of GM-CSF in T cells. We found that substantial numbers of CD4+ and CD8+ T cells express GM-CSF in active lesions (Figure 1D). Next, using the same brains, we analyzed the presence of GM-CSFR mRNA in brain sections of MS and control brain by qPCR. We focused on lesions with clear and extensive demyelination (Figure 1E). These lesions were dissected and mRNA was extracted to examine the expression of genes whose function is activated by GM-CSF signaling in myeloid cells, including GM-CSFR, STAT5B and CEPBA(Liva, Kahn, Dopp, & de Vellis, 1999). Our results show a statistical significant increase in the expression of GM-CSFR and downstream molecules STAT5B and CEPBA compared to normal control (Figure 1F). These findings suggest an upregulation of GM-CSF-related molecules involved in survival of microglia, at the mRNA level in MS plaques compared to controls.
Figure 1. Increased GM-CSFR gene expression in MS lesions.
A) Photograph of a typical slice of MS brain tissue used in this study. B) H&E staining of MS lesion showing cellular infiltrates (arrows) and high cellularity. C) Perivenular demyelination and increased cellularity representing the active border of a MS lesion used for this study. Scale bars = 20 μm. D) CD4+ and CD8+ T cells were stained for GM-CSF and analyzed by confocal microscopy (arrows). Merged images show co-localization of GM-CSF and CD4+ and CD8+ T cells. Scale bars = 5 μm. E) Typical lesion used for GM-CSFR gene expression analysis showed areas of extensive demyelination and increased cellularity in E′ (arrows). Scale bars = 20 μm. F) Representative results of increased expression of GM-CSF-related molecules GM-CSFR, CEBPA, and STAT5B in acute MS lesions. P values * P<0.005 ** P<0.01*** P<0.05 by unpaired T-test.
3.2 Increased GM-CSFR immunoreactivity in MS lesions
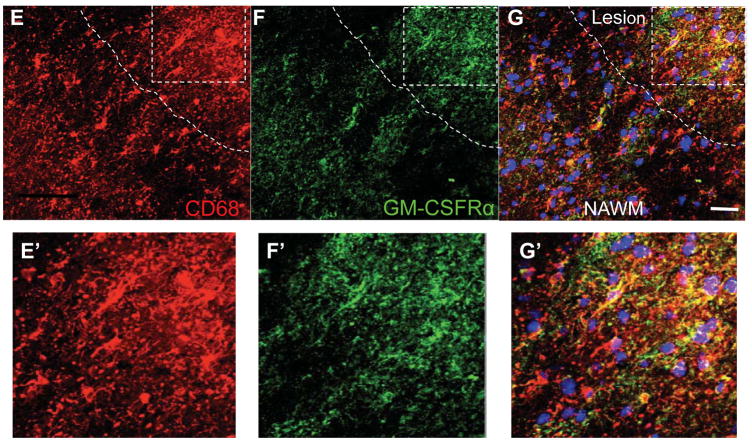
Having shown that GM-CSFR gene expression was upregulated in MS lesions, we next studied cell distribution of GM-CSFR on activated microglia (CD69+) and macrophages in these lesions using immunohistochemistry. We found limited GM-CSFR and microglial immunoreactivity within the normal brain in comparison to MS lesions (Figure 2A,B). In active MS lesions, CD68+ cells with elongated processes expressed GM-CSFR, that show intense colocalization (Figure 2B) and confocal quantification revealed increased expression of CD68 in individual cells in the MS brain compared to the control brain (Figure 2C,D). In MS tissues, CD68+ cells were found in the parenchyma and exhibited morphology of activated process-bearing microglia mainly distributed in the active lesion border and its core (Figure 2E–G). GM-CSFR+ cells were scattered within the lesion border and center more than in the NAWM, and also morphologically appeared as activated process-bearing microglia. In addition, we observed perivascular CD68+ cells expressing GM-CSFR in MS tissue from a patient with active disease (Figure 2H–K).
Figure 2. Increased expression of GM-CSFR-α in MS lesions.
A) Expression of GM-CSFR in microglia in control brain B) Microglia in acute MS lesions exhibit activated phenotype with increased GM-CSFRα staining. C, D) Representative quantification by confocal microscopy showing increased expression of GM-CSFRα. E, F, G) Expression of GM-CSFRα in a typical MS lesion and NAWM. E′F′G) Magnification of the lesion showing co-localization of GM-CSFRα and CD68. H–K) Expression of GM-CSFRα in CD68+ perivenular infiltrates. Silhouette represents venular lumen (white lines); note the gradient of expression of GM-CSFRα from the perivenular area toward surrounding tissue, Scale bars = 50 μm.
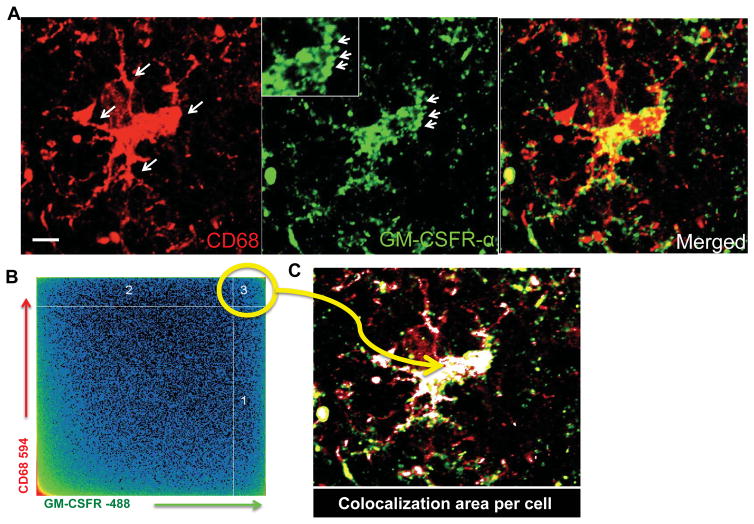
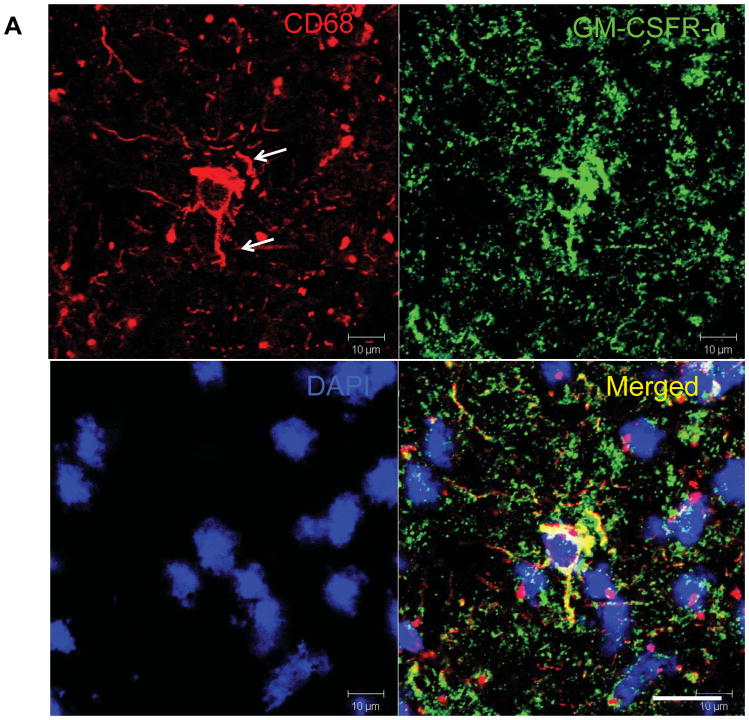
We performed a quantitative confocal co-localization (QCM) and maximal fluorescent intensity (MFI) analysis to determine the expression of GM-CSFR by individual cells. The co-localization analysis allows for precise measurements of immunohistochemically visualized proteins by confocal microscopy. We selected areas of maximal pixel intensity indicating the proximity of two molecules in a given cell, automatically highlighted by software co-localization parameters, to avoid noise (Figure 3A–C). This analysis revealed upregulation of GM-CSFR in the body and processes of microglia in MS lesions (Figure 3 insert). Followed by stereology quantification of the lesions, by quantifying the number of microglia expressing GM-CSFR in active lesions, we determined that the borders of active and chronic lesions had increased levels of GM-CSFR compared to NAWM, both by quantification of the number of GM-CSFR+ cells and the maximum pixel intensity (MFI) for individual cells (Figure 3D–G and 4C). In the chronic active lesions, microglia were less activated and remained positive for GM-CSFR albeit with less robust expression than in the acute lesions (Figure 4A–B). We therefore concluded that activated microglia/macrophages express GM-CSFR in both active and chronic active lesions compared to control and NAWM.
Figure 3. Quantification of GM-CSFR expression in MS lesions.
A) High resolution image of CD68+ microglia cells expressing GM-CSFRα; note pockets of GM-CSFR in microglia processes. B) Two-dimensional plot of pixels from CD68 and GM-CSFR expression in a typical activated microglia used to quantify expression and co-localization of GM-CSFRα. C) Areas of high co-localization of both GM-CSFRα and CD68 are shown as white merged profile demonstrating that the body and processes of activated microglia harbor GM-CSFRα. D) Pixel intensity in microglia that highly express GM-CSFR and those that do not express GM-CSFRα in E. F) Representative individual microglia expressing GM-CSFR compared to negative microglia in G.
Figure 4. Expression of GM-CSFR by microglia in chronic MS brain lesions.
A Chronic lesions also contained activated microglia, however, with reduced processes compared with acute lesions, where microglia had hypertrophic processes. GM-CSFRα remains expressed in the body as well as the processes of microglia, as demonstrated in the merged picture and the Z-stack in B. C) Quantification of GM-CSFRα expression in control brain tissue, NAWM, active and chronic lesions border. p<0.0001 by ANOVA. Acute vs. Control, p< 0.001, Chronic vs. Control p<0.01, NS vs. NAWM non-significant. Scale bars = 20 μm.
3.3 Expression of GM-CSFR by microglia isolated from human brains
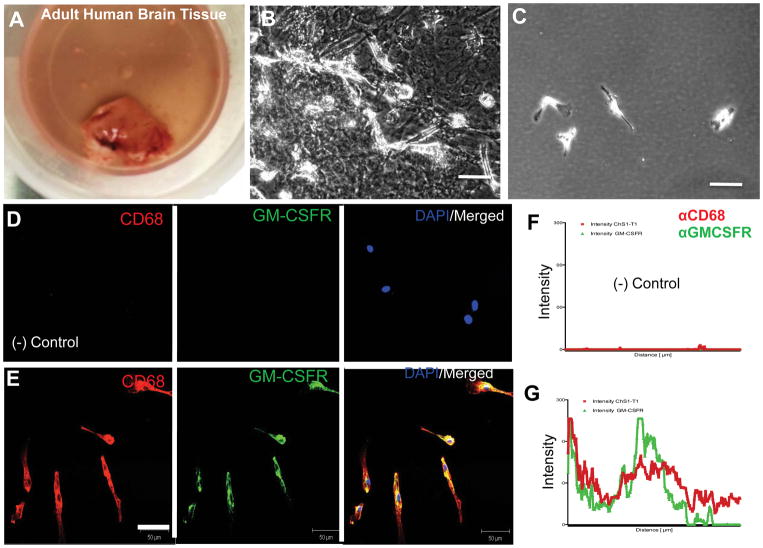
To confirm that human macrophages and microglia express GM-CSFR, we isolated microglia from brains of patients undergoing temporal lobe resection. Tissues were processed as described in Materials and Methods and confluent cultures were used for microglia purification. The purified microglia did not contain GFAP+ cells (not shown); they expressed GM-CSFR as shown in (Figure 5) and they exhibited the typical morphology of microglia. In addition, we obtained similar results using a human microglia cell line (HMG), confirming these findings (not shown).
Figure 5. Expression of GM-CSFRα in microglia isolated from brain tissue.
A) Representative image of tissue specimen from temporal lobe used to isolate human microglia. B) Typical adherent mixed glial cultures before purification. C) Typical microglia cells plated at low density after purification. D–E) Expression of GM-CSFRα by confocal microscopy of human microglia showing typical staining for CD68 and GM-CSFRα. F–G) Quantification of GM-CSFRα expression in microglia by pixel intensity compared to negative controls. Scale bars = 20 μm.
3.4 Increased expression of GM-CSFR in astrocytes in MS lesions
To determine the expression of GM-CSFR in astrocytes, we examined the co-localization of GM-CSFR and GFAP, a marker for astrocytes. Double immunofluorescence staining revealed that GM-CSFR was highly expressed in astrocytes in the lesion core, which had a robust and hypertrophic body compared to astrocytes in the NAWM (Figure 6A–B). Confocal pixel intensity analysis revealed significant increases in GM-CSFR in the lesions, compared to the NAWM (Figure 6C–D). In astrocytes, GM-CSFR was expressed in a punctate pattern in the body and the processes, similarly to microglia, but with less intensity (Figure 6E–F). These data demonstrate that in MS lesions, astrocytes express GM-CSFR, albeit in lower numbers compared to the profound increase that we observed in microglia.
Figure 6. Expression of GM-CSFRα by astrocytes in MS lesions.
A) Low magnification of GM-CSFRα in GFAP+ cells; there is increased expression in astrocytes in lesions. B) Astrocytes in the lesion border express more GM-CSFRα than astrocytes in the NAWM. C and D) Individual quantification of GM-CSFRα expression by astrocytes in lesion core and border and border compared to NAWM. E,F) Co-localization of GM-CSFRα in pockets of protein expression in the body and processes of astrocytes (arrows). Scale bars = 50 μm, 10 μm in E.
4. Discussion
We and others have recently found that MS patients have greater numbers of GM-CSF-producing CD4+ and CD8+ T cells (Rasouli et al., 2015), suggesting that GM-CSF contributes to disease pathogenesis. In this study, we confirmed the expression of GM-CSF in CD4+ and CD8+ T cells in MS lesions by examining additional MS brains. More importantly, we extended these findings by characterizing GM-CSFR expression in activated microglia/macrophages and astrocytes. This study strengthens the notion that GM-CSFR/GM-CSF signaling is associated with MS pathogenesis.
GM-CSF is crucial for encephalitogenicity of both Th1 and Th17 cells, and is necessary for development of EAE.(El-Behi et al., 2011) The GM-CSFR is a heterodimer composed of a specific ligand-binding subunit (GM-CSFRα) for GM-CSF and a common signal-transduction subunit (GM-CSFRβ) shared with the receptors for IL-3 and IL-5. In this work, we focused on the alpha subunit of the GM-CSFR that confers specificity to GM-CSF, however, we also observed the expression of GM-CSFRβ in MS lesions (not shown)
This study suggests that acute and chronic MS lesions exhibit increased expression of GM-CSFR on astrocytes and microglia, cells that are implicated in disease progression. Although its expression is greater in acute plaques, there is still above normal expression in chronic plaques, which may contribute to the activated glia phenotype in MS(Kutzelnigg et al., 2005; Mayo et al., 2014).
It has been suggested that expression of GM-CSFR in microglia and astrocytes is not relevant in a mouse model of MS, since the lack of GM-CSFR in these cells did not impair development of acute EAE (Croxford, Lanzinger, et al., 2015; Croxford, Spath, & Becher, 2015). However, the role of GM-CSFR in CNS resident cells in the chronic phase of EAE has not been studied. Given that during chronic phase there is a substantial decrease in numbers of peripheral myeloid cells in the CNS compared with acute phase, it is possible that GM-CSFR signaling in CNS resident cells becomes more important during chronic phase. Hence, it is possible that during the course of EAE the relevance of GM-CSFR signaling shifts from peripheral to CNS cells.
The role of GM-CSF signaling in human brain cells in MS is not known and may be quite different from that in mouse. These differences are delineated by recent work showing that in humans GM-CSF production by T cells is strongly increased by IL-2, and polymorphisms in the IL-2 receptor gene, IL2RA, is a genetic risk factor for MS. This genetic variant controls the responsiveness of Th cells and their development toward GM-CSF-producing memory T cells(Hartmann et al., 2014). Furthermore, we previously demonstrated that IFN-β decreases the production of GM-CSF in T cells(Rasouli et al., 2015) and the expression of CCL2 and IL-8 in CD14+ monocytes(Comabella, Imitola, Weiner, & Khoury, 2002). This may decrease the migration of monocytes to the human brain, since GM-CSF regulates the migration of monocytes and the levels of the monocyte chemokine CCL2 (Vogel et al., 2015). These data suggest that mouse and human GM-CSF signaling may not be biologically equivalent.
The translational potential of our findings are bolstered by recent findings in animal models and in MS tissue research, for instance inhibition of GM-CSF receptor alpha at peak of chronic experimental autoimmune encephalomyelitis (EAE) resulted in decrease disease progression and in the relapsing-remitting-EAE model prevented disease relapses and inhibited the activation of T cell, dendritic cells and inflammatory monocytes(Ifergan et al., 2017). These results were seen in a different model of EAE, where GM-CSF was critical to promote neutrophil accumulation in the brain (Pierson & Goverman, 2017). Notably, recent data from MS tissue suggest that >50% of the innate immune cells in active lesions were derived from infiltrating monocytes acquiring a microglia/macrophage phenotype (Zrzavy et al., 2017), suggesting that the activation of GM-CSFR in resident microglia or migrating innate immune cells is critical for MS pathology in humans. In patients with progressive MS, especially secondary progressive MS there was an extensive recruitment of GM-CSF Rα+ myeloid cells (Ifergan et al., 2017), furthermore human memory B cells producing GM-CSF are increased in frequency and they are more activated in multiple sclerosis (MS) patients compared to controls(R. Li et al., 2015). Taking together our data and results from progressive MS show that patients may benefit from targeting GM-CSF receptor (Ifergan et al., 2017).
In summary, our data demonstrate that a number of CD4+ and CD8+ T cells in MS lesions express GM-CSF, and that activated microglia and astrocytes in MS lesions have increased expression of GM-CSFR, suggesting that the GM-CSF/GM-CSFR pathway contributes to pathogenesis during acute and chronic MS.
Supplementary Material
Acknowledgments
We thank the Rocky Mountain Multiple Sclerosis Center Tissue Bank for providing MS brain tissue.
FUNDING
This effort was supported by Thomas Jefferson Funds to AR, and in part by the OSUMS Center Fund # 311360 fund to J.I.
Footnotes
POTENTIAL CONFLICTS OF INTEREST
The authors have no financial conflicts of interest.
Author Contributions:
J.I: Concept and design, collection and assembly of data, data analysis and interpretation, manuscript writing, financial support.
J.R: collection and assembly of data, data analysis and interpretation
K.M: collection and assembly of data, data analysis and interpretation
F.W: collection and assembly of data, data analysis and interpretation
B.C: collection and assembly of data, data analysis and interpretation, manuscript writing
A.S: obtaining critical reagents, data analysis and interpretation
G-X.Z: collection and assembly of data, data analysis and interpretation
A.R: Concept and design, financial support, data analysis and interpretation, approval of manuscript
References
- Ascherio A. Environmental factors in multiple sclerosis. Expert Rev Neurother. 2013;13(12 Suppl):3–9. doi: 10.1586/14737175.2013.865866. [DOI] [PubMed] [Google Scholar]
- Comabella M, Imitola J, Weiner HL, Khoury SJ. Interferon-beta treatment alters peripheral blood monocytes chemokine production in MS patients. Journal of neuroimmunology. 2002;126(1–2):205–212. doi: 10.1016/s0165-5728(02)00064-4. [DOI] [PubMed] [Google Scholar]
- Croxford AL, Lanzinger M, Hartmann FJ, Schreiner B, Mair F, Pelczar P, … Becher B. The Cytokine GM-CSF Drives the Inflammatory Signature of CCR2+ Monocytes and Licenses Autoimmunity. Immunity. 2015;43(3):502–514. doi: 10.1016/j.immuni.2015.08.010. [DOI] [PubMed] [Google Scholar]
- Croxford AL, Spath S, Becher B. GM-CSF in Neuroinflammation: Licensing Myeloid Cells for Tissue Damage. Trends Immunol. 2015;36(10):651–662. doi: 10.1016/j.it.2015.08.004. [DOI] [PubMed] [Google Scholar]
- El-Behi M, Ciric B, Dai H, Yan Y, Cullimore M, Safavi F, … Rostami A. The encephalitogenicity of T(H)17 cells is dependent on IL-1- and IL-23-induced production of the cytokine GM-CSF. Nat Immunol. 2011;12(6):568–575. doi: 10.1038/ni.2031. [DOI] [PMC free article] [PubMed] [Google Scholar]
- Frohman EM, Racke MK, Raine CS. Multiple sclerosis--the plaque and its pathogenesis. N Engl J Med. 2006;354(9):942–955. doi: 10.1056/NEJMra052130. [DOI] [PubMed] [Google Scholar]
- Hartmann FJ, Khademi M, Aram J, Ammann S, Kockum I, Constantinescu C, … Becher B. Multiple sclerosis-associated IL2RA polymorphism controls GM-CSF production in human TH cells. Nature communications. 2014;5:5056. doi: 10.1038/ncomms6056. [DOI] [PubMed] [Google Scholar]
- Ifergan I, Davidson TS, Kebir H, Xu D, Palacios-Macapagal D, Cann J, … Miller SD. Targeting the GM-CSF receptor for the treatment of CNS autoimmunity. J Autoimmun. 2017 doi: 10.1016/j.jaut.2017.06.005. [DOI] [PMC free article] [PubMed] [Google Scholar]
- Imitola J, Chitnis T, Khoury SJ. Insights into the molecular pathogenesis of progression in multiple sclerosis: potential implications for future therapies. Archives of neurology. 2006;63(1):25–33. doi: 10.1001/archneur.63.1.25. [DOI] [PubMed] [Google Scholar]
- Imitola J, Cote D, Rasmussen S, Xie XS, Liu Y, Chitnis T, … Khoury SJ. Multimodal coherent anti-Stokes Raman scattering microscopy reveals microglia-associated myelin and axonal dysfunction in multiple sclerosis-like lesions in mice. J Biomed Opt. 2011;16(2):021109. doi: 10.1117/1.3533312. [DOI] [PMC free article] [PubMed] [Google Scholar]
- International Multiple Sclerosis Genetics C, Wellcome Trust Case Control C. Sawcer S, Hellenthal G, Pirinen M, Spencer CC, … Compston A. Genetic risk and a primary role for cell-mediated immune mechanisms in multiple sclerosis. Nature. 2011;476(7359):214–219. doi: 10.1038/nature10251. [DOI] [PMC free article] [PubMed] [Google Scholar]
- Kivisakk P, Imitola J, Rasmussen S, Elyaman W, Zhu B, Ransohoff RM, Khoury SJ. Localizing central nervous system immune surveillance: meningeal antigen-presenting cells activate T cells during experimental autoimmune encephalomyelitis. Annals of neurology. 2009;65(4):457–469. doi: 10.1002/ana.21379. [DOI] [PMC free article] [PubMed] [Google Scholar]
- Kutzelnigg A, Lucchinetti CF, Stadelmann C, Bruck W, Rauschka H, Bergmann M, … Lassmann H. Cortical demyelination and diffuse white matter injury in multiple sclerosis. Brain : a journal of neurology. 2005;128(Pt 11):2705–2712. doi: 10.1093/brain/awh641. [DOI] [PubMed] [Google Scholar]
- Lassmann H, Raine CS, Antel J, Prineas JW. Immunopathology of multiple sclerosis: report on an international meeting held at the Institute of Neurology of the University of Vienna. Journal of neuroimmunology. 1998;86(2):213–217. doi: 10.1016/s0165-5728(98)00031-9. [DOI] [PubMed] [Google Scholar]
- Li R, Rezk A, Miyazaki Y, Hilgenberg E, Touil H, Shen P Canadian BciMST. Proinflammatory GM-CSF-producing B cells in multiple sclerosis and B cell depletion therapy. Sci Transl Med. 2015;7(310):310ra166. doi: 10.1126/scitranslmed.aab4176. [DOI] [PubMed] [Google Scholar]
- Li Y, Chu N, Hu A, Gran B, Rostami A, Zhang GX. Increased IL-23p19 expression in multiple sclerosis lesions and its induction in microglia. Brain. 2007;130(Pt 2):490–501. doi: 10.1093/brain/awl273. [DOI] [PubMed] [Google Scholar]
- Liva SM, Kahn MA, Dopp JM, de Vellis J. Signal transduction pathways induced by GM-CSF in microglia: significance in the control of proliferation. Glia. 1999;26(4):344–352. doi: 10.1002/(sici)1098-1136(199906)26:4<344::aid-glia8>3.0.co;2-l. [DOI] [PubMed] [Google Scholar]
- Mayo L, Trauger SA, Blain M, Nadeau M, Patel B, Alvarez JI, … Quintana FJ. Regulation of astrocyte activation by glycolipids drives chronic CNS inflammation. Nature medicine. 2014;20(10):1147–1156. doi: 10.1038/nm.3681. [DOI] [PMC free article] [PubMed] [Google Scholar]
- Nicholas JA, Racke MK, Imitola J, Boster AL. First-line natalizumab in multiple sclerosis: rationale, patient selection, benefits and risks. Ther Adv Chronic Dis. 2014;5(2):62–68. doi: 10.1177/2040622313514790. [DOI] [PMC free article] [PubMed] [Google Scholar]
- Pierson ER, Goverman JM. GM-CSF is not essential for experimental autoimmune encephalomyelitis but promotes brain-targeted disease. JCI Insight. 2017;2(7):e92362. doi: 10.1172/jci.insight.92362. [DOI] [PMC free article] [PubMed] [Google Scholar]
- Pluchino S, Muzio L, Imitola J, Deleidi M, Alfaro-Cervello C, Salani G, … Martino G. Persistent inflammation alters the function of the endogenous brain stem cell compartment. Brain : a journal of neurology. 2008;131(Pt 10):2564–2578. doi: 10.1093/brain/awn198. [DOI] [PMC free article] [PubMed] [Google Scholar]
- Rasmussen S, Imitola J, Ayuso-Sacido A, Wang Y, Starossom SC, Kivisakk P, … Khoury SJ. Reversible neural stem cell niche dysfunction in a model of multiple sclerosis. Annals of neurology. 2011;69(5):878–891. doi: 10.1002/ana.22299. [DOI] [PMC free article] [PubMed] [Google Scholar]
- Rasouli J, Ciric B, Imitola J, Gonnella P, Hwang D, Mahajan K, … Rostami A. Expression of GM-CSF in T Cells Is Increased in Multiple Sclerosis and Suppressed by IFN-beta Therapy. J Immunol. 2015;194(11):5085–5093. doi: 10.4049/jimmunol.1403243. [DOI] [PMC free article] [PubMed] [Google Scholar]
- Spath S, Komuczki J, Hermann M, Pelczar P, Mair F, Schreiner B, Becher B. Dysregulation of the Cytokine GM-CSF Induces Spontaneous Phagocyte Invasion and Immunopathology in the Central Nervous System. Immunity. 2017;46(2):245–260. doi: 10.1016/j.immuni.2017.01.007. [DOI] [PubMed] [Google Scholar]
- Starossom SC, Mascanfroni ID, Imitola J, Cao L, Raddassi K, Hernandez SF, … Rabinovich GA. Galectin-1 deactivates classically activated microglia and protects from inflammation-induced neurodegeneration. Immunity. 2012;37(2):249–263. doi: 10.1016/j.immuni.2012.05.023. [DOI] [PMC free article] [PubMed] [Google Scholar]
- Vogel DY, Kooij G, Heijnen PD, Breur M, Peferoen LA, van der Valk P, … Dijkstra CD. GM-CSF promotes migration of human monocytes across the blood brain barrier. Eur J Immunol. 2015;45(6):1808–1819. doi: 10.1002/eji.201444960. [DOI] [PubMed] [Google Scholar]
- Wang Y, Imitola J, Rasmussen S, O’Connor KC, Khoury SJ. Paradoxical dysregulation of the neural stem cell pathway sonic hedgehog-Gli1 in autoimmune encephalomyelitis and multiple sclerosis. Annals of neurology. 2008;64(4):417–427. doi: 10.1002/ana.21457. [DOI] [PMC free article] [PubMed] [Google Scholar]
- Zrzavy T, Hametner S, Wimmer I, Butovsky O, Weiner HL, Lassmann H. Loss of ‘homeostatic’ microglia and patterns of their activation in active multiple sclerosis. Brain. 2017;140(7):1900–1913. doi: 10.1093/brain/awx113. [DOI] [PMC free article] [PubMed] [Google Scholar]
Associated Data
This section collects any data citations, data availability statements, or supplementary materials included in this article.


