

Abstract
Malignant melanoma incidence has been increasing for over 30 years, and despite promising new therapies, metastatic disease remains difficult to treat. We describe preliminary results from a Phase I clinical trial (NCT01586403) of adoptive cell therapy in which three patients received autologous CD4+ and CD8+ T cells transduced with a lentivirus carrying a tyrosinase-specific TCR and a marker protein, truncated CD34 (CD34t). This unusual MHC Class I-restricted TCR produces functional responses in both CD4+ and CD8+ T cells. Parameters monitored on transduced T cells included activation (CD25, CD69), inhibitory (PD-1, TIM-3, CTLA-4), costimulatory (OX40), and memory (CCR7) markers. For the clinical trial, T cells were activated, transduced, selected for CD34t+ cells, then re-activated, and expanded in IL-2 and IL-15. After lymphodepleting chemotherapy, patients were given transduced T cells and IL-2, and were followed for clinical and biological responses. Transduced T cells were detected in the circulation of three treated patients for the duration of observation (42, 523, and 255 days). Patient 1 tolerated the infusion well but died from progressive disease after 6 weeks. Patient 2 had a partial response by RECIST criteria then progressed. After progressing, Patient 2 was given high-dose IL-2 and subsequently achieved complete remission, coinciding with the development of vitiligo. Patient 3 had a mixed response that did not meet RECIST criteria for a clinical response and developed vitiligo. In two of these three patients, adoptive transfer of tyrosinase-reactive TCR-transduced T cells into metastatic melanoma patients had clinical and/or biological activity without serious adverse events.
Electronic supplementary material
The online version of this article (doi:10.1007/s00262-017-2073-0) contains supplementary material, which is available to authorized users.
Keywords: Adoptive transfer, Metastatic melanoma, Clinical trial, Transduced T cells, Immunotherapy, Vitiligo
Introduction
Melanoma incidence has risen steadily to over 80,000 new cases a year in the United States alone (approximately 232,000 worldwide) [1, 2]. Despite promising new therapies, metastatic melanoma is difficult to treat, with a 5-year survival rate of 17.9%, leading to over 10,000 mortalities in the United States last year (approximately 55,000 deaths worldwide). Conventional therapies are rarely curative for metastatic melanoma, yet results are encouraging for immunotherapies. Several new immunotherapies have been approved by the FDA, including anti-PD-1, anti-PD-L1, and anti-CTLA-4 monoclonal antibodies, which block checkpoint pathways that suppress T cell responses, thereby releasing inhibited T cells to attack the tumor [3–5]. However, these therapies do not induce tumor regression in all patients [6, 7]. There is evidence that responders to PD-1 blockade may have pre-existing tumor-reactive T cells in the tumor margins [8, 9] and that responders to CTLA-4 blockade change their T cell repertoire in ways consistent with the expansion of novel tumor-reactive T cells and/or expansion of pre-existing anti-tumor T cells [10, 11]. Evidence is mounting that these therapies require the presence of tumor-reactive T cells, and patients having insufficient tumor-reactive T cells may not respond to these checkpoint inhibitors. We and others are developing strategies to introduce anti-tumor T cell receptors (TCRs) into T cells, redirecting large numbers of T cells to be tumor-reactive [12–17]. Previous studies have found that delivering anti-tumor T cells to patients can induce durable regression of tumors [18]. Such studies found objective clinical responses (13–56%) when treating with T cells targeted to both melanocyte-differentiation antigens and cancer-germline antigens [19–23]. Melanocyte-differentiation antigen-specific T cell studies demonstrated on-target off-tumor toxicities to melanocytes in the skin, eye, and ear (vitiligo, uveitis, and hearing loss), while targeting cancer-germline antigens had off- and on-target off-tumor effects including neurological toxicities and colitis. Further studies following the transduced T cells over time in responding versus non-responding patients will help identify factors that contribute to the safety, success or failure of TCR-transduced T cell therapy.
This report describes the preliminary results of monitoring transduced T cells in three patients in a Phase I clinical trial treating metastatic melanoma patients with autologous T cells transduced with the tyrosinase-reactive TIL1383I TCR. The three patients treated had three distinct clinical courses: one with rapid progression of disease, a second with an objective clinical response, and a third with a biological response in the form of vitiligo. Patient 2, with the observed clinical response, had greater numbers of TCR-transduced T cells, increased activation of TCR-transduced T cells, and increased expression of some inhibitory receptors. In Patient 2, upregulation of inhibitory receptors on T cells in the blood did not preclude anti-tumor responses of TCR-transduced T cells. Although, more patients are needed to definitively demonstrate safety and identify response rates, these preliminary results suggest that patients can have clinical and biological responses to TIL1383I TCR-transduced T cell therapy in the absence of serious adverse events.
Methods
Study design
This study describes preliminary results from the first three patients in a 3 × 3 Phase I dose escalation trial introducing gene-modified autologous T cells into metastatic melanoma patients. Patients received 2.5 × 10⁶/kg lentivirally transduced T cells after non-myeloablative lymphodepletion and were given low-dose IL-2 for 1 week following the T cell infusion. The study was performed at Loyola University, Chicago, and registered with Clinicaltrials.gov (NCT01586403). Informed consent was obtained prior to enrolling patients. This study was approved by the Institutional Review Board at Loyola Medical University Center (LU 203732), the Recombinant DNA Advisory Committee (RAC Protocol 1101-1086), the Institutional Biosafety Committee (LU 203732), the Cancer Therapy Evaluation Program (CTEP 9358), and the United States Food and Drug Administration (IND 14971).
See full eligibility and exclusion criteria in Supplementary Table 1. Briefly, patients must have a diagnosis of metastatic melanoma, which must test positive for HLA-A2 and the tyrosinase antigen by immunohistochemistry (Supplementary Figure 1). Patients may not have metastatic lesions in the brain unless controlled and may not have previously received non-myeloablative chemotherapy or immunotherapy specifically targeting tyrosinase. Patients’ descriptions are found in Table 1.
Table 1.
Patient and product descriptions
| Patient 1 | Patient 2 | Patient 3 | |
|---|---|---|---|
| Age (years) | 56 | 41 | 66 |
| Gender | Male | Male | Male |
| Stage of melanoma at diagnosisa | IIIA (T2aN2aM0) | Not determinedb (TxN2bMx) | IIIB (T1aN2bM0) |
| Prior therapies received | High-dose IFN-α, High-dose IL-2, Ipilimumab, palliative intensity-modulated radiation therapy to right upper lobe of lung, paclitaxel/carboplatin | Ipilimumab | High-dose vemurafenib, IL-2, ipilimumab, dabrafenib |
| Tissue involvement | LNs, right upper lobe lung, colonic mass | LNs, subcutaneous tissue | LNs, right adrenal |
| Number of transduced (and total) T cells given | 2.00 × 10⁸ (2.27 × 10⁸) | 2.72 × 10⁸ (2.87 × 10⁸) | 2.06 × 10⁸ (2.22 × 10⁸) |
| Transduced T cells/kg | 1.67 × 10⁶ | 2.5 × 10⁶ | 2.5 × 10⁶ |
| Final product percent CD34+ of CD3+ | 88.1 | 95.8 | 92.9 |
| Final product percent vβ12+ of CD34+ | 27.7 | 46.5 | 43.7 |
|
Final product IFNγ: T2+ Tyro (T2 alone) [pg/mL] |
879 (32) | 1492 (449) | 2738 (176) |
| IFNγ: 624-Mel (A2− 624-28) [pg/mL] | 356 (10) | 494 (18) | 908 (77) |
| Treatments received post-T cell therapy | None | Pembrolizumab high-dose IL-2 | Pembrolizumab |
a All patients Stage IV at time of treatment
b In Patient 2, the primary site of melanoma was not identified
T cell production
For each patient, PBMCs (isolated from an apheresis) were activated for 2 days with anti-CD3 antibody (CD3 Pure, 50 ng/mL, Miltenyi Biotec GMP grade), recombinant human IL-2 (rhIL-2, Prometheus Therapeutics & Diagnostics, 300 IU/mL), and recombinant human IL-15 (rhIL-15, Biologic Resources Branch of the National Cancer Institute, 100 ng/mL). Activated T cells were transduced by spinoculation for 2 h at 2000×g with a GMP-grade replication-deficient lentivirus carrying the TIL1383I TCR and CD34t genes (Supplementary Figure 2). Transduced T cells were cultured 4 days then isolated by CD34-selection using the CliniMACS cell selector. After culturing 4 more days, CD34t+ T cells were tested for viral copy number, then expanded by culturing with CD3 Pure (30 ng/mL), rhIL-2 (300 IU/mL), rhIL-15 (100 ng/mL), and irradiated non-autologous PBMCs at 1:200 T:PBMC ratio for 10 days (14 for Patient 1). During the last 5 days of culture, patients were treated with cyclophosphamide (60 mg/kg) and fludarabine (25 mg/m2) to induce non-myeloablative lymphodepletion [24]. Twenty-four hours after the end of lymphodepletion, expanded transduced T cells were collected, and 2.5 × 10⁶/kg (1.67 × 10⁶/kg for Patient 1) CD34t+ T cells were administered to the patient via continuous i.v. infusion. Patients were treated with a reduced dose IL-2 regimen [25, 26] of 72,000 IU/kg, delivered i.v. three times daily for 7 days. Cell counts during the production process are described in Supplementary Table 2.
Flow cytometry
Each set of patient samples was stained with the following antibodies: CD3-Brilliant Violet 785 (OKT3, Biolegend), CD4-APC/Cy7 (OKT4, Biolegend), CD8-Alexafluor 700 (SK1, Biolegend), CD11b-Brilliant Violet 570 (M1/70, Biolegend), CD19-Brilliant Violet 570 (HIB19, Biolegend), CD34-Brilliant Violet 421 (561, Biolegend), TCR vβ12-PE (VER2.32.1, Beckman Coulter), CD25-Brilliant Violet 711 (BC96, Biolegend), CD69-PE/Cy7 (FN50, Biolegend), OX40-FITC (Ber-ACT35, Biolegend), PD-1-PerCP/Cy5.5 (EH12.2H7, Biolegend), T cell immunoglobulin and mucin-domain containing-3 (TIM-3)-APC (F38-2E2, Biolegend), CTLA-4-PE-CF594 (BNI3, BD Biosciences), C–C motif chemokine receptor 7(CCR7, CD197)-Brilliant Violet 650 (G043H7, Biolegend), and a viability dye (Live/Dead Aqua, Invitrogen). Representative stains are shown in Supplementary Fig. 3. All samples were analyzed on the LSRFortessa in the Loyola University, Chicago, Flow Cytometry Core. The absolute number of TCR-transduced T cells per milliliter (mL) of study blood was estimated by combining the percentages of TCR-transduced T cells with counts of total white blood cells from known volumes of whole blood.
Affinity measurements
The solution (three dimensional, 3D) binding affinity of TIL1383I was determined by surface plasmon resonance (SPR). Soluble TIL1383I TCR and HLA-A2–tyrosinase complexes were refolded from bacterial inclusion bodies and purified chromatographically [27]. Solution (3D) binding affinity was measured at 25 °C using a Biacore T200 instrument [27, 28]. HLA-A2–tyrosinase complexes were tethered to a CM5 sensor surface using standard amine coupling. Soluble TIL1383I TCR complexes were injected over the sensor surface at increasing concentrations, and the response due to binding recorded. After subtracting the responses from a mock surface, the data were fit to 1:1 binding model using Biaevaluation 4.1.
Two-dimensional (2D) affinity measurements were taken using the micropipette adhesion frequency assay [29, 30]. Briefly, frozen patient T cell samples were thawed and permitted to recover for 3 days in AIM V medium in the presence of rhIL-2 (300 IU/mL) and rhIL-15 (100 ng/mL). Human RBCs coated with HLA-A2–tyrosinase-peptide (pMHC, using HLA-A2 molecules mutated to abrogate CD8 binding) and patient T cells were aspirated onto opposing pipettes and brought into contact 50 times with the same area (A c) and time, using an electronically controlled piezoelectric actuator. Upon retraction of the T cell, adhesion was observed as a distention of the RBC membrane, allowing for the quantification of adhesion frequency (P a) at equilibrium. Surface pMHC (m l) and TCRβ (m r) densities were determined by flow cytometry using BD QuantiBRITE PE Beads for standardization (BD Biosciences). Relative 2D affinities were calculated using the following equation: [29].
Results
Clinical responses
All three patients tolerated the infusion well. Some toxicities were observed (Supplementary Table 3), which were similar to previously observed toxicities seen in patients receiving non-myeloablative lymphodepletion (lymphopenia, neutropenia, thrombocytopenia, and rash). Considering toxicities previously observed in patients given melanoma/melanocyte-specific T cells [20, 31], our toxicities did not include uveitis or hearing loss but did include vitiligo. Patient 3 developed vitiligo after treatment with transduced T cells and Patient 2 developed vitiligo after progressing and receiving treatment with high-dose IL-2 (Fig. 1c).
Fig. 1.

Clinical responses of patients. a. Lesions in Patient 2 before and after T cell transfer. (Top) Tumor in the right axial lymph node. (Bottom) Tumor in the right apical lung nodule. b. Vitiligo in Patient 3, with boundaries approximately shown by white outline. c. Transduced T cells in the margins of the vitiligo in Patients 2 and 3. (i) vitiligo in Patient 2 with location of punch biopsy (arrow); (ii) vitiligo in Patient 3 with locations of first punch biopsy (1, taken at 3 weeks post-transfer, had neither melanocytes nor T cells present) and second punch biopsy (2, taken at 4 weeks post-transfer); (iii–viii): Second punch biopsy from Patient 3, scale bars are 10 µm (iii) Remaining TRP-1+ melanocytes (black arrows, blue staining) in second biopsy taken from patient 3; (iv) CD3 expression in violet; (v) Vβ12 expression in red; (vi) CD34 expression in green; (vii) DAPI nuclear staining in blue (E = epidermis, D = dermis); (viii) Colocalized CD3+Vβ12+CD34t+ staining after DAPI; (ix) Percent of CD3+Vβ12+ cells (gray bar), percent of CD3+CD34t+ cells (black bar), and percent of CD3+Vβ12+CD34t+ cells (white, striped bar) in biopsy from patient 2 and biopsy 2 from patient 3
In Patient 1, there was neither tumor nor biological response attributable to the TCR-transduced T cells. Patient 1 received two-thirds the dose of TCR-transduced T cells given to the other two patients, following U.S. Food and Drug Administration (FDA) recommendations in response to a high viral copy number in the final T cell product. Patient 1 had 7.5 copies per cell, instead of 5 or fewer copies per FDA guidelines, and the recommendation was to reduce the T cell dose proportionally. Patient 1 also had the highest tumor burden, with tumors over 1 cm in size in at least eight sites, with the largest tumor being over 3 cm in diameter at time of treatment. Patient 1 passed away 47 days post-transfer without responding to treatment.
Patient 2 had a partial response with tumors shrinking over 30% for 5 months post-treatment (Fig. 1a). He began the trial with tumors at six locations, each measuring less than 1.5 cm in diameter. Tumors at all locations regressed or stabilized for over 2 months. After his disease progressed, Patient 2 received PD-1 blockade with pembrolizumab for 6 weeks (days 214–256). After progressing again, Patient 2 received high-dose IL-2 therapy (600,000 IU/m2 given i.v. every 8 h for a maximum of 14 doses on days 284, 298, and 368 post-T cell infusion), which preceded tumor regression and remission persisting over 2 years. On two separate occasions of receiving high-dose IL-2 treatment, he developed rhabdomyolysis. This rhabdomyolysis was not considered a treatment-related event from the transduced T cells, as histology of biopsy samples of inflamed muscle tissue stained for CD3 and CD34t did not reveal a significant population of CD34t+ T cells. Patient 2 developed progressive vitiligo after high-dose IL-2 and has very little normal skin pigmentation remaining.
Patient 3 had an observed biologic response to the T cells, in the form of progressive vitiligo (Fig. 1b). Histology demonstrated that CD3+vβ12+CD34t+ T cells were present at the margins of the vitiligo but not normal skin in both Patient 2 and Patient 3 (Fig. 1c). There were substantially higher percentages of these in the skin at the margin of the vitiligo than in the blood, suggesting that patients’ transduced T cells were functional and targeting melanocytes. Patient 3 began the trial with a 3-cm tumor at one location and another tumor less than 1 cm in diameter. Although his tumors had a small reduction in size (cumulatively about 10%) for 5 months, other tumors progressed; therefore Patient 3 was nonresponsive by RECIST criteria. He went on to receive PD-1 blockade, but passed away from progressive disease shortly thereafter.
Biology of the T cells: T cell numbers and phenotype pre- and post-transfer
In this study, CD34t is expressed on the surface of transduced cells and provides a powerful marker to uniquely identify transduced T cells, as the transduced TCR is expressed at lower levels due to competition with the endogenous TCR for CD3 components [32, 33]. Over 85% of the final preparation of T cells were CD34t+, whereas only a fraction of CD34t+ T cells had detectable TCR (vβ12 in Table 1). The clinical responder, Patient 2, had the highest CD34 expression in T cells prior to transfer, but interestingly, there was not a strong correlation between clinical response and the intensity of TCR expression (Supplementary Figure 4). We detected transduced (CD34t+) T cells in all patients for the duration of observation (Fig. 2). In all patients, the percentage transduced of total T cells peaked within 7 days, while the number of transduced T cells per milliliter of blood kept increasing until it peaked between 14 and 21 days. The prolonged increase in the number but not the percentage of transduced T cells is due to a substantial increase in total T cell numbers after day seven (Supplementary Figure 5). Peak numbers of transduced T cells are highest in the clinical responder, Patient 2 (1145 CD8+ and 2174 CD4+ cells/mL), and lowest in the non-responder, Patient 1 (461 CD8+ and 661 CD4+ cells/mL).
Fig. 2.

Transduced T cell percentages and numbers in PBL samples. Patient blood samples were collected at indicated time-points post-infusion. PBMC were isolated from these blood samples by density gradient centrifugation and cryopreserved for later batch analysis. At least a year after each patient was treated, or after the patient passed away, the collection of samples for that patient was thawed and collectively analyzed by flow cytometry. All patients were treated with low-dose IL-2 (72,000 IU/kg, i.v., three times daily) for 7 days after T cell infusion (green line). Two patients went on to receive pembrolizumab, each course (2 mg/kg, given i.v. every 3 weeks) indicated by closed purple arrows, and one patient further received high-dose IL-2, with each course (600,000 IU/m2, given i.v. every 8 h for a maximum of 14 doses on days 284, 298, and 368 post-T cell infusion) indicated by open green arrows. a. The percent transduced (CD34t+, green triangles), transduced CD4+ (CD34t+CD4+, blue diamonds) and transduced CD8+ (CD34t+CD8+, red squares) of CD3+ T cells in patient blood samples drawn at indicated times post-T-cell transfer. b. The number of CD34t+CD3+ (green triangles), CD34t+CD3+CD4+ (blue diamonds), and CD34t+CD3+CD8+ (red squares) T cells per milliliter patient sample blood at indicated times post-transfer. Bar graphs show the average percentages of indicated cells across all time-points with error bars representing the standard error
Treatment of Patient 2 with high-dose IL-2 preceded a dramatic increase in both the percent and number of transduced CD8+ T cells, and a smaller increase in the percent and number of transduced CD4+ T cells, occurring after the third course of high-dose IL-2. Thus, Patient 2 had the highest initial peak number of transduced T cells and a substantial increase in the number of transduced T cells after the third course of high-dose IL-2, potentially contributing to the lasting remission thereafter.
Activation (CD25 and CD69)
To determine whether the transduced T cells were responding to tumor or melanocyte antigens in the patients, we utilized two well-characterized activation markers, CD25 (IL-2Rα) and CD69. CD25 and CD69 are both upregulated within hours of T cell activation and decrease back to baseline levels after several days; thus expression of these markers identifies recently activated T cells [34, 35]. Due to prior activation and culture in IL-2 and IL-15, up to 40% of transduced CD4+ and CD8+ T cells co-express CD25 and CD69 immediately prior to transfer into the patients (Fig. 3). The percent of activated transduced CD4+ and CD8+ T cells is higher than endogenous T cells at almost all points and increases after day one in each patient, suggesting that transduced cells were activated in all patients. Comparing patients, Patient 2 had higher percentages of activated transduced CD4+ and CD8+ T cells than Patient 1 or 3. Thus, while TCR-transduced T cells were somewhat activated in all patients, the clinical responder (Patient 2) had the highest frequency of activated transduced CD4+ T and CD8+ T cells in the blood.
Fig. 3.

Expression of activation markers, CD25 and CD69, in transduced and endogenous T cells. Patients were treated and samples collected and stained as described in Figs. 1 and 2. Cells were analyzed by flow cytometry to identify the percentage of transduced (CD34t+) and endogenous (CD34t−) CD4+ and CD8+ T cells co-expressing CD25 and CD69. a. The percent CD25+CD69+ of transduced (CD34t+, solid red line) vs. endogenous (CD34t−, dotted black line) CD8+CD3+ T cells. b. The percent CD25+CD69+ of transduced (CD34t+, solid blue line) vs. endogenous (CD34t−, dotted black line) CD4+CD3+ T cells. Bar graphs show the average percentages of indicated cells across all time-points with error bars representing the standard error
PD-1 blockade did not precede any increase in activation markers in Patient 2. In Patient 3, PD-1 blockade preceded a substantial increase (from 15.6 to 37.1% in CD4+ cells and 8.2–23.1% in CD8+ cells) in the expression of activation markers in transduced T cells and a slight increase in untransduced T cells. During high-dose IL-2 therapy in Patient 2, activation markers fluctuate on transduced CD4+ and CD8+ T cells. In these patients, therefore, treatment with immunotherapies after progression coincides with changes in activation, but further work is necessary to determine whether and how immunotherapies influence transduced T cell activation.
Inhibitory receptors (PD-1, TIM-3, and CTLA-4)
In melanoma patients, tumor-reactive T cells have been found to up-regulate inhibitory receptors, including PD-1, CTLA-4, and TIM-3, and to be functionally inhibited by interaction of these receptors with their cognate ligands [36–39]. PD-1 and CTLA-4 blockade are promising FDA-approved immunotherapies [40–46] and TIM-3 antibody-mediated blockade is currently in Phase I clinical trials (NCT02817633, NCT02608268) for the treatment of metastatic melanoma. We analyzed PD-1 and TIM-3 co-expression on transduced T cells in the patients over time. At most time-points in all three patients, less than 20% of transduced CD4+ and CD8+ T cells co-express PD-1 and TIM-3, suggesting that there was no overwhelming exhaustion of transduced T cells in the blood (Fig. 4), although tumor-infiltrating transduced T cells might be substantially more exhausted. Patients 1 and 3 did not have consistently higher percentages of CD4+ or CD8+ CD34t+ T cells co-expressing PD-1 and TIM-3 than Patient 2. Patient 2 had higher percentages of transduced CD4+ and CD8+ cells expressing PD-1 than Patients 1 or 3 (Supplementary Figure 6), perhaps because PD-1 is upregulated on activated T cells. These results suggest that absent or reduced anti-tumor responses in Patient 1 and 3 cannot be attributed to higher levels of exhaustion in transduced cells in the blood.
Fig. 4.

Transduced and endogenous T cell expression of exhaustion-related receptors PD-1 and TIM-3 post-transfer. Patients were treated and blood collected as described in Figs. 1 and 2. Cells were analyzed by flow cytometry to identify the percentage of transduced (CD34t+) and endogenous (CD34t−) CD4+ and CD8+ T cells co-expressing PD-1 and TIM-3. a. The percent PD-1+TIM-3+ of transduced (CD34t+, solid red line) vs. endogenous (CD34t−, dotted black line) CD8+CD3+ T cells. b. The percent PD-1+TIM-3+ of transduced (CD34t+, solid blue line) vs. endogenous (CD34t−, dotted black line) CD4+CD3+ T cells. Bar graphs show the average percentages of indicated cells across all time-points with error bars representing the standard error
Treatment with PD-1-blockade did not precede substantial or consistent increases in the percentage of transduced cells expressing PD-1 or co-expressing PD-1 and TIM-3 in Patients 2 or 3, suggesting that PD-1-blockade did not enhance the survival or proliferation of PD-1-expressing transduced T cells in the blood in these patients. High-dose IL-2 therapy preceded a substantial transient increase in the percentage of transduced CD4+ T cells co-expressing PD-1 and TIM-3, and an increase in the percentage of PD-1-expressing transduced CD8+ T cells. It is possible that in Patient 2, high-dose IL-2 augmented activation and tumor-trafficking of TCR-transduced T cells, thereby increasing PD-1 and TIM-3 expression and mediating some or all of the tumor regression seen after high-dose IL-2. This does not exclude the possibility that endogenous tumor-specific T cells may have been activated and responding as well.
CTLA-4 is an inhibitory receptor upregulated after activation and expressed on tumor-reactive T cells [36, 47]; CTLA-4-blockade has been found to enhance anti-tumor T cell responses [42–46]. In all patients, the percentage of CTLA-4+ cells in both transduced and endogenous CD8+ and CD4+ T cells increased transiently during low-dose IL-2 treatment. Patient 1 had the highest peak percentage of transduced CD8+ T cells expressing CTLA-4, reaching 99% by day 7 (Supplementary Figure 7). Patient 2 had the highest peak percentage of transduced CD4+ T cells expressing CTLA-4, reaching 44.2% versus 18.5 and 25.7% in Patients 1 and 3, respectively. The absence of a cytolytic tumor response in Patient 1 might be related to the very high percentage of CTLA-4-expressing transduced CD8+ T cells in this patient’s blood immediately post-transfer.
Following CTLA-4 expression after further clinical intervention, we found that PD-1 blockade preceded an increase in CTLA-4-expressing transduced CD4+ but not CD8+ T cells in both Patient 2 (from 11.3 to 28.6%) and Patient 3 (from 11.9 to 25.7%). High-dose IL-2 therapy did not precede consistent changes in CTLA-4 expression on CD4+ or CD8+ T cells. Therefore, in Patient 1, PD-1 blockade preceded greater expression of CTLA-4 but not PD-1, while in Patient 2, high-dose IL-2 may have preceded more expression of PD-1 but not CTLA-4 on TCR-transduced T cells.
CD25 and CTLA-4 may be co-expressed on regulatory CD4+ T cells (Treg) [48]. We assessed the percentages of CD25+CTLA-4+ transduced CD4+ cells in all three patients, and found that Patient 2 had the highest percentage, reaching 41.9%, versus 16.7 and 21.7% in Patients 1 and 3, respectively (Supplementary Figure 8). Differences in the percentages of potential Treg in the blood do not explain the absence of a clinical or biological response in Patient 1 or clinical response in Patient 3.
Costimulation (OX40)
OX40 is upregulated after activation in both CD4+ and CD8+ T cells and enhances T cell proliferation, survival, and development of memory [49, 50]. Tumor-antigen-specific T cells may express OX40 and OX40 costimulation augments anti-tumor responses [51, 52]. Patients expressing OX40 on a higher percentage of their TIL have a better prognostic outcome [53]. So, we examined OX40 expression on transduced T cells. Patient 2 had fewer OX40-expressing transduced CD8+ T cells at most time-points (Supplementary Figure 9). However, Patient 2 had the highest peak percentage of transduced CD4+ T cells expressing OX40 (81% in Patient 2 vs. 51.6 and 61.2% in Patients 1 and 3, respectively). After PD-1 blockade in Patients 2 and 3, there was an increase in the percent of transduced CD4+ T cells expressing OX40, although neither patient had tumor regression. Overall, OX40 expression on transduced CD4+ or CD8+ T cells in the blood does not clearly correlate with clinical responses, and future studies with more patients are needed to determine whether PD-1 blockade regulates OX40 on tumor-reactive CD4+ T cells.
Memory differentiation (CCR7)
To develop long-term protection from tumor recurrence, transduced T cells must differentiate into memory T cells. CCR7 is a chemokine receptor regulating entry into lymphoid structures which identifies central memory T cells [54]. We examined CCR7 expression on transduced versus endogenous CD4+ and CD8+ T cells in all three patients. Prior to transfer, a fraction of transduced CD4+ and CD8+ T cells expressed CCR7. As expected by the accumulation of memory cells, the percentage of transduced and endogenous cells expressing CCR7 increased over time in all patients (Supplementary Figure 10). Patient 2 had a higher mean percentage of CCR7-expressing transduced CD4+ and CD8+ cells than Patients 3 and 1. Collectively, these results indicate that a substantial fraction (over 50%) of transduced CD4+ and CD8+ cells eventually expressed memory markers in the blood in Patient 2.
TCR affinity
All three patients received autologous T cells transduced with the same high-affinity (CD8-independent) TIL1383I TCR. The solution (3D) affinity of the TIL1383I TCR was measured at 9 μM, consistent with a high-affinity TCR/pMHC interaction (Fig. 5a). However, TCR affinities measured in solution do not account for all of the interactions that lead to T cell activation and function, and accordingly do not always correlate with functional outcomes [55]. Therefore, we performed 2D affinity measurements on the TIL1383I TCR-transduced T cells delivered to the patients to determine whether an assay that measures TCR/pMHC affinity in the context of other cell surface interactions correlates with clinical outcome. Interestingly, the 2D affinity was notably lower in cells from Patient 1 (nonresponder) than Patients 2 (partial responder) or 3 (vitiligo), as was adhesion frequency (Fig. 5b, c). Although based on just three patients, these results suggest that 2D affinity and adhesion frequency should be explored as markers for predicting clinical outcomes.
Fig. 5.
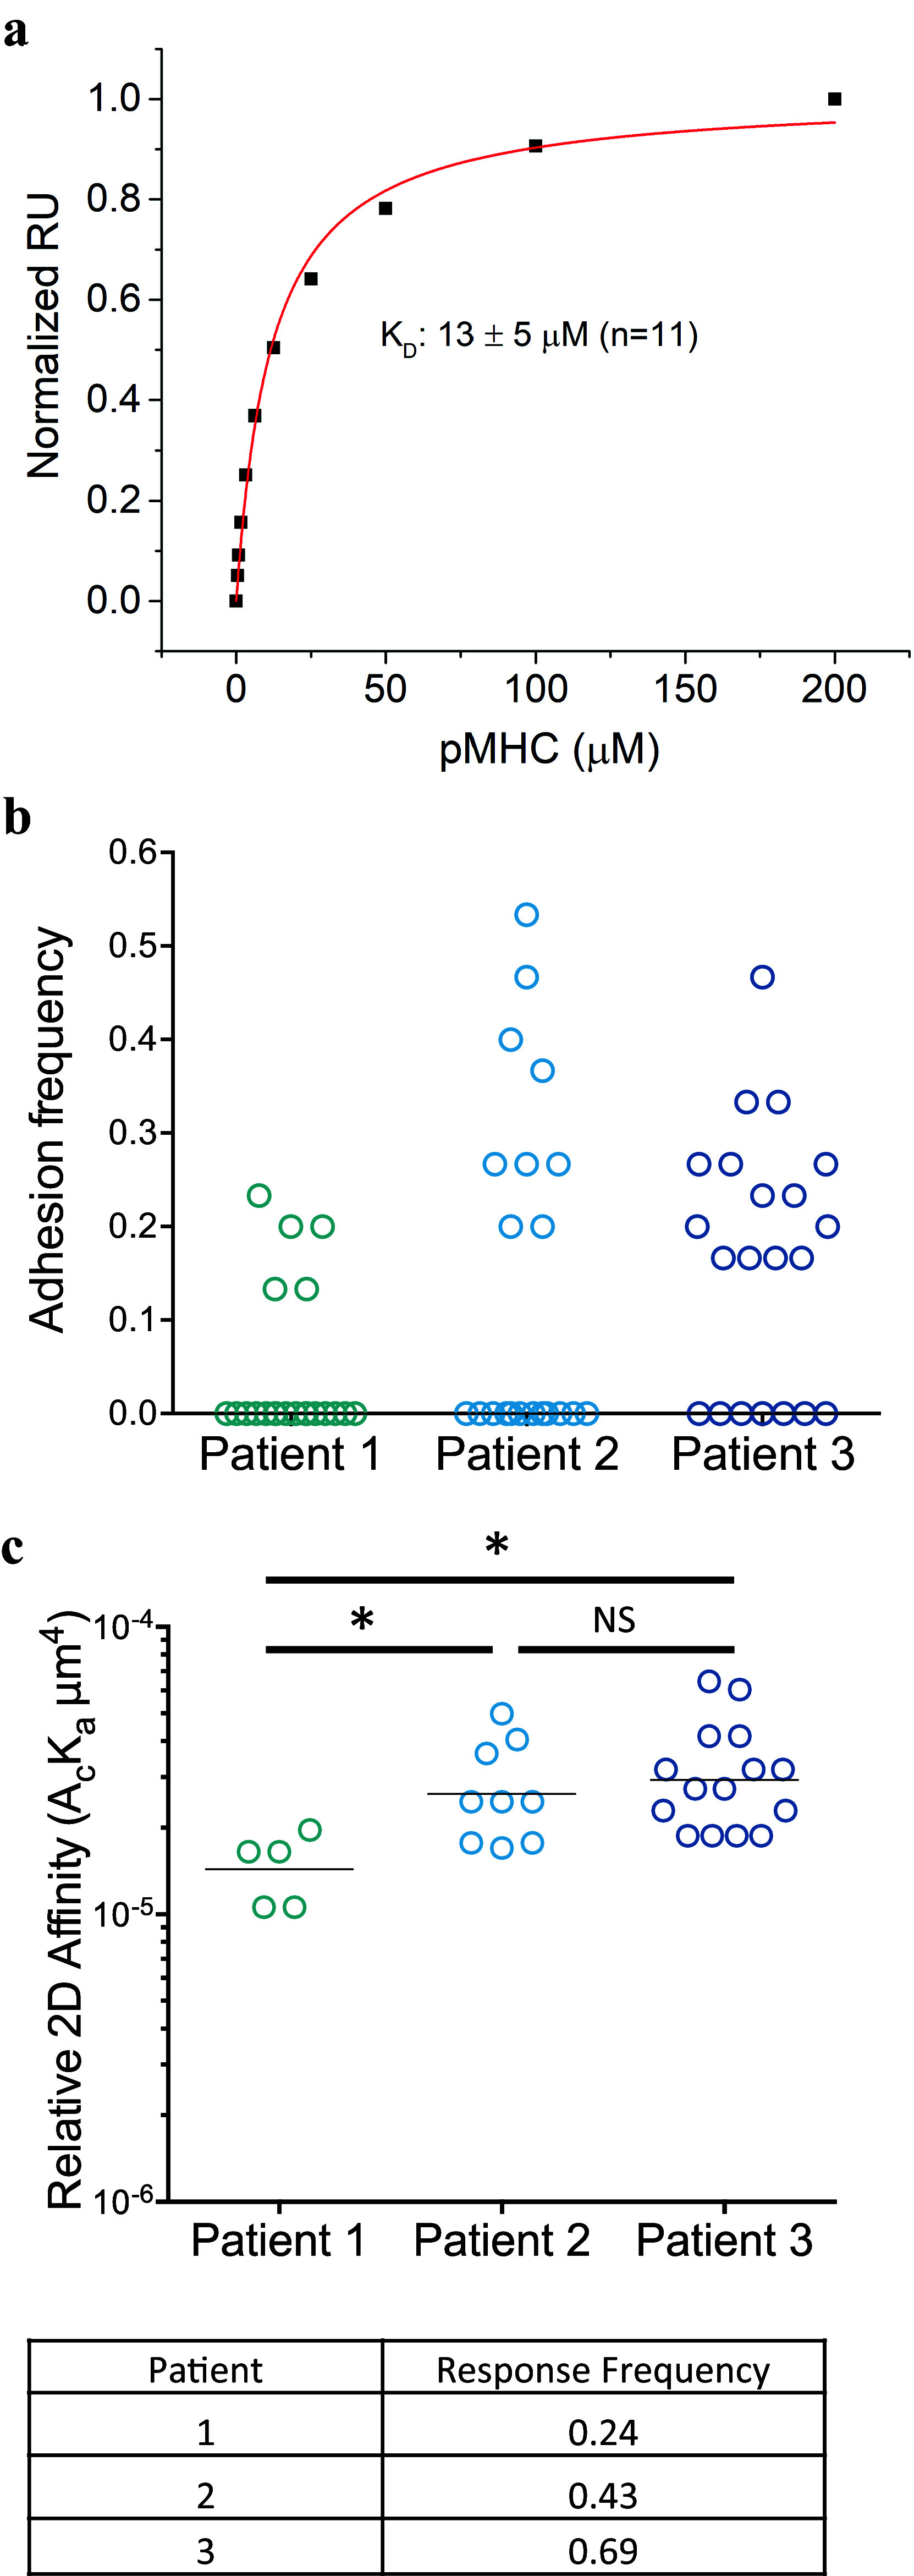
Affinity measurements. a. Solution (3D) affinity measurements were performed by surface plasmon resonance, analyzing the binding of soluble TIL1383I-TCR to surface-bound HLA-A2-tyrosinase at 25 °C using a Biacore T200 instrument. The data were fit to a 1:1 binding model using Biaevaluation 4.1. RU: Response Units b. Adhesion frequencies for transduced T cells were determined using a two-dimensional micropipette adhesion frequency assay with transduced patient T cells from each patient and tyrosinase-peptide–HLA-A2-coated RBCs. Shown are the frequencies of binding events in each of the 21 T cell-pMHC-RBC pairs that were tested. c. Relative 2D affinities were calculated using the specific adhesion frequency (P a) along with the surface pMHC (m l) and TCRβ (m r) densities, as determined by flow cytometry. For each patient, 21 T cell-RBC pairs were used to obtain P a values from which the affinity was calculated as: . Statistics shown were done by Student’s t-test. *p < 0.05
Discussion
While melanoma-specific T cells are present in most patients [56], self-reactive T cells have low affinity for target antigens [57, 58], and tumor-reactive T cells may have poor viability and function after sustained growth in the immunosuppressive tumor microenvironment [58, 59]. Specialized protocols that expand tumor-infiltrating cells with antigen and IL-2 ex vivo have had some success inducing complete remission in some patients but these protocols depend on expanding a small number of cells substantially to generate sufficient cells to treat the tumor—a process that requires an accessible tumor with tumor-infiltrating lymphocytes as well as successful expansion of these TIL—which is not always feasible [60, 61]. In this clinical trial, we are utilizing a viral vector to introduce a high-affinity antigen-specific TCR into metastatic melanoma patients’ CD4+ and CD8+ T cells to redirect them to attack the melanoma. Following the fate of the TCR-transduced T cells after transfer, we found that, in these three patients, TCR-transduced T cells had a phenotype distinct from endogenous CD34t− T cells, including higher expression of both activation and inhibition-related receptors, reminiscent of tumor-reactive T cells visualized by tetramer staining. Certain characteristics of the T cell response were distinct in Patient 2, who had a clinical response, compared to non-responding Patient 1 and Patient 3, who developed vitiligo. In Patient 2, there were substantially more transduced CD8+ T cells present at later time-points, with a greater expansion of transduced CD8+ and CD4+ T cells in the blood. This was associated with higher expression of activation markers and of activation-associated inhibitory receptor PD-1 on transduced CD4+ and CD8+ T cells. Collectively, these results indicate that, in these three patients, there were higher numbers of TCR-transduced T cells that expressed more activation markers in a clinical responder. The mechanisms behind increased activation of the transduced T cells are more elusive, and further elucidation of mechanisms that enhance T cell anti-tumor efficacy in vivo would greatly help develop more effective strategies to target melanoma.
The affinity measurements gave some indication about underlying cellular differences that might have led to a better response in Patient 2. Despite being treated with T cells expressing the same TCR, different 2D affinity measurements on the final product suggested that transduced T cells given to Patient 2 might have had higher binding affinity. Parameters, such as membrane composition, TCR clustering, and cooperative binding, will influence 2D but not 3D TCR/pMHC affinity measurements. While 3D TCR/pMHC affinity measurements are the gold standard for selecting TCRs for cell therapy, preliminary results from our three patients indicate that 2D affinity measurements might be predictive of the potency of T cell products for patient treatment. Further experiments are necessary to see if this observation is repeatable in a larger cohort of patients.
In the field of immunotherapy of cancer, there has been a great deal of research about generating the most effective T cell response for the treatment of patients. However, clinical responses depend on many patient and tumor-specific factors, such as tumor mutational load [62–66], expression of immune-inhibitory receptors and molecules [67], recruitment of immunosuppressive cells [68–70], loss of antigen or antigen expression [71–73], and total tumor burden [74, 75]. In this study, Patient 1 had the highest tumor burden and had no response to the therapy, while Patients 2 and 3 with lower tumor burdens had a clinical and a biological response, respectively.
Novel immunotherapies, most notably checkpoint blockades, such as PD-1 blockade or CTLA-4 blockade, offer promises of helping suppress inhibitory mechanisms that may vary between patients. A question that has come up is whether combination of these therapies with T cell adoptive transfer would be beneficial. Given the expression levels of PD-1 on adoptively transferred T cells in the blood, it appeared that PD-1 blockade should have enhanced the T cell responses in Patient 2, but it had no effect on tumor burden or T cell activation. Conversely, PD-1 blockade in Patient 3 immediately preceded an increase in the activation and number of adoptively transferred CD4+ T cells, in spite of the observation that only a small fraction of adoptively transferred T cells in Patient 3 express PD-1. It is possible that PD-1-expressing T cells in Patient 3 are suppressed by high expression of PD-L1 on the tumor but the tumor was not tested for PD-L1 expression. While PD-1 blockade had no effect on Patient 2, a second immunotherapy, high-dose IL-2, immediately preceded a lasting remission. It is not possible to dissect what part of the remission and autoimmune response seen in Patient 2 is due to transduced T cells, PD-1 blockade, high-dose IL-2, or the interactions of these three therapies. Notably, while PD-1 blockade had neither a clinical effect nor an effect on transduced T cell numbers or phenotype in Patient 2, high-dose IL-2 therapy preceded both an increase in the number of TCR-transduced T cells in Patient 2 and the progression of vitiligo associated with the presence of transduced T cells in the skin. Therefore, in one of two patients given further immunotherapies after progressing on TCR-transduced T cells, the immunotherapies led to tumor regression. Further experiments will help find biomarkers identifying which patients will benefit from immunotherapies after transduced T cell delivery.
Electronic supplementary material
Below is the link to the electronic supplementary material.
Acknowledgements
All flow cytometry was performed in the Loyola University, Chicago, Flow Cytometry Core, with the assistance of Patricia Simms.
Funding
This study was funded by National Institute of Health Grants: R43 CA126461 (Boro Dropulic), R44 CA126461 (Boro Dropulic), R01 CA90873 (Michael I. Nishimura), R01 CA104947 (Michael I. Nishimura), R01 CA104947-S1 (Michael I. Nishimura), P01 CA154778 (Michael I. Nishimura), R01 AI129543-01 (Brian M. Baker, Brian D. Evavold, Michael I. Nishimura), R01 AI096879 (Brian D. Evavold).
Abbreviations
- 2D
Two-dimensional
- 3D
Three-dimensional
- CCR7
C–C motif chemokine receptor 7
- CD34t
Truncated CD34
- FDA
U.S. Food and Drug Administration
- pMHC
Peptide-loaded MHC complexes, in this study, tyrosinase peptide-loaded HLA-A2 MHC molecules
- rhIL-2
Recombinant human IL-2
- rhIL-15
Recombinant human IL-15
- TIM-3
T cell immunoglobulin and mucin-domain containing-3
- Treg
Regulatory CD4+ T cells
Compliance with ethical standards
Conflict of interest
Author Joseph I. Clark received speaking honorariums from Merck and Bristol-Myers Squibb, and is an unpaid member of the steering committee for the Prometheus PROCLAIM high-dose IL-2 database. Other authors report no conflicts of interest.
Ethical approval
All procedures performed in studies involving human participants were in accordance with the ethical standards of the institutional and/or national research committee, and with the 1964 Helsinki declaration and its later amendments or comparable ethical standards.
Informed consent
Informed consent was obtained from all individual participants included in the study.
Footnotes
A correction to this article is available online at https://doi.org/10.1007/s00262-017-2102-z.
Change history
12/20/2017
The authors would like to make the following corrections to the published article.
References
- 1.Howlader N, Noone A, Krapcho M, Miller D, Bishop K, Kosary C, Yu M, Ruhl J, Tatalovich Z, Mariotto A, Lewis D, Chen H, Feuer E, Cronin K (2016) SEER Cancer Statistics Review, 1975–2014. Surveillance Research Program, National Cancer Institute Bethesda, MD. https://seer.cancer.gov/csr/1975_2014/, based on November 2016 SEER data submission, posted to the SEER web site, April 2017. Accessed 28 June 2017
- 2.Ferlay J, Soerjomataram I, Dikshit R, Eser S, Mathers C, Rebelo M, Parkin DM, Forman D, Bray F. Cancer incidence and mortality worldwide: sources, methods and major patterns in GLOBOCAN 2012. Int J Cancer. 2015;136:E359–E386. doi: 10.1002/ijc.29210. [DOI] [PubMed] [Google Scholar]
- 3.Pardoll DM. The blockade of immune checkpoints in cancer immunotherapy. Nat Rev Cancer. 2012;12:252–264. doi: 10.1038/nrc3239. [DOI] [PMC free article] [PubMed] [Google Scholar]
- 4.Postow MA, Callahan MK, Wolchok JD. Immune checkpoint blockade in cancer therapy. J Clin Oncol. 2015;33:1974–1982. doi: 10.1200/JCO.2014.59.4358. [DOI] [PMC free article] [PubMed] [Google Scholar]
- 5.Callahan MK, Postow MA, Wolchok JD. CTLA-4 and PD-1 pathway blockade: combinations in the clinic. Front Oncol. 2014;4:385. doi: 10.3389/fonc.2014.00385. [DOI] [PMC free article] [PubMed] [Google Scholar]
- 6.Michot JM, Bigenwald C, Champiat S, Collins M, Carbonnel F, Postel-Vinay S, Berdelou A, Varga A, Bahleda R, Hollebecque A, Massard C, Fuerea A, Ribrag V, Gazzah A, Armand JP, Amellal N, Angevin E, Noel N, Boutros C, Mateus C, Robert C, Soria JC, Marabelle A, Lambotte O. Immune-related adverse events with immune checkpoint blockade: a comprehensive review. Eur J Cancer. 2016;54:139–148. doi: 10.1016/j.ejca.2015.11.016. [DOI] [PubMed] [Google Scholar]
- 7.Teixidó C, González-Cao M, Karachaliou N, Rosell R. Predictive factors for immunotherapy in melanoma. Ann Transl Med. 2015;3:208. doi: 10.3978/j.issn.2305-5839.2015.05.07. [DOI] [PMC free article] [PubMed] [Google Scholar]
- 8.Tumeh PC, Harview CL, Yearley JH, Shintaku IP, Taylor EJ, Robert L, Chmielowski B, Spasic M, Henry G, Ciobanu V, West AN, Carmona M, Kivork C, Seja E, Cherry G, Gutierrez AJ, Grogan TR, Mateus C, Tomasic G, Glaspy JA, Emerson RO, Robins H, Pierce RH, Elashoff DA, Robert C, Ribas A. PD-1 blockade induces responses by inhibiting adaptive immune resistance. Nature. 2014;515:568–571. doi: 10.1038/nature13954. [DOI] [PMC free article] [PubMed] [Google Scholar]
- 9.Daud AI, Loo K, Pauli ML, Sanchez-Rodriguez R, Sandoval PM, Taravati K, Tsai K, Nosrati A, Nardo L, Alvarado MD, Algazi AP, Pampaloni MH, Lobach IV, Hwang J, Pierce RH, Gratz IK, Krummel MF, Rosenblum MD. Tumor immune profiling predicts response to anti-PD-1 therapy in human melanoma. J Clin Invest. 2016;126:3447–3452. doi: 10.1172/JCI87324. [DOI] [PMC free article] [PubMed] [Google Scholar]
- 10.Kvistborg P, Philips D, Kelderman S, Hageman L, Ottensmeier C, Joseph-Pietras D, Welters MJ, van der Burg S, Kapiteijn E, Michielin O, Romano E, Linnemann C, Speiser D, Blank C, Haanen JB, Schumacher TN. Anti-CTLA-4 therapy broadens the melanoma-reactive CD8+ T cell response. Sci Transl Med. 2014;6:254ra128. doi: 10.1126/scitranslmed.3008918. [DOI] [PubMed] [Google Scholar]
- 11.Cha E, Klinger M, Hou Y, Cummings C, Ribas A, Faham M, Fong L. Improved survival with T cell clonotype stability after anti-CTLA-4 treatment in cancer patients. Sci Transl Med. 2014;6:238ra270. doi: 10.1126/scitranslmed.3008211. [DOI] [PMC free article] [PubMed] [Google Scholar]
- 12.Roszkowski JJ, Lyons GE, Kast WM, Yee C, Van Besien K, Nishimura MI. Simultaneous generation of CD8+ and CD4+ melanoma-reactive T cells by retroviral-mediated transfer of a single T-cell receptor. Cancer Res. 2005;65:1570–1576. doi: 10.1158/0008-5472.CAN-04-2076. [DOI] [PubMed] [Google Scholar]
- 13.June CH, Maus MV, Plesa G, Johnson LA, Zhao Y, Levine BL, Grupp SA, Porter DL. Engineered T cells for cancer therapy. Cancer Immunol Immunother. 2014;63:969–975. doi: 10.1007/s00262-014-1568-1. [DOI] [PMC free article] [PubMed] [Google Scholar]
- 14.Rosenberg SA, Restifo NP, Yang JC, Morgan RA, Dudley ME. Adoptive cell transfer: a clinical path to effective cancer immunotherapy. Nat Rev Cancer. 2008;8:299–308. doi: 10.1038/nrc2355. [DOI] [PMC free article] [PubMed] [Google Scholar]
- 15.Mehrotra S, Al-Khami AA, Klarquist J, Husain S, Naga O, Eby JM, Murali AK, Lyons GE, Li M, Spivey ND, Norell H, Martins da Palma T, Onicescu G, Diaz-Montero CM, Garrett-Mayer E, Cole DJ, Le Poole IC, Nishimura MI. A coreceptor-independent transgenic human TCR mediates anti-tumor and anti-self immunity in mice. J Immunol. 2012;189:1627–1638. doi: 10.4049/jimmunol.1103271. [DOI] [PMC free article] [PubMed] [Google Scholar]
- 16.Nishimura MI, Avichezer D, Custer MC, Lee CS, Chen C, Parkhurst MR, Diamond RA, Robbins PF, Schwartzentruber DJ, Rosenberg SA. MHC class I-restricted recognition of a melanoma antigen by a human CD4+ tumor infiltrating lymphocyte. Cancer Res. 1999;59:6230–6238. [PubMed] [Google Scholar]
- 17.Roszkowski JJ, Yu DC, Rubinstein MP, McKee MD, Cole DJ, Nishimura MI. CD8-independent tumor cell recognition is a property of the T cell receptor and not the T cell. J Immunol. 2003;170:2582–2589. doi: 10.4049/jimmunol.170.5.2582. [DOI] [PubMed] [Google Scholar]
- 18.Rosenberg SA, Restifo NP. Adoptive cell transfer as personalized immunotherapy for human cancer. Science. 2015;348:62–68. doi: 10.1126/science.aaa4967. [DOI] [PMC free article] [PubMed] [Google Scholar]
- 19.Morgan RA, Dudley ME, Wunderlich JR, Hughes MS, Yang JC, Sherry RM, Royal RE, Topalian SL, Kammula US, Restifo NP, Zheng Z, Nahvi A, de Vries CR, Rogers-Freezer LJ, Mavroukakis SA, Rosenberg SA. Cancer regression in patients after transfer of genetically engineered lymphocytes. Science. 2006;314:126–129. doi: 10.1126/science.1129003. [DOI] [PMC free article] [PubMed] [Google Scholar]
- 20.Johnson LA, Morgan RA, Dudley ME, Cassard L, Yang JC, Hughes MS, Kammula US, Royal RE, Sherry RM, Wunderlich JR, Lee CC, Restifo NP, Schwarz SL, Cogdill AP, Bishop RJ, Kim H, Brewer CC, Rudy SF, VanWaes C, Davis JL, Mathur A, Ripley RT, Nathan DA, Laurencot CM, Rosenberg SA. Gene therapy with human and mouse T-cell receptors mediates cancer regression and targets normal tissues expressing cognate antigen. Blood. 2009;114:535–546. doi: 10.1182/blood-2009-03-211714. [DOI] [PMC free article] [PubMed] [Google Scholar]
- 21.Robbins PF, Morgan RA, Feldman SA, Yang JC, Sherry RM, Dudley ME, Wunderlich JR, Nahvi AV, Helman LJ, Mackall CL, Kammula US, Hughes MS, Restifo NP, Raffeld M, Lee CC, Levy CL, Li YF, El-Gamil M, Schwarz SL, Laurencot C, Rosenberg SA. Tumor regression in patients with metastatic synovial cell sarcoma and melanoma using genetically engineered lymphocytes reactive with NY-ESO-1. J Clin Oncol. 2011;29:917–924. doi: 10.1200/JCO.2010.32.2537. [DOI] [PMC free article] [PubMed] [Google Scholar]
- 22.Morgan RA, Chinnasamy N, Abate-Daga D, Gros A, Robbins PF, Zheng Z, Dudley ME, Feldman SA, Yang JC, Sherry RM, Phan GQ, Hughes MS, Kammula US, Miller AD, Hessman CJ, Stewart AA, Restifo NP, Quezado MM, Alimchandani M, Rosenberg AZ, Nath A, Wang T, Bielekova B, Wuest SC, Akula N, McMahon FJ, Wilde S, Mosetter B, Schendel DJ, Laurencot CM, Rosenberg SA. Cancer regression and neurological toxicity following anti-MAGE-A3 TCR gene therapy. J Immunother. 2013;36:133–151. doi: 10.1097/CJI.0b013e3182829903. [DOI] [PMC free article] [PubMed] [Google Scholar]
- 23.Parkhurst MR, Yang JC, Langan RC, Dudley ME, Nathan DA, Feldman SA, Davis JL, Morgan RA, Merino MJ, Sherry RM, Hughes MS, Kammula US, Phan GQ, Lim RM, Wank SA, Restifo NP, Robbins PF, Laurencot CM, Rosenberg SA. T cells targeting carcinoembryonic antigen can mediate regression of metastatic colorectal cancer but induce severe transient colitis. Mol Ther. 2011;19:620–626. doi: 10.1038/mt.2010.272. [DOI] [PMC free article] [PubMed] [Google Scholar]
- 24.Dudley ME, Wunderlich JR, Yang JC, Sherry RM, Topalian SL, Restifo NP, Royal RE, Kammula U, White DE, Mavroukakis SA, Rogers LJ, Gracia GJ, Jones SA, Mangiameli DP, Pelletier MM, Gea-Banacloche J, Robinson MR, Berman DM, Filie AC, Abati A, Rosenberg SA. Adoptive cell transfer therapy following non-myeloablative but lymphodepleting chemotherapy for the treatment of patients with refractory metastatic melanoma. J Clin Oncol. 2005;23:2346–2357. doi: 10.1200/JCO.2005.00.240. [DOI] [PMC free article] [PubMed] [Google Scholar]
- 25.Ellebaek E, Iversen TZ, Junker N, Donia M, Engell-Noerregaard L, Met Ö, Hölmich LR, Andersen RS, Hadrup SR, Andersen MH, thor Straten P, Svane IM. Adoptive cell therapy with autologous tumor infiltrating lymphocytes and low-dose Interleukin-2 in metastatic melanoma patients. J Transl Med. 2012;10:169. doi: 10.1186/1479-5876-10-169. [DOI] [PMC free article] [PubMed] [Google Scholar]
- 26.Andersen R, Donia M, Ellebaek E, Borch TH, Kongsted P, Iversen TZ, Hölmich LR, Hendel HW, Met Ö, Andersen MH, Thor Straten P, Svane IM. Long-lasting complete responses in patients with metastatic melanoma after adoptive cell therapy with tumor-infiltrating lymphocytes and an attenuated IL2 regimen. Clin Cancer Res. 2016;22:3734–3745. doi: 10.1158/1078-0432.CCR-15-1879. [DOI] [PubMed] [Google Scholar]
- 27.Davis-Harrison RL, Armstrong KM, Baker BM. Two different T cell receptors use different thermodynamic strategies to recognize the same peptide/MHC ligand. J Mol Biol. 2005;346:533–550. doi: 10.1016/j.jmb.2004.11.063. [DOI] [PubMed] [Google Scholar]
- 28.Blevins SJ, Baker BM. Using global analysis to extend the accuracy and precision of binding measurements with T cell receptors and their peptide/MHC ligands. Front Mol Biosci. 2017;4:2. doi: 10.3389/fmolb.2017.00002. [DOI] [PMC free article] [PubMed] [Google Scholar]
- 29.Huang J, Zarnitsyna VI, Liu B, Edwards LJ, Jiang N, Evavold BD, Zhu C. The kinetics of two-dimensional TCR and pMHC interactions determine T-cell responsiveness. Nature. 2010;464:932–936. doi: 10.1038/nature08944. [DOI] [PMC free article] [PubMed] [Google Scholar]
- 30.Martinez RJ, Andargachew R, Martinez HA, Evavold BD. Low-affinity CD4+ T cells are major responders in the primary immune response. Nat Commun. 2016;7:13848. doi: 10.1038/ncomms13848. [DOI] [PMC free article] [PubMed] [Google Scholar]
- 31.Dudley ME, Wunderlich JR, Yang JC, Hwu P, Schwartzentruber DJ, Topalian SL, Sherry RM, Marincola FM, Leitman SF, Seipp CA, Rogers-Freezer L, Morton KE, Nahvi A, Mavroukakis SA, White DE, Rosenberg SA. A phase I study of nonmyeloablative chemotherapy and adoptive transfer of autologous tumor antigen-specific T lymphocytes in patients with metastatic melanoma. J Immunother. 2002;25:243–251. doi: 10.1097/00002371-200205000-00007. [DOI] [PMC free article] [PubMed] [Google Scholar]
- 32.Norell H, Zhang Y, McCracken J, Martins da Palma T, Lesher A, Liu Y, Roszkowski JJ, Temple A, Callender GG, Clay T, Orentas R, Guevara-Patiño J, Nishimura MI. CD34-based enrichment of genetically engineered human T cells for clinical use results in dramatically enhanced tumor targeting. Cancer Immunol Immunother. 2010;59:851–862. doi: 10.1007/s00262-009-0810-8. [DOI] [PMC free article] [PubMed] [Google Scholar]
- 33.Ahmadi M, King JW, Xue SA, Voisine C, Holler A, Wright GP, Waxman J, Morris E, Stauss HJ. CD3 limits the efficacy of TCR gene therapy in vivo. Blood. 2011;118:3528–3537. doi: 10.1182/blood-2011-04-346338. [DOI] [PubMed] [Google Scholar]
- 34.Simms PE, Ellis TM. Utility of flow cytometric detection of CD69 expression as a rapid method for determining poly- and oligoclonal lymphocyte activation. Clin Diagn Lab Immunol. 1996;3:301–304. doi: 10.1128/cdli.3.3.301-304.1996. [DOI] [PMC free article] [PubMed] [Google Scholar]
- 35.Cerdan C, Martin Y, Courcoul M, Brailly H, Mawas C, Birg F, Olive D. Prolonged IL-2 receptor alpha/CD25 expression after T cell activation via the adhesion molecules CD2 and CD28. Demonstration of combined transcriptional and post-transcriptional regulation. J Immunol. 1992;149:2255–2261. [PubMed] [Google Scholar]
- 36.Ahmadzadeh M, Johnson LA, Heemskerk B, Wunderlich JR, Dudley ME, White DE, Rosenberg SA. Tumor antigen-specific CD8 T cells infiltrating the tumor express high levels of PD-1 and are functionally impaired. Blood. 2009;114:1537–1544. doi: 10.1182/blood-2008-12-195792. [DOI] [PMC free article] [PubMed] [Google Scholar]
- 37.Gros A, Robbins PF, Yao X, Li YF, Turcotte S, Tran E, Wunderlich JR, Mixon A, Farid S, Dudley ME, Hanada K, Almeida JR, Darko S, Douek DC, Yang JC, Rosenberg SA. PD-1 identifies the patient-specific CD8+ tumor-reactive repertoire infiltrating human tumors. J Clin Invest. 2014;124:2246–2259. doi: 10.1172/JCI73639. [DOI] [PMC free article] [PubMed] [Google Scholar]
- 38.Inozume T, Hanada K, Wang QJ, Ahmadzadeh M, Wunderlich JR, Rosenberg SA, Yang JC. Selection of CD8+PD-1+ lymphocytes in fresh human melanomas enriches for tumor-reactive T cells. J Immunother. 2010;33:956–964. doi: 10.1097/CJI.0b013e3181fad2b0. [DOI] [PMC free article] [PubMed] [Google Scholar]
- 39.Fourcade J, Sun Z, Benallaoua M, Guillaume P, Luescher IF, Sander C, Kirkwood JM, Kuchroo V, Zarour HM. Upregulation of Tim-3 and PD-1 expression is associated with tumor antigen-specific CD8+ T cell dysfunction in melanoma patients. J Exp Med. 2010;207:2175–2186. doi: 10.1084/jem.20100637. [DOI] [PMC free article] [PubMed] [Google Scholar]
- 40.Wolchok JD, Kluger H, Callahan MK, Postow MA, Rizvi NA, Lesokhin AM, Segal NH, Ariyan CE, Gordon RA, Reed K, Burke MM, Caldwell A, Kronenberg SA, Agunwamba BU, Zhang X, Lowy I, Inzunza HD, Feely W, Horak CE, Hong Q, Korman AJ, Wigginton JM, Gupta A, Sznol M. Nivolumab plus ipilimumab in advanced melanoma. N Engl J Med. 2013;369:122–133. doi: 10.1056/NEJMoa1302369. [DOI] [PMC free article] [PubMed] [Google Scholar]
- 41.Topalian SL, Sznol M, McDermott DF, Kluger HM, Carvajal RD, Sharfman WH, Brahmer JR, Lawrence DP, Atkins MB, Powderly JD, Leming PD, Lipson EJ, Puzanov I, Smith DC, Taube JM, Wigginton JM, Kollia GD, Gupta A, Pardoll DM, Sosman JA, Hodi FS. Survival, durable tumor remission, and long-term safety in patients with advanced melanoma receiving nivolumab. J Clin Oncol. 2014;32:1020–1030. doi: 10.1200/JCO.2013.53.0105. [DOI] [PMC free article] [PubMed] [Google Scholar]
- 42.Ribas A, Camacho LH, Lopez-Berestein G, Pavlov D, Bulanhagui CA, Millham R, Comin-Anduix B, Reuben JM, Seja E, Parker CA, Sharma A, Glaspy JA, Gomez-Navarro J. Antitumor activity in melanoma and anti-self responses in a phase I trial with the anti-cytotoxic T lymphocyte-associated antigen 4 monoclonal antibody CP-675,206. J Clin Oncol. 2005;23:8968–8977. doi: 10.1200/JCO.2005.01.109. [DOI] [PubMed] [Google Scholar]
- 43.Schadendorf D, Hodi FS, Robert C, Weber JS, Margolin K, Hamid O, Patt D, Chen TT, Berman DM, Wolchok JD. Pooled analysis of long-term survival data from phase II and phase III trials of ipilimumab in unresectable or metastatic melanoma. J Clin Oncol. 2015;33:1889–1894. doi: 10.1200/JCO.2014.56.2736. [DOI] [PMC free article] [PubMed] [Google Scholar]
- 44.Callahan MK, Wolchok JD, Allison JP. Anti-CTLA-4 antibody therapy: immune monitoring during clinical development of a novel immunotherapy. Semin Oncol. 2010;37:473–484. doi: 10.1053/j.seminoncol.2010.09.001. [DOI] [PMC free article] [PubMed] [Google Scholar]
- 45.Yuan J, Ginsberg B, Page D, Li Y, Rasalan T, Gallardo HF, Xu Y, Adams S, Bhardwaj N, Busam K, Old LJ, Allison JP, Jungbluth A, Wolchok JD. CTLA-4 blockade increases antigen-specific CD8(+) T cells in prevaccinated patients with melanoma: three cases. Cancer Immunol Immunother. 2011;60:1137–1146. doi: 10.1007/s00262-011-1011-9. [DOI] [PMC free article] [PubMed] [Google Scholar]
- 46.Kitano S, Tsuji T, Liu C, Hirschhorn-Cymerman D, Kyi C, Mu Z, Allison JP, Gnjatic S, Yuan JD, Wolchok JD. Enhancement of tumor-reactive cytotoxic CD4+ T cell responses after ipilimumab treatment in four advanced melanoma patients. Cancer Immunol Res. 2013;1:235–244. doi: 10.1158/2326-6066.CIR-13-0068. [DOI] [PMC free article] [PubMed] [Google Scholar]
- 47.Baitsch L, Legat A, Barba L, Fuertes Marraco SA, Rivals JP, Baumgaertner P, Christiansen-Jucht C, Bouzourene H, Rimoldi D, Pircher H, Rufer N, Matter M, Michielin O, Speiser DE. Extended co-expression of inhibitory receptors by human CD8 T-cells depending on differentiation, antigen-specificity and anatomical localization. PLoS ONE. 2012;7:e30852. doi: 10.1371/journal.pone.0030852. [DOI] [PMC free article] [PubMed] [Google Scholar]
- 48.Viguier M, Lemaître F, Verola O, Cho MS, Gorochov G, Dubertret L, Bachelez H, Kourilsky P, Ferradini L. Foxp3 expressing CD4+CD25(high) regulatory T cells are overrepresented in human metastatic melanoma lymph nodes and inhibit the function of infiltrating T cells. J Immunol. 2004;173:1444–1453. doi: 10.4049/jimmunol.173.2.1444. [DOI] [PubMed] [Google Scholar]
- 49.Watts TH. TNF/TNFR family members in costimulation of T cell responses. Annu Rev Immunol. 2005;23:23–68. doi: 10.1146/annurev.immunol.23.021704.115839. [DOI] [PubMed] [Google Scholar]
- 50.Croft M, So T, Duan W, Soroosh P. The significance of OX40 and OX40L to T-cell biology and immune disease. Immunol Rev. 2009;229:173–191. doi: 10.1111/j.1600-065X.2009.00766.x. [DOI] [PMC free article] [PubMed] [Google Scholar]
- 51.Vetto JT, Lum S, Morris A, Sicotte M, Davis J, Lemon M, Weinberg A. Presence of the T-cell activation marker OX-40 on tumor infiltrating lymphocytes and draining lymph node cells from patients with melanoma and head and neck cancers. Am J Surg. 1997;174:258–265. doi: 10.1016/S0002-9610(97)00139-6. [DOI] [PubMed] [Google Scholar]
- 52.Weinberg AD, Rivera MM, Prell R, Morris A, Ramstad T, Vetto JT, Urba WJ, Alvord G, Bunce C, Shields J. Engagement of the OX-40 receptor in vivo enhances antitumor immunity. J Immunol. 2000;164:2160–2169. doi: 10.4049/jimmunol.164.4.2160. [DOI] [PubMed] [Google Scholar]
- 53.Ladányi A, Somlai B, Gilde K, Fejös Z, Gaudi I, Tímár J. T-cell activation marker expression on tumor-infiltrating lymphocytes as prognostic factor in cutaneous malignant melanoma. Clin Cancer Res. 2004;10:521–530. doi: 10.1158/1078-0432.CCR-1161-03. [DOI] [PubMed] [Google Scholar]
- 54.Sallusto F, Lanzavecchia A. Understanding dendritic cell and T-lymphocyte traffic through the analysis of chemokine receptor expression. Immunol Rev. 2000;177:134–140. doi: 10.1034/j.1600-065X.2000.17717.x. [DOI] [PubMed] [Google Scholar]
- 55.Martinez RJ, Evavold BD. Lower affinity T cells are critical components and active participants of the immune response. Front Immunol. 2015;6:468. doi: 10.3389/fimmu.2015.00468. [DOI] [PMC free article] [PubMed] [Google Scholar]
- 56.Coulie PG, Somville M, Lehmann F, Hainaut P, Brasseur F, Devos R, Boon T. Precursor frequency analysis of human cytolytic T lymphocytes directed against autologous melanoma cells. Int J Cancer. 1992;50:289–297. doi: 10.1002/ijc.2910500220. [DOI] [PubMed] [Google Scholar]
- 57.Tan MP, Gerry AB, Brewer JE, Melchiori L, Bridgeman JS, Bennett AD, Pumphrey NJ, Jakobsen BK, Price DA, Ladell K, Sewell AK. T cell receptor binding affinity governs the functional profile of cancer-specific CD8+ T cells. Clin Exp Immunol. 2015;180:255–270. doi: 10.1111/cei.12570. [DOI] [PMC free article] [PubMed] [Google Scholar]
- 58.Aleksic M, Liddy N, Molloy PE, Pumphrey N, Vuidepot A, Chang KM, Jakobsen BK. Different affinity windows for virus and cancer-specific T-cell receptors: implications for therapeutic strategies. Eur J Immunol. 2012;42:3174–3179. doi: 10.1002/eji.201242606. [DOI] [PMC free article] [PubMed] [Google Scholar]
- 59.Baitsch L, Baumgaertner P, Devêvre E, Raghav SK, Legat A, Barba L, Wieckowski S, Bouzourene H, Deplancke B, Romero P, Rufer N, Speiser DE. Exhaustion of tumor-specific CD8+ T cells in metastases from melanoma patients. J Clin Invest. 2011;121:2350–2360. doi: 10.1172/JCI46102. [DOI] [PMC free article] [PubMed] [Google Scholar]
- 60.Chapuis AG, Thompson JA, Margolin KA, Rodmyre R, Lai IP, Dowdy K, Farrar EA, Bhatia S, Sabath DE, Cao J, Li Y, Yee C. Transferred melanoma-specific CD8+ T cells persist, mediate tumor regression, and acquire central memory phenotype. Proc Natl Acad Sci USA. 2012;109:4592–4597. doi: 10.1073/pnas.1113748109. [DOI] [PMC free article] [PubMed] [Google Scholar]
- 61.Yee C, Thompson JA, Byrd D, Riddell SR, Roche P, Celis E, Greenberg PD. Adoptive T cell therapy using antigen-specific CD8+ T cell clones for the treatment of patients with metastatic melanoma: in vivo persistence, migration, and antitumor effect of transferred T cells. Proc Natl Acad Sci USA. 2002;99:16168–16173. doi: 10.1073/pnas.242600099. [DOI] [PMC free article] [PubMed] [Google Scholar]
- 62.McGranahan N, Furness AJ, Rosenthal R, Ramskov S, Lyngaa R, Saini SK, Jamal-Hanjani M, Wilson GA, Birkbak NJ, Hiley CT, Watkins TB, Shafi S, Murugaesu N, Mitter R, Akarca AU, Linares J, Marafioti T, Henry JY, Van Allen EM, Miao D, Schilling B, Schadendorf D, Garraway LA, Makarov V, Rizvi NA, Snyder A, Hellmann MD, Merghoub T, Wolchok JD, Shukla SA, Wu CJ, Peggs KS, Chan TA, Hadrup SR, Quezada SA, Swanton C. Clonal neoantigens elicit T cell immunoreactivity and sensitivity to immune checkpoint blockade. Science. 2016;351:1463–1469. doi: 10.1126/science.aaf1490. [DOI] [PMC free article] [PubMed] [Google Scholar]
- 63.Lu YC, Yao X, Crystal JS, Li YF, El-Gamil M, Gross C, Davis L, Dudley ME, Yang JC, Samuels Y, Rosenberg SA, Robbins PF. Efficient identification of mutated cancer antigens recognized by T cells associated with durable tumor regressions. Clin Cancer Res. 2014;20:3401–3410. doi: 10.1158/1078-0432.CCR-14-0433. [DOI] [PMC free article] [PubMed] [Google Scholar]
- 64.Campesato LF, Barroso-Sousa R, Jimenez L, Correa BR, Sabbaga J, Hoff PM, Reis LF, Galante PA, Camargo AA. Comprehensive cancer-gene panels can be used to estimate mutational load and predict clinical benefit to PD-1 blockade in clinical practice. Oncotarget. 2015;6:34221–34227. doi: 10.18632/oncotarget.5950. [DOI] [PMC free article] [PubMed] [Google Scholar]
- 65.Snyder A, Makarov V, Merghoub T, Yuan J, Zaretsky JM, Desrichard A, Walsh LA, Postow MA, Wong P, Ho TS, Hollmann TJ, Bruggeman C, Kannan K, Li Y, Elipenahli C, Liu C, Harbison CT, Wang L, Ribas A, Wolchok JD, Chan TA. Genetic basis for clinical response to CTLA-4 blockade in melanoma. N Engl J Med. 2014;371:2189–2199. doi: 10.1056/NEJMoa1406498. [DOI] [PMC free article] [PubMed] [Google Scholar]
- 66.Roszik J, Haydu LE, Hess KR, Oba J, Joon AY, Siroy AE, Karpinets TV, Stingo FC, Baladandayuthapani V, Tetzlaff MT, Wargo JA, Chen K, Forget MA, Haymaker CL, Chen JQ, Meric-Bernstam F, Eterovic AK, Shaw KR, Mills GB, Gershenwald JE, Radvanyi LG, Hwu P, Futreal PA, Gibbons DL, Lazar AJ, Bernatchez C, Davies MA, Woodman SE. Novel algorithmic approach predicts tumor mutation load and correlates with immunotherapy clinical outcomes using a defined gene mutation set. BMC Med. 2016;14:168. doi: 10.1186/s12916-016-0705-4. [DOI] [PMC free article] [PubMed] [Google Scholar]
- 67.Rabinovich GA, Gabrilovich D, Sotomayor EM. Immunosuppressive strategies that are mediated by tumor cells. Annu Rev Immunol. 2007;25:267–296. doi: 10.1146/annurev.immunol.25.022106.141609. [DOI] [PMC free article] [PubMed] [Google Scholar]
- 68.Hodi FS, Butler M, Oble DA, Seiden MV, Haluska FG, Kruse A, Macrae S, Nelson M, Canning C, Lowy I, Korman A, Lautz D, Russell S, Jaklitsch MT, Ramaiya N, Chen TC, Neuberg D, Allison JP, Mihm MC, Dranoff G. Immunologic and clinical effects of antibody blockade of cytotoxic T lymphocyte-associated antigen 4 in previously vaccinated cancer patients. Proc Natl Acad Sci USA. 2008;105:3005–3010. doi: 10.1073/pnas.0712237105. [DOI] [PMC free article] [PubMed] [Google Scholar]
- 69.Quezada SA, Peggs KS, Curran MA, Allison JP. CTLA4 blockade and GM-CSF combination immunotherapy alters the intratumor balance of effector and regulatory T cells. J Clin Invest. 2006;116:1935–1945. doi: 10.1172/JCI27745. [DOI] [PMC free article] [PubMed] [Google Scholar]
- 70.Martens A, Wistuba-Hamprecht K, Geukes Foppen M, Yuan J, Postow MA, Wong P, Romano E, Khammari A, Dreno B, Capone M, Ascierto PA, Di Giacomo AM, Maio M, Schilling B, Sucker A, Schadendorf D, Hassel JC, Eigentler TK, Martus P, Wolchok JD, Blank C, Pawelec G, Garbe C, Weide B. Baseline peripheral blood biomarkers associated with clinical outcome of advanced melanoma patients treated with ipilimumab. Clin Cancer Res. 2016;22:2908–2918. doi: 10.1158/1078-0432.CCR-15-2412. [DOI] [PMC free article] [PubMed] [Google Scholar]
- 71.Khong HT, Wang QJ, Rosenberg SA. Identification of multiple antigens recognized by tumor-infiltrating lymphocytes from a single patient: tumor escape by antigen loss and loss of MHC expression. J Immunother. 2004;27:184–190. doi: 10.1097/00002371-200405000-00002. [DOI] [PMC free article] [PubMed] [Google Scholar]
- 72.Maeurer MJ, Gollin SM, Martin D, Swaney W, Bryant J, Castelli C, Robbins P, Parmiani G, Storkus WJ, Lotze MT. Tumor escape from immune recognition: lethal recurrent melanoma in a patient associated with downregulation of the peptide transporter protein TAP-1 and loss of expression of the immunodominant MART-1/Melan-A antigen. J Clin Invest. 1996;98:1633–1641. doi: 10.1172/JCI118958. [DOI] [PMC free article] [PubMed] [Google Scholar]
- 73.Rosenberg SA, Yang JC, Robbins PF, Wunderlich JR, Hwu P, Sherry RM, Schwartzentruber DJ, Topalian SL, Restifo NP, Filie A, Chang R, Dudley ME. Cell transfer therapy for cancer: lessons from sequential treatments of a patient with metastatic melanoma. J Immunother. 2003;26:385–393. doi: 10.1097/00002371-200309000-00001. [DOI] [PMC free article] [PubMed] [Google Scholar]
- 74.Villadangos JA. Antigen-specific impairment of adoptive T-cell therapy against cancer: players, mechanisms, solutions and a hypothesis. Immunol Rev. 2016;272:169–182. doi: 10.1111/imr.12433. [DOI] [PubMed] [Google Scholar]
- 75.Huang AC, Postow MA, Orlowski RJ, Mick R, Bengsch B, Manne S, Xu W, Harmon S, Giles JR, Wenz B, Adamow M, Kuk D, Panageas KS, Carrera C, Wong P, Quagliarello F, Wubbenhorst B, D’Andrea K, Pauken KE, Herati RS, Staupe RP, Schenkel JM, McGettigan S, Kothari S, George SM, Vonderheide RH, Amaravadi RK, Karakousis GC, Schuchter LM, Xu X, Nathanson KL, Wolchok JD, Gangadhar TC, Wherry EJ. T-cell invigoration to tumour burden ratio associated with anti-PD-1 response. Nature. 2017;545:60–65. doi: 10.1038/nature22079. [DOI] [PMC free article] [PubMed] [Google Scholar]
Associated Data
This section collects any data citations, data availability statements, or supplementary materials included in this article.