

Abstract
Obesity-related changes in adipose tissue leukocytes, in particular adipose tissue macrophages (ATMs) and dendritic cells (ATDCs), are implicated in metabolic inflammation, insulin resistance, and altered regulation of adipocyte function. We evaluated stromal cell and white adipose tissue (WAT) expansion dynamics with high fat diet (HFD) feeding for 3-56 days, quantifying ATMs, ATDCs, endothelial cells (ECs), and preadipocytes (PAs) in visceral epididymal WAT and subcutaneous inguinal WAT. To better understand mechanisms of the early response to obesity, we evaluated ATM proliferation and lipid accumulation. ATMs, ATDCs and ECs increased with rapid WAT expansion, with ATMs derived primarily from a CCR2-independent resident population. WAT expansion stimulated proliferation in resident ATMs and ECs, but not CD11c+ ATMs or ATDCs. ATM proliferation was unperturbed in Csf2- and Rag1-deficient mice with WAT expansion. Additionally, ATM apoptosis decreased with WAT expansion, and proliferation and apoptosis reverted to baseline with weight loss. Adipocytes reached maximal hypertrophy at 28 days of HFD, coinciding with a plateau in resident ATM accumulation and the appearance of lipid-laden CD11c+ ATMs in visceral epididymal WAT. ATM increases were proportional to tissue expansion and adipocyte hypertrophy, supporting adipocyte-mediated regulation of resident ATMs. The appearance of lipid-laden CD11c+ ATMs at peak adipocyte size supports a role in responding to ectopic lipid accumulation within adipose tissue. In contrast, ATDCs increase independently of proliferation and may be derived from circulating precursors. These changes precede and establish the setting in which large-scale adipose tissue infiltration of CD11c+ ATMs, inflammation, and adipose tissue dysfunction contribute to insulin resistance.
Keywords: Adipose tissue dendritic cell, foam cell, obesity, adipocyte, apoptosis
INTRODUCTION
Obesity and metabolic syndrome are becoming increasingly prevalent, and raise the risk of type 2 diabetes, cardiovascular disease, and cancer [1, 2]. Activation of leukocytes and inflammation in adipose tissue are established links between obesity and development of metabolic dysfunction [3–6]. Adipose tissue macrophages (ATMs) are the predominant leukocyte in lean, metabolically healthy adipose tissue, and accumulate in obesity to constitute up to 40% of the stromal cells [3, 7].
ATM subtypes are diverse and typically classified along a spectrum of classical M1-like and alternatively activated M2-like phenotypes [7]. Diet induced obesity in mice stimulates C-C chemokine receptor 2 (CCR2)-dependent accumulation of M1-like CD11c+ ATMs in adipose tissue [8, 9]. This leads to the predominance of a proinflammatory phenotype that accumulates internal lipids and contributes to insulin resistance [9–13]. Furthermore, disrupting polarization of tissue resident alternatively activated ATMs contributes to metabolic dysfunction [14–16]. These studies support the importance of M2-like tissue resident ATMs in tissue homeostasis. Indeed, ATMs with M2-like profiles are implicated in regulation of adipocyte hypertrophy and extracellular matrix remodeling, both of which are important for maintaining metabolically healthy adipose tissue [17–19]. Thus, phenotypic changes in both CD11c+ and resident ATMs with obesity may together strongly influence adipose tissue health and contribute to development of insulin resistance.
A better understanding of adaptive and maladaptive responses to obesity requires investigation of early changes in adipose tissue and few studies have comprehensively examined adipose tissue stromal cell dynamics with rapid fat accumulation in adult mice. Recruitment from circulating monocytes and self-renewal of resident ATMs are potential mechanisms for increased ATM quantity in chronic obesity [20, 21]. Adipocyte hypertrophy and increased ATM quantity are observed within three days of feeding mice a high fat diet (HFD), but it is unclear the origin of these ATMs [22]. Therefore, how recruitment or self-renewal contribute to ATMs and other stromal cells in early obesity is not resolved.
In this study, we sought to address these gaps and understand stromal cell dynamics with short term nutrient excess in different white adipose tissue (WAT) depots. In mice fed HFD across a time course of 3-56 days, ATMs, ATDCs, and ECs increased very early in concert with rapid WAT mass expansion. The ATM increase was due to resident proliferation primarily in visceral epididymal WAT that did not require CCR2-mediated monocyte infiltration, Csf2 (GM-CSF), or presence of adipose tissue lymphocytes. The quantity of resident ATMs correlated with adipocyte hypertrophy, peaking when adipocyte hypertrophy plateaued, and decreasing with weight loss. Proliferation was detected in CD11c+ ATMs and ATDCs, but was largely unchanged with HFD exposure. Furthermore, CD11c+ ATMs became lipid-laden at peak adipocyte size in epididymal WAT, supporting a role in lipid buffering for this specific ATM population.
MATERIALS AND METHODS
Animals and animal care
Mice used for these experiments included C57BL/6J (WT; Jackson Laboratories 000664), Cx3cr1CreERT (Jackson 021160), floxed-stop-tdTomato (tdTomato, Jackson 007914), Cx3cr1CreERT:tdTomato F1 offspring from homozygous parent strains, Ccr2−/− (kindly provided by Dr. Beth Moore), Csf2−/− (GM-CSF−/−, kindly provided by Dr. John Osterholzer), and Rag1−/− (B6.129S7-Rag1tm1Mom/J, Jackson 002216). Age matched mice were within one week by date of birth. Male mice were fed ad libitum a control normal chow diet (ND; 13.4% fat, 5L0D LabDiet) or high fat diet (HFD; 60% calories from fat, Research Diets D12492) for the indicated amount of time starting at 8-12 weeks old. Tamoxifen (Millipore Sigma, T5648) dissolved in corn oil was administered to Cx3Cr1CreERT:tdTomato mice twice 48 hours apart at 150 mg/kg by subcutaneous injection behind the hindlimb. PKH26 cell linker kit for phagocytic cell labeling (Millipore Sigma, PKH26PCL) was used for in vivo labeling of macrophages following manufacturer instructions, by 500 μl intraperitoneal injection of a 1 μM working solution [23]. At sacrifice, Cx3cr1CreERT:tdTomato mice were perfused with 10 ml saline solution through the left ventricle to reduce blood cells within tissues. Animals were housed in a specific pathogen-free facility with a 12 h light/12 h dark cycle and given free access to food and water. All mouse procedures were approved by the Institutional Animal Care and Use Committee (IACUC) at the University of Michigan (Animal Welfare Assurance Number A3114-01) and in compliance with the Institute of Laboratory Animal Research Guide for the Care and Use of Laboratory Animals.
Tissue and cell isolation
Visceral epididymal (eWAT) and subcutaneous inguinal (iWAT) adipose tissues were collected and weighed at indicated time points. For cell isolations, adipose tissue was fractionated and flow cytometry performed as described [24]. Stromal vascular cells (SVCs) were isolated after a 30 minute digestion of finely minced adipose tissue in 1 mg/ml collagenase II (Millipore Sigma, C6885), followed by 100 μm straining, NH4Cl red blood cell (RBC) lysis, and counting. Blood was collected from tail tips and placed on ice for 30 minutes to one hour until water lysis of RBCs. Bone marrow was collected from hindlimb bones (femur, tibia, and fibula) by flushing with PBS, then made into a single cell solution followed by RBC lysis. Spleens were removed, washed, pressed through a 70 μm cell strainer, and made into a single cell suspension by pipetting, followed by RBC lysis.
Flow cytometry
After RBC lysis, mouse cells were blocked for 10 minutes in Fc block solution (anti-CD16/32, eBioscience), followed by surface (30 minutes) and intracellular staining (45 minutes) with conjugated primary antibodies. For intracellular staining, cells were additionally fixed and permeabilized for 45 minutes at room temperature using the Foxp3/Transcription Factor Staining Buffer Set (eBioscience, 00-5523-00), and stained for 45 minutes at room temperature. SVCs were stained with CD45, CD64, CD11c, and CD31 to stratify ATMs (CD45+CD64+CD11c+/−), ATDCs (CD45+CD64−CD11c+), preadipocytes (PA; CD45−CD31−), and endothelial cells (EC; CD45−CD31+). The following antibodies were used: anti-CD45 (clone 30-F11), anti-CD11c (N418), anti-CD31 (390), anti-Ki67(SolA15), anti-CD3e (145-2C11), anti-Ly6C (HK1.4), and anti-CD115 (AFS98) (eBioscience), and anti-CD64 (X54-5/7.1) (BD Pharmingen and BioLegend). Live cells were identified using LIVE/DEAD Fixable Violet or Yellow Dead Cell Stain (Life Technologies, L34955, L34959). Neutral lipids were detected using LipidTOX Deep Red Neutral Lipid Stain (Life Technologies, H34477). Bone marrow and spleen progenitors were stained and analyzed as described [25]. Data from stained cells were collected using BD FACSCanto II and LSRFortessa flow cytometers, and for Cx3cr1CreERT:tdTomato experiments a BD FACSAria III sorter was used. Flow cytometry data were analyzed using FlowJo software v10.1 (TreeStar), using manual compensation and fluorescence minus one controls to guide gating within each experiment. Initial gates identified CD45+ or CD45− singlets (Supplemental Figure S1A).
Human samples
Human male and female visceral adipose tissue was collected during bariatric surgery of patients with obesity (See Figure 7C) with Institutional Review Board approval (HUM00074075) from the University of Michigan and Ann Arbor Veterans Administration Hospital. Tissue was finely minced by hand using surgical scissors (DR Instruments, 4SB), then digested in 1 mg/ml collagenase II (Life Technologies, 17101015) for 1 hour and processed as for mouse adipose tissue to obtain single cell suspensions of SVCs. Cells were then stained with anti-CD45 (HI30) from eBioscience, and anti-CD64 (10.1) and anti-CD11c (3.9) from Biolegend. Neutral lipids were detected using LipidTOX Deep Red as for mouse cells, and Bodipy 493/503 (Life Technologies, D3922) for imaging flow cytometry. Flow cytometry data were collected using a BD FACSCanto II flow cytometer and data were analyzed as for mouse cells using similar gating (Supplemental Figure S1A). Imaging flow cytometry data were collected on an ImagestreamX Mark II and analyzed using IDEAS software v6.0 (Amnis).
Figure 7.
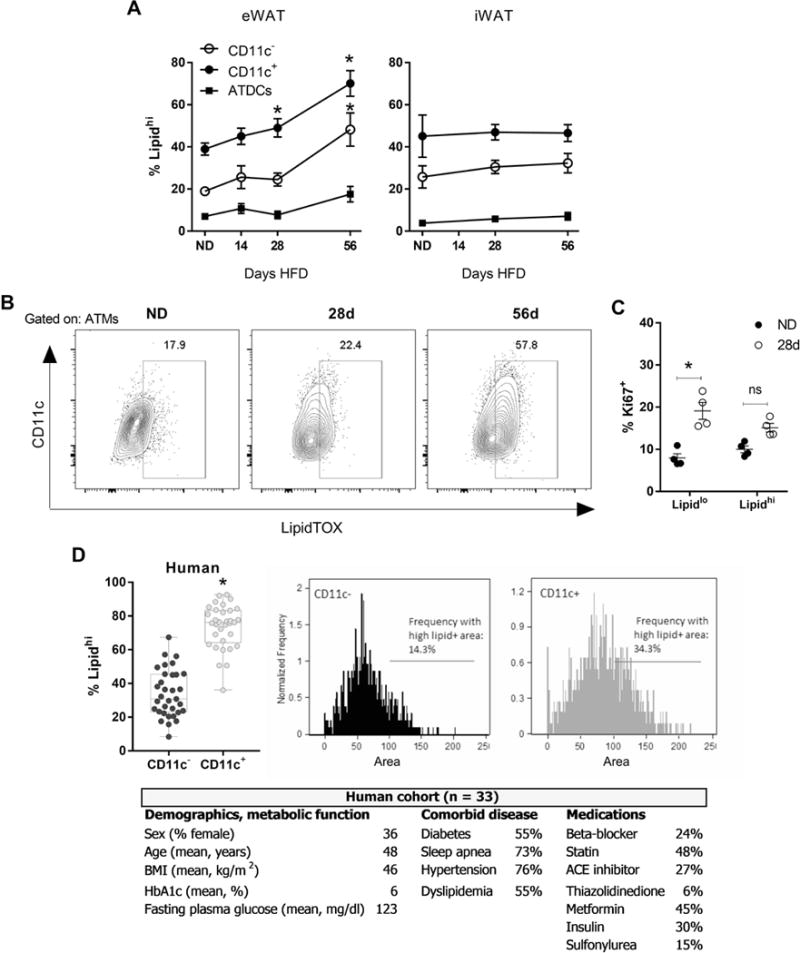
Lipid-laden ATMs develop once adipocyte hypertrophy is maximal. (A) Frequency of lipidhi CD11c− ATMs, CD11c+ ATMs, and ATDCs in eWAT and iWAT in mice fed ND or HFD for 14-56 days. (B) Representative flow plots of ATMs and the frequency of lipidhi cells as determined by LipidTOX staining in mice fed ND or HFD for 28-56 days. (C) Frequency of proliferation in lipidlo vs. lipidhi mouse ATMs. (D) Lipid content of omental CD11c− and CD11c+ ATMs in human obesity (n=33), by flow cytometry to determine frequency of lipidhi cells, and by imaging flow cytometry to quantify the lipid+ area within each cell. Demographics, measures of metabolic function, comorbid disease, and medications are given for the human cohort. HbA1c, glycated hemoglobin. *, p<0.05.
Imaging and adipocyte sizing
Confocal images were taken with a Zeiss 710 confocal microscope. Adipose tissue samples for adipocyte sizing were fixed in 10% formalin for a minimum of 48 hours prior to paraffin embedding, H&E staining, and sectioning. Images of sections were collected across at least four fields per condition at 10× magnification, using autofluorescence in a channel for Texas Red to detect adipocyte cell membrane edges and produce binary images. ImageJ was then used to automatically identify individual adipocytes as regions of interest based on autofluorescent edges, then area was quantified within all regions of interest for each field.
Statistics
Results are presented as mean ± SEM unless otherwise stated. Differences between groups were determined using an unpaired two-tailed t-test with Welch’s correction or a one-way ANOVA with Holm-Sidak’s multiple comparison test. Significant differences are indicated by single asterisk (*) and are by comparison to the ND group unless otherwise stated. If data failed the Brown-Forsythe test they were log transformed for analysis. The significance level α was set at 0.05. Data were analyzed using Prism software v7.00 for Windows (GraphPad).
Online Supplemental Material
Two supplemental figures provide our gating strategy and data on SVC composition and densities (Supplemental Figure S1), and data in support of Cre-mediated recombination experiments (Supplemental Figure S2).
RESULTS
The quantity of ATMs, ATDCs, and endothelial cells increases with rapid WAT expansion
To determine the effect of early obesity on adipose tissue SVCs, we fed male mice a 60% HFD ad libitum for 3 days, 7 days or 14 days (3d, 7d, 14d). While total body weight was not significantly different between ND and HFD fed animals after 14d, eWAT and iWAT depot weights increased rapidly with HFD over the time course, doubling by 3d and increasing up to 3 fold in weight by 14d for eWAT (Figure 1A, B). As there are no clearly established standards for SVC quantification, after flow cytometry we evaluated the “quantity” of SVC types in the depot (cells per fat pad), “frequency” in SVCs (% of live cells), and the “density” of cells (cells per gram of WAT mass). The total number of SVCs per fat pad increased in eWAT by 14d and in iWAT from 3-14d (Figure 1C). To identify changes in the composition of the SVCs during this time course, we quantified leukocytes (ATMs and ATDCs), PAs, and ECs – three primary stromal cell populations that account for >90% of the total SVCs (Supplemental Figure S1B). The quantity of CD45+ leukocytes per fat pad increased by approximately 2 fold after 3 days of HFD in both eWAT and iWAT, however their density was unchanged up to 14 days (Figure 1C; Supplemental Figure S1C). This demonstrates that the quantity of adipose tissue leukocytes increases in proportion to the increase in nutrient deposition and storage in both eWAT and iWAT.
Figure 1.
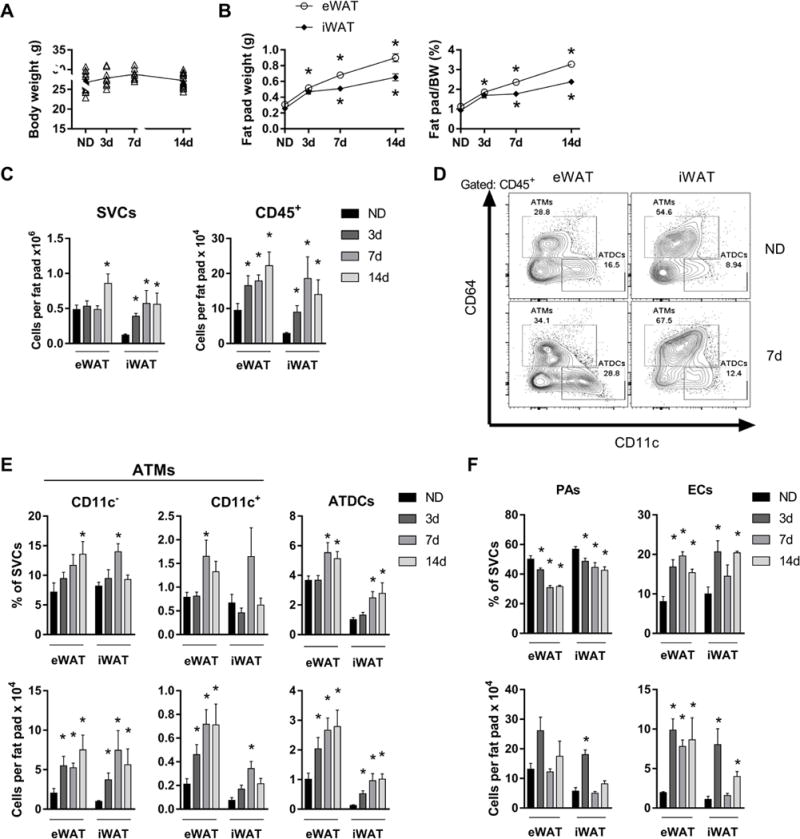
Increased ATMs, ATDCs, and endothelial cells with rapid WAT expansion. Body weights (A) and fat pad weights normalized to body weight (BW) (B) of mice fed ND or 60% HFD for 3-14 days. (C) Quantity of SVCs and CD45+ leukocytes in eWAT and iWAT. (D) Representative flow plots showing ATM and ATDC frequencies in eWAT and iWAT for ND and mice fed HFD for 7 days. (E and F) Frequency and quantity of CD11c− ATMs, CD11c+ ATMs, ATDCs, preadipocytes (PAs), and endothelial cells (ECs) in ND and in mice fed HFD for 3-14 days. *, p<0.05.
The percentage of total ATMs and ATDCs in SVCs increased at 7d and 14d HFD in eWAT and iWAT (Figure 1D, E). As expected, the vast majority of ATMs were CD11c− representing resident ATMs, which predominate in lean mice (Figure 1E). While the quantity of CD11c− ATMs per fat pad was increased at all time points in both depots, their frequency in SVCs was only significantly increased at 14d in eWAT and only at 7d in iWAT. CD11c+ ATMs in lean mice were a minor population representing 10-15% of all ATMs. Their frequency was modestly elevated at 7d in eWAT, but their total quantity per fat pad was significantly elevated at all time points for eWAT and at 7d for iWAT. Together these data suggest an increase in both ATM subtypes with rapid WAT expansion that retains CD11c− ATMs as the dominant ATM subtype.
ATDC frequency increased significantly at 7-14d in both depots and quantity per fat pad increased at all time points (Figure 1D, E). Although ATDC quantity was greater in eWAT compared with iWAT at all time points, the increase in iWAT ATDCs induced by HFD was greater, at about 4-fold over ND controls, compared to about 2-fold for eWAT at 3d. Furthermore, while ATDC density was not different for eWAT, ATDCs density was greater in iWAT at all time points (Supplemental Figure S1C), suggesting unique stimuli for ATDC expansion in iWAT.
Among non-leukocytes, PA decreased as a frequency of SVCs and by density in both depots (Figure 1F; Supplemental Figure S1C). There was a non-significant trend towards an increase in PA quantity per fat pad in eWAT, and iWAT PA quantity increased significantly only at 3d. In contrast, ECs increased in frequency and quantity in both depots identified as early as 3d of HFD exposure. Altogether, these data show rapid WAT expansion with HFD is associated with an increase in ATMs, ATDCs, and ECs without significant changes in PAs.
ATM accumulation with rapid WAT expansion is not due to monocyte expansion and is independent of CCR2
The increase in quantity of ATMs may indicate a contribution from circulating monocyte precursors that are known to be induced in obesity [25]. We examined monocyte stem cell precursors in the bone marrow and spleen with short term HFD, but found little change in hematopoietic progenitors in either tissue, with the exception of reduced BM pre-GMs at 7-14d (Figure 2A). CD115+ and Ly6Chi monocytes decreased in bone marrow at 7-14d and in the spleen at 3-14d. We also observed variability in other bone marrow and spleen populations suggesting decreases at some time points, including for CD11b+ and CD11c+ cells, and Ly6G+ neutrophils. Furthermore, upon examining blood with 7d HFD exposure, we found no changes in the frequency of blood CD45+ leukocytes, CD115+ or Ly6Chi monocytes, or Ly6G+ neutrophils, and no change in hematopoietic progenitors (not shown). Taken together, these data suggest that short term HFD induces myeloid cells exit from spleen and bone marrow without changing their overall frequency in the blood.
Figure 2.
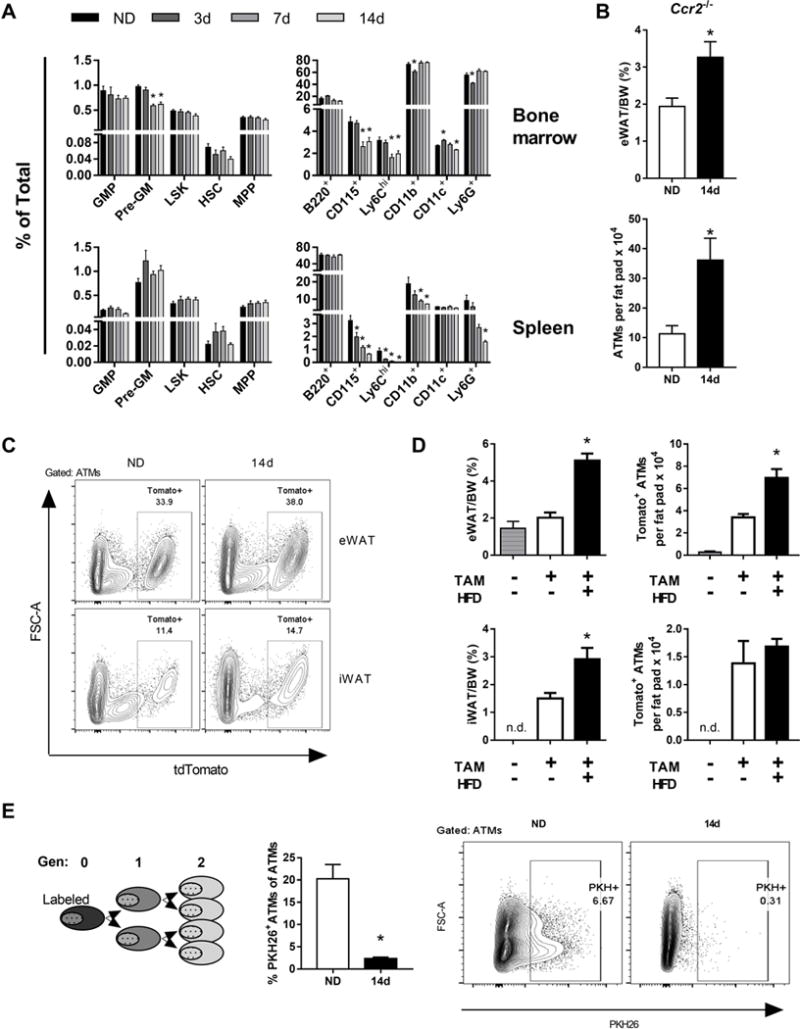
Accumulation of ATMs in rapid WAT expansion independent of monocytes and CCR2. (A) Frequencies of monocyte stem cell precursors in bone marrow and spleen in ND and mice fed HFD for 3-7 days. (B) eWAT weights normalized to body weight (BW) and ATM quantities in CCR2−/− mice were fed ND or HFD for 14 days. (C) Representative flow plots from Cx3cr1-CreERT-IRES-YFP::tdTomatofl/fl mice with induced expression of Tomato in ATMs, 14 weeks after tamoxifen treatment. eWAT and iWAT are shown for mice fed ND or HFD for 14 days. (D) eWAT and iWAT weights and quantity of Tomato+ ATMs with or without tamoxifen and HFD feeding for 14 days. (E) Phagocyte-specific PKH26 labeling of ATMs in mice fed ND or HFD for 14 days. *, p<0.05.
This may indicate that monocytes are trafficking to peripheral tissues and CCL2-CCR2 is a well characterized pathway leading to ATM accumulation [8, 26]. To determine the contribution of circulating monocytes and CCR2-dependent trafficking to ATM accumulation with short term HFD, we examined ATM quantity in Ccr2−/− mice, which are deficient in peripheral blood monocytes. With 14d HFD, ATM quantity increased in Ccr2−/− mice to a similar degree as WT mice demonstrating that this type of ATM accumulation is CCR2-independent (Figure 2B) and likely from the resident ATM pool.
To confirm changes in resident ATMs with rapid WAT expansion, we employed a mouse model with inducible genetic labeled resident ATMs in the setting of unlabeled monocytes. Cx3cr1-CreERT-IRES-YFP::tdTomatofl/fl (Cx3cr1::tdTomato) mice were treated with tamoxifen (TAM) to induce expression of Tomato in myeloid cells (Supplemental Figure S2A). Recombination efficiency was >90% as determined by flow cytometry analysis of blood monocytes five days after TAM treatment (Supplemental Figure S2B). Imaging of whole adipose showed strong YFP and Tomato overlap in the eWAT 12 weeks after TAM treatment (Supplemental Figure S2C). 14 weeks after TAM injection bone marrow and blood monocytes were Tomato−, while 30% of the eWAT ATMs were Tomato+ (Supplemental Figure S2D; Figure 2C). Tomato+ SVCs were predominantly ATMs (Supplemental Figure S2E). This model allowed us to assess the contribution of circulating monocytes to the ATM pool with HFD. With 14d HFD, eWAT and iWAT underwent rapid WAT expansion (Figure 2C, D). Compared to ND, HFD fed mice had increased quantity of Tomato+ ATMs in eWAT but not iWAT. No change was observed in a small subset of Tomato+ ATDCs (data not shown). This supports an in situ expansion of resident ATMs with early HFD exposure.
As another approach, we labeled ATMs with the phagocyte specific PKH26 dye prior to feeding ND or HFD for 14d. ATM proliferation is measured by serial dilution of the PKH26 dye (Figure 2E). With 14d HFD, while ND controls retained PKH26+ ATMs, the vast majority of ATMs in HFD mice showed a decrease in PKH26 labeling. Overall, these data support that proliferating tissue resident ATMs account for the increase in ATMs with rapid WAT expansion and that circulating monocytes are not a major contributor.
CD11c− ATMs and ECs increase quantity by proliferation during rapid WAT expansion
To directly examine the dynamics of proliferation in ATMs and ATDCs with rapid WAT expansion, we quantified Ki67+ cells by flow cytometry with 3-14d HFD feeding. The frequency and quantity of Ki67+ ATMs and Ki67+ CD11c− ATMs increased at all time points in eWAT, but only transiently at 7d in iWAT (Figure 3A, B). The frequency of Ki67+ CD11c+ ATMs did not change in eWAT and there was a minor transient increase at 7d in iWAT, while the quantity of Ki67+CD11c+ ATMs increased at 7-14d for eWAT and at 7d for iWAT (Figure 3B). The frequency of Ki67+ ATDCs did not change in eWAT, but increased at 7-14d in iWAT (Figure 3A, B), suggesting that there may be depot-specific mechanisms contributing to ATDC content.
Figure 3.
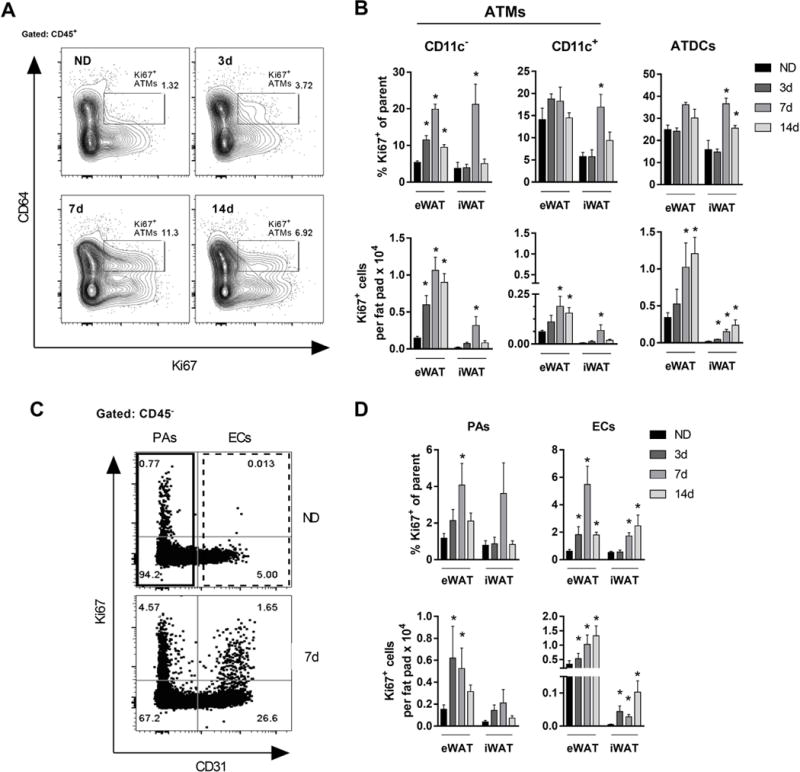
Proliferation of CD11c− ATMs and ECs during rapid WAT expansion. (A) Representative flow plots showing Ki67+ (proliferating) ATMs. (B) Frequency and quantity of proliferating CD11c− ATMs, CD11c+ ATMs, and ATDCs in mice fed ND or HFD for 3-24 days. (C) Representative flow plots showing frequency of proliferating PAs and ECs in mice fed ND or HFD for 7 days. (D) Frequency and quantity of proliferating PAs and ECs in mice fed ND or HFD for 3-14 days. *, p<0.05.
In contrast to ATMs, the frequency of proliferating PAs transiently increased at 7d HFD but represented a small proportion of the PA pool (Figure 3C, D). By quantity, Ki67+ PAs were increased compared to ND at 3-7d HFD, but remained at low numbers. In contrast, an increased frequency of proliferating ECs correlated with an increase in their overall frequency and quantity over 14 days of HFD (Figure 3C, D; Figure 1F). Taken together, our data suggest that rapid WAT expansion induces a strong proliferative response in CD11c− ATMs and ECs that correlates with their increase in SVCs.
Weight loss decreases ATM proliferation
We next investigated whether ATM proliferation is permanently altered by rapid WAT expansion by evaluating the effect of weight loss induced by withdrawal of HFD. Three cohorts of mice were generated: normal diet for 28d (ND), normal diet for 14d and switched to HFD for 14d (14d HFD), and 14d HFD and switched to normal diet for 14d (14d off) (Figure 4A). Both cohorts receiving HFD gained weight with the exposure and the 14d off mice returned to weights that matched the ND group (Figure 4B). The eWAT weights were increased with 14d HFD compared to ND and 14d off mice (Figure 4C).
Figure 4.
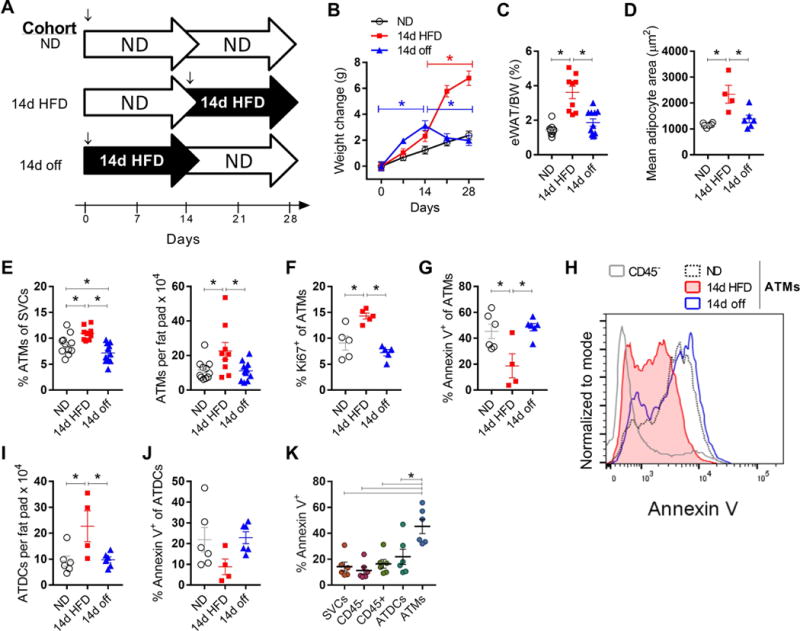
Weight loss decreases ATM proliferation. (A) Feeding scheme for ND, 14d HFD, and 14d off cohorts. ↓, mice were age matched at 8-9 weeks of age for start of HFD. (B and C) Weight gain and eWAT weights for each cohort. (D) eWAT mean adipocyte size. (E) ATM frequency and quantity. (F) ATM proliferating frequency. (G) Apoptosis in ATMs, measured by frequency of Annexin V+ cells. (H) Representative histogram of flow cytometry data showing Annexin V in ATMs and CD45− SVCs. (I-J) Quantity of ATDCs in each cohort and frequency of Annexin V+ ATDCs. (K) Comparison of Annexin V staining among SVCs. *, p<0.05.
ATM frequency, quantity, and proliferating frequency were increased in the 14d HFD group and in 14d off returned to levels similar to ND (Figure 4E, F). To determine whether apoptosis contributed to the changes in ATM quantity with weight gain and loss, we evaluated Annexin V+ ATMs. The frequency of Annexin V+ ATMs was reduced in 14d HFD suggesting that ATM proliferation was accompanied by a suppression of ATM apoptosis. Weight loss returned the quantity of apoptotic ATMs back to levels similar to lean mice (Figure 4G, H). We further evaluated ATDC quantity and apoptosis. Similar to ATMs, ATDCs increased with 14d HFD compared to ND and 14d off (Figure 4I). While Annexin V+ ATDCs decreased in trend with 14d HFD, there was no significant difference between groups (Figure 4J). Comparing across SVCs in lean eWAT, ATMs had the highest frequency of Annexin V+ cells (Figure 4K). Taken together, these data indicate that ATM proliferation is not permanently elevated by diet-induced eWAT expansion and suggest that weight loss decreases ATM proliferation. These data also suggest that decreased ATM apoptosis is also a feature of rapid fat expansion that contributes to ATM accumulation.
ATM proliferation is not stimulated by lipolysis and is independent of GM-CSF, T and B cells
We considered several potential mechanisms for ATM proliferation in early obesity. To explore the possibility that adipocyte lipolysis and subsequent free fatty acid release stimulates ATM proliferation, we treated lean mice with a beta 3-adrinergic agonist (CL316,243) for three days. No significant changes in ATM quantity or proliferation were observed with this treatment (Figure 5A).
Figure 5.
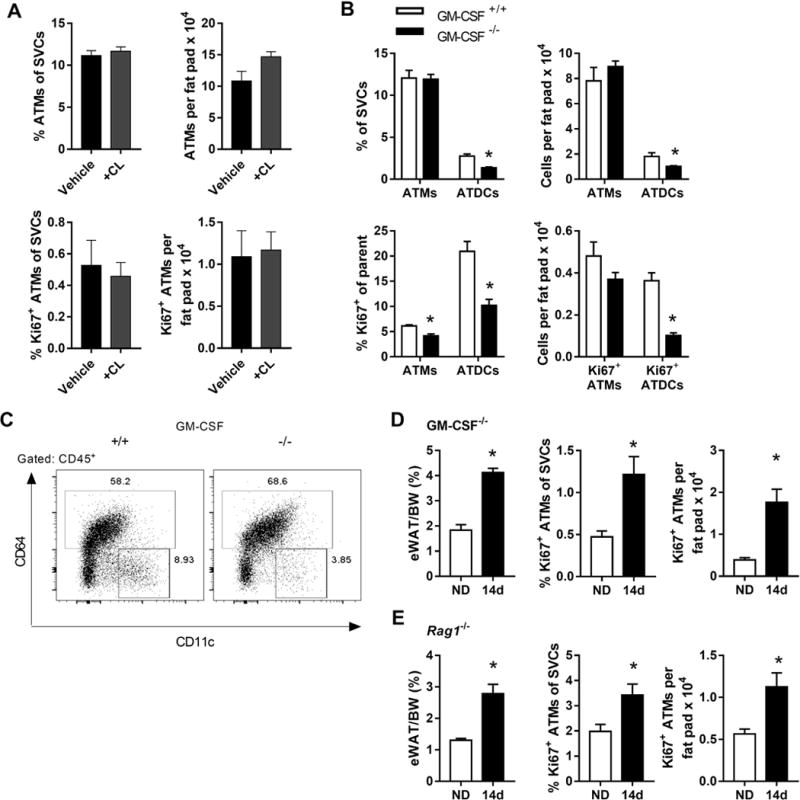
ATM proliferation is unchanged with lipolysis and independent of GM-CSF, T and B cells. (A) Lean mice were treated with vehicle or the beta 3-adrinergic agonist CL316,243 (CL). Frequency and quantity of ATMs and proliferating ATMs were quantified. (B) Frequency and quantity of ATMs and ATDCs, and frequency and quantity of proliferating ATMs and ATDCs in WT (GM-CSF+/+) and GM-CSF−/− mice. (C) Representative flow plots showing the frequency of ATDCs (CD64−CD11c+) in GM-CSF+/+ vs. GM-CSF−/− mice. (D and E) eWAT weights and frequency and quantity of proliferating ATMs in GM-CSF−/− mice (D) and Rag1−/− mice (E) fed ND or HFD for 14 days. *, p<0.05.
Since GM-CSF can stimulate myeloid cell proliferation and differentiation, we examined ATM proliferation in WT (GM-CSF+/+) and GM-CSF−/− mice. We found no difference in ATM quantity between mice, but lower overall ATDC content in GM-CSF−/− mice, consistent with previous reports [27] (Figure 5B,C). The frequency of proliferating ATMs and ATDCs was also lower in GM-CSF−/− ND mice (Figure 5B). When GM-CSF−/− mice were fed a 14d HFD, we observed rapid WAT expansion and similar induction of proliferating ATMs as in WT mice (Figure 5D). For ATDCs, ND and 14d HFD proliferation was not different (not shown).
ATM-T cell interactions promote inflammation in adipose tissue [28]. To determine whether ATM-T cell interactions affect ATM proliferation during rapid WAT expansion, we used Rag1−/− mice that lack mature T and B cells. With 14d HFD, the ATM proliferative response was intact in Rag1−/− mice indicating that T and B cells are not required for ATM proliferation (Figure 5E). Altogether, these data suggest that GM-CSF may help maintain proliferation in a steady-state population of ATDCs. However GM-CSF and T cells are not required for the ATM proliferative response to rapid WAT expansion.
Adipocyte size corresponds to peak resident ATM but not ATDC quantity
Our weight loss data suggested that resident ATM quantity is regulated proportional to adipocyte hypertrophy in response to HFD. We therefore hypothesized that peak adipocyte size would correlate with peak resident ATM quantity. To evaluate this, we fed mice a HFD for up to 56d and examined ATM and ATDC quantity and proliferation. eWAT weights continued to increase beyond 14d and plateaued at 28-56d (Figure 6A). Consistent with this, adipocyte hypertrophy also peaked by 28d and did not change substantially with further HFD feeding (Figure 6B, C). This indicates that eWAT adipocytes reach maximum capacity for lipid storage by 28d of 60% HFD feeding.
Figure 6.
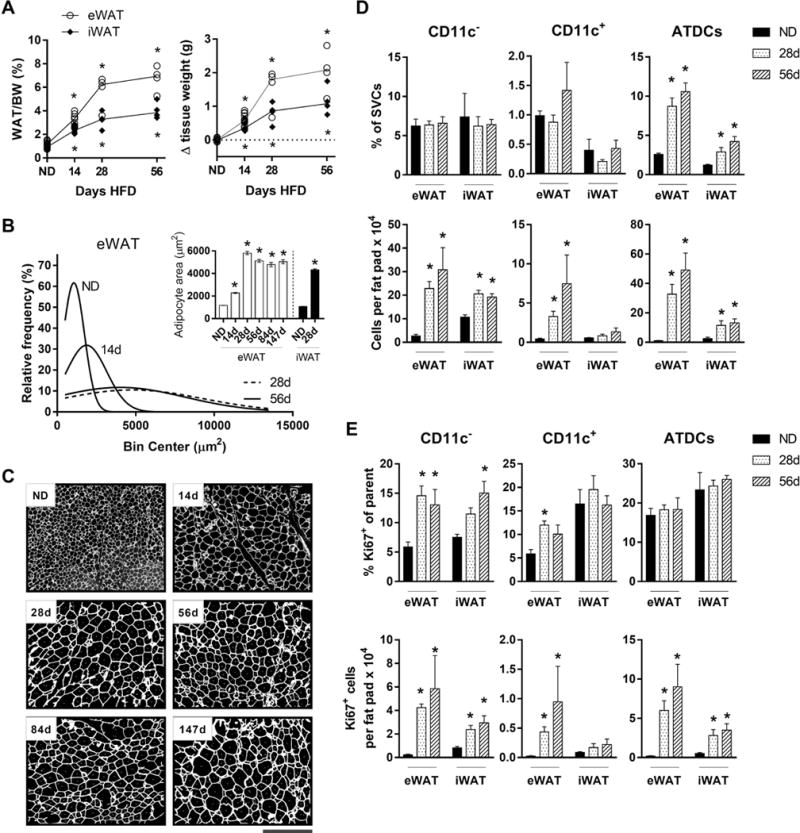
Adipocyte size corresponds to peak resident ATM but not ATDC quantity. (A). WAT weight and change in tissue weight in mice fed ND or HFD for 14-58 days. Upper and lower asterisks indicate significant for eWAT and iWAT, respectively, compared to ND controls. (B) eWAT adipocyte sizing curve approximations in mice fed ND or HFD for 14-58 days. Inset, mean eWAT and iWAT adipocyte sizes at given time points. (C) Images showing eWAT adipocyte sizes in mice fed ND or HFD for 14-147 days (see Materials and Methods). Scale bar represents 500 μm. (D and E) Frequency, quantity, and proliferating frequency and quantity of CD11c− ATMs, CD11c+ ATMs, and ATDCs in mice fed ND or HFD for 28-56 days. *, p<0.05.
CD11c− and CD11c+ ATM frequencies were unchanged in total stromal cells with 28-56d HFD compared to ND. However, their quantities peaked at 28d and remained stable up to 56d (Figure 1E; Figure 6D). For CD11c− ATMs, proliferating frequency was similarly elevated compared to the early HFD time points, suggesting an early peak in proliferation (Figure 6E). The quantity of proliferating CD11c− ATMs mirrored overall quantities, with a peak at 28d that was sustained. For CD11c+ ATMs, an increase in proliferation was observed at 28d, only in eWAT. ATDCs increased substantially at 28-56d, with stable proliferation frequency (Figure 6D, E).
Overall, these data suggest that resident ATMs proliferate early and reach a peak quantity that corresponds to peak adipocyte size at 28d. The maintenance of a higher frequency of proliferating CD11c− ATMs from 28-56d HFD with no significant increase in overall quantity suggests negative regulation of ATMs. In contrast, CD11c+ ATMs and ATDCs show little relative change in proliferation as adipocyte size and tissue size increase. However, their increase in quantity points to recruitment as a primary mechanism.
Lipid-laden ATMs develop once adipocyte hypertrophy is maximal
It has been suggested that proinflammatory, M1-like ATMs accumulate lipids and contribute to a population of adipose tissue foam cells in chronic obesity [11, 13, 29]. However, the early dynamics of ATM lipid accumulation are unknown. Given the potential role of ATMs in lipid buffering [13], we hypothesized that the appearance of lipid-laden ATMs would coincide with peak adipocyte size and that differences in lipid accumulation in CD11c− and CD11c+ ATMs may highlight their functional differences.
ATM lipid content in mice was assessed using neutral lipid stains to identify lipidhi populations with 14-56d HFD. In lean mice, the frequency of lipidhi CD11c+ ATMs was higher than for CD11c− ATMs and ATDCs in eWAT and iWAT (Figure 7A, B). By 28d HFD, the frequency of lipidhi CD11c+ ATMs was increased compared to lean mice. By 56d, when adipocyte hypertrophy has plateaued, both CD11c+ and CD11c− ATM subsets had increased frequency of lipidhi cells, while lipidhi ATDCs remained rare. The frequency of lipidhi ATMs did not increase between 56d and 126d HFD (data not shown), suggesting that ATMs reached a maximal capacity for lipid storage by 56d. At all time points, the frequency of CD11c− ATMs was significantly lower than CD11c+ ATMs. No increase in lipidhi cells was observed for ATMs or ATDCs in iWAT. In addition, we found no lipidhi circulating cells at any time point, indicating that lipid accumulation occurs within the tissue, and no lipid accumulation was detected in tissue lymphocytes (data not shown).
We next assessed the overlap between proliferating and lipid-laden ATMs. An increase in proliferation frequency was observed in lipidlo ATMs with 28d HFD, whereas no difference in proliferation was found for lipid-laden ATMs (Figure 7C). These data are consistent with CD11c− ATMs as a distinct proliferating subtype that are lower in lipid content.
To corroborate observations of lipid accumulation in mouse CD11c+ ATMs in human cells, we evaluated human SVCs derived from omental WAT that was sampled from patients with obesity who were undergoing bariatric surgery. We used neutral lipid stains as for the mouse cells to detect lipid accumulation. Consistent with mouse data, flow cytometry analysis of human ATMs across 33 patients showed that the frequency of lipidhi CD11c+ ATMs was greater than lipidhi CD11c− ATMs (Figure 7D). By imaging flow cytometry to determine the area of lipid accumulation in human ATM subtypes, we found that many more CD11c+ ATMs had high lipid+ area than CD11c− ATMs.
Taken together, these data confirm that formation of lipid-laden ATMs between 28d and 56d HFD indeed coincides with adipocytes reaching peak size and lipid storage capacity. Furthermore, we found lipid accumulation in primarily CD11c+ ATMs in mice and humans. In mice we found that only eWAT ATMs accumulate lipids at these time points, highlighting depot-specific responses to HFD.
DISCUSSION
Previously ATM proliferation was reported after 70 days of HFD exposure and in genetic obesity [20, 21]. Our data establish proliferation as a mechanism of resident ATM maintenance much earlier in adipose tissue during rapid WAT expansion with HFD feeding. ATM proliferation and increased quantity were consistent across several mouse strains, supporting the importance of resident ATMs during rapid WAT expansion. Rapid proliferation of ATMs is consistent with other studies of tissue macrophages that self-renew quickly in settings of inflammation [30]. In addition, higher proliferation was accompanied by decreased apoptosis in rapid WAT expansion, and both proliferation and apoptosis returned to baseline with weight loss. Lower ATM apoptosis with short-term HFD feeding fits with prior studies by us and others showing reduced apoptosis with >100 days HFD feeding [31, 32].
Mature lymphocytes were not required for maintenance of ATM proliferation, consistent with previous reports by us and others showing similar ATM accumulation in Rag1−/− compared with Rag1+/+ with HFD exposure [22, 31]. These data fit with ATM-T cell interactions occurring in chronic rather than early obesity, consistent with alterations in CD8+ and CD4+ adipose tissue T cells that first appear around 56 days of HFD feeding [33–36]. GM-CSF was also not required for ATM proliferation. MCP-1 (CCL2) is a proposed regulator of ATM proliferation in chronic obesity, and is also increased early in HFD feeding [20, 22]. However, our data in CCR2−/− mice suggest that the ATM increase is independent of MCP-1/CCR2 signaling and monocyte recruitment in early obesity. The mediators of ATM increase during rapid WAT expansion require further investigation, but candidates include IL4, IL6, and OPN [30, 37–43].
Adipocyte hypertrophy is observed as early as 3 days of HFD and is associated with elevated chemoattractants and surface expression of stress markers in obesity [22, 36, 44]. These observations support the possibility that adipocyte hypertrophy regulates ATM proliferation. Consistent with this idea, ATM proliferation increased with rapid adipocyte hypertrophy in early obesity and decreased with weight loss and tissue contraction. Furthermore, peak adipocyte size corresponded to a peak quantity of resident ATMs at 28 days of HFD exposure (Figure 8A). The appearance of lipid-laden ATMs after adipocytes reached peak size supports a role for ATMs in adipose tissue lipid buffering, as suggested by prior studies [11, 13, 45, 46]. While both ATM subtypes accumulated lipids by 56 days of HFD feeding, their different lipid content highlights potential functional differences. Both human and mouse CD11c+ ATMs had higher lipid content, which has been previously associated with an M1-like phenotype and altered regulation of lysosomes [10, 11, 13]. Notably, lipid accumulation occurred prior to large scale CD11c+ ATM infiltration that we see at 84 days of HFD feeding [9, 23].
Figure 8.
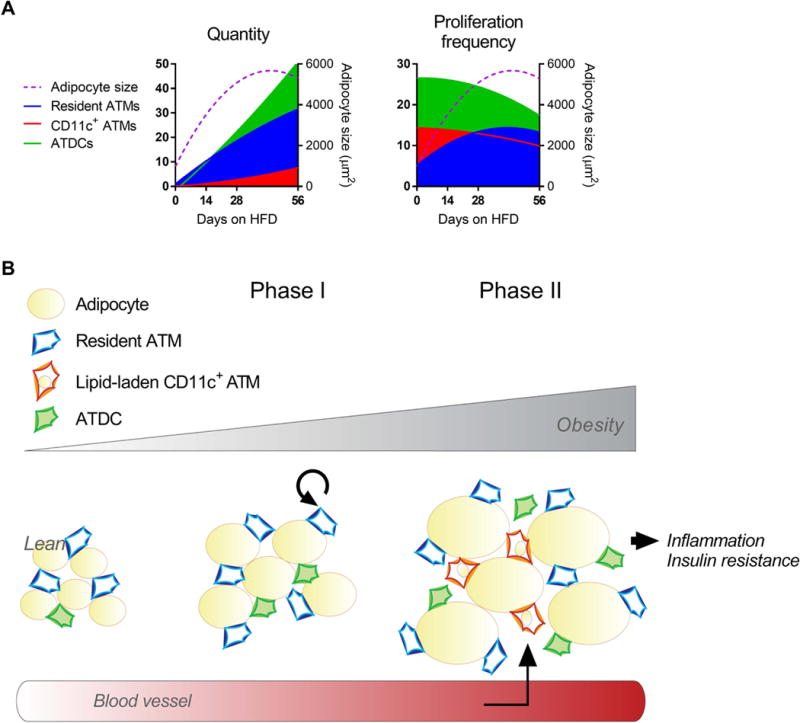
A model for stromal cell and tissue dynamics in early obesity. (A) Representations of quantity and proliferation frequency for resident ATMs, CD11c+ ATMs, and ATDCs (left Y axes), and adipocyte size (right Y axes). (B) An illustration of stromal cell and adipocyte dynamics, with two major phases dominating early obesity. Phase I encompasses rapid WAT expansion, resident ATM proliferation and ATDC infiltration. In Phase II, adipocyte stress at peak size cues ATM lipid accumulation and CD11c+ ATM recruitment.
While CD11c+ ATMs have an established role in adipose tissue inflammation and metabolic dysfunction in obesity [9, 47], less is known about the role of resident ATMs in tissue function. Recently, resident CD206+ ATMs were suggested to inhibit adipogenesis and promote adipocyte hypertrophy and insulin resistance [17]. This would fit with our data early in HFD feeding at 7-14d, showing increased resident ATM quantity with no change in PAs (Figure 1E, Supplemental Figure S1). In addition, early and progressive worsening of insulin sensitivity has been observed over short-term HFD feeding [22], correlating with increased resident ATMs. Resident ATMs have also been associated with tissue remodeling and fibrosis in obesity [7, 46, 48, 49], but understanding the full range of phenotypic changes in resident ATMs requires further study.
In addition, ATDCs may be influential early in obesity in promoting tissue dysfunction, as CCR7−/− mice that have fewer ATDCs have metabolic improvement with 8w HFD exposure compared with CCR7+/+ mice [26]. In contrast to resident ATMs, we found that ATDCs increased in early obesity with little change in proliferation. These data are consistent with previous work showing an increase in ATDCs at 56 days of HFD feeding [26]. Furthermore, previously we found that ATDCs with 7 days of HFD feeding were CCR2-dependent [26]. Taken together, our data suggest recruitment as a primary mechanism for ATDC accumulation in early obesity.
Finally, as visceral adipose tissue is associated with obesity-related sequelae [2], here we contrasted eWAT and iWAT in early obesity. eWAT gained greater mass and had modestly higher adipocyte size compared with iWAT, consistent with [41, 50]. Increased resident ATMs and CD11c+ ATMs, and development of lipid-laden ATMs, were all primarily observed in eWAT in early obesity. In support of depot-specific responses that occur earlier or exclusively in eWAT, adipogenesis has been shown at 28 days of HFD feeding in eWAT, but not until 84 days in iWAT [51]. While crown-like structures (CLS) that suggest dying adipocytes are very rare in the HFD durations we used up to 56 days [52, 53], longer-term HFD feeding has been shown to promote CLS earlier in eWAT compared to iWAT [53].
These data help us to understand the sequence of events in early obesity that precede development of systemic insulin resistance. Our data suggest a model with two major phases in early obesity that encompass adipocyte and stromal cell dynamics (Figure 8B). The first phase includes rapid WAT expansion by adipocyte hypertrophy. Depletion of ATMs relative to adipocyte size cues early resident ATM proliferation, and ATDC recruitment. In the second phase, adipocyte stress at peak size cues ATM lipid accumulation and recruitment of new CD11c+ ATMs. Recruited CD11c+ ATMs then begin to contribute to crown-like structures and inflammation after several weeks of HFD exposure [21, 22], and may participate in ATM-T cell interactions that potentiate inflammation.
In conclusion, understanding the relationship between adipose tissue growth and immune cell dynamics provides insight into normal adipose tissue function, and how normal tissue growth may become maladaptive in chronic nutrient excess. We find that resident ATMs and recruited ATDCs predominate in early obesity. Proliferation of resident ATMs contributes to their increased quantity in concert with decreased ATM apoptosis in response to adipocyte hypertrophy in the early phases of high fat diet feeding. CD11c+ ATMs with high lipid accumulation potential may be recruited earlier in visceral adipose tissue than subcutaneous as adipocytes reach maximal lipid storage capacity.
Supplementary Material
Summary sentence.
Proliferation of resident adipose tissue macrophages but not dendritic cells maintains quantity proportional to adipose tissue expansion, and lipid-laden macrophages appear after maximal adipocyte hypertrophy.
Acknowledgments
We thank the University of Michigan Cancer Center Histology Core, the University of Michigan Flow Cytometry Core and Dave Adams for technical assistance. We thank Niko Kaciroti for assistance with statistical analyses. This work was supported by NIH grants T32DK101357 and F32DK105676 (LAM), DK115190 and DK097449 (RWO), and DK090262 (CNL).
ABBREVIATIONS
- ATM
adipose tissue macrophage
- ATDC
adipose tissue dendritic cell
- CCR2
C-C chemokine receptor 2
- EC
endothelial cell
- eWAT
epididymal white adipose tissue
- HFD
high fat diet
- iWAT
inguinal white adipose tissue
- ND
normal diet
- PA
preadipocyte
- SVC
stromal vascular cell
Footnotes
AUTHORSHIP
LAM and CNL conceived and designed experiments and wrote the manuscript. LAM, SK, CG, JBD, LG, GM-S, BFZ, HL, and KS performed experiments. LAM, KS, RWO and CNL analyzed and interpreted data.
CONFLICT OF INTEREST DISCLOSURE
The authors declare no conflict of interest.
References
- 1.Unger RH, Scherer PE. Gluttony, sloth and the metabolic syndrome: A roadmap to lipotoxicity. Trends Endocrinol Metab. 2010;21:345–52. doi: 10.1016/j.tem.2010.01.009. [DOI] [PMC free article] [PubMed] [Google Scholar]
- 2.Ohman MK, Wright AP, Wickenheiser KJ, Luo W, Eitzman DT. Visceral adipose tissue and atherosclerosis. Curr Vasc Pharmacol. 2009;7:169–79. doi: 10.2174/157016109787455680. [DOI] [PubMed] [Google Scholar]
- 3.Weisberg SP, McCann D, Desai M, Rosenbaum M, Leibel RL, Ferrante AW., Jr Obesity is associated with macrophage accumulation in adipose tissue. J Clin Invest. 2003;112:1796–808. doi: 10.1172/JCI19246. [DOI] [PMC free article] [PubMed] [Google Scholar]
- 4.Xu H, Barnes GT, Yang Q, Tan G, Yang D, Chou CJ, Sole J, Nichols A, Ross JS, Tartaglia LA, Chen H. Chronic inflammation in fat plays a crucial role in the development of obesity-related insulin resistance. J Clin Invest. 2003;112:1821–30. doi: 10.1172/JCI19451. [DOI] [PMC free article] [PubMed] [Google Scholar]
- 5.Reilly SM, Saltiel AR. Adapting to obesity with adipose tissue inflammation. Nat Rev Endocrinol. 2017;11:90. doi: 10.1038/nrendo.2017.90. [DOI] [PubMed] [Google Scholar]
- 6.Lumeng CN, Saltiel AR. Inflammatory links between obesity and metabolic disease. The Journal of clinical investigation. 2011;121:2111–7. doi: 10.1172/JCI57132. [DOI] [PMC free article] [PubMed] [Google Scholar]
- 7.Morris DL, Singer K, Lumeng CN. Adipose tissue macrophages: Phenotypic plasticity and diversity in lean and obese states. Curr Opin Clin Nutr Metab Care. 2011;14:341–6. doi: 10.1097/MCO.0b013e328347970b. [DOI] [PMC free article] [PubMed] [Google Scholar]
- 8.Weisberg SP, Hunter D, Huber R, Lemieux J, Slaymaker S, Vaddi K, Charo I, Leibel RL, Ferrante AW., Jr Ccr2 modulates inflammatory and metabolic effects of high-fat feeding. J Clin Invest. 2006;116:115–24. doi: 10.1172/JCI24335. [DOI] [PMC free article] [PubMed] [Google Scholar]
- 9.Lumeng CN, Bodzin JL, Saltiel AR. Obesity induces a phenotypic switch in adipose tissue macrophage polarization. J Clin Invest. 2007;117:175–84. doi: 10.1172/JCI29881. [DOI] [PMC free article] [PubMed] [Google Scholar]
- 10.Wentworth JM, Naselli G, Brown WA, Doyle L, Phipson B, Smyth GK, Wabitsch M, O’Brien PE, Harrison LC. Pro-inflammatory CD11c+CD206+ adipose tissue macrophages are associated with insulin resistance in human obesity. Diabetes. 2010;59:1648–56. doi: 10.2337/db09-0287. [DOI] [PMC free article] [PubMed] [Google Scholar]
- 11.Prieur X, Mok CY, Velagapudi VR, Nunez V, Fuentes L, Montaner D, Ishikawa K, Camacho A, Barbarroja N, O’Rahilly S, Sethi JK, Dopazo J, Oresic M, Ricote M, Vidal-Puig A. Differential lipid partitioning between adipocytes and tissue macrophages modulates macrophage lipotoxicity and m2/m1 polarization in obese mice. Diabetes. 2011;60:797–809. doi: 10.2337/db10-0705. [DOI] [PMC free article] [PubMed] [Google Scholar]
- 12.Patsouris D, Li PP, Thapar D, Chapman J, Olefsky JM, Neels JG. Ablation of CD11c-positive cells normalizes insulin sensitivity in obese insulin resistant animals. Cell Metab. 2008;8:301–9. doi: 10.1016/j.cmet.2008.08.015. [DOI] [PMC free article] [PubMed] [Google Scholar]
- 13.Xu X, Grijalva A, Skowronski A, van Eijk M, Serlie MJ, Ferrante AW., Jr Obesity activates a program of lysosomal-dependent lipid metabolism in adipose tissue macrophages independently of classic activation. Cell Metab. 2013;18:816–30. doi: 10.1016/j.cmet.2013.11.001. [DOI] [PMC free article] [PubMed] [Google Scholar]
- 14.Odegaard JI, Ricardo-Gonzalez RR, Goforth MH, Morel CR, Subramanian V, Mukundan L, Red Eagle A, Vats D, Brombacher F, Ferrante AW, Chawla A. Macrophage-specific ppargamma controls alternative activation and improves insulin resistance. Nature. 2007;447:1116–20. doi: 10.1038/nature05894. [DOI] [PMC free article] [PubMed] [Google Scholar]
- 15.Kang K, Reilly SM, Karabacak V, Gangl MR, Fitzgerald K, Hatano B, Lee CH. Adipocyte-derived th2 cytokines and myeloid ppardelta regulate macrophage polarization and insulin sensitivity. Cell Metab. 2008;7:485–95. doi: 10.1016/j.cmet.2008.04.002. [DOI] [PMC free article] [PubMed] [Google Scholar]
- 16.Odegaard JI, Ricardo-Gonzalez RR, Red Eagle A, Vats D, Morel CR, Goforth MH, Subramanian V, Mukundan L, Ferrante AW, Chawla A. Alternative m2 activation of kupffer cells by ppardelta ameliorates obesity-induced insulin resistance. Cell Metab. 2008;7:496–507. doi: 10.1016/j.cmet.2008.04.003. [DOI] [PMC free article] [PubMed] [Google Scholar]
- 17.Nawaz A, Aminuddin A, Kado T, Takikawa A, Yamamoto S, Tsuneyama K, Igarashi Y, Ikutani M, Nishida Y, Nagai Y, Takatsu K, Imura J, Sasahara M, Okazaki Y, Ueki K, Okamura T, Tokuyama K, Ando A, Matsumoto M, Mori H, Nakagawa T, Kobayashi N, Saeki K, Usui I, Fujisaka S, Tobe K. CD206+ m2-like macrophages regulate systemic glucose metabolism by inhibiting proliferation of adipocyte progenitors. Nat Commun. 2017;8:017–00231. doi: 10.1038/s41467-017-00231-1. [DOI] [PMC free article] [PubMed] [Google Scholar]
- 18.Spencer M, Yao-Borengasser A, Unal R, Rasouli N, Gurley CM, Zhu B, Peterson CA, Kern PA. Adipose tissue macrophages in insulin-resistant subjects are associated with collagen vi and fibrosis and demonstrate alternative activation. American Journal of Physiology - Endocrinology and Metabolism. 2010;299:E1016–E1027. doi: 10.1152/ajpendo.00329.2010. [DOI] [PMC free article] [PubMed] [Google Scholar]
- 19.Shaul ME, Bennett G, Strissel KJ, Greenberg AS, Obin MS. Dynamic, m2-like remodeling phenotypes of CD11c+ adipose tissue macrophages during high-fat diet–induced obesity in mice. Diabetes. 2010;59:1171–1181. doi: 10.2337/db09-1402. [DOI] [PMC free article] [PubMed] [Google Scholar]
- 20.Amano S, Cohen Jessica L, Vangala P, Tencerova M, Nicoloro Sarah M, Yawe Joseph C, Shen Y, Czech Michael P, Aouadi M. Local proliferation of macrophages contributes to obesity-associated adipose tissue inflammation. Cell Metabolism. 2014;19:162–171. doi: 10.1016/j.cmet.2013.11.017. [DOI] [PMC free article] [PubMed] [Google Scholar]
- 21.Haase J, Weyer U, Immig K, Kloting N, Bluher M, Eilers J, Bechmann I, Gericke M. Local proliferation of macrophages in adipose tissue during obesity-induced inflammation. Diabetologia. 2014;57:562–71. doi: 10.1007/s00125-013-3139-y. [DOI] [PubMed] [Google Scholar]
- 22.Lee YS, Li P, Huh JY, Hwang IJ, Lu M, Kim JI, Ham M, Talukdar S, Chen A, Lu WJ, Bandyopadhyay GK, Schwendener R, Olefsky J, Kim JB. Inflammation is necessary for long-term but not short-term high-fat diet–induced insulin resistance. Diabetes. 2011;60:2474–2483. doi: 10.2337/db11-0194. [DOI] [PMC free article] [PubMed] [Google Scholar]
- 23.Lumeng CN, Deyoung SM, Bodzin JL, Saltiel AR. Increased inflammatory properties of adipose tissue macrophages recruited during diet-induced obesity. Diabetes. 2007;56:16–23. doi: 10.2337/db06-1076. [DOI] [PubMed] [Google Scholar]
- 24.Morris DL, Oatmen KE, Wang T, DelProposto JL, Lumeng CN. Cx3cr1 deficiency does not influence trafficking of adipose tissue macrophages in mice with diet-induced obesity. Obesity. 2012;20:1189–99. doi: 10.1038/oby.2012.7. [DOI] [PMC free article] [PubMed] [Google Scholar]
- 25.Singer K, DelProposto J, Lee Morris D, Zamarron B, Mergian T, Maley N, Cho KW, Geletka L, Subbaiah P, Muir L, Martinez-Santibanez G, Nien-Kai Lumeng C. Diet-induced obesity promotes myelopoiesis in hematopoietic stem cells. Molecular Metabolism. 2014 doi: 10.1016/j.molmet.2014.06.005. [DOI] [PMC free article] [PubMed] [Google Scholar]
- 26.Cho KW, Zamarron BF, Muir LA, Singer K, Porsche CE, DelProposto JB, Geletka L, Meyer KA, O’Rourke RW, Lumeng CN. Adipose tissue dendritic cells are independent contributors to obesity-induced inflammation and insulin resistance. J Immunol. 2016;197:3650–3661. doi: 10.4049/jimmunol.1600820. [DOI] [PMC free article] [PubMed] [Google Scholar]
- 27.Pamir N, Liu NC, Irwin A, Becker L, Peng Y, Ronsein GE, Bornfeldt KE, Duffield JS, Heinecke JW. Granulocyte/macrophage colony-stimulating factor-dependent dendritic cells restrain lean adipose tissue expansion. J Biol Chem. 2015;290:14656–67. doi: 10.1074/jbc.M115.645820. [DOI] [PMC free article] [PubMed] [Google Scholar]
- 28.Cho Kae W, Morris David L, DelProposto Jennifer L, Geletka L, Zamarron B, Martinez-Santibanez G, Meyer Kevin A, Singer K, O’Rourke Robert W, Lumeng Carey N. An mhc II-dependent activation loop between adipose tissue macrophages and CD4+ T cells controls obesity-induced inflammation. Cell reports. 2014;9:605–617. doi: 10.1016/j.celrep.2014.09.004. [DOI] [PMC free article] [PubMed] [Google Scholar]
- 29.Shapiro H, Pecht T, Shaco-Levy R, Harman-Boehm I, Kirshtein B, Kuperman Y, Chen A, Bluher M, Shai I, Rudich A. Adipose tissue foam cells are present in human obesity. J Clin Endocrinol Metab. 2013;98:1173–81. doi: 10.1210/jc.2012-2745. [DOI] [PubMed] [Google Scholar]
- 30.Jenkins SJ, Ruckerl D, Cook PC, Jones LH, Finkelman FD, van Rooijen N, MacDonald AS, Allen JE. Local macrophage proliferation, rather than recruitment from the blood, is a signature of th2 inflammation. Science. 2011;332:1284–8. doi: 10.1126/science.1204351. [DOI] [PMC free article] [PubMed] [Google Scholar]
- 31.Zamarron BF, Mergian TA, Cho KW, Martinez-Santibanez G, Luan D, Singer K, DelProposto JL, Geletka LM, Muir LA, Lumeng CN. Macrophage proliferation sustains adipose tissue inflammation in formerly obese mice. Diabetes. 2017;66:392–406. doi: 10.2337/db16-0500. [DOI] [PMC free article] [PubMed] [Google Scholar]
- 32.Hill AA, Anderson-Baucum EK, Kennedy AJ, Webb CD, Yull FE, Hasty AH. Activation of nf-κb drives the enhanced survival of adipose tissue macrophages in an obesogenic environment. Molecular Metabolism. 2015;4:665–677. doi: 10.1016/j.molmet.2015.07.005. [DOI] [PMC free article] [PubMed] [Google Scholar]
- 33.Winer S, Chan Y, Paltser G, Truong D, Tsui H, Bahrami J, Dorfman R, Wang Y, Zielenski J, Mastronardi F, Maezawa Y, Drucker DJ, Engleman E, Winer D, Dosch HM. Normalization of obesity-associated insulin resistance through immunotherapy. Nat Med. 2009;15:921–9. doi: 10.1038/nm.2001. [DOI] [PMC free article] [PubMed] [Google Scholar]
- 34.Feuerer M, Herrero L, Cipolletta D, Naaz A, Wong J, Nayer A, Lee J, Goldfine AB, Benoist C, Shoelson S, Mathis D. Lean, but not obese, fat is enriched for a unique population of regulatory T cells that affect metabolic parameters. Nat Med. 2009;15:930–9. doi: 10.1038/nm.2002. [DOI] [PMC free article] [PubMed] [Google Scholar]
- 35.Nishimura S, Manabe I, Nagasaki M, Eto K, Yamashita H, Ohsugi M, Otsu M, Hara K, Ueki K, Sugiura S, Yoshimura K, Kadowaki T, Nagai R. Cd8+ effector T cells contribute to macrophage recruitment and adipose tissue inflammation in obesity. Nat Med. 2009;15:914–20. doi: 10.1038/nm.1964. [DOI] [PubMed] [Google Scholar]
- 36.Ji Y, Sun S, Xia S, Yang L, Li X, Qi L. Short term high fat diet challenge promotes alternative macrophage polarization in adipose tissue via natural killer T cells and interleukin-4. Journal of Biological Chemistry. 2012;287:24378–24386. doi: 10.1074/jbc.M112.371807. [DOI] [PMC free article] [PubMed] [Google Scholar]
- 37.Jenkins SJ, Ruckerl D, Thomas GD, Hewitson JP, Duncan S, Brombacher F, Maizels RM, Hume DA, Allen JE. Il-4 directly signals tissue-resident macrophages to proliferate beyond homeostatic levels controlled by csf-1. J Exp Med. 2013;210:2477–91. doi: 10.1084/jem.20121999. [DOI] [PMC free article] [PubMed] [Google Scholar]
- 38.Braune J, Weyer U, Hobusch C, Mauer J, Bruning JC, Bechmann I, Gericke M. Il-6 regulates m2 polarization and local proliferation of adipose tissue macrophages in obesity. J Immunol. 2017;198:2927–2934. doi: 10.4049/jimmunol.1600476. [DOI] [PubMed] [Google Scholar]
- 39.Yoshida H, Watanabe H, Ishida A, Watanabe W, Narumi K, Atsumi T, Sugita C, Kurokawa M. Naringenin suppresses macrophage infiltration into adipose tissue in an early phase of high-fat diet-induced obesity. Biochemical and Biophysical Research Communications. 2014;454:95–101. doi: 10.1016/j.bbrc.2014.10.038. [DOI] [PubMed] [Google Scholar]
- 40.Tardelli M, Zeyda K, Moreno-Viedma V, Wanko B, Grün NG, Staffler G, Zeyda M, Stulnig TM. Osteopontin is a key player for local adipose tissue macrophage proliferation in obesity. Molecular Metabolism. 2016;5:1131–1137. doi: 10.1016/j.molmet.2016.09.003. [DOI] [PMC free article] [PubMed] [Google Scholar]
- 41.Chapman J, Miles PD, Ofrecio JM, Neels JG, Yu JG, Resnik JL, Wilkes J, Talukdar S, Thapar D, Johnson K, Sears DD. Osteopontin is required for the early onset of high fat diet-induced insulin resistance in mice. PLoS One. 2010;5:e13959. doi: 10.1371/journal.pone.0013959. [DOI] [PMC free article] [PubMed] [Google Scholar]
- 42.Zheng C, Yang Q, Cao J, Xie N, Liu K, Shou P, Qian F, Wang Y, Shi Y. Local proliferation initiates macrophage accumulation in adipose tissue during obesity. Cell Death Dis. 2016;31:54. doi: 10.1038/cddis.2016.54. [DOI] [PMC free article] [PubMed] [Google Scholar]
- 43.Kim JI, Huh JY, Sohn JH, Choe SS, Lee YS, Lim CY, Jo A, Park SB, Han W, Kim JB. Lipid-overloaded enlarged adipocytes provoke insulin resistance independent of inflammation. Mol Cell Biol. 2015;35:1686–99. doi: 10.1128/MCB.01321-14. [DOI] [PMC free article] [PubMed] [Google Scholar]
- 44.Wensveen FM, Jelencic V, Valentic S, Sestan M, Wensveen TT, Theurich S, Glasner A, Mendrila D, Stimac D, Wunderlich FT, Bruning JC, Mandelboim O, Polic B. Nk cells link obesity-induced adipose stress to inflammation and insulin resistance. Nature Immunology. 2015;16:376–+. doi: 10.1038/ni.3120. [DOI] [PubMed] [Google Scholar]
- 45.Aouadi M, Vangala P, Yawe JC, Tencerova M, Cohen JL, Nicoloro SM, Shen Y, Czech MP. Lipid storage by adipose tissue macrophages regulates systemic glucose tolerance. Am J Physiol Endocrinol Metab. 2014 doi: 10.1152/ajpendo.00187.2014. [DOI] [PMC free article] [PubMed] [Google Scholar]
- 46.Kosteli A, Sugaru E, Haemmerle G, Martin JF, Lei J, Zechner R, Ferrante AW., Jr Weight loss and lipolysis promote a dynamic immune response in murine adipose tissue. The Journal of Clinical Investigation. 2010;120:3466–3479. doi: 10.1172/JCI42845. [DOI] [PMC free article] [PubMed] [Google Scholar]
- 47.Nguyen MT, Favelyukis S, Nguyen AK, Reichart D, Scott PA, Jenn A, Liu-Bryan R, Glass CK, Neels JG, Olefsky JM. A subpopulation of macrophages infiltrates hypertrophic adipose tissue and is activated by free fatty acids via toll-like receptors 2 and 4 and jnk-dependent pathways. J Biol Chem. 2007;282:35279–92. doi: 10.1074/jbc.M706762200. [DOI] [PubMed] [Google Scholar]
- 48.Bourlier V, Zakaroff-Girard A, Miranville A, De Barros S, Maumus M, Sengenes C, Galitzky J, Lafontan M, Karpe F, Frayn KN, Bouloumie A. Remodeling phenotype of human subcutaneous adipose tissue macrophages. Circulation. 2008;117:806–15. doi: 10.1161/CIRCULATIONAHA.107.724096. [DOI] [PubMed] [Google Scholar]
- 49.Lee YH, Petkova AP, Granneman JG. Identification of an adipogenic niche for adipose tissue remodeling and restoration. Cell Metab. 2013;18:355–67. doi: 10.1016/j.cmet.2013.08.003. [DOI] [PMC free article] [PubMed] [Google Scholar]
- 50.Parlee SD, Lentz SI, Mori H, MacDougald OA. Quantifying size and number of adipocytes in adipose tissue. Methods Enzymol. 2014;537:93–122. doi: 10.1016/B978-0-12-411619-1.00006-9. [DOI] [PMC free article] [PubMed] [Google Scholar]
- 51.Wang QA, Tao C, Gupta RK, Scherer PE. Tracking adipogenesis during white adipose tissue development, expansion and regeneration. Nature medicine. 2013;19:1338–44. doi: 10.1038/nm.3324. [DOI] [PMC free article] [PubMed] [Google Scholar]
- 52.Gutierrez DA, Kennedy A, Orr JS, Anderson EK, Webb CD, Gerrald WK, Hasty AH. Aberrant accumulation of undifferentiated myeloid cells in the adipose tissue of ccr2-deficient mice delays improvements in insulin sensitivity. Diabetes. 2011;60:2820–2829. doi: 10.2337/db11-0314. [DOI] [PMC free article] [PubMed] [Google Scholar]
- 53.Mulder P, Morrison MC, Wielinga PY, van Duyvenvoorde W, Kooistra T, Kleemann R. Surgical removal of inflamed epididymal white adipose tissue attenuates the development of non-alcoholic steatohepatitis in obesity. International Journal of Obesity (2005) 2016;40:675–684. doi: 10.1038/ijo.2015.226. [DOI] [PMC free article] [PubMed] [Google Scholar]
Associated Data
This section collects any data citations, data availability statements, or supplementary materials included in this article.