

Abstract
Purpose
Current evidence suggests that retinal neurodegeneration is an early event in the pathogenesis of diabetic retinopathy. Our main goal was to examine whether, in the diabetic human retina, common proteins and pathways are shared with brain neurodegenerative diseases.
Methods
A proteomic analysis was performed on three groups of postmortem retinas matched by age: nondiabetic control retinas (n = 5), diabetic retinas without glial activation (n = 5), and diabetic retinas with glial activation (n = 5). Retinal lysates from each group were pooled and run on an SDS-PAGE gel. Bands were analyzed sequentially by liquid chromatography-mass spectrometry (LC/MS) using an Orbitrap Mass Spectrometer.
Results
A total of 2190 proteins were identified across all groups. To evaluate the association of the identified proteins with neurological signaling, significant signaling pathways belonging to the category “Neurotransmitters and Other Nervous System Signaling” were selected for analysis. Pathway analysis revealed that “Neuroprotective Role of THOP1 in Alzheimer's Disease” and “Unfolded Protein Response” pathways were uniquely enriched in control retinas. By contrast, “Dopamine Degradation” and “Parkinson's Signaling” were enriched only in diabetic retinas with glial activation. The “Neuregulin Signaling,” “Synaptic Long Term Potentiation,” and “Amyloid Processing” pathways were enriched in diabetic retinas with no glial activation.
Conclusions
Diabetes-induced retinal neurodegeneration and brain neurodegenerative diseases, such as Alzheimer's and Parkinson's diseases, share common pathogenic pathways. These findings suggest that the study of neurodegeneration in the diabetic retina could be useful to further understand the neurodegenerative processes that occur in the brain of persons with diabetes.
Keywords: proteomics, diabetic retinopathy, human, neurodegeneration, retina
Diabetic retinopathy (DR) remains a leading cause of preventable blindness in developed countries.1 Current treatments target late stages of DR when vision already has been significantly affected. A better understanding of the pathogenesis of DR would permit the development of more efficient preventative/interventional strategies against its early stages, before overt microvascular damage or vision loss occurs.2–4
DR long has been considered exclusively a microcirculatory disease of the retina. However, current evidence suggests that retinal neurodegeneration, leading to significant thinning of the neural retina,5,6 is an early event in the pathogenesis of DR and may participate in the development of microvascular abnormalities.3,7,8
Neural apoptosis and glial activation (GA; also known as reactive gliosis) are the most important histological features of retinal neurodegeneration. GA is the general response to injury in glial cells and is characterized by aberrant expression of glial fibrillary acidic protein (GFAP). This intermediate filament protein is expressed in the normal retina mostly by astrocytes and minimally by Müller cells. In diabetes, however, Müller cells acquire prominent GFAP immunoreactivity, whereas astrocytes progressively lose GFAP expression.9,10 It should be noted that Müller cells, the primary glial cells in the retina, produce factors capable of modulating blood flow, vascular permeability, and cell survival, and their processes are adjacent to the blood vessels in the retina. Therefore, injury to these cells has an essential role in the pathogenesis of early microcirculatory abnormalities and the impairment of neurovascular coupling in the retina.11 In addition, GA also may induce neural cell death by several mechanisms, including glutamate excitotoxicity.3 We used GFAP immunoreactivity in diabetic donors as a marker for GA and a parameter for the classification into groups with (high GFAP immunoreactivity) and without (low GFAP immunoreactivity) retinal neurodegeneration.
Most of our cellular and molecular knowledge regarding the mechanisms involved in the early stages of DR comes from experimental models, and little is known regarding the underlying biochemical changes that occur in the human diabetic retina before the appearance of clinically observable abnormalities. The development of proteomic analysis has made it possible to analyze protein profiles in small samples, and several studies have been performed using murine models12–14 as well as human retinas.15 However, the difficulty in obtaining human retina samples has led to vitreal fluid being used to indirectly explore the events that occur in the retina.16,17 With this approach, several proteome analyses of human vitreous fluid from diabetic patients with proliferative diabetic retinopathy18,19 or diabetic macular edema20,21 provided new insights into the pathogenesis of DR. Few reports have examined the human retinal proteome in diabetic patients. In this regard, a comparative analysis of the RPE proteome between diabetic donors without DR and age-matched controls has been published,22 but to the best of our knowledge, a comparative analysis of the neuroretina has not been reported.
We identified early changes in DR using an unbiased proteomics approach. For this purpose, proteomic profiles of control retinas were compared to diabetic retinas obtained from patients known to be without classic vascular lesions that clinically define DR. The diabetic retinas were split further into two groups according the presence or absence of GA. This approach permitted us to identify the main proteins and metabolic pathways involved in these early stages of DR. Our study focuses on the most relevant proteins related to neuroregulatory and neurodegenerative pathways unique to each of the three groups (control retinas, and diabetic retinas with and without GA), with special emphasis on the proteins and pathways shared with brain neurodegenerative diseases.
Methods
Tissue Acquisition
Institutional review board approval was obtained for this study from Vall d'Hebron University Hospital. This study adheres to all tenets of the Declaration of Helsinki. Postmortem retinal tissue was acquired from the Blood and Tissue Bank of Vall d'Hebron University Hospital. Inclusion criteria were a fundus examination performed by indirect ophthalmoscopy or fundus photographs within two years before death documenting absence of microvascular abnormalities associated with DR. The control group (C; n = 5) included patients without diabetes. The diabetes group included patients with diabetes and minimal (D, n = 5) or abundant (D+GFAP; n = 5) GFAP immunoreactivity in the retina, Average death to harvest time was 3.8 hours. After enucleation, one eye of each donor was snap-frozen at −80°C and stored until assayed for mRNA and proteins. The other eye was fixed in 4% (wt/vol) paraformaldehyde and embedded in paraffin for the immunohistochemistry (IHC) study.
Immunohistochemistry
The retina was sectioned and IHC was performed as described previously.23 GA was assessed by masked observers using the scoring system based on methods reported previously by Anderson et al.24 A GA score of 4 or 5 indicated a high degree of GFAP, whereas a score of 1 to 3 indicated a low degree of GFAP staining. Apoptosis was evaluated by TUNEL. The number of TUNEL-positive cells (green) was recorded in three fields of each retina that covered 212 × 212 μm. Images were acquired with a confocal laser scanning microscope (FV1000, Olympus. Hamburg, Germany).
Microglial activation was assessed by ionized calcium-binding adapter molecule 1 (Iba-1) immunofluorescence. Retina sections were incubated overnight in a humid chamber at 4°C with goat anti-Iba-1 (Abcam, Madrid, Spain). Then, samples were washed and incubated for 60 minutes with anti-goat Alexa 488 (1:200; Molecular Probes, Eugene, OR, USA). After washing, sections were mounted in Vectashield (Vector Labs, Burlingame, CA, USA) mounting medium with 4′,6-diamidino-2-phenylendole (DAPI). Images were acquired with a confocal laser scanning microscope (FV1000; Olympus) with a ×60 objective. Images size were 1024 × 1024 pixels. Fluorescent values were obtained with the software Olimpus Fluoview (v.4.2) in the confocal images (oib) with an ROI plugin and with background substraction.
Retinal Lysis
Protein extracts from the whole neuroretina were prepared by homogenization with radioimmunoprecipitation assay (RIPA) buffer (R0278; Sigma Aldrich Quimca S.A., Madrid, Spain) containing protease inhibitor (P8340; Sigma Aldrich Quimca S.A.) and 20 mM NaF, 2 mM Na3VO4, 2 mM PMSF. Extracts were cleared by microcentrifugation at 10,000g for 10 minutes at 4°C. The supernatant was aliquoted and stored at −80°C.
Sample Preparation and Proteomic Analysis
A total of 60 μg protein (pooled from n = 5 per group) was subjected to SDS-PAGE using 4% to 20% gel. Following electrophoresis, the gel was stained and each sample lane was cut into 16 fragments (1 × 3 mm pieces). The fragments were placed in Eppendorf tubes and digested with trypsin using the following method. Briefly, fragments were destained with 8 mg/mL (100 mM) ammonium bicarbonate (NH4HCO3) in 50% acetonitrile (ACN) at pH 8.5. The samples were reduced with tris(2-carboxyethyl)phosphine (30 mg/mL) in H2O, incubated at 4°C for 2 hours, then alkylated with iodoacetamide (IAA; 18 mg/mL [100 mM] in 8 mg/mL NH4HCO3, freshly made and kept in the dark) at room temperature for 30 minutes. The alkylating buffer was removed and the samples were washed with destaining buffer. The gel fragments were dehydrated using ACN. Samples were digested with trypsin (10 ng/μL in 8 mg/mL NH4HCO3) at 37°C overnight. The tryptic peptides were transferred to fresh tubes. Additional peptides were extracted using 0.1% formic acid in 50% ACN and added to the original fractions. The samples then were filtered (NanoSep MF GHP 0.45 μm) and concentrated before mass spectrometry (MS) analysis.
Nano-liquid chromatography MS (LC/MS)2 was performed to detect peptides; 1 mL samples were loaded onto an Acclaim PepMap100 trapping column (100 μm × 2 cm, C18, 5 μm, 100 Å; Thermo Fisher Scientific, Waltham, MA, USA) at a flow rate of 20 μL/min using 4% aqueous ACN, and 0.1% formic acid (FA) as a mobile phase. The peptides were separated on an Acclaim PepMap RSLC column (75 μm × 15 cm, C18, 2 μm, 100 Å; Thermo Fisher) with a 90-minute 4% to 40% linear gradient of ACN in water containing 0.1% formic acid. The gradient was delivered by a Dionex Ultimate 3000 nano-LC system (Thermo Fisher) at 300 nL/min. An LTQ Orbitrap Velos mass spectrometer (Thermo Fisher) was set to acquire data using the following data-dependent parameters: full FT MS scan at R 60,000 followed by 10 ion-trap MS2 scans on most intense precursors with CID activation. Only the precursors with charge states +2 and higher were selected for MS2; monoisotopic precursor selection was enabled, and the isolation window was 3 m/z. Dynamic exclusion duration was 15 seconds, repeated once over 30-second repeat duration.
Proteomic Data Analysis
The mass spectra were processed using Proteome Discoverer 1.3 (Thermo Fisher). The MS2 data were analyzed with Sequest (Thermo Fisher, version 1.3.0.339) set up to search a database combining current human_contam_fasta proteome, up1.4.0.288, Uniprot, and the common contaminants sequences, a total of 49,426 entries. The following search parameters were used: precursor tolerance 20 parts per million (ppm), fragment tolerance 0.8 Daltons (Da), dynamic modifications included Oxidation (+15.995 Da, Met) and Deamidation (+0.984 Da, Asn, Gln), static modification was carbamidomethyl (+57.021 Da, Cys). The resultant Sequest files were parsed into Scaffold (version 4.6.1) for validation filtering and generation of nonredundant proteins. Uniprot was used to remove any obsolete protein identifications.
Pathway and Gene Ontology Analysis
Pathway enrichment analysis was performed using the Ingenuity Pathway Analysis (IPA) bioinformatics platform (provided in the public domain at www.Qiagen.com). For each of the three individual sample sets, identification of significantly represented pathways was performed using a −Log P value for each of the identified pathways. The significance value for each pathway was calculated using the right-tailed Fisher's exact test. The P values were corrected using the Benjamini-Hochberg (B-H) correction to control for the false discovery rate. A significance value cutoff of B-H P value ≤0.001 was selected to identify shared and unique pathways within each sample set. To evaluate the association of the identified proteins with neurological signaling, significant signaling pathways belonging to the category “Neurotransmitters and Other Nervous System Signaling” were selected for analysis.
Pathway activation analysis was performed using the comparison Analysis function on IPA. Briefly, a count value of one was added to each spectral count observation. For each protein, 2-fold changes (FCs) were computed (D/C and D+GFAP/C). The Log2(FC) was calculated for each protein within each of the two comparison groups. This dataset was uploaded to IPA, and only those proteins having a FC ≤0.5 or ≥1.5 were included in the final analysis.
Results
Demographics and Sample Classification
As described above, three groups of samples were analyzed; control (C), diabetes (D) and diabetes with GFAP expression (D+GFAP). The average ages of the groups were similar (C = 71.8 ± 7.1; D = 67.2 ± 7.2, D+GFAP = 68.6 ± 8.8). The main clinical features and causes of death of diabetic and nondiabetic donors are summarized in Table 1. Images of GFAP immunoreactivity in retinal sections from each donor included in the study are shown in Figure 1. Classification of patients by GFAP staining was verified by GFAP abundance using spectral counts (C = 122.79; D = 240.39; D+GFAP = 528.01). The progressive increase in GFAP observed in groups D and D+GFAP was associated with an increase in apoptotic rate (Fig. 2), as well as microglial activation assessed by Iba-1 immunofluorescence (Fig. 3).
Table.
Clinical Characteristics of Non-Diabetic Donors and Diabetic Donors Included in the Study

Figure 1.
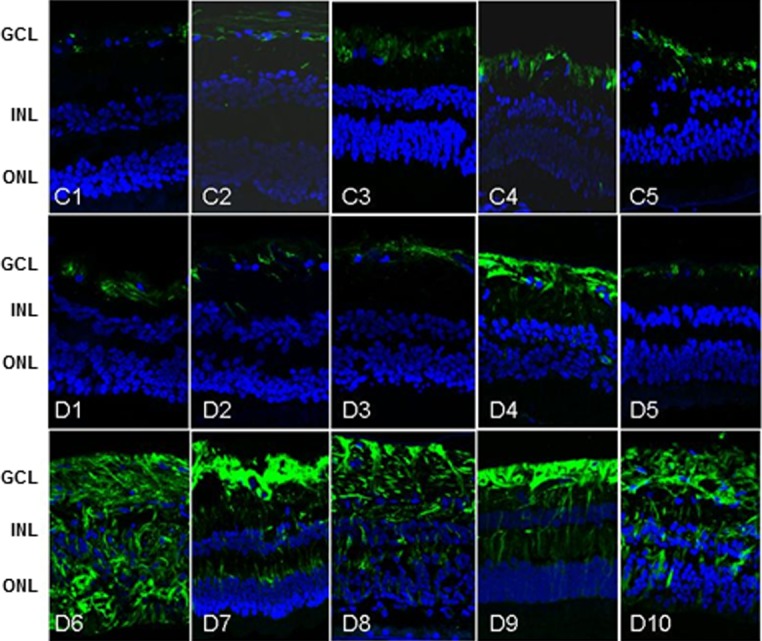
GFAP Immunohistochemistry. GFAP immunoreactivity in human retinas included in this study. C (C1–C5), D (D1–D5), and D+GFAP (D6–D10) groups. GCL, ganglion cell layer; INL, inner nuclear layer; ONL, outer nuclear layer.
Figure 2.

Retinal apoptosis. (A) TUNEL-positive immunofluorescence (green) in a representative donor from each group (C, D, and D+GFAP). Nuclei were labeled with DAPI (blue). (B) Quantification of TUNEL-positive cells. The results were normalized taking into account the area analyzed. Results are mean ± SD. (C) white columns; (D) gray columns; D+GFAP: black columns. n = 5 donors by group. *P < 0.05 compared to group C; **P < 0.001 compared to group C; #P < 0.01 compared to group D.
Figure 3.

Microglial activation. (A) Iba-1 immunolabeling of microglia (green) in a representative donor from each group (C, D, and D+GFAP). Nuclei were labelled with DAPI (blue). Scale bar: 10 μm. (B) Quantification of Iba-1 fluorescent intensity. a.u., arbitrary units. Results are mean ± SD. (C) white columns; (D) gray columns; D+GFAP: black columns. n = 5 donors by group. *P < 0.05 compared to the other groups.
Overview of Retinal Proteome
Sample integrity was assessed with total protein stain of the SDS-PAGE gel (Supplemental Material). Although the appearance of the gel suggested lack of signs of sample degradation, the presence of degradation cannot be completely ruled out based only on this evidence. However, the quality of the proteomic data was confirmed by the following parameters: 99% confidence for protein identification, 95% confidence for peptide assignment, 0.9% protein false discovery rate (FDR), and 0.03% peptide FDR. There were 2076, 2107, and 1906 proteins identified in the C, D, and D+GFAP groups, respectively. A complete list of the identified peptides and proteins is available for download (Supplementary Material).
Obsolete proteins were filtered and removed from all further analyses. Similarity among groups was assessed by percent homology for each study group. Figure 4 shows that 1414, 1487, and 1080 proteins were identified retinas in the C, D, and D+GFAP groups, respectively. Homology among all three sample groups encompassed 37% (n = 736) of the total assigned proteins. Between-group homology was greatest between groups C and D with an 18.1% similarity (n = 360), whereas the lowest was between groups C and D+GFAP, with only a 3.6% similarity (n = 72) between assigned protein IDs. The number of unique proteins expressed in each group was statistically similar (C = 246, D = 303, and D+GFAP = 184) as were the number of co-expressed proteins between any two groups (C and D = 360; C and D+GFAP = 72, D and D+GFAP = 88).
Figure 4.
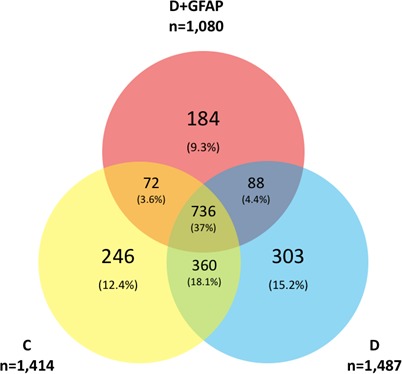
Protein profile comparison. A total of 1414, 1487, and 1080 proteins were identified from retinas in the C, D, and D+GFAP groups, respectively. A common core of 736 proteins was identified. Number of unique proteins: C = 246, D = 303, and D+GFAP = 184. Groups C and D shared 360 expressed proteins, Groups C and D+GFAP shared 72, while groups D and D+GFAP shared 88.
Pathway Analysis
Pathway analysis was performed by IPA using the pathway enrichment function. A complete list of enriched pathways identified in each sample is available in the supplemental material section for download. Significant (B-H P ≤ 0.001) pathways identified in each of the three types of biological samples were compared. With this approach, we noted the presence or absence of canonical pathways involved in neuroregulatory cell functions in each group. In general, significant homology was seen among all three groups with a total of 73 shared pathway assignments (58% of total pathway assignments). However, a substantial number of unique pathways were identified for each condition (Fig. 5). Unique pathway assignments were greatest within the D group (n = 23), while the C and D+GFAP groups had six unique pathways each. To identify the unique pathways related to neurodegenerative processes of each group, the Ontology and Function algorithm within IPA was used to restrict the enriched pathway dataset to those related to “Neurotransmitters and Other Nervous System Signaling” among the unique pathways of each group. The data then were examined in a different manner to confirm the aforementioned results. The results are included in the Supplemental Material, and a visual representation of unique pathways alone is provided in Figure 6.
Figure 5.

Unique pathway assignments by study group. Significantly identified pathways in each of the three biological samples were compared. Significant homology was seen among all three groups with a total of 73 shared pathway assignments (58% of total pathway assignments). However, a substantial number of unique pathways were identified in each condition. Pathway assignments for the unique protein IDs in each sample group were assigned using the IPA software platform. Selected pathways unique to each study group are highlighted in their respective boxes. Selected pathways involved in neuroregulatory cell functions or neurodegeneration are bolded.
Figure 6.
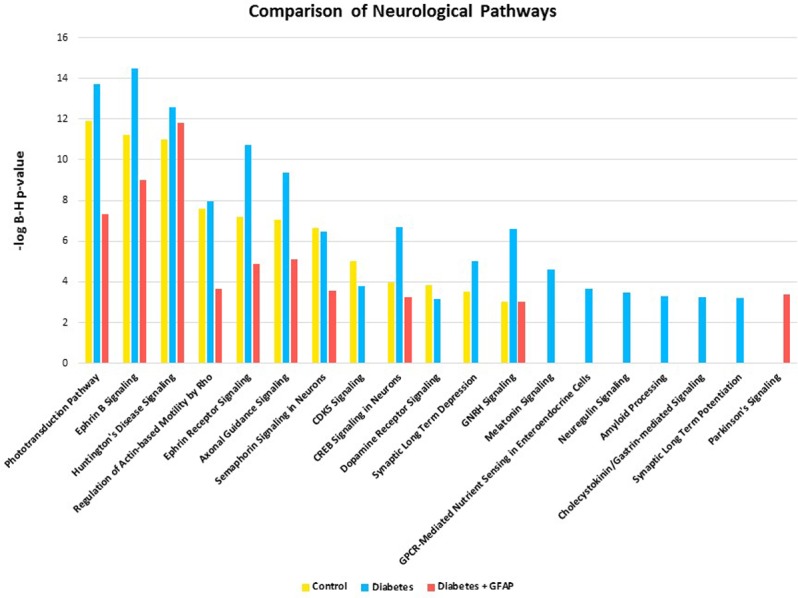
To evaluate the association of the identified proteins with neurological signaling, significant (B-H P value ≤ 0.001) signaling pathways belonging to the category “Neurotransmitters and Other Nervous System Signaling” were selected for analysis. Comparison of the results obtained for the three biological samples are shown here. Note: absence of a bar from any of the sample groups indicates that the pathway may have been present but not significantly represented at the 0.001 B-H P value cutoff.
Additionally, pathway activation analysis allowed activation and deactivation statuses to be compared between groups. This is represented by an activation z-score generated by IPA, which takes into account the presence of regulatory proteins and the direction in which these proteins push the pathway based on published literature. A positive z-score represents pathway activation, while a negative z-score represents pathway inhibition. Those scores with a magnitude ≥2 are considered significant. Significantly activated/inhibited pathways are included along with unique pathways in the Supplemental Material. The “Neuroprotective Role of THOP1 in Alzheimer's Disease” and “Unfolded Protein Response” pathways were uniquely identified only in group C, suggesting the loss of these neuroprotective pathways in groups D and D+GFAP retinas. Group D was uniquely enriched in the “Neuroregulin Signaling,” “Synaptic Long Term Potentiation,” and “Amyloid Processing” pathways. Two neurologic pathways, “Dopamine Degradation” and “Parkinson's Signaling,” were uniquely enriched in group D+GFAP. These results are highlighted in Figure 5.
Discussion
The present proteomic study allowed identification of proteome changes involved in the pathological processes that occur in the early stages of DR and how these processes vary with disease severity, as marked by the degree of GFAP immunoreactivity. GFAP upregulation corresponds to GA, a pathologic change that is associated with neurodegeneration and precedes the overt microvascular abnormalities in DR.25 A total of 35 pathways related to neurodegeneration or neuroregulation and specifically represented in a single group (nondiabetic donors [C], diabetic donors without GA [D], and diabetic donors with GA [D+GFAP]) have been identified. We discussed the most relevant of these unique and differentially activated pathways with special emphasis on those shared with brain neurodegenerative diseases. Interestingly, such pathways recently been have implicated in the pathogenesis of glaucoma by a similar proteomic analyses of human retinas.26
Samples From Nondiabetic Donors
In the nondiabetic control (C) group, the “Neuroprotective Role of THOP1 in Alzheimer's Disease” and “Unfolded Protein Response” pathways were uniquely present.
Neuroprotective Role of THOP1 in Alzheimer's Disease
Amyloid β (Aβ) accumulation is central to the current view of Alzheimer's disease pathogenesis. Thimet oligopeptidase (THOP1) has been implicated in amyloid precursor protein (APP) processing as well as Aβ clearance and, therefore, it is postulated that THOP1 mediates a compensatory neuronal response to increased Aβ in the brain. In fact, overexpression of THOP1 in primary cortical neurons is neuroprotective against Aβ toxicity.27
To the best of our knowledge, no data on the potential neuroprotective role of THOP1 in the retina have been reported, but numerous studies have examined the role of Aβ accumulation in retinal neurodegeneration. Specifically, APP has been shown to be expressed in human RPE and RGC cells.28,29 Additionally, it has been demonstrated that these cell types, along with those of the inner nuclear layer, contain the complete apparatus needed for Aβ production.28–31 Further, one study identified Aβ plaques in the retinas of patients with Alzheimer's disease, suggesting similarity between the neurodegenerative processes of the retina and the brain in this disease.32 Despite the lack of evidence of visible plaque formation in retinas of diabetic donors or in diabetic animal models, Aβ accumulation has been detected in multiple layers of the retina in a rabbit model of diabetes.33 Therefore, it also is possible that the retinal accumulation of Aβ is involved in the neurodegenerative processes that occur in DR. Given the plausibility of retinal Aβ plaque formation and that the retina is ontogenically a brain-derived tissue, it could be hypothesized that THOP1 has neuroprotective functions in the retina similar to its role in the brain. Identification of the THOP1 pathway only in group C and not the others suggested that the neuroprotective function of THOP1 may be lost early in the diabetic retina. Whether the loss of this signaling pathway also occurs in the brains of type 2 diabetic patients remains to be elucidated, but could be a new mechanism to explain the growing evidence regarding the association between type 2 diabetes and Alzheimer's disease.34
Unfolded Protein Response
The unfolded protein response (UPR) is a series of evolutionarily conserved signaling pathways aimed at restoring homeostasis under conditions of endoplasmic reticulum (ER) stress.35 Impairment of the UPR has been involved not only in the accumulation of misfolded proteins in the brain of many neurodegenerative diseases,36 but also in DR.37,38
The initial response to misfolded proteins in a healthy cell is to refold them back into their native shapes. This effect is accomplished by a large, interdependent network of chaperone and co-chaperone proteins that help to prevent amyloid assembly. The best-studied examples of chaperones are the “heat shock” proteins (Hsp). These proteins are especially important in proteinopathic neurodegenerative diseases (e.g., Parkinson's disease, Alzheimer's disease, and diffuse Lewy body disease), in which specific proteins misfold, aggregate, and kill cells through proteotoxic stress.39 The balance between Hsp70 and Hsp90 is a major area of investigation, as upregulation of Hsp70 and inhibition of Hsp90 in mammals have been shown to reduce protein aggregation and toxicity.40 In our study, we observed a significant decrease in multiple Hsp70s (e.g., Hsp70Kda-4, Hsp70Kds-4L) in retinas of diabetic patients with GA, thus pointing to the accumulation of misfolded proteins as a potential pathway involved in the neurodegenerative process that occur in the early stages of DR. In contrast, we found an increase of isoform 2 of Hsp90-α and the isoform 2 of the stress-induced phosphoprotein 1 (STI1), an Hsp90 co-chaperone secreted by astrocytes, which protect neurons against Aβ oligomer-induced toxicity,41 suggesting a compensatory response.
Samples From Diabetic Donors Without Glial Activation
In diabetic patients without GA (D group), the following neuroprotective pathways were upregulated: “Neuregulin Signaling,” “Synaptic Long Term Potentiation,” and “Amyloid Processing.”
Neuregulin Signaling
The neuregulin family of ligands (NRGs) are important in synaptogenesis and neuronal survival. NRGs exhibit a neuroprotective role under inflammatory conditions by acting in concert with the cholinergic anti-inflammatory pathway.42 We found the “Neuregulin Signaling” pathway to be unique to the D group.
Although few data exist on NRGs in the retina, numerous studies demonstrate neuroprotective effects of NRGs in the central nervous system. For example, treatment with neuregulin after spinal cord injury enhances a neuroprotective phenotype in inflammatory cells and leads to a decrease in proinflammatory cytokines after injury.43 Furthermore, NRGs exert a neuroprotective action against organophosphate neurotoxicity by suppressing the proinflammatory response of brain microglia.44 That the neuregulin pathway was unique to the D group suggests that its neuroprotective effects occur early in disease but are transient and are lost as the disease progresses.
Synaptic Long Term Potentiation
Synaptic long term depression (LTD) and synaptic long term potentiation (LTP) are two variations on synaptic transmission that function in learning and memory. LTP occurs in response to prolonged or high-magnitude action potentials at a synapse, leading to an increased response with subsequent stimuli of the same strength,45 LTD, on the other hand, occurs in response to lower frequency action potentials and leads to a decreased response with subsequent stimuli of the same strength.45 These phenomena have been studied primarily in the hippocampus and cerebellum and are involved in synaptic plasticity. Although there are no studies examining the roles of LTD and LTP on synaptic plasticity in the diabetic retina, other retinal synaptic changes have been documented in animal models. Specifically, VanGuilder et al.46 demonstrated a reduction in presynaptic expression of proteins critical for synaptic transmission in diabetic rat retinas. We found LTP activation to be unique to the D group. This finding is inconsistent with several studies of the hippocampus in diabetic rat models, which reported decreases in LTP relative to controls.47–49 Further research is needed to elucidate the effects of diabetes on LTP and LTD and to determine whether changes in synaptic plasticity in the brain are generalizable to the retina.
Amyloid Processing
As discussed previously in relation to THOP1 signaling, amyloid plaques composed of Aβ are the hallmark lesion of Alzheimer's disease. Mutations in the APP or enzyme that processes Aβ result in familial Alzheimer's disease and Aβ toxicity mediated by disruption of Ca2+ homeostasis in neurons.50 This, along with oxidative stress leading to increased MAP kinase activity, ultimately results in increased phosphorylation of the protein Tau.51 Hyperphosphorylated Tau then is incorporated into the neurofibrillary tangles seen in Alzheimer's disease. Amyloid processing incorporates these events, which are important precipitants of neurodegeneration in Alzheimer's disease. That the protective THOP1 pathway was present only in nondiabetic retinas while its counterpart, amyloid processing, was unique to diabetic retinas lacking markers for neurodegeneration may indicate a transitional role for this pathway in the progression of DR.
Samples From Diabetic Donors With Glial Activation
The “Dopamine Degradation” and “Parkinson's Signaling” pathways were unique to retinas with abundant GA (D+GFAP).
Dopamine (DA) is released by a subclass of amacrine cells in the retina25 and is involved in the diverse physiologic aspects of retinal neuromodulation, mediation of light responsiveness, and clock gene regulation.52,53 Disruption of the dopaminergic system is classically associated with Parkinson's disease, but it also may occur in diabetes.
A reduction in the number of dopaminergic amacrine cells was found in diabetic mouse retinas compared to nondiabetic animals during early stages of diabetes.54–56 Furthermore, treatment of diabetic mice with DA-restoring or DA-activating drugs used in the treatment of Parkinson's disease can restore DA levels and significantly improve diabetes-associated visual dysfunction in early stages of the disease.57
In addition to the identification of the “Dopamine Degradation” and “Parkinson's Signaling” pathways in the D+GFAP group, we also found an associated decrease in β-synuclein and increase in far upstream element-binding protein 1 (FBP-1). β-synuclein serves to inhibit α-synuclein aggregation as well as α-synuclein nucleation, two crucial processes involved in the pathogenesis of Parkinson's disease. FBP-1 is a Parkin protein substrate and accumulates in multiple neurodegenerative diseases, including human autosomal recessive juvenile Parkinson's, Parkinson's disease, and diffuse Lewy body disease. However, the potential toxic effect of FBP-1 to dopaminergic neurons has not been demonstrated.58 Finally, it should be noted that, as occurs with Alzheimer's disease, type 2 diabetic patients have an increased prevalence of Parkinson's disease and, therefore, the retina can serve as a window for the pathophysiologic events that occur in the brain in these neurodegenerative diseases.
Limitations of the Study
Our study has several limitations. First, the inferred pathways require further confirmation in larger studies with more retinal samples. Second, the presence of microvascular abnormalities at death cannot be completely ruled out, but the absence of apparent microangiopathy in the ophthalmologic examinations performed 1 to 2 years before death makes this eventuality very unlikely. Third, which cell types within the complex cellular architecture of the retina contribute to the observed changes must be elucidated. Finally, as occurs in all cross-sectional studies, a direct causal role between the metabolic pathways and development or progression of DR could not be established. However, rather than any type of causality, our objective was to identify a metabolic common signature between retinal and brain neurodegeneration.
Conclusions
In conclusion, the proteomic analysis comparing retinas from diabetic patients in preclinical stages of DR to those of healthy controls has permitted us to identify several new pathways involved in neuroregulation and neuroprotection. Further studies addressed to examine the specific roles of these proteins and pathways not only will increase our knowledge of the pathogenesis of DR, but also could pave the way for new therapeutic strategies against this devastating complication of diabetes. In addition, several pathways shared with other neurodegenerative disorders, such as Alzheimer's and Parkinson's disease, have been identified, thus, supporting that a common soil exists in the neurodegenerative processes that occur in the retina and brain. Finally, our findings support the concept that the study of neurodegeneration in the diabetic retina could be useful to further understand the neurodegenerative processes that occur in the brain of persons with diabetes.
Supplementary Material
Acknowledgments
Mass spectrometric data acquisition and analysis were performed at the Penn State Proteomics and Mass Spectrometry Core Facility, University Park, Pennsylvania, United States.
Supported by Grants RO1EY20582, R24DK082841, PI16/00541, SAF2016-77784-R, 2014SGR270, The Taubman Medical Research Institute (TWG), Research to Prevent Blindness (TWG), the Bennett and Inez Chotner Early Career Professorship in Ophthalmology (JMS), and by the “Río Hortega” fellowship grant from the Instituto de Salud Carlos III (OS). The instrumentation and software were purchased through a grant from the Pennsylvania Department of Health using Tobacco Settlement Funds.
Disclosure: J.M. Sundstrom, None; C. Hernández, None; S.R. Weber, None; Y. Zhao, None; M. Dunklebarger, None; N. Tiberti, None; T. Laremore, None; O. Simó-Servat, None; M. Garcia-Ramirez, None; A.J. Barber, None; T.W. Gardner, None; R. Simó, None
References
- 1. Wong TY, Cheung CM, Larsen M, Sharma S, Simó R. . Diabetic retinopathy. Nat Rev Dis Primers. 2016; 2: 16012. [DOI] [PubMed] [Google Scholar]
- 2. Antonetti DA, Klein R, Gardner TW. . Diabetic retinopathy. N Engl J Med. 2012; 366: 1227– 1239. [DOI] [PubMed] [Google Scholar]
- 3. Simó R, Hernández C; European Consortium for the Early Treatment of Diabetic Retinopathy (EUROCONDOR). . Neurodegeneration in the diabetic eye: new insights and therapeutic perspectives. Trends Endocrinol Metab. 2014; 25: 23– 33. [DOI] [PubMed] [Google Scholar]
- 4. Stitt AW, Curtis TM, Chen M,et al. The progress in understanding and treatment of diabetic retinopathy. Prog Retin Eye Res. 2016; 51: 156– 186. [DOI] [PubMed] [Google Scholar]
- 5. El-Fayoumi D, Badr Eldine NM, Esmael AF, Ghalwash D, Soliman HM. . Retinal nerve fiber layer and ganglion cell complex thicknesses are reduced in children with type 1 diabetes with no evidence of vascular retinopathy. Invest Ophthalmol Vis Sci. 2016; 57: 5355– 5360. [DOI] [PubMed] [Google Scholar]
- 6. Sohn EH, van Dijk HW, Jiao C,et al. Retinal neurodegeneration may precede microvascular changes characteristic of diabetic retinopathy in diabetes mellitus. Proc Natl Acad Sci U S A. 2016; 113: E2655– E2664. [DOI] [PMC free article] [PubMed] [Google Scholar]
- 7. Barber AJ, Lieth E, Khin SA, Antonetti DA, Buchanan AG, Gardner TW. . Neural apoptosis in the retina during experimental and human diabetes. Early onset and effect of insulin. J Clin Invest. 1998; 102: 783– 791. [DOI] [PMC free article] [PubMed] [Google Scholar]
- 8. Stem MS, Gardner TW. . Neurodegeneration in the pathogenesis of diabetic retinopathy: molecular mechanisms and therapeutic implications. Curr Med Chem. 2013; 20: 3241– 3250. [DOI] [PMC free article] [PubMed] [Google Scholar]
- 9. Barber AJ, Antonetti DA, Gardner TW;. for the The Penn State Retina Research Group. Altered expression of retinal occludin and glial fibrillary acidic protein in experimental diabetes. Invest Ophthalmol Vis Sci. 2000; 41: 3561– 3568. [PubMed] [Google Scholar]
- 10. Mizutani M, Gerhardinger C, Lorenzi M. . Müller cell changes in human diabetic retinopathy. Diabetes. 1998; 47: 445– 449. [DOI] [PubMed] [Google Scholar]
- 11. Attwell D, Buchan AM, Charpak S, Lauritzen M, Macvicar BA, Newman EA. . Glial and neuronal control of brain blood flow. Nature. 2010; 468: 232– 243. [DOI] [PMC free article] [PubMed] [Google Scholar]
- 12. Quin G, Len AC, Billson FA, Gillies MC. . Proteome map of normal rat retina and comparison with the proteome of diabetic rat retina: new insight in the pathogenesis of diabetic retinopathy. Proteomics. 2007; 7: 2636– 2650. [DOI] [PubMed] [Google Scholar]
- 13. Fort PE, Freeman WM, Losiewicz MK, Singh RS, Gardner TW. . The retinal proteome in experimental diabetic retinopathy: up-regulation of crystallins and reversal by systemic and periocular insulin. Mol Cell Proteomics. 2009; 8: 767– 779. [DOI] [PMC free article] [PubMed] [Google Scholar]
- 14. VanGuilder HD, Bixler GV, Kutzler L,et al. Multi-modal proteomic analysis of retinal protein expression alterations in a rat model of diabetic retinopathy. PLoS One. 2011; 6: e16271 [DOI] [PMC free article] [PubMed] [Google Scholar]
- 15. Zhang P, Dufresne C, Turner R,et al. The proteome of human retina. Proteomics. 2015; 15: 836– 840. [DOI] [PMC free article] [PubMed] [Google Scholar]
- 16. Simó-Servat O, Hernández C, Simó R. . Usefulness of the vitreous fluid analysis in the translational research of diabetic retinopathy. Mediators Inflamm. 2012; 2012: 872978. [DOI] [PMC free article] [PubMed] [Google Scholar]
- 17. Gardner TW, Sundstrom JM. . A proposal for early and personalized treatment of diabetic retinopathy based on clinical pathophysiology and molecular phenotyping. Vision Res. 2017; 139: 153– 160. [DOI] [PMC free article] [PubMed] [Google Scholar]
- 18. Nakanishi T, Koyama R, Ikeda T, Shimizu A. . Catalogue of soluble proteins in the human vitreous humor: comparison between diabetic retinopathy and macular hole. J Chromatogr B Analyt Technol Biomed Life Sci. 2002; 776: 89– 100. [DOI] [PubMed] [Google Scholar]
- 19. García-Ramírez M, Canals F, Hernández C,et al. Proteomic analysis of human vitreous fluid by fluorescence-based difference gel electrophoresis (DIGE): a new strategy for identifying potential candidates in the pathogenesis of proliferative diabetic retinopathy. Diabetologia. 2007; 50: 1294– 1303. [DOI] [PubMed] [Google Scholar]
- 20. Ouchi M, West K, Crabb JW, Kinoshita S, Kamei M. . Proteomic analysis of vitreous from diabetic macular edema. Exp Eye Res. 2005; 81: 176– 182. [DOI] [PubMed] [Google Scholar]
- 21. Hernández C, García-Ramírez M, Colomé N,et al. New pathogenic candidates for diabetic macular edema detected by proteomic analysis. Diabetes Care. 2010; 33: e92. [DOI] [PubMed] [Google Scholar]
- 22. Decanini A, Karunadharma PR, Nordgaard CL, Feng X, Olsen TW, Ferrington DA. . Human retinal pigment epithelium proteome changes in early diabetes. Diabetologia. 2008; 51: 1051– 1061. [DOI] [PMC free article] [PubMed] [Google Scholar]
- 23. Garcia-Ramírez M, Hernández C, Villarroel M,et al. Interphotoreceptor retinoid-binding protein (IRBP) is downregulated at early stages of diabetic retinopathy. Diabetologia. 2009; 52: 2633– 2641. [DOI] [PubMed] [Google Scholar]
- 24. Anderson PJ, Watts H, Hille C, et al. Glial and endothelial blood-retinal barrier responses to amyloid-beta in the neural retina of the rat. Clin Ophthalmol. 2008; 2: 801– 816. [DOI] [PMC free article] [PubMed] [Google Scholar]
- 25. Barber AJ, Baccouche B. . Neurodegeneration in diabetic retinopathy: potential for novel therapies. Vision Res. 2017; 139: 82– 92. [DOI] [PubMed] [Google Scholar]
- 26. Mirzaei M, Gupta VB, Chick JM,et al. Age-related neurodegenerative disease associated pathways identified in retinal and vitreous proteome from human glaucoma eyes. Sci Rep. 2017; 7: 12685. [DOI] [PMC free article] [PubMed] [Google Scholar]
- 27. Pollio G, Hoozemans JJ, Andersen CA,et al. Increased expression of the oligopeptidase THOP1 is a neuroprotective response to Abeta toxicity. Neurobiol Dis. 2008; 31: 145– 158. [DOI] [PubMed] [Google Scholar]
- 28. Wang J, Zhu C, Xu Y, Liu B, Wang M, Wu K. . Development and expression of amyloid-β peptide 42 in retinal ganglion cells in rats. Anat Rec (Hoboken). 2011; 294: 1401– 1405. [DOI] [PubMed] [Google Scholar]
- 29. Ratnayaka JA, Serpell LC, Lotery AJ. . Dementia of the eye: the role of amyloid beta in retinal degeneration. Eye (Lond). 2015; 29: 1013– 1026. [DOI] [PMC free article] [PubMed] [Google Scholar]
- 30. Dutescu RM, Li QX, Crowston J, Masters CL, Baird PN, Culvenor JG. . Amyloid precursor protein processing and retinal pathology in mouse models of Alzheimer's disease. Graefes Arch Clin Exp Ophthalmol. 2009; 247: 1213– 1221. [DOI] [PubMed] [Google Scholar]
- 31. Johnson LV, Leitner WP, Rivest AJ, Staples MK, Radeke MJ, Anderson DH. . The Alzheimer's A beta -peptide is deposited at sites of complement activation in pathologic deposits associated with aging and age-related macular degeneration. Proc Natl Acad Sci U S A. 2002: 99: 1830– 1835. [DOI] [PMC free article] [PubMed] [Google Scholar]
- 32. Koronyo-Hamaoui M, Koronyo Y, Ljubimov AV,et al. Identification of amyloid plaques in retinas from Alzheimer's patients and noninvasive in vivo optical imaging of retinal plaques in a mouse model. Neuroimage. 2011; 54 suppl 1: S204– S217. [DOI] [PMC free article] [PubMed] [Google Scholar]
- 33. Bitel CL, Kasinathan C, Kaswala RH, Klein WL, Frederikse PH. . Amyloid-beta and tau pathology of Alzheimer's disease induced by diabetes in a rabbit animal model. J Alzheimers Dis. 2012; 32: 291– 305. [DOI] [PubMed] [Google Scholar]
- 34. Ciudin A, Espinosa A, Simó-Servat O,et al. Type 2 diabetes is an independent risk factor for dementia conversion in patients with mild cognitive impairment. J Diabetes Complications. 2017; 31: 1272– 1274. [DOI] [PubMed] [Google Scholar]
- 35. Walter P, Ron D. . The unfolded protein response: from stress pathway to homeostatic regulation. Science. 2011; 334: 1081– 1086. [DOI] [PubMed] [Google Scholar]
- 36. Hetz C, Saxena S. . ER stress and the unfolded protein response in neurodegeneration. Nat Rev Neurol. 2017; 13: 477– 449. [DOI] [PubMed] [Google Scholar]
- 37. Gorbatyuk M, Gorbatyuk O. . Review: retinal degeneration: focus on the unfolded protein response. Mol Vis. 2013; 19: 1985– 1998. [PMC free article] [PubMed] [Google Scholar]
- 38. Ma JH, Wang JJ, Zhang SX. . The unfolded protein response and diabetic retinopathy. J Diabetes Res. 2014; 2014: 160140. [DOI] [PMC free article] [PubMed] [Google Scholar]
- 39. Leak RK. . Heat shock proteins in neurodegenerative disorders and aging. J Cell Commun Signal. 2014; 8: 293– 310. [DOI] [PMC free article] [PubMed] [Google Scholar]
- 40. Lackie RE, Maciejewski A, Ostapchenko VG,et al. The Hsp70/Hsp90 chaperone machinery in neurodegenerative diseases. Front Neurosci. 2017; 11: 254. [DOI] [PMC free article] [PubMed] [Google Scholar]
- 41. Ostapchenko VG, Beraldo FH, Mohammad AH,et al. The prion protein ligand, stress-inducible phosphoprotein 1, regulates amyloid-β oligomer toxicity. J Neurosci. 2013; 33: 16552– 16564. [DOI] [PMC free article] [PubMed] [Google Scholar]
- 42. Mencel M, Nash M, Jacobson C. . Neuregulin upregulates microglial α7 nicotinic acetylcholine receptor expression in immortalized cell lines: implications for regulating neuroinflammation. PLoS One. 2013; 8: e70338. [DOI] [PMC free article] [PubMed] [Google Scholar]
- 43. Alizadeh A, Dyck SM, Kataria H,et al. Neuregulin-1 positively modulates glial response and improves neurological recovery following traumatic spinal cord injury. Glia. 2017; 65: 1152– 1175. [DOI] [PubMed] [Google Scholar]
- 44. Li Y, Lein PJ, Ford GD,et al. Neuregulin-1 inhibits neuroinflammatory responses in a rat model of organophosphate-nerve agent-induced delayed neuronal injury. J Neuroinflammation. 2015; 12: 64. [DOI] [PMC free article] [PubMed] [Google Scholar]
- 45. Trudeau F, Gagnon S, Massicotte G. . Hippocampal synaptic plasticity and glutamate receptor regulation: influences of diabetes mellitus. Eur J Pharmacol. 2004; 490: 177– 186. [DOI] [PubMed] [Google Scholar]
- 46. VanGuilder HD, Brucklacher RM, Patel K, Ellis RW, Freeman WM, Barber AJ. . Diabetes downregulates presynaptic proteins and reduces basal synapsin I phosphorylation in rat retina. Eur J Neurosci. 2008; 28: 1– 11. [DOI] [PubMed] [Google Scholar]
- 47. Biessels GJ, Kamal A, Ramakers GM,et al. Place learning and hippocampal synaptic plasticity in streptozotocin-induced diabetic rats. Diabetes. 1996; 45: 1259– 1266. [DOI] [PubMed] [Google Scholar]
- 48. Kamal A, Biessels GJ, Duis SE, Gispen WH. . Learning and hippocampal synaptic plasticity in streptozotocin-diabetic rats: interaction of diabetes and ageing. Diabetologia. 2000; 43: 500– 506. [DOI] [PubMed] [Google Scholar]
- 49. Artola A, Kamal A, Ramakers GM, Biessels GJ, Gispen WH. . Diabetes mellitus concomitantly facilitates the induction of long-term depression and inhibits that of long-term potentiation in hippocampus. Eur J Neurosci. 2005; 22: 169– 178. [DOI] [PubMed] [Google Scholar]
- 50. Mattson MP, Cheng B, Davis D, Bryant K, Lieberburg I, . Rydel RE. beta-Amyloid peptides destabilize calcium homeostasis and render human cortical neurons vulnerable to excitotoxicity. J Neurosci. 1992; 12: 376– 389. [DOI] [PMC free article] [PubMed] [Google Scholar]
- 51. Hanger DP, Brion JP, Gallo JM, Cairns NJ, Luthert PJ, Anderton BH. . Tau in Alzheimer's disease and Down's syndrome is insoluble and abnormally phosphorylated. Biochem J. 1991; 275 Pt 1: 99– 104. [DOI] [PMC free article] [PubMed] [Google Scholar]
- 52. Witkovsky P, Veisenberger E, Haycock JW, Akopian A, Garcia-Espana A, Meller E. . Activity-dependent phosphorylation of tyrosine hydroxylase in dopaminergic neurons of the rat retina. J Neurosci. 2004; 24: 4242– 4249. [DOI] [PMC free article] [PubMed] [Google Scholar]
- 53. Yujnovsky I, Hirayama J, Doi M, Borrelli E, Sassone-Corsi P. . Signaling mediated by the dopamine D2 receptor potentiates circadian regulation by CLOCK:BMAL1. Proc Natl Acad Sci U S A. 2006; 103: 6386– 6391. [DOI] [PMC free article] [PubMed] [Google Scholar]
- 54. Gastinger MJ, Singh RS, Barber AJ. . Loss of cholinergic and dopaminergic amacrine cells in streptozotocin-diabetic rat and Ins2Akita-diabetic mouse retinas. Invest Ophthalmol Vis Sci. 2006; 47: 3143– 3150. [DOI] [PubMed] [Google Scholar]
- 55. Aung MH, Park HN, Han MK,et al. Dopamine deficiency contributes to early visual dysfunction in a rodent model of type 1 diabetes. J Neurosci. 2014; 34: 726– 736. [DOI] [PMC free article] [PubMed] [Google Scholar]
- 56. Lahouaoui H, Coutanson C, Cooper HM, Bennis M, Dkhissi-Benyahya O. . Diabetic retinopathy alters light-induced clock gene expression and dopamine levels in the mouse retina. Mol Vis. 2016; 22: 959– 969. [PMC free article] [PubMed] [Google Scholar]
- 57. Xu Q, Park Y, Huang X,et al. Diabetes and risk of Parkinson's disease. Diabetes Care. 2011; 34: 910– 915. [DOI] [PMC free article] [PubMed] [Google Scholar]
- 58. Ko HS, Kim SW, Sriram SR, Dawson VL, Dawson TM. . Identification of far upstream element-binding protein-1 as an authentic Parkin substrate. J Biol Chem. 2006; 281: 16193– 16196. [DOI] [PubMed] [Google Scholar]
Associated Data
This section collects any data citations, data availability statements, or supplementary materials included in this article.