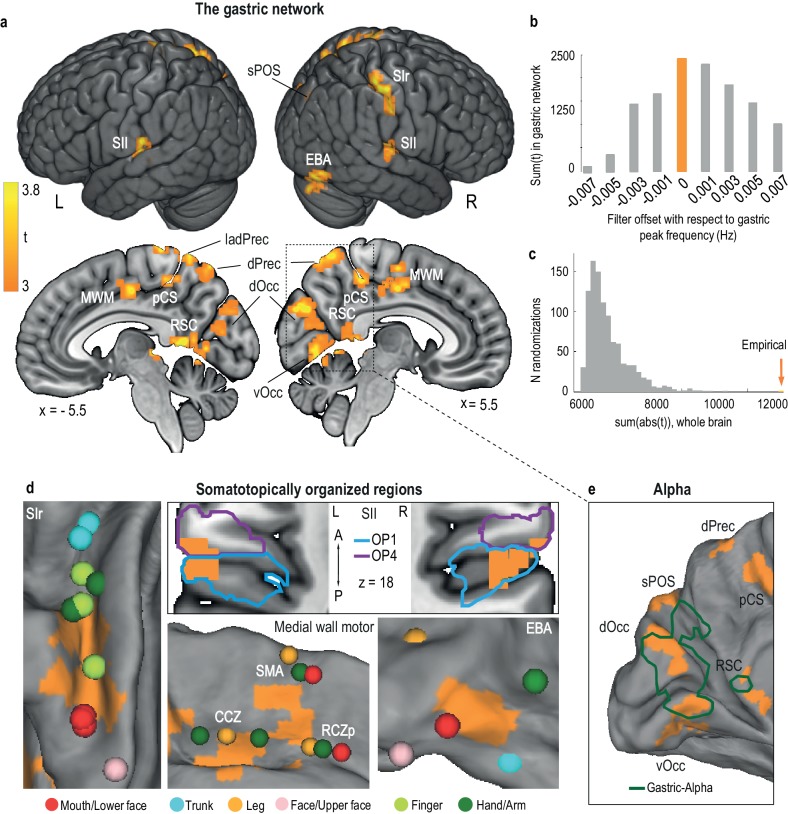
Figure 2. The gastric network.
(a) Regions significantly phase synchronized to gastric rhythm (n = 30, voxel level threshold, p<0.01 two-sided; cluster level threshold, p<0.05, two-sided, intrinsically corrected for multiple comparisons). (b) Gastric-BOLD coupling is specific to gastric frequency. Summary statistics in the gastric network are maximal at the EGG peak frequency (orange) and decrease when offsetting the filter to higher or lower frequencies. (c) Summary statistics distribution under the null hypothesis from 1000 surrogate datasets in which the EGG signal was time-shifted with respect to the BOLD signal. The empirical finding (orange arrow) falls well outside the null distribution. (d) The gastric network (orange) comprises the following somatotopically organized regions: primary somatosensory cortex (Panel SI, with peak activations during stimulation of the trunk and hand (Fabri et al., 2005), finger (Weibull et al., 2008), face (Kopietz et al., 2009), and mouth, that is, teeth (Trulsson et al., 2010), lips and tongue (Miyamoto et al., 2006); secondary somatosensory cortex (Panel SII, cytoarchitectonic subdivisions of SII according to (Scheperjans et al., 2008); OP1, parietal operculum 1 and OP4, parietal operculum 4, presented on a horizontal slice at z = 18); medial wall motor areas (Panel MWM, with peak activations during movement (Amiez and Petrides, 2014) in the caudate cingulate zone (CCZ), posterior rostral cingulate zone (RCZp) and supplementary motor area (SMA)); and extrastriate body area (Panel EBA with peak activations during body part viewing (Orlov et al., 2010), note that because of the visualization on an inflated cortex, the extension of the EBA node to the cerebellum is not visible). (e) Regions in which the alpha and gastric rhythms are coupled (green, modified from [Richter et al., 2017]). Abbreviations are the same as those in Table 1.


