
Figure 3. Overlap between the gastric network and regions correlating with heart rate variability and pupil size.
(A) Random effects analysis across participants (N = 30), for the main effects of high- (blue) and low (green)-frequency heart rate variability power fluctuations presented on an inflated brain (pFWE < 0.05 and 30 voxels). The gastric network is represented in orange. (B) Random effects analysis across participants (N = 20), for the main effect of pupil diameter (pink; threshold p<0.001 and 30 voxels). At this threshold, only negative correlations were observed.
Figure 3—source data 1. Csv with peak coordinates for group results on high frequency heart rate variability.
elife-33321-fig3-data1.csv (6.3KB, csv)
DOI: 10.7554/eLife.33321.013
Figure 3—source data 2. Csv with peak coordinates for group results on low frequency heart rate variability.
elife-33321-fig3-data2.csv (5.1KB, csv)
DOI: 10.7554/eLife.33321.014
Figure 3—source data 3. Csv with peak coordinates for group results on pupil diameter.
elife-33321-fig3-data3.csv (3KB, csv)
DOI: 10.7554/eLife.33321.015
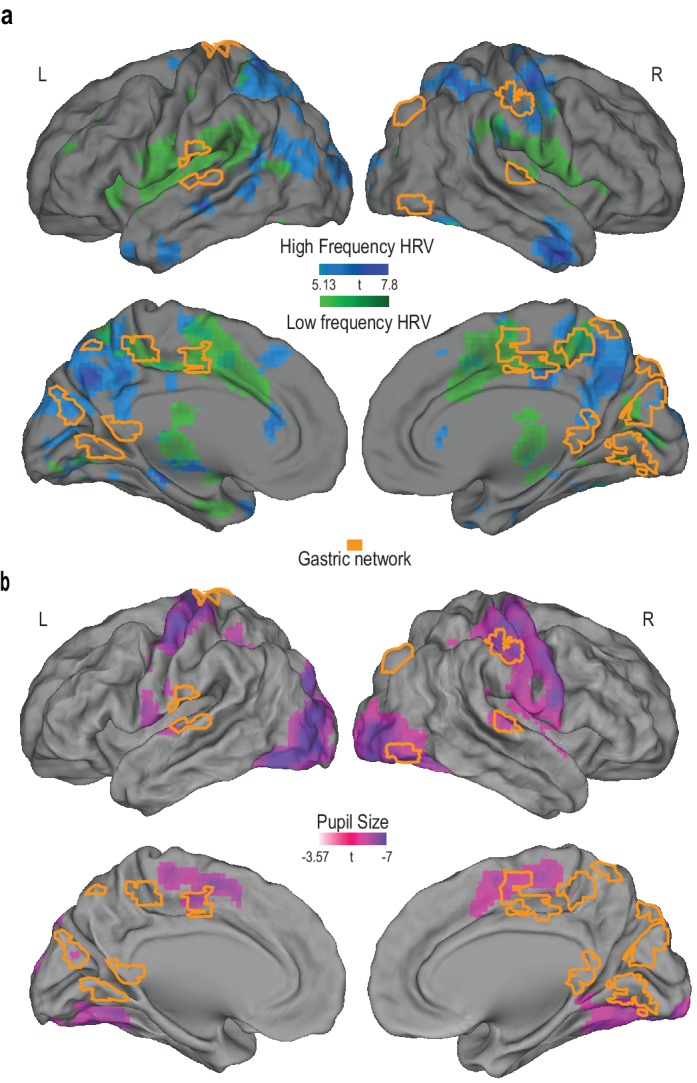
Figure 3—figure supplement 1. Overlap between the gastric network and meta-analytic sympathetic and parasympathetic regions.

(A) Meta-analytic activations (Beissner et al., 2013) during tasks eliciting sympathetic responses (electrodermal activity, EDA, in green) are superimposed on the gastric network (orange). Dotted lines illustrate the extension of autonomic activity in the depth of the opercular and temporal regions. (B) Comparison of high-frequency (blue) and low-frequency (green) heart rate variability in resting state (n = 30) with a (mostly task-based) meta-analysis (Beissner et al., 2013) of high-frequency variability (light blue) and electrodermal activity (green, same as in A).