

Abstract
Host-associated microbial communities consist of stable and transient members that can assemble through purely stochastic processes associated with the environment or by interactions with the host. Phylosymbiosis predicts that if host-microbiota interactions impact assembly patterns, then one conceivable outcome is concordance between host evolutionary histories (phylogeny) and the ecological similarities in microbial community structures (microbiota dendrogram). This assembly pattern has been demonstrated in several clades of animal hosts in laboratory and natural populations, but in vertebrates it has only been investigated using samples from feces or the distal colon. Here, we collected the contents of five gut regions from seven rodent species and inventoried the bacterial communities by sequencing the 16S rRNA gene. We investigated how community structures varied across gut regions and whether the pattern of phylosymbiosis was present along the length of the gut. Gut communities varied by host species and gut region, with Oscillospira and Ruminococcus being more abundant in the stomach and hindgut regions. Gut microbial communities were highly distinguishable by host species across all gut regions, with the strength of the discrimination increasing along the length of the gut. Last, the pattern of phylosymbiosis was found in all five gut regions, as well as feces. Aspects of the gut environment, such as oxygen levels, production of antimicrobials, or other factors may shift microbial communities across gut regions. However, regardless of these differences, host species maintain distinguishable, phylosymbiotic assemblages of microbes that may have functional impacts for the host.
Introduction
Symbiotic interactions between microbes and hosts can have profound impacts on the ecology and evolution of animals (Kohl & Carey 2016; McFall-Ngai et al. 2013). Given the ubiquity and importance of host-microbiota interactions, hosts can be structurally defined as holobionts that refer to individual hosts plus all of their stable and transient microbes (Bordenstein & Theis 2015; Theis et al. 2016). Several outstanding questions remain regarding the nature of holobionts. Are microbial communities stochastically assembled from environmental influences, or might there be deterministic assembly mechanisms that predict these associations? If there are microbiota differences between species, are they meaningful in an evolutionarily informed manner? How do different anatomical sites differentially affect assembly of the microbial community?
Recently, we established the assembly pattern of phylosymbiosis as a widespread phenomenon across several animal groups (Brooks et al. 2016). Phylosymbiosis hypothesizes that microbial communities should be more similar within a host species compared to across species, and that increasing genetic divergence between host species will be associated with greater differences in their microbial communities (Bordenstein & Theis 2015; Brucker & Bordenstein 2012, 2013). As a result, one would expect concordance between the evolutionary history of host species and a dendrogram of the similarities in host-associated microbial community structures (Brooks et al. 2016). Importantly, phylosymbiosis does not assume vertical transmission, coevolution, or codiversification, given that many microbial communities may be assembled newly each generation (Brooks et al. 2016).
Moreover, this pattern has a functional component such that animal hosts subjected to interspecific microbial transplants exhibit decreased performance and survival compared to hosts receiving intraspecific microbial transplants (Brooks et al. 2016). In previous studies of vertebrate hosts, phylosymbiosis was only investigated using fecal samples (Peromyscus deer mice: (Brooks et al. 2016); apes: (Ochman et al. 2010); American pikas: (Kohl et al. 2017b), or samples from the distal colon (bats: (Phillips et al. 2012). Fecal samples represent the composite of several gut regions, with a bias towards the hindgut, and do not necessarily reflect the hindgut community (Kohl & Dearing 2014), and do not represent a functional community as it is not interacting extensively with the host. Further, the physiochemical conditions of digesta can vary widely over the course of the gut. For example, the gastric stomach typically has a highly acidic pH, while other gut regions maintain a circumneutral pH (Kohl et al. 2013). Additionally, levels of oxygen, production of antimicrobial and immune products, and gut motility all vary along the length of the gut (Donaldson et al. 2016). As a result, the microbial communities of various animal holobionts differ across gut regions (Kohl et al. 2017a; Kohl & Dearing 2014; Suzuki & Nachman 2016). To date, it is unknown whether the pattern of phylosymbiosis exhibited in fecal material exists in other gut regions. Given that phylosymbiosis has a functional component, it is important to understand whether the pattern of phylosymbiosis is present throughout the gastrointestinal tract, since the functions of gut chambers, as well as the nature of host-microbe interactions may also vary across gut regions.
The gut microbiome can be impacted many dimensions of an animal’s ecology, physiology and behavior. However, in this study we controlled for these factors by choosing closely related species (sister taxa), by using animals that had been bred in captivity for >13 generations, and by maintaining them on the same diet (with the exception of Neotoma). While differences in ecology, physiology or behavior may contribute to sculpting the microbial communities, we would not expect these factors to do so in a manner that corresponded with the evolutionary history of the group. Using the microbial inventories from this experiment, we addressed the following questions: 1) Across host species, do gut regions harbor distinct microbial communities? 2) Within each gut region, are the microbial communities of various host species distinguishable? and if so, 3) Does the pattern of phylosymbiosis exist across gut regions? These results will help to reveal how microbial communities structure across gut regions and host species.
Methods
Animals and Sample Collection
We obtained female individuals of Peromyscus species (P. polionotus, P. maniculatus, P. leucopus, P. eremicus, P. californicus, 5 individuals per species, except for P. maniculatus, where n = 3) from the Peromyscus Genetic Stock Center at the University of South Carolina. We also obtained two female individuals of Neotoma lepida (Neotoma is the sister genus of Peromyscus) captured from near White Rocks, Tooele County, Utah (40°19′N, 112°54′W). Last, we obtained four female individuals of wild, outbred Mus musculus from Dr. Wayne Potts (University of Utah). The founding animals of this M. musculus colony were collected from near Gainesville, Florida, USA. These animals have been randomly bred in captivity for roughly 13 generations, and maintain an outbred condition (Gaukler et al. 2016; Meagher et al. 2000). All rodent species were maintained on powdered laboratory rodent chow (Formula 8904, Harlan Teklad, Madison, WI), except for woodrats, which were fed powdered rabbit chow (Formula 2031, Harlan Teklad, Madison, WI), given that woodrats are herbivorous and develop diabetes and metabolic syndromes when fed omnivorous diets (Post et al. 2015; Schmidt-Nielsen et al. 1964). Individuals of M. musculus and of Peromyscus spp. were between 5 and 8 months old, and were co-housed (within species) prior to our experiment. Animals were then housed singly in shoebox cages for a period of 5 weeks. Last, animals were placed in wire-bottom metabolic cages the evening prior to dissection to collect fecal samples. Fecal samples were frozen on dry ice and stored at -80°C.
All animals were euthanized with an overdose of isoflurane. We immediately dissected animals and collected contents of the foregut (fornix ventricularis or fundus), acidic stomach, small intestine, cecum, and large intestine. All contents were frozen on dry ice and stored at -80°C. All procedures involving rodents were approved under the University of Utah Institutional Animal Care and Use Committee protocol #12-12010.
Microbial inventories and data analysis
Total DNA was extracted from samples (~0.25g of material) using the MoBio PowerFecal DNA isolation kit, which includes vortexing with garnet beads to facilitate cell lysis. We also conducted six ‘blank’ extractions to correct for contaminants found in DNA extraction kits (Salter et al. 2014). Extracted DNA was sent to Argonne National Laboratory for sequencing. The primers 515F and 806R were used to amplify the V4 region of the 16S rRNA gene (Caporaso et al. 2012). PCR reactions were conducted in triplicate and the resulting products were pooled within a single sample. DNA was quantified using PicoGreen (Life Technologies, Carlsbad, CA) and a plate reader and cleaned using the UltraClean PCR Clean-Up Kit (MoBIO, Carlsbad, CA). Amplicons were sequenced on the Illumina MiSeq platform using previously described techniques (Caporaso et al. 2012).
Microbial sequences were analyzed using the QIIME version 1.9.1 (Caporaso et al. 2010). We applied standard quality control settings and split sequences into libraries using default parameters in QIIME. Sequences were grouped into de novo operational taxonomic units (OTUs) using a minimum sequence identity of 99%. The most abundant sequences within each OTU were designated as a “representative sequence” and aligned against the Greengenes core set (DeSantis et al. 2006) using PyNAST (Caporaso et al. 2009) with default parameters set by QIIME. FastTree (Price et al. 2009) was used to generate a phylogenetic tree of representative sequences. Taxonomic classification of OTUs was performed using UCLUST (Edgar 2010). Singleton OTUs and sequences identified as chloroplasts or mitochondria were removed from the analysis. Any OTUs present in the ‘blank samples’ were considered contaminants and were removed from all other samples (Salter et al. 2014).
We first tested the effects of gut region and host species on microbial community membership and diversity. We calculated Faith’s phylogenetic diversity (Faith 1992). We calculated the mean of 20 iterations for a sub-sampling of 280 sequences per sample, a number that was determined as the lowest sequence return for any given sample. Such sequence numbers are sufficient for differentiating microbial communities. Three studies on various sample types (soil, human- and animal- associated microbiota, etc.) have demonstrated that ~100 sequences per sample are sufficient to detect differences in community structure and membership, and that sequence depth beyond that provides little utility in detecting changes (Caporaso et al. 2012; Kuczynski et al. 2010a; Kuczynski et al. 2010b). Phylogenetic diversity was compared across samples using ANOVAs with the fixed effects of host species and gut region, an interaction term of host species × gut region, and including individual as a random effect. Microbial community structures were compared by conducting Principal Coordinates Analysis (PCoA) using Bray-Curtis distances calculated using 280 sequences per sample. We then conducted the ANOSIM test on the resulting distance matrix with host species and gut region as independent variables, using 999 permutations. We also investigated which microbial genera differed in relative abundance across gut regions. Relative abundances of 142 bacterial genera were compared using LefSe (Segata et al. 2011), with a logarithmic LDA score threshold of 4.0, using gut regions as the ‘class’ and host species as the ‘subclass’. We applied the False Discovery Rate correction to P-values to correct for multiple tests (Benjamini & Hochberg 1995).
Next, we tested whether host species were distinguishable across all gut regions, and whether this distinguishability varied across gut regions. For these following analyses, each gut region was tested separately, though the sample sizes and rarefied sequence numbers were identical for all gut regions. First, we conducted Principal Coordinates Analysis (PCoA) using Bray-Curtis distances calculated using 280 sequences per sample. We conducted 20 iterations of this analysis, and compiled the resulting ANOSIM R-statistics for each gut region. Each ANOSIM analysis still used 999 permutations; we conducted this test 20 times to obtain a range of ANOSIM R-values, which range from 0 to 1. An ANOSIM R-value of 0 means that all communities would be identical, while and R-value of 1 signifies that communities are highly distinguishable across groups (Clarke 1993). We qualitatively evaluated whether the ANOSIM R-statistic changed across the gut. We also investigated which microbial taxa distinguished host species across gut regions. Relative abundances of 142 bacterial genera were compared using LefSe (Segata et al. 2011), with a logarithmic LDA score threshold of 4.0.
Last we tested whether microbial signatures exhibited phylosymbiotic patterns across gut regions. We conducted the following analysis separately for each gut region. First, sequences were collapsed by host species. Then, we used the command jackknifed_beta_diversity.py within QIIME to generate UPGMA trees of the microbial communities, using 970 sequences per host species and 20 iterations. This command also produced a consensus tree. We compared topologies of microbiome dendrograms to previously published rodent host phylogenies (Platt et al. 2015; Stepphan et al. 2004) by calculating the Robinson-Foulds and Matching cluster congruency scores as described previously (Brooks et al. 2016). Matching cluster and Robinson±Foulds p –values were determined by the probability of 100,000 randomized bifurcating dendrogram topologies yielding equivalent or more congruent phylosymbiotic patterns than the microbiota dendrogram (Brooks et al. 2016).
Results
Our sequencing effort resulted in over 419,000 sequences. Sequence return varied by mouse species, gut region, and with a significant species × gut region interaction (P < 0.001 for all effects). Foregut and stomach samples exhibited the lowest sequence returns, while large intestine and fecal samples had the highest. Average numbers of sequences per sample type can be found in Supplementary Table 1.
Microbial phylogenetic diversity varied significantly across species (Fig. 1A; F6,132 = 40.04, P < 0.0001), such that M. musculus exhibited the lowest diversity, while P. californicus, P. maniculatus, P. leucopus, and P. polionotus all had the highest diversity. Additionally, phylogenetic diversity differed significantly by gut region (Fig. 1A; F5,132 = 77.86, P < 0.0001), with the foregut and small intestine harboring the lowest diversity, while the highest diversity was found in the cecum, large intestine, and fecal communities. There was no significant species × gut region interaction effect for the measurement of phylogenetic diversity (F30,132 = 1.18, P = 0.25). Principal coordinate analysis of microbial inventories also demonstrated that beta diversity of microbial communities was structured by both species and gut region. When investigating all samples, both host species (Fig. 1B, ANOSIM test: R = 0.76, P<0.001) and gut region (Fig. 1C, ANOSIM test: R = 0.26, P<0.001) had significant effects on microbial community structure. When using all samples, two microbial genera varied in abundance across gut regions: Oscillospira (Fig. 1D; logarithmic LDA score: 5.01; FDR-corrected P < 0.0001), and Ruminococcus (Fig. 1E; logarithmic LDA score: 4.81; FDR-corrected P < 0.0001). These genera were most abundant in the stomach and hindgut regions.
Figure 1.

Variation in microbial communities across gut regions. (A) Faith’s phylogenetic diversity of various rodent species across gut regions. (B) Principal coordinate plot of Bray-Curtis distances with samples colored by host species. (C) Principal coordinate plot of Bray-Curtis distances with samples colored by gut region. (D) Relative abundances of the genus Oscillospira across gut regions. (E) Relative abundances of the genus Ruminococcus across gut regions. Bars represent means ± s.e.m. PEPO: Peromyscus polionotus. PEMA: P. maniculatus. PELE: P. leucopus. PEER: P. eremicus. PECA: P. californicus. NELE: Neotoma lepida. MUMU: Mus musculus.
Next, we investigated whether microbial communities were distinguishable across all gut regions. We divided samples by gut region, and performed 20 iterations of the ANOSIM test in each gut region. In all cases, P-values were less than 0.001, demonstrating that host species are distinguishable across all gut regions. We also qualitatively compared the ANOSIM test statistic across gut regions. Again, an ANOSIM R-value of 0 means that all communities would be identical, while and R-value of 1 signifies that communities are highly distinguishable across groups. From our data, the ANOSIM R-values increase along the length of the gut, suggesting that communities become more differentiated across host species in the hindgut (Fig. 2).
Figure 2.
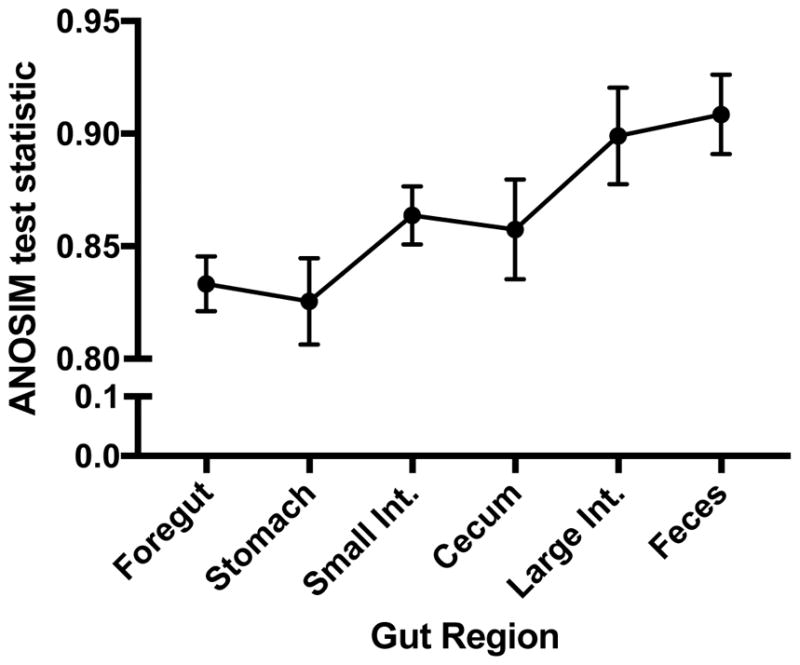
Values of the ANOSIM test statistic across gut regions, using host species as the explanatory variable. An ANOSIM R-value of 0 means that all communities would be identical, while and R-value of 1 signifies that communities are highly distinguishable across groups Points represent mean ± s.e.m. for 20 iterations of the analysis.
We also investigated the genera that differentiate host species along the length of the gut. The relative abundances of Lactobacillus and Allobaculum differed significantly across host species in almost all gut regions (Fig. 3). Additionally, many other genera differed across hosts, with the number of significantly different genera being higher in the hindgut (Fig. 3).
Figure 3.

Microbial genera that are significantly different across host species in each gut region. LefSe analysis was conducted to determine genera that were differentially abundant in each gut section. Values next to genus names are the logarithmic LDA scores. Graphs depict mean ± s.e.m. abundances of Lactobacillus and Allobaculum, as these genera often were differentially abundance across host species. PEPO: Peromyscus polionotus. PEMA: P. maniculatus. PELE: P. leucopus. PEER: P. eremicus. PECA: P. californicus. NELE: Neotoma lepida. MUMU: Mus musculus.
Last, we investigated whether the distinguishable communities also followed patterns of phylosymbiosis. Indeed, using both the Robinson Foulds and Matching Cluster methods, there were significant patterns of phylosymbiosis across all gut regions (Figure 4, Table 1).
Figure 4.

Comparison of dendrograms of microbial community structures and host phylogeny. Microbial dendrograms are consensus trees from 20 iterations of a subsampling of 970 sequences. Values at nodes are jackknife support values. Even though these values are low at some nodes, it should be noted that this only represents a consensus tree, and statistics were conducting using the full set of iterations. Host phylogeny is from Platt et al. 2015 and Stepphan et al. 2004. PEPO: Peromyscus polionotus. PEMA: P. maniculatus. PELE: P. leucopus. PEER: P. eremicus. PECA: P. californicus. NELE: Neotoma lepida. MUMU: Mus musculus.
Table 1.
Results from analyses for phylosymbiosis across gut regions. Normalized Robinson-Foulds (RF) and normalized Matching Cluster (MC) metrics were determined following the methods by Brooks et al. 2016. Normalized metrics (nRF and nMC) scale from 0.0 (complete congruence) to 1.0 (complete incongruence).
| Robinson-Foulds | Matching Cluster | |||
|---|---|---|---|---|
| nRF | P | nMC | P | |
| Foregut | 0.42 | 0.005 | 0.34 | 0.005 |
| Stomach | 0.58 | 0.005 | 0.32 | <0.001 |
| Small Int. | 0.60 | 0.04 | 0.33 | 0.005 |
| Cecum | 0.52 | 0.005 | 0.28 | <0.001 |
| Large Int. | 0.56 | 0.005 | 0.33 | 0.005 |
| Feces | 0.44 | 0.005 | 0.33 | <0.001 |
Discussion
Previous studies investigating assembly of gut microbial communities have demonstrated phylosymbiosis in several vertebrate holobionts. However, these studies were all conducted using feces or samples from the distal colon (Brooks et al. 2016; Kohl et al. 2017b; Ochman et al. 2010; Phillips et al. 2012). Given that the nature of host-microbe interactions can vary across gut regions (Donaldson et al. 2016), we tested whether phylosymbiotic trends exist along the gut. We found that microbial communities vary along the length of the gastrointestinal tract, but that host species are still distinguishable in each gut region, and that phylosymbiosis also is detectable across the various microbial communities present in the different regions of the gut.
First, we compared diversity and microbial community composition across gut regions. Measurements of phylogenetic diversity varied significantly, such that the hindgut regions (cecum, large intestine, feces) had the highest diversity. These results are consistent with other studies that found highest diversity in the hindgut regions of rodents (Kohl & Dearing 2014; Suzuki & Nachman 2016) and reptiles (Colston et al. 2015; Kohl et al. 2017a). In general, the hindgut is more supportive for microbial growth, as it has lower oxygen concentrations, neutral pH, and reduced production of antimicrobial compounds (Donaldson et al. 2016), which may favor the growth of a more diverse microbial community. For example, the cecum is a region known for high microbial activity as evidenced by high levels of VFA production, which the host can use an energy source (Stevens & Hume 2004).
Across all samples, we found that both gut region and host species determined microbial community structure, with host species having a greater effect. The relative abundances of two microbial genera, Ruminococcus and Oscillospira, exhibited differential abundances across gut regions. Notably, their abundances were higher in hindgut regions and the gastric stomach. The genus Ruminococcus is known to degrade fiber (Leatherwood 1965), and dominates the hindgut communities of other species, such as koalas (Barker et al. 2013) and lizards (Kohl et al. 2017a). The specific functions of the genus Oscillospira are unclear due to the fact that it has not been cultured (Konikoff & Gophna 2016). In humans, relative abundances of this genus increase when individuals are feeding on animal-based diets (David et al. 2014), and genome reconstruction from metagenomic analysis of the human gut microbiota suggest that human-associated species of Oscillospira utilize host-produced sugars (Gophna et al. 2017). However, in other animals, the genus Oscillospira has been hypothesized to play roles in fiber fermentation, given its presence in the in the guts of many ruminants and other herbivores (Kohl & Dearing 2014; Mackie et al. 2003). For example ruminants fed fresh forage exhibit higher abundances of Oscillospira compared to those fed low-fiber grain, and microscopy reveals that these bacteria associate with the surfaces of plant material in the gut (Mackie et al. 2003). Further, high-fiber diets increase the abundance of Oscillospira in the guts of lizards (Kohl et al. 2016a). The rodents in our study may maintain higher abundance of Ruminococcus and Oscillospira in the hindgut to aid in the digestion of dietary fiber.
It is unclear why the relative abundances of Ruminococcus and Oscillospira are also high in the gastric stomach. Isolated species of Ruminococcus cannot grow below a pH of ~6 (Russell & Dombrowski 1980), yet the pH of the rodent gastric stomach is between 1.5 and 4 (Kohl et al. 2013). A recent study that inventoried of the gut microbiota of Plateau pikas (Ochotona curzoniae) and Daurian pikas (Ochotona daurica) also found that Oscillospira and Ruminoccocus dominate the stomach communities of these mammals (Li et al. 2017), and similar results have been found in another woodrat species, Neotoma albigula (Kohl & Dearing 2014). However, it should be noted that relative abundances of microbes based on 16S rRNA sequences cannot discriminate between live and dead bacteria. Future studies could probe the microbial function of the gastric stomach through metatranscriptomic approaches.
We observed that microbial communities were distinguishable across host species for all gut regions. Additionally, the distinguishability of host-associated microbiotas seemed to increase along the length of the gut. Similarly, the effect of ‘individual’ is a strong determinant of the hindgut microbial community membership and structure in mice, but less so in the upper gastrointestinal tract (esophagous, stomach, small intestine; (Suzuki & Nachman 2016). Thus, there seems to be higher selectivity for individual- or species-specific microbes towards the end of the gut. This result could be due to the digestion and removal of transient microbes, which are often present in food material (Lang et al. 2014), yet make up a small proportion of the fecal microbiome (Kohl et al. 2017a). Additionally, there may be variation in the gut environment, such as lower oxygen concentrations, differential production of immune compounds, etc. that select for a specific microbiome in the hindgut. In rodents, the hindgut, particularly the cecum is critical in the generation of energy for the host through the fermentation of fiber (Stevens & Hume 2004). It is possible that this critical function of the hindgut drives the strong relationship between host evolutionary history and microbial communities. This notion is also consistent with the prediction of phylosymbiosis that function ultimately governs the underlying community structure.
Last, we observed that the pattern of phylosymbiosis existed across all gut regions. Thus, there is significant ecological structuring of gut microbial communities in concordance with host phylogeny. We have previously discussed mechanisms which may underlie patterns of phylosymbiosis (Brooks et al. 2016), such as control by the host immune system (Franzenburg et al. 2013), vertical transmission of microbial communities or keystone taxa (Funkhouser & Bordenstein 2013), or microbial selection of appropriate environments (Costello et al. 2012). Our results notably suggest that these mechanisms apply to communities along the entire length of the gut, even early on in the foregut. It would be interesting to investigate these trends in other body sites, such as inventorying the oral, respiratory, or skin microbiome, which may help to illuminate how widespread this phenomenon is across the bodies of vertebrates. Interestingly, phylosymbiosis has been observed in the host-associated microbiota of sponges (Easson & Thacker 2014) and hydra (Fraune & Bosch 2007), which are largely exposed to the external environment, suggesting strong host control of these communities.
Our study aimed to minimize the effects of environmental variability by using animals that have been bred in captivity for >13 generations (with the exception of Neotoma). In nature, animals are exposed to the microbiota of soil, their food sources, conspecifics, and other microbial sources (Kohl et al. 2016b; Kohl & Dearing 2014; Smith et al. 2015). Moreover, ecological differences such as social interactions (Tung et al. 2015), diet (Bolnick et al. 2014), or rates of coprophagy (Fitzgerald et al. 1964) can influence gut microbial communities. These exposures and ecological differences may enhance or overwhelm the ability to detect phylosymbiotic signatures. Indeed, when comparing the microbiota of syntopic individuals of P. maniculatus and P. leucopus, these species were indistinguishable (Baxter et al. 2015). It is possible that some ecological differences from nature persist in captivity, as wild-caught rodents retain a majority of their wild microbiome (Kohl & Dearing 2014), and some of the gut microbiota is transmitted from generation to generation (Funkhouser & Bordenstein 2013; Kohl et al. 2014).
Additionally, physiological differences between species may persist in captivity, and obscure the ability to detect phylosymbiosis. In our study and a previous investigation into phylosymbiosis (Brooks et al. 2016), the samples from P. eremicus exhibit strong differences from other species of Peromyscus and do not follow the patterns of phylosymbiosis. For example, in the current study P. eremicus exhibited much lower microbial diversity compared to the other Peromsycus species. The colony of P. eremicus has been bred in captivity since 1993, and was being fed the same diet as all other species. However, P. eremicus, also known as the cactus mouse, is a desert-adapted species, and exhibits much lower rates of voluntary drinking compared to other Peromyscus species (Glenn 1970). This difference, or other physiological adaptations in this species may affect the gut microbial community structure, even in captivity.
Overall, we found that the gut microbiota varies across gut regions of closely related rodent hosts, and that this variance is consistent with host evolutionary history, resulting in a pattern of phylosymbiosis. We have previously demonstrated that phylosymbiosis among species of Permoyscus has a functional component such that individuals of P. polionotus inoculated with the microbial communities from more distantly related host species exhibited a reduced ability to digest food material (Brooks et al. 2016). Future studies could investigate how these interspecific inoculations impact phylosymbiosis across gut regions to determine where recipient animals are most affected, and how these effects might contribute to the overall decrease in digestibility. Together, investigations into phylosymbiosis across body sites, as well as further studies focused on underlying mechanisms and functional effects will enhance our understanding of how natural selection may act on the collective of the host and microbiome known as the holobiont.
Supplementary Material
Acknowledgments
This work was supported by the National Institutes of Health (T32DK007673 Training Grant to K.D.K.) and the National Science Foundation (DBI 1400456 to KDK; DEB 1046149 and IOS 1456778 to SRB; DEB 1342615 to M.D.D.) and the Vanderbilt Microbiome Initiative sponsored by the Tran-Institutional Programs.
Footnotes
This is a manuscript for the Special Issue: “The Host-Associated Microbiome: Pattern, Process, and Function”
Data Accessibility - All 16S rRNA sequences have been deposited in the Sequence Read Archive (SRA) under accessions PRJNA412990.
References
- Barker CJ, Gillett A, Polkinghorne A, Timms P. Investigation of the koala (Phascolarctos cinereus) hindgut microbiome via 16S pyrosequencing. Vet Microbiol. 2013;167:554–564. doi: 10.1016/j.vetmic.2013.08.025. [DOI] [PubMed] [Google Scholar]
- Baxter NT, Wan JJ, Schubert AM, et al. Intra- and interindividual variations mask interspecies variations in the microbiota of sympatric Peromyscus populations. Appl Environ Microbiol. 2015;81:396–404. doi: 10.1128/AEM.02303-14. [DOI] [PMC free article] [PubMed] [Google Scholar]
- Benjamini Y, Hochberg Y. Controlling the false discovery rate: a practical and powerful approach to multiple testing. J R Stat Soc Series B Stat Methodol. 1995;57:289–300. [Google Scholar]
- Bolnick DI, Snowberg LK, Hirsch PE, et al. Individuals’ diet diversity influences gut microbial diversity in two freshwater fish (threespine stickleback and Eurasian perch) Ecol Lett. 2014;17:979–987. doi: 10.1111/ele.12301. [DOI] [PMC free article] [PubMed] [Google Scholar]
- Bordenstein SR, Theis KR. Host biology in light of the microbiome: ten principles of holobionts and hologenomes. PLoS Biol. 2015;13:e1002226. doi: 10.1371/journal.pbio.1002226. [DOI] [PMC free article] [PubMed] [Google Scholar]
- Brooks AW, Kohl KD, Brucker RM, van Opstal EJ, Bordenstein SR. Phylosymbiosis: Relationships and functional effects of microbial communities across host evolutionary history. PLoS Biol. 2016;14:e2000225. doi: 10.1371/journal.pbio.2000225. [DOI] [PMC free article] [PubMed] [Google Scholar]
- Brucker RM, Bordenstein SR. Speciation by symbiosis. Trends Ecol Evol. 2012;27:443–451. doi: 10.1016/j.tree.2012.03.011. [DOI] [PubMed] [Google Scholar]
- Brucker RM, Bordenstein SR. The hologenomic basis of speciation: gut bacteria cause hybrid lethality in the genus Nasonia. Science. 2013;341:667–669. doi: 10.1126/science.1240659. [DOI] [PubMed] [Google Scholar]
- Caporaso JG, Bittinger K, Bushman FD, et al. PyNAST: a flexible tool for aligning sequences to a template alignment. Bioinformatics. 2009;26:266–267. doi: 10.1093/bioinformatics/btp636. [DOI] [PMC free article] [PubMed] [Google Scholar]
- Caporaso JG, Kuczynski J, Stombaugh J, et al. QIIME allows analysis of high-throughput community sequencing data. Nat Method. 2010;7:335–336. doi: 10.1038/nmeth.f.303. [DOI] [PMC free article] [PubMed] [Google Scholar]
- Caporaso JG, Lauber CL, Walters WA, et al. Ultra-high-throughput microbial community analysis on the Illumina HiSeq and MiSeq platforms. ISME Journal. 2012;6:1621–1624. doi: 10.1038/ismej.2012.8. [DOI] [PMC free article] [PubMed] [Google Scholar]
- Clarke KR. Non-parametric multivariate analyses of changes in community structure. Aust J Ecol. 1993;18:117–143. [Google Scholar]
- Colston TJ, Noonan BP, Jackson CR. Phylogenetic analysis of bacterial communities in different regions of the gastrointestinal tract of Agkistrodon piscivorus, the cottonmouth snake. PLoS One. 2015;10:e0128793. doi: 10.1371/journal.pone.0128793. [DOI] [PMC free article] [PubMed] [Google Scholar]
- Costello EK, Stagaman K, Dethlefsen L, Bohannan BJM, Relman DA. The application of ecological theory toward an understanding of the human microbiome. Science. 2012:336. doi: 10.1126/science.1224203. [DOI] [PMC free article] [PubMed] [Google Scholar]
- David LA, Maurice CF, Carmody RN, et al. Diet rapidly and reproducibly alters the human gut microbiome. Nature. 2014;505:559–563. doi: 10.1038/nature12820. [DOI] [PMC free article] [PubMed] [Google Scholar]
- DeSantis TZ, Hugenholtz P, Larsen N, et al. Greengenes, a Chimera-Checked 16S rRNA Gene Database and Workbench Compatible with ARB. Appl Environ Microbiol. 2006;72:5069–5072. doi: 10.1128/AEM.03006-05. [DOI] [PMC free article] [PubMed] [Google Scholar]
- Donaldson GP, Lee SM, Mazmanian SK. Gut biogeography of the bacterial microbiota. Nat Rev Microbiol. 2016;14:20–32. doi: 10.1038/nrmicro3552. [DOI] [PMC free article] [PubMed] [Google Scholar]
- Easson CG, Thacker RW. Phylogenetic signal in the community structure of host-specific microbiomes of tropical marine sponges. Front Microbiol. 2014;5:532. doi: 10.3389/fmicb.2014.00532. [DOI] [PMC free article] [PubMed] [Google Scholar]
- Edgar RC. Search and clustering orders of magnitude faster than BLAST. Bioinformatics. 2010;26:2460–2461. doi: 10.1093/bioinformatics/btq461. [DOI] [PubMed] [Google Scholar]
- Faith DP. Conservation evaluation and phylogenetic diversity. Biol Conserv. 1992;61:1–10. [Google Scholar]
- Fitzgerald RJ, Gustafsson BE, McDaniel EG. Effects of coprophagy prevention on intestinal microflora in rats. J Nutr. 1964;84:155–160. doi: 10.1093/jn/84.2.155. [DOI] [PubMed] [Google Scholar]
- Franzenburg S, Walter J, Künzel S, et al. Distinct antimicrobial peptide expression determines host species-specific bacterial associations. Proc Natl Acad Sci. 2013;110:E3730–3738. doi: 10.1073/pnas.1304960110. [DOI] [PMC free article] [PubMed] [Google Scholar]
- Fraune S, Bosch TCG. Long-term maitenance of species-specific bacterial microbiota in the basal metazoan Hydra. Proc Natl Acad Sci. 2007;104:13146–13151. doi: 10.1073/pnas.0703375104. [DOI] [PMC free article] [PubMed] [Google Scholar]
- Funkhouser LJ, Bordenstein SR. Mom knows best: the universality of maternal microbial transmission. PLoS Biology. 2013;11:e1001631. doi: 10.1371/journal.pbio.1001631. [DOI] [PMC free article] [PubMed] [Google Scholar]
- Gaukler SM, Ruff JS, Galland T, et al. Quantification of cerivastatin toxicity supports organismal performance assays as an effective tool during pharmaceutical safety assessment. Evol Appl. 2016 doi: 10.1111/eva.12365. Online Ahead of Print. [DOI] [PMC free article] [PubMed] [Google Scholar]
- Glenn ME. Water relations in three species of deer mice (Peromyscus) Comp Biochem Physiol. 1970;33:231–248. [Google Scholar]
- Gophna U, Konikoff T, Nielsen HB. Oscillospira and related bacteria – From metagenomic species to metabolic features. Environ Microbiol. 2017;19:835–841. doi: 10.1111/1462-2920.13658. [DOI] [PubMed] [Google Scholar]
- Kohl KD, Brun A, Magallanes M, et al. Physiological and microbial adjustments to diet quality permit facultative herbivory in an omnivorous lizard. J Exp Biol. 2016a;219:1903–1912. doi: 10.1242/jeb.138370. [DOI] [PubMed] [Google Scholar]
- Kohl KD, Brun A, Magallanes M, et al. Gut microbial ecology of lizards: insights into diversity in the wild, effects of captivity, variation across gut regions and transmission. Mol Ecol. 2016b doi: 10.1111/mec.13921. Online Ahead of Print. [DOI] [PubMed] [Google Scholar]
- Kohl KD, Brun A, Magallanes M, et al. Gut microbial ecology of lizards: insights into diversity in the wild, effects of captivity, variation across gut regions and transmission. Mol Ecol. 2017a;26:1175–1189. doi: 10.1111/mec.13921. [DOI] [PubMed] [Google Scholar]
- Kohl KD, Carey HV. A place for host–microbe symbiosis in the comparative physiologist’s toolbox. J Exp Biol. 2016;219:3496–3504. doi: 10.1242/jeb.136325. [DOI] [PubMed] [Google Scholar]
- Kohl KD, Dearing MD. Wild-caught rodents retain a majority of their natural gut microbiota upon entrance into captivity. Environ Microbiol Rep. 2014;6:191–195. doi: 10.1111/1758-2229.12118. [DOI] [PubMed] [Google Scholar]
- Kohl KD, Skopec MM, Dearing MD. Captivity results in disparate loss of gut microbial diversity in closely related hosts. Conserv Physiol. 2014;2:cou009. doi: 10.1093/conphys/cou009. [DOI] [PMC free article] [PubMed] [Google Scholar]
- Kohl KD, Stengel A, Samuni-Blank M, Dearing MD. Effects of anatomy and diet on gastrointestinal pH in rodents. J Exp Zool: Ecol Genet Physiol. 2013;319:225–229. doi: 10.1002/jez.1786. [DOI] [PubMed] [Google Scholar]
- Kohl KD, Varner J, Wilkening JL, Dearing MD. Gut microbial communities of American pikas (Ochotona princeps): Evidence for phylosymbiosis and adaptations to novel diets. J Anim Ecol. 2017b doi: 10.1111/1365-2656.12692. Online Ahead of Print. [DOI] [PubMed] [Google Scholar]
- Konikoff T, Gophna U. Oscillospira: a central, enigmatic component of the human gut microbiota. Trends Microbiol. 2016;24:523–524. doi: 10.1016/j.tim.2016.02.015. [DOI] [PubMed] [Google Scholar]
- Kuczynski J, Costello EK, Nemergut DR, et al. Direct sequencing of the human microbiome readily reveals community differences. Genome Biol. 2010a;11:210. doi: 10.1186/gb-2010-11-5-210. [DOI] [PMC free article] [PubMed] [Google Scholar]
- Kuczynski J, Liu Z, Lozupone C, et al. Microbial community resemblance methods differ in their ability to detect biologically relevant patterns. Nat Method. 2010b;7:813–819. doi: 10.1038/nmeth.1499. [DOI] [PMC free article] [PubMed] [Google Scholar]
- Lang JM, Eisen JA, Zivkovic AM. The microbes we eat: abundance and taxonomy of microbes consumed in a day’s worth of meals for three diet types. Peer J. 2014;2:e659. doi: 10.7717/peerj.659. [DOI] [PMC free article] [PubMed] [Google Scholar]
- Leatherwood JM. Cellulase from Ruminococcus albus and mixed rumen microorganisms. Appl Environ Microbiol. 1965;13:771–775. doi: 10.1128/am.13.5.771-775.1965. [DOI] [PMC free article] [PubMed] [Google Scholar]
- Li H, Li T, Tu B, Kou Y, Li X. Host species shapes the co-occurrence patterns rather than diversity of stomach bacterial communities in pikas. Appl Microbiol Biotechnol. 2017;101:5519–5529. doi: 10.1007/s00253-017-8254-0. [DOI] [PubMed] [Google Scholar]
- Mackie RI, Aminov RI, Hu W, et al. Ecology of uncultivated Oscillospira species in the rumen of cattle, sheep, and reindeer as assessed by microscopy and molecular approaches. Appl Environ Microbiol. 2003;69:6808–6815. doi: 10.1128/AEM.69.11.6808-6815.2003. [DOI] [PMC free article] [PubMed] [Google Scholar]
- McFall-Ngai M, Hadfield MG, Bosch TCG, et al. Animals in a bacterial world, a new imperative for the life sciences. Proc Natl Acad Sci. 2013;110:3229–3236. doi: 10.1073/pnas.1218525110. [DOI] [PMC free article] [PubMed] [Google Scholar]
- Meagher S, Penn D, Potts W. Male-male competition magnifies inbreeding depression in wild house mice. Proc Natl Acad Sci. 2000;97:3324–3329. doi: 10.1073/pnas.060284797. [DOI] [PMC free article] [PubMed] [Google Scholar]
- Ochman H, Worobey M, Kuo CH, et al. Evolutionary relationships of wild hominids recapitulated by gut microbial communities. PLoS Biol. 2010;8:e1000546. doi: 10.1371/journal.pbio.1000546. [DOI] [PMC free article] [PubMed] [Google Scholar]
- Phillips CD, Phelan G, Dowd SE, et al. Microbiome analysis among bats describes influences of host phylogeny, life history, physiology, and geography. Mol Ecol. 2012;21:2617–2627. doi: 10.1111/j.1365-294X.2012.05568.x. [DOI] [PubMed] [Google Scholar]
- Platt RN, Amman BR, Keith MS, Thompson CW, Bradley RD. What Is Peromyscus? Evidence from nuclear and mitochondrial DNA sequences suggests the need for a new classification. J Mamm. 2015;96:708–719. doi: 10.1093/jmammal/gyv067. [DOI] [PMC free article] [PubMed] [Google Scholar]
- Post DM, Hawkins BL, Eldridge JA. The effects of nutrition-induced abnormal food metabolism in the Southern Plains woodrat (Neotoma micropus): comparisons of variations of the Western diet. J Anim Physiol Anim Nutr. 2015;99:29–36. doi: 10.1111/jpn.12224. [DOI] [PubMed] [Google Scholar]
- Price MN, Dehal PS, Arkin AP. FastTree: computing large minimum-evolution trees with profiles instead of a distance matrix. Mol Biol Evol. 2009;26:1641–1650. doi: 10.1093/molbev/msp077. [DOI] [PMC free article] [PubMed] [Google Scholar]
- Russell JB, Dombrowski DB. Effect of pH on the efficiency of growth by pure cultures of rumen bacteria in continuous culture. Appl Environ Microbiol. 1980;39:604–610. doi: 10.1128/aem.39.3.604-610.1980. [DOI] [PMC free article] [PubMed] [Google Scholar]
- Salter SJ, Cox MJ, Turek EM, et al. Reagent and laboratory contamination can critically impact sequence-based microbiome analyses. BMC Biol. 2014;12:87. doi: 10.1186/s12915-014-0087-z. [DOI] [PMC free article] [PubMed] [Google Scholar]
- Schmidt-Nielsen K, Haines HB, Hackel DB. Diabetes mellitus in the sand rat induced by standard laboratory diets. Science. 1964;143:689–690. doi: 10.1126/science.143.3607.689. [DOI] [PubMed] [Google Scholar]
- Segata N, Izard J, Waldron L, et al. Metagenomic biomarker discovery and explanation. Genome Biol. 2011;12:R60. doi: 10.1186/gb-2011-12-6-r60. [DOI] [PMC free article] [PubMed] [Google Scholar]
- Smith CCR, Snowberg LK, Caporaso JG, Knight R, Bolnick DI. Dietary input of microbes and host genetic variation shape among-population differences in stickleback gut microbiota. ISME Journal. 2015;9:2515–2526. doi: 10.1038/ismej.2015.64. [DOI] [PMC free article] [PubMed] [Google Scholar]
- Stepphan SJ, Adkins RM, Anderson J. Phylogeny and divergence-date estimates of rapid radiations in muroid rodents based on multiple nuclear genes. Syst Biol. 2004;53:533–553. doi: 10.1080/10635150490468701. [DOI] [PubMed] [Google Scholar]
- Stevens CE, Hume ID. Comparative Physiology of the Vertebrate Digestive System. 2. Cambridge University Press; Cambridge: 2004. [Google Scholar]
- Suzuki TA, Nachman MW. Spatial heterogeneity of gut microbial composition along the gastrointestinal tract in natural popualtions of house mice. PLoS One. 2016;11:e0163720. doi: 10.1371/journal.pone.0163720. [DOI] [PMC free article] [PubMed] [Google Scholar]
- Theis KR, Dheilly NM, Klassen JL, et al. Getting the hologenome concept right: An eco-evolutionary framework for hosts and their microbiomes. mSystems. 2016;1:e00028–00016. doi: 10.1128/mSystems.00028-16. [DOI] [PMC free article] [PubMed] [Google Scholar]
- Tung J, Barreiro LB, Burns MB, et al. Social networks predict gut microbiome composition in wild baboons. eLife. 2015;4:e05224. doi: 10.7554/eLife.05224. [DOI] [PMC free article] [PubMed] [Google Scholar]
Associated Data
This section collects any data citations, data availability statements, or supplementary materials included in this article.