

Graphical abstract
VK2 induced cell death in prostate cancer (VCaP) cells

1. Introduction
Prostate cancer (PCa) remains one of the most common malignancies in men and the second leading cause of cancer mortality in United States (Siegel et al., 2015). Epidemiological studies suggest that the higher PCa prevalence and mortality rates in Western and European countries than in Asian countries may be due to diet and other lifestyle-related factors (Nelson et al., 2003). The American Cancer Society projected approximately 220,800 new cases and 30,000 deaths due to PCa in the US in 2015 (Siegel et al., 2015). Screening methods, including digital rectal examination in combination with prostate specific antigen (PSA) testing and needle biopsies, have improved the survival of the patients through detecting PCa at an early stage. However, despite some major recent advances therapeutic interventions for treating recurrent hormone-refractory (or castration-resistant PCa, CRPC) and metastatic PCa have limited efficacy and a range of side effects (Hoimes and Kelly, 2010). Hence, there is an imperative to develop novel therapeutic agents to improve the overall survival of patients with PCa. Because dietary constituents are important probable risk factors in the PCa development, there is an increasing interest in the anticancer role of dietary agents such as lycopene, vitamin C, and vitamin K (Nimptsch et al., 2010). Results of recent experimental studies suggest that vitamin K has strong growth inhibitory effects on cells of various malignancies, including ovarian, liver, and nasopharyngeal cancer (Lamson and Plaza, 2003).There is also epidemiologic evidence to support an anti-cancer activity of vitamin K. One prospective cohort study on cancer risk and nutrition report that dietary intake of vitamin K reduces the risk of PCa (Nimptsch et al., 2010). Other studies also found inverse correlation between intake of vitamin K and cancer prevalence (Dasari et al., 2017)(Tamori et al., 2007). Results of population-based case-control studies addressing dietary intake of vitamin K (phylloquinone and menaquinone) and the risk of PCa indicated an inverse association of vitamin K and PCa (Dasari et al., 2017). Furthermore, increased intake of menaquinone was associated with reduced risk of hepatocellular carcinoma (HCC) (Tamori et al., 2007).
Vitamin K is a fat soluble, essential nutrient associated with clotting cascade and bone formation. Structurally, vitamin K has a core naphthoquinone skeleton and depending on the number of isoprene residues in the side chain, they can be classified as vitamin K1 (phylloquinone), vitamin K2 (menaquinones), or vitamin K3 (menadione) (Lamson and Plaza, 2003). Vitamin K2 is present in dairy products, such as meat and eggs.
The growth inhibitory effects of vitamin K2 (VK2) have been most widely studied in hepatocellular cancer. Tokita et al. (2006) reported that VK2 induces antitumor effects through cell cycle arrest and apoptosis in a dose-dependent manner in gastric cancer cells (Tokita et al., 2006). In another study, Otsuka and colleagues found that VK2 inhibits growth and invasion of hepatocellular cancer cells via activation of protein kinase A (Otsuka et al., 2004). Previously, we reported therapeutic effects of VK2 on both hormone dependent and independent PCa cells in vitro and in vivo (Samykutty et al., 2013). Hepatoma-derived growth factor (HDGF) is one of the important proteins involved in development and pathogenesis of malignancies including PCa and we observed that HDGF is an important survival protein and potential target for VK2 in PCa (Shetty et al., 2016).
Although the anti-cancer effects of VK2 have been elucidated in other cancers, it is still not well established in PCa. Hence, the present study was focused on the anti-proliferative and anti-metastatic effects of VK2 on CRPC cells (VCaP).
2. Methods
2.1 Chemicals and Reagents
RPMI-1640 and Fetal bovine serum (FBS) were obtained from HyClone. Vitamin K2 (VK2) was procured from Sigma-Aldrich (St. Louis, MO). Annexin V-FITC apoptosis detection Kit was purchased from MBL international, Woburn, MA. TUNEL assay kit was purchased from AAT Bioquest, Inc. (CA, USA) and human active caspase-3 ELISA kit from R&D Systems, Inc. USA. Primary antibodies were purchased from cell signaling (Danvers, MA, USA), Santa Cruz Biotechnology, Inc. and abcam (Cambridge, MA, USA).
2.2 Prostate Cancer cells and treatment
Castration-resistant prostate cancer cell line (VCaP) was purchased from ATCC and cells were grown in RPMI-1640 supplemented with 10% FBS and 50μg/mL gentamycin. All experiments were performed using 1×10⁵cells/mL of cells unless otherwise indicated treated with various concentrations of VK2 ranging from 25μM to 200μM and untreated cells served as control. Cells were maintained at 37°C with 5% CO2 environmental conditions (Samykutty et al., 2013).
2.3 Assessment of cell viability
VCaP cells were seeded in 96-well tissue culture plates and incubated at 37°C with 5%CO2 environmental conditions. When the cells reach 50% confluency, were treated with various concentrations of VK2 (25, 50, 100, 150 and 200μM) and incubated at 37°C with 5% CO2 for different time intervals such as 24, 48 and 72 hours respectively. Following treatment, cell viability was determined by MTT assay as described previously (Samykutty et al., 2013).
2.4 Estimation of prostate specific antigen (PSA)
Prostate specific antigen (PSA) levels (Shao et al., 2015) were estimated by ELISA Kit (Abnova) which measures the concentration of PSA (ng/mL) secreted in the supernatants of VCaP cells treated with various concentrations of VK2 (50, 100, 150 and 200μM).
2.5 Clonogenic assay
The effect of VK2 on proliferation and survival of VCaP cells was determined by colony formation or clonogenic assay. VCaP cells (2×10⁴) were mixed with 0.7% agarose (Soft agarose) solution in complete RPMI with 20% FBS and poured on top of solidified base agar (1%) in 6-well plates. Various concentration of VK2 (50, 100, 150 and 200μM) were also mixed with 0.7% soft agarose along with cells. The cells were feeded with complete RPMI containing 20% FBS for every 4 days up to 4 weeks. At the end of the experiment, colonies were stained with 0.01% crystal violet and examined using microscope.
2.6 3D spheroid assay
The effect of VK2 on spheroid formation of VCaP cells was determined by 3D spheroid assay. For this assay, approximately 2×10⁴ cells were cultured on matrigel (BD Biosciences) coated 96-well plate and treated with VK2 (50, 100, 150 and 200μM) for 96h. Following treatment, spheroid formation was detected using calcein-AM (Blue) staining for 30 minutes and examined using fluorescent microscope.
2.7 Wound healing assay
VCaP cells were cultured in 24-well plates with complete RPMI (10% FBS) to nearly full confluency, the bottom of each plate was carefully scratched by using pipette tip to make a linear wound in each well. Cells debris and detached cells were removed from the well and various concentrations of VK2 (50 and 100μM) were added with complete RPMI and incubated at 37°C, 5% CO2 for 3-4 days. Percentage of open image area was calculated by observing cells that migrated into the cell free zone or wound for various time points. The percentage of open image area was calculated using a t-scratch software program (Suresh et al., 2013).
2.8 Measurement of reactive oxygen species
Fluorescent dye 2′,7′-dichlorofluorescin diacetate (DCFH2-DA) was used as a probe for measuring relative levels of cellular peroxides induced by VK2. VCaP cells (2×10⁴cells/500μl) were cultured in an 8-chamber culture slide and treated with various concentrations of VK2 (25, 50, 100, 150 and 200μM) and incubated at 37°C, 5% CO2 for 48 hours. VCaP cells were incubated with 10μM DCFH2-DA dye for 30min at 37°C and washed with PBS, then fluorescence was detected using fluorescent microscopy. The amount of ROS was measured by quantifying the intensity of fluorescent dye using image-J software.
2.9 Detection of VK2 induced Senescence
VCaP cells were cultured and treated with various concentrations of VK2 (50, 100, 150 and 200μM) and 48hrs following treatment, cells were fixed with formaldehyde (2%) and glutaraldehyde (0.2%) prepared in phosphate-buffered saline (PBS). Cells were then washed and stained for 6 hrs with senescence staining solution consisting of X-gal (5-bromo-4-chloro-3-indolylbeta-D-galactopyranoside) (1mg/mL), 2M citric acid/sodium phosphate (pH 6.0), 100mM potassium ferricyanide, 100mM potassium ferrocyanide, 5M NaCl and 1M MgCl2. VK2-induced cell senescence was observed under microscope in cells stained with blue color expressing SA-β- gal at pH 6.0. The average number of senescence cells were calculated per three different fields in each well using Image J and graphically plotted.
2.10 Detection of Apoptosis by Annexin V-FITC Staining
Apoptotic cell morphology was detected by Annexin V-FITC kit (MBL international, Woburn, MA), in which 2×10⁴cells/500μl of RPMI were cultured on 8-chamber plate and treated with various concentrations of VK2 (50, 100, 150 and 200μM). After incubation period (48hrs), cells were stained with 5μl of Annexin and 5μl of propidium iodide (PI) dissolved in 500μl of binding buffer per well and incubated in dark at room temperature for 10 minutes. Following incubation, cells were washed with PBS and analyzed by fluorescence microscopy (Fu et al., 2014).
2.11 Detection of apoptosis by TUNEL Assay
TUNEL assay was performed to visualize the apoptosis using an in-situ cell death detection kit (AAT Bioquest, Inc. CA, USA). VCaP cells were grown in 96-well plate treated with various concentrations of VK2 (50, 100 and 200μM), and incubated for 48hrs at 37°C and 5% CO2. After VK2 treatment, VCaP cells were washed (PBS) and fixed with (4% paraformaldehyde) for 30min at room temperature. Samples were then incubated with 50μl of TUNEL reaction (TdT-mediated digoxigenin-dUTP nick-end labeling) kit for 1 hour at 37° C in a dark chamber. Washed the cells with PBS and added Hoechst 33342 (30nm) for 5min. TUNEL assay results were visualized with an Olympus fluorescence microscope (Culture Microscopes, Olympus, Center Valley, PA, USA) and fluorescent staining was quantitated using Image-J software (Version 1.4.3.67).
2.12 Assessment of active caspase-3 concentration
To assess the mechanism of VK2 on apoptosis, the active caspase-3 level was measured by using quantitative caspase-3 ELISA kit (R&D Systems, Inc. USA). Cells were treated with various concentrations of VK2 (25, 50, 100, 150 and 200μM) and drug free media (untreated) for 48hrs. After incubation, cell extracts were prepared according to manufacturer’s instructions. Cells were mixed with lysis buffer and cell lysates were transferred into the wells of a microplate pre-coated with a monoclonal antibody specific for caspase-3. Substrate solution (Streptavidin-HRP) was added to the wells. The enzyme reaction yielded a blue product that turned yellow when a stop solution was added. Optical density was determined within 30min using a microplate reader set to 450nm with a wavelength correction at 540 nm or 570nm. The active caspase-3 concentrations were calculated from a standard curve constructed with known concentrations of active caspase-3. Caspase concentration was expressed as ng/mL protein.
2.13 Western blot analysis
VCaP cells were treated with various concentrations of VK2 (50, 100, 150 and 200μM) for 48hrs and collected cell pellet was lysed with lysis buffer. Protein content of the samples was determined by BCA method (Pierce Chemicals, USA). Cell lysates were mixed with equal volume of Laemmli sample solubilizing buffer (Bio-Rad), subjected to sodium dodecyl sulfate polyacrylamide gel electrophoresis (SDS-PAGE) (12%) and, were electrophoretically transferred onto nitrocellulose membrane. Blocking was performed in 5% skimmed milk prepared in Tris buffered saline (TBS). Membranes were probed with antibodies against various cell signaling molecules such as apoptotic markers (caspase-3, 7, 9 and Bax), anti-apoptotic markers (survivin, HMGB1, and HMGB2), DNA damage markers (PARP-1, phospho-H2AX), cell cycle regulator markers (pChk-1, -2, pCDC-2, CDK-4, pRb, p21). Ampk, androgen receptor (AR), TCTP, PCNA, Bip, MMP-2, XIAP, Erg, YAP, BNIP, E2F1, NQO1, Oct-3/4 and HO-1. Protein expression was detected using Super Signal West Pico Chemiluminescent Substrate (Thermo Fisher, Scientific, USA) (ECL) solution on X-ray films. Relative expression of protein levels was quantified by image-J software and expressed on top of each blot.
2.14 Immunofluorescence (IF)
VCaP cells were cultured on 8-chamber plates, and treated with VK2 (50, 100, 150 and 200μM), and incubated at 37°C and 5% CO2 for 48hrs. Following treatment cells were fixed (4% formaldehyde) for 15min and blocked with 5% goat normal serum (Invitrogen) with 0.3% Triton X- 100 (Sigma–Aldrich) in PBS. Cells were washed (PBS) and incubated with primary antibodies cleaved caspase-3 (cell signaling) (1:200), pH2AX (1:200) and PSA (cell signaling) (1:500) for 1 hour. After three successive washings, cells were treated with 0.1μg/mL of anti-mouse Ig-G and secondary anti-rabbit Ig-G conjugated with FITC for 1 hour. Cells were counter-stained with DAPI (30nM) for 10-15min with PBS, and a coverslip with Fluorogel (Electron Microscopy Sciences, Hatfield, PA, USA) was prepared for visual inspection with an Olympus Fluoview confocal microscope.
2.15 Quantification of gene expression by Real Time PCR
Expression levels of various gene markers were analyzed in VK2 (50μM) treated VCaP cells using quantitative real-time polymerase chain reaction (PCR) method. mRNA was extracted from the control (untreated) and VK2-treated VCaP cells using TRIzol reagent kit (Invitrogen). High capacity complementary DNA (cDNA) reverse transcription kit (Applied Biosystem, CA) was used to synthesize the cDNA from mRNA in Mastercycler PCR machine (Eppendorf, USA). Approximately 100ng of cDNA was used to quantify the expression of various genes involved in different signaling pathways using SYBR Green quantification method (Thermo Scientific, USA). Pre-made gene-specific primers and Actin primers were obtained from Sigma-Aldrich real-time. PCR was performed using Applied Biosystems 7300 instrument. Thermocycler 2-step cycling protocol was performed with 40 cycles as described previously in which initial denaturation at 95°C for 10min, further denaturation at same temperature for 15 seconds, and annealing/extension at 60°C for 60 minutes (Shetty et al., 2016). Ct values were extracted using SDS-software (Applied Biosystems-CA) and calculated with the 2−ΔΔCt values.
2.16 Cell cycle analysis of VK2 treated VCaP cells
Cell cycle profile of VK2-treated VCaP cells was determined by flow cytometric analysis as described previously by Shetty et al. (2016) (Shetty et al., 2016). VCaP cells were treated with various concentrations of VK2 (25 and 50μM) in 6-well plates and incubated at 37°C, 5% CO2 for 48 hours. Cells were trypsinized and washed with PBS. The pellet was suspended in plain RPMI and ice-cold ethanol (70%) and incubated at 4°C overnight. Cells were centrifuged for 5min at 1000rpm and the pellet was washed with cold PBS. Cells were treated with 8μl RNase A (1mg/mL), probed with 18μl of propidium iodide (1mg/mL) subjected to flow analysis. DNA content data was acquired using CELL Quest software on a flow cytometer (FACS Calibur; Becton Dickinson, Mountain View, CA)
2.17 Statistical analysis
Data were expressed as mean ± SD from of least three independent experiments. One-way ANOVA was performed followed by Tukey’s test for comparison of results between untreated control and treatments. Values were significant when at P values of <0.05 (*P < 0.01 and # P<0.05).
3.0 Results
3.1 VK2 inhibits growth and viability of prostate cancer cells
The anti-proliferative activity of VK2 at concentrations of 25, 50, 100, 150 and 200μM on VCaP cells was assessed using an MTT assay. VK2 significantly inhibited VCaP cell proliferation in vitro in a dose-dependent and time-dependent manner (Fig. 1). Specifically, VK2 treatment inhibited the growth of VCaP cells by 50% between at 48 hours, but a modest further growth inhibition was observed between at 72 hours suggesting that VCaP cells displayed most sensitivity to VK2 within the first 48 hours of treatment. The IC50 of VK2 on VCaP cells at 48 hours was 50μM.
Figure 1. VK2 inhibits the proliferation of prostate cancer cells.
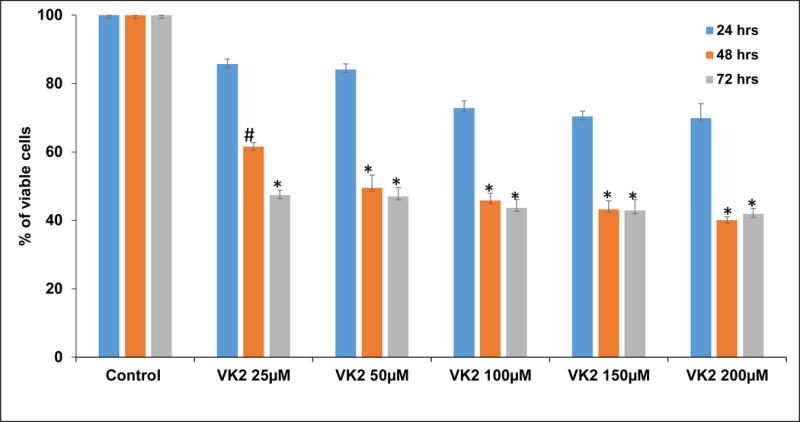
VK2 inhibits the proliferation VCaP cells by dose dependent manner at different time points by MTT cell proliferation assay. 50μM concentration of VK2 shows inhibitory concentration (IC50) at 48 hours. The bars in the figure represent mean ± SD. Measurements were done in triplicates per experimental point. *P< 0.01 and #P<0.05 for differences between untreated controls and VK2 treatments.
3.2 VK2 suppresses colony formation of VCaP cells
VK2 strongly inhibited the anchorage-independent growth of VCaP cells. Untreated VCaP cells grew large colonies after 4-5 weeks of incubation. By contrast, no visible colonies per plate were observed in the presence of VK2 at concentrations of 50μM and higher (Fig. 2A & B). These results indicate that VK2 has the potential to inhibit in-vitro tumorigenesis of VCaP cells.
Figure 2. VK2 treatment reduces anchorage-independent growth of VCaP cells.

(A) Soft agar assay results showed that VK2 robustly inhibit the colony formation ability of VCaP cells. Colonies were detected using crystal violet staining. Phase-contrast images under 10× magnification with Scale bar 200μm. (B) Quantitative analysis of aggregated colonies in VCaP cells against different concentrations of Vitamin K2. The bars in the figure represent mean ± SD. Measurements were done in triplicates per experimental point. (*P< 0.01 for differences between untreated controls and VK2 treatments.
3.3 VK2 inhibits 3D spheroid growth in VCaP cells
The three-dimensional tumor spheroid assay provides a rapid, automatable assay system using a semi-solid matrix into which tumor cells grow as a spheroid body and tumor cell growth is monitored at intervals over a period of 72 - 96hrs following addition of calcein AM stain. VK2 significantly (P<0.01) inhibited spheroid growth of VCaP cells in matrigel in a dose-related manner with smaller individual colonies than the untreated controls (Fig. 3A) and a lower average number of colonies (Fig. 3B).
Figure 3. 3D spheroid assay in VCaP cells: VK2 treatment reduces formation of spheroids in VCaP cells.

(A) Matrigel assay results showed that VK2 robustly inhibit the spheroid formation ability of VCaP cells. Spheroids were detected using calcein (blue) staining. Phase-contrast images under 10× magnification with Scale bar 200μm. (B) Quantitative analysis of tumor spheres against different concentrations of VK2. The bars in the figure represent mean ± SD. Measurements were done in triplicates per experimental point. *P< 0.01 for differences between untreated controls and VK2 treatments.
3.4 VK2 suppresses cell migration of VCaP cells
Cancer cell migration is one of the characteristic features of the metastasis process which can be examined in vitro by a scratch assay (wound healing) assay. As shown in Figure 4, VK2 treatment, especially at 100 μM, drastically reduced the migration of VCaP cells up to 72 h, whereas untreated cells almost entirely filled the open image area or gap at 72 h.
Figure 4. VK2 inhibits the cell migration of VCaP cells.

(A) VK2 counteracts the migration of VCaP cells in a time dependent manner. Phase-contrast images under 10× magnification with Scale bar 200μm. (B) Quantitative results show that VK2 significantly blocks the migration of VCaP cells. Percentage open image area was determined by T-scratch program. The bars in the figure represent mean ± SD. Measurements were done in triplicates per experimental point. *P< 0.01 for differences between untreated controls and VK2 treatments.
3.5 VK2 induces the production of reactive oxygen species (ROS)
ROS generation was measured by probing with 2′,7′ –dichlorofluorescin diacetate (DCFDA) dye and flourescence microscopy. VK2 induced oxidative stress through ROS production in a dose-dependent manner which effect was significant at concentrations of 50μM and higher, as indicated by the presence of strong fluorescent green color of DCFDA compared to vehicle-treated control cells which were negative. The antioxidant N-acetyl cysteine (NAC) abrogated the ROS producing effect of VK2 (Fig. 5A & 5B).
Figure 5. Vitamin K2 induces oxidative stress in VCaP cells.

(A) ROS generation was detected by adding 2′,7′-dichlorofluorescin diacetate (DCFDA) flourescent dye. The flourescent green color indicated that the generation of ROS in VK2 treated cells compared to the untreated cells. Effect of VK2 was abrogated in the presence of anti-oxidant N-acetyl cysteine (NAC), showed decreased ROS production. Phase-contrast images under 10× magnification with Scale bar 200μm. (B) Quantitative analysis of ROS production in terms of DCFDA flourescent intensity induced by VK2. The bars in the figure represent mean ± SD. Measurements were done in triplicates per experimental point. *P< 0.01 for differences between untreated controls and VK2 treatments.
3.6 VK2 induces apoptosis in VCaP cells
As shown in Figure 6, VK2 at concentrations of 50, 100, 150, and 200μM caused pronounced binding of Annexin-V FITC to VCaP cells, indicating apoptosis. Induction of apoptosis in VCaP cells by VK2 treatment (50, 100, and 200 μM) was also confirmed using the TUNEL assay detecting DNA fragmentation that results from apoptosis as shown in Sup. Figure 1. In addition, caspase-3 expression measured by immunofluorescence (Sup. Fig. 2A), ELISA (Sup. Fig. 2B), and Western blot (Sup. Fig. 5A), showed significantly increased levels of cleaved product of caspase-3 supporting the notion that VK2 induces apoptosis through the activation of caspase cascade.
Figure 6. Vitamin K2 induces Apoptosis in VCaP cells by Annexin-V-FITC assay.
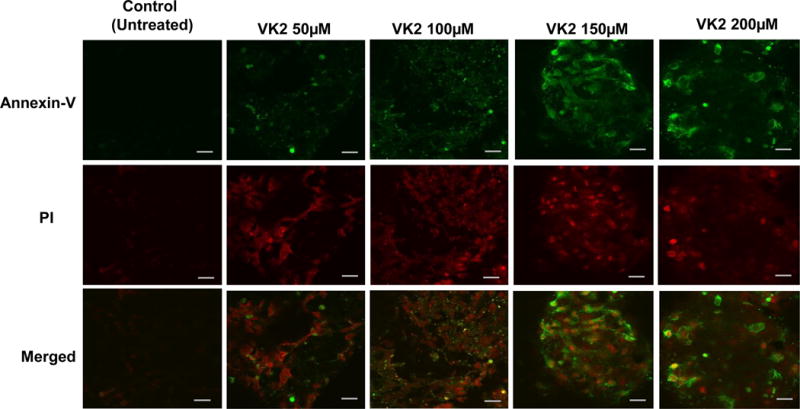
VCaP cells were treated with various concentrations of VK2 (50, 100, 150 and 200μM) for 48 hours. Cells were stained with Annexin V-FITC to detect apoptotic cells and PI for nuclear stain. Figures shown for each experimental point are representative of one of the triplicates used in the experiment. Images under 60× magnification with Scale bar: 10μm.
3.7 VK2 induces cellular senescence in VCaP cells
VK2 induced senescence in VCaP cells as indicated by an increase of senescence-associated β-galactosidase (SA-β-Gal) activity (Han et al., 2016) in response to VK2 treatment (50-200μM for 48 hours) (Sup. Fig. 3).
3.8 VK2 induces cell cycle arrest in VCaP cells
After exposure to VK2 at 25–200 μM for 48 hrs, cell cycle analysis was performed by flow cytometry. As shown in Sup. Figure 4A and B, the percentage of cells in G0 phase and sub-G0 was significantly (P<0.01) increased by VK2 treatment in a dose-dependent manner, while the percentage of cells in G1 phase was decreased significantly (P<0.01). These findings indicate that VK2 induced significant G0 arrest of VCaP cells in a manner consistent with induction of apoptosis.
3.9 Effect of VK2 on the mRNA expression of apoptotic, anti-apoptotic, cell cycle and tumor suppressor markers
VK2 treatment affected the expression of several genes involved in the apoptosis, cells cycle, and tumor suppression. VK2 (at 50μM) downregulated the expression of anti-apoptotic marker genes such as survivin, Mcl-1, Akt, c-myc, HMGB1, HMGB2, and vimentin and the stem cell marker protein Oct-3/4 (Fig. 7A). VK2 significantly increases the expression of apoptotic markers such as Bax, caspase-3, and apoptosis inducing factor (AIF) (Fig. 7B). Expression of the cell cycle markers cyclin D1 and D3 was decreased by VK2 treatment (Fig. 7C). VK2 significantly increased the expression of tumor suppressor genes such as p53, p21, PTEN and Rb (Fig. 7D).
Figure 7. Expression levels of selected genes in VCaP cells treated with VK2.

mRNA was isolated from VCaP cells treated with VK2 (50μM) by Trizol method and construct the cDNA using High-capacity complementary DNA (cDNA) reverse transcription kit. Quantification of the expression levels of various genes was conducted using the SYBR Green method with both forward and backward primers. All the transcript levels were normalized using β-actin transcript levels. (A) Anti-apoptotic gene levels in folds were decreased compared to untreated controls. *p<0.01 compared to control group. (B) Apoptotic gene levels in folds were increased compared to untreated controls. *p<0.01 compared to control. (C) Cell cycle gene levels in folds were also decreased compared to untreated controls. *p<0.01 compared to control. (D) Tumor suppressor markers such as p53, p21, PTEN and Rb were increased during VK2 treatment. *p<0.01 compared to control group. The bars in the figure represent mean ± SD. Measurements were done in triplicates per experimental point.
3.10 Western blot analysis
Both cleavage of PARP-1 and caspase-3 activation are very important in the activation of apoptosis. As shown in Sup. Figure 5A, VK2 (at 100μM) induces the activation of caspase family proteins and cleavage of PARP-1. Both translationally controlled tumor protein (TCTP) and androgen receptor (AR) were downregulated by VK2 treatment compared to the untreated control by 34% at 150μM VK2 and 31 and 49% of inhibition at 50 and 100μM VK2, respectively (Sup Fig. 5B). Expression of high mobility group box (HMGB1 and HMGB2) protein family members was also decreased by VK2 treatment compared to untreated controls (Sup. Fig. 5B). VK2 treatment (at 50 - 200μM) also downregulated the expression of Survivin, an inhibitor of apoptosis (by 73% at 100μM), as well as expression of X-linked inhibitor of apoptosis (XIAP), proliferating cell nuclear antigen (PCNA), binding immunoglobular protein (Bip), and matrix metallo proteinases (MMP-2) (Sup. Fig. 5C). Cyclin dependent kinase inhibitor (p21), Bcl-2 associated X protein (Bax), and Bcl-2 interacting protein (BNIP-3) were upregulated by VK2 treatment compared to controls (Sup. Fig. 5D). On the other hand, checkpoint kinase (pChk-1 and 2) and cyclin dependent kinases (CDK-4 and pCDC-2) were downregulated by VK2 treatment (Sup. Fig. 5D). Interestingly, VK2 treatment downregulated the expression of transcription factors E2F1 and Oct3/4 while upregulating the expression of Heme oxygenase-1 (HO-1) (Sup. Fig. 5E). Summary of proteins which are modulated by VK2 is presented in Table 1.
Table 1.
List of proteins which are modulated by VK2 treatment in VCaP cells.
| S.No. | Protein Name | Effect of VK2 |
|---|---|---|
| 1 | Caspase-3 | cleaved |
| 2 | Caspase-7 | cleaved |
| 3 | Caspase-9 | downregulated |
| 3 | PARP-1 | cleaved |
| 4 | AMPK | downregulated |
| 5 | AR | downregulated |
| 6 | TCTP | downregulated |
| 7 | HMGB1 | downregulated |
| 8 | HMGB2 | downregulated |
| 9 | Survivin | downregulated |
| 10 | PCNA | downregulated |
| 11 | BiP | downregulated |
| 12 | MMP-2 | downregulated |
| 13 | XIAP | downregulated |
| 14 | YAP | downregulated |
| 15 | pChk-1 | downregulated |
| 16 | pCDC-2 | downregulated |
| 17 | CDK-4 | downregulated |
| 18 | p21 | upregulated |
| 19 | Bax | upregulated |
| 20 | BNIP3 | upregulated |
| 21 | E2F1 | downregulated |
| 22 | NQO1 | downregulated |
| 23 | Oct 3/4 | downregulated |
| 24 | HO-1 | upregulated |
3.11 VK2 induces DNA damage through pH2AX
Reactive oxygen species induced through VK2 caused DNA damage in VCaP cells which was detected by expression of pH2AX using immunofluorescence images. As shown in Sup. Figure 6, VK2 treatment (50, 100, 150, and 200μM) activated the pH2AX expression in VCaP cells.
3.12 VK2 reduces Prostate specific antigen (PSA) levels in VCaP cells
PSA is a well- accepted marker for evaluating growth and progression of PCa. Immunofluorescence staining showed that VK2 treatment (50, 100, 150 and 200μM) decreased expression of PSA in VCaP cells compared to vehicle-treated control cells (Sup. Fig. 7A). Consistent with these results, ELISA data showed decreased levels of PSA in the culture supernatants of VCaP cells treated with VK2 (Sup. Fig. 7B).
4.0 Discussion
Epidemiological and experimental studies suggest that dietary intake of VK2 is associated with reduced risk of PCa development (Nimptsch et al., 2008) and VK2 is a known anti-proliferative compound in many human cancer cell lines through mechanisms such as cell cycle arrest and apoptosis (Tokita et al., 2006). We have previously reported that VK2 exerts its anticancer activity on androgen-dependent LNCaP PCa cells through caspase-3-mediated apoptosis (Samykutty et al., 2013). In the present study, VK2 inhibited the growth of castrate-resistant VCaP cells that have wild-type AR in a dose-dependent manner. The present results are consistent with our previous results showing that VK2 inhibits the growth of androgen-dependent LNCaP cells (Samykutty et al., 2013), but the IC50 of VK2 at 48 hours (50μM) was lower than the IC50 for LNCaP cells (100μM), indicating that VCaP cells are much more sensitive than LNCaP cells to VK2 treatment. VK2 is a natural dietary constituent and toxicity associated with VK2 is very low. We did not find toxic effects of VK2 on benign prostate cells (RWPE cells) at doses similar to those used in the present study (Samykutty et al., 2013).
Since a critical parameter for cancer cells is the ability to grow in an anchorage independent manner, we evaluated the effect of VK2 on growth of VCaP cells and their capacity to form colonies in a soft-agar (Monami et al., 2009) and observed inhibition We also evaluated the effect of VK2 on VCaP cell invasion in vitro and VCaP cell migratory properties in a wound healing assay and found inhibition in a dose-dependent manner. These results indicate that VK2 may be a potent inhibitor of growth, invasion, and metastasis of castrate-resistant PCa cells. A similar inhibitory effect of VK2 on the growth and invasion of human liver tumor cells which involved activation of protein kinase A has been reported by others (Otsuka et al., 2004). Furthermore, Suresh et al. (2013) reported that vitamin K3 (menadione)-treated oral cancer cells also display reduced wound closure compared to controls (Suresh et al., 2013).
Our results showed that VK2 exerts anticancer activity on VCaP cells by inhibition of cell growth and activation of cell apoptosis through ROS generation, caspase-3 activation and PARP-1 cleavage, similar to studies with cancer cells of other tissues (Duan et al., 2016; Karasawa et al., 2013; Yokoyama et al., 2008). Apoptosis is important cell death mechanism induced by several natural products and its induction mainly involves mitochondrial dysfunction and apoptotic factors (Wang and Youle, 2009) and we found that VK2 significantly induced apoptosis in VCaP cells. VK2 activated the expression of caspases-3, 7, and PARP-1, indicating activation of apoptosis pathway was involved in VK2-induced apoptosis in VCaP cells. VK2 also increased the expression of pro-apoptotic Bax and decreased the mRNA levels of anti-apoptotic markers such as Bcl-2, Mcl-1, survivin, Akt, c-myc and vimentin, indicative of activation of the intrinsic apoptosis pathway. Expression of apoptosis-inducing factor, a flavoprotein associated with mitochondrial inner membrane and involved in apoptosis (Otera et al., 2005), was increased by VK2 treatment, suggesting that VK2 has potential to activate apoptotic pathways though pro-oxidant mechanisms. Consistent with this notion and with previous findings (Malik et al., 2011), we showed that VK2 not only activates caspases but also increases ROS levels.
Phosphorylation of H2AX is important in DNA damage signaling and is an early indicator of DNA double-strand breaks (Podhorecka et al., 2010; Yao et al., 2015). In the present study, expression of pH2AX was increased by VK2 treatment, suggesting that VK2 may be potentially causing DNA damage response via ROS activation. We found that VK2 promotes phosphorylation of the CHK1 and CHK2 check-points, possibly through the ATM/ATR pathway. VK2 treatment also increased expression of p53 and p21, suggesting that pCHK1 and pCHK2 activate p21 expression through p53, which leads to the observed down regulation of cyclin D1 and cyclin D3.
Flow cytometry revealed that VK2 induced G0 arrest in VCaP cells and resulted in decreased levels of cyclin D1 and cyclin D3, consistent with the observed G0 cell cycle arrest. Cell cycle arrest by VK2 was further confirmed by the observation of downregulation of the cell cycle-related protein markers p21, pCHK1, pCHK2, and CDK4 were downregulated. Cellular senescence, another cell death mechanism detectable by X-gal staining (Roninson, 2003), was also caused by VK2 treatment as indicated by SA-β-gal-positive staining.
Human and animal model studies indicate a critical role of AR in primary and metastatic PCa lesions which is retained during progression to CRPC (Chen et al., 2004; Henshall et al., 2001; Ricciardelli et al., 2005). Prostate specific antigen (PSA) is an androgen responsive gene used as a prognostic marker for PCa (Bindukumar et al., 2005). We observed that VK2 treatment significantly decreased AR protein and PSA secreted in the culture media of VCaP cells. These findings suggest a possible antiandrogenic activity of VK2 that merits further research.
Oct-3/4 (POU5F1) is an important stem cell marker protein detected in several malignancies, including bladder and prostate cancer, that may be involved in initiation and progression of cancer (Chang et al., 2008; Jaworska et al., 2015). We found a significant decrease in the expression of Oct-3/4. The inhibition of clonogenic growth and cell migration in VCaP cells we found to be induced by VK2 treatment may be due or related to the decreased expression of Oct-3/4.
PTEN is inactivated frequently by somatic mutations in various tumors including prostate, brain, breast, endometrial, and kidney cancer. Since loss of PTEN is associated with advanced PCa, inactivation of PTEN is thought to play a critical role in the progression and metastasis of PCa (Depowski et al., 2001; Dreher et al., 2004; Huang et al., 2001; van Bokhoven et al., 2001). We found increased expression levels of PTEN in VCaP cells treated with VK2, suggesting that VK2 may counteract the loss of PTEN in PCa cells.
Conclusion
Collectively, the findings of the present study suggest that VK2 targets multiple signaling pathways that are critical for cell proliferation, progression, and metastasis of PCa cells as depicted in Figure 8. VK2 effectively inhibits the malignant properties of VCaP cells, by specifically targeting ROS-mediated apoptosis and cell cycle progression as well as metastasis-inhibiting signaling molecules. As follow-up to these in vitro results, further studies are needed to ascertain the therapeutic potential of VK2 against PCa, particularly CRPC, in experimental animal models.
Figure 8.

Schematic representation of VK2 induced cell death in VCaP cells: Based on the results, we propose that VK2 induces cell death through mitochondrial mediated apoptosis and ROS mediated cell cycle arrest in VCaP cells.
Supplementary Material
Sup. Figure 1: Vitamin K2 induces Apoptosis in VCaP cells by TUNEL assay. (A) VCaP cells were treated with various concentrations of VK2 (50, 100 and 200 μM) for 48 hours. Cells were stained with Hoechst 33342 to detect apoptotic cells and red for nucleus. Phase-contrast images under 10× magnification with Scale bar 200μm. (B) Quantitative analysis of color intensity produced by Red color. The bars in the figure represent mean ± SD. Measurements were done in triplicates per experimental point. *P< 0.01 for differences between untreated controls and VK2 treatments. The TUNEL spots (red) indicate the DNA fragments in the nuclei of the cell in comparison with intact nuclei stained by DAPI (blue).
Sup. Figure 2: VK2 induces apoptosis by activating caspase-3. (A) VCaP cells were treated with various concentrations of VK2 along with untreated control and then incubated with cleaved caspase-3 primary antibody and secondary antibody conjugated with FITC. VK2 treated VCaP cells shows strong green fluorescence indicating cleaved caspase-3 (FITC-Green color) activation compared to untreated cells. DAPI (blue color) was used to counterstain the nucleus. Images under 60× magnification with scale bar: 10μm. (B) Quantitative analysis of relative expression of caspase-3 by ELISA. The bars in the figure represent mean ± SD. Measurements were done in triplicates per experimental point. *P< 0.01 for differences between untreated controls and VK2 treatments.
Sup. Figure 3: Treatment of VCaP cells with VK2 results in senescence activation. (A) Senescent cells were detected using β-Gal staining. Formation of blue precipitates in the cytoplasm of cells indicated that the cells undergo cellular senescence in response to VK2 treatment (6 hours) in VCaP cells. Phase-contrast images under 10× magnification with scale bar 200μm. (B) Quantification of average number of senescent cells per well. The bars in the figure represent mean ± SD. Measurements were done in triplicates per experimental point. *P< 0.01 for differences between untreated controls and VCaP cells treated with VK2.
Sup. Figure 4: VK2 induces G0 cell cycle arrest in VCaP cells. Cells were treated with VK2 for 48 hours and cell cycle distribution of propidium iodide (PI)-labeled cells was analyzed by flow cytometric analyses. (A) Histograms of various concentrations of VK2 indicating that the cells are arrested in G0 phase of cell cycle. (B) Histogram showing the percentages of cells in each phase of the cell cycle. The percentage of cells increased with increasing concentrations of VK2 in the G0 phase and decreased in the G1 phase. The bars in the figure represent mean ± SD. Measurements were done in triplicates per experimental point. *P<0.01; $P<0.05 for differences between controls and VK2 treatments.
Sup. Figure 5: VK2 targets multiple signaling pathways in VCaP cells. Cells were treated with various concentrations of VK2 and harvested at 48 hours and equal amount of protein were subjected to SDS-PAGE (12%) and analyzed by Western blot and probed with various protein markers (A) Effect of VK2 on the cleavage of pro-caspase 3 and PARP-1; VK2 treatment activates the caspase-3 into pro- and cleaved caspase 3, 7, and 9. (B) Down regulation of expression of Androgen receptor (AR), TCTP, HMGB1, and HMGB2. (C) Downregulation of the expression of survivin, PCNA, BiP, MMP-2, XIAP, Erg and YAP. (D) Downregulation of checkpoint genes, including PhosphoChk 1, PhosphoChk 2, PhosphoCDC-2, and upregulation of p21 and Bax. (E) Decreased expression of E2F1, NQO1 and Oct-3/4 and increased expression of heme oxygenase-1 (HO-1). The relative expression of protein levels was quantified by Image-J software and indicated on top of each blot. (F–K) Quantitative analysis of Western blots. The intensity of the protein bands was measured and normalized from corresponding housekeeping protein (β-Actin or GAPDH) using ImageJ analysis and presented as graph. The bars in the figure represent mean ± SD. Measurements were done in triplicates per experimental point. *P< 0.01 and #P<0.05 for differences between untreated controls and VK2 treatments.
Sup. Figure 6: VK2 induces phosphoH2AX. VCaP cells were treated with VK2 (50-200μM) for 48 hours. Cells were stained with primary antibody (pH2AX 1:100) and followed by secondary antibody conjugated with FITC (1:500) and observed under confocal microscope. Cisplatin (20μM) treatment served as positive control. Activated or induced pH2AX appear bright green color dots surrounded by the nucleus and the counter stained blue colored nuclear staining (DAPI). Images under 60× magnification with Scale bar: 10μm. Figures shown for each experimental point are representative of one of the triplicates used in the experiment.
Sup. Figure 7: VK2 treatment downregulates expression levels of PSA: VCaP cells were treated with VK2 (50, 100 and 200μM) and subjected to Immunofluorescence microscopy probed with PSA (green fluorescence), counter stained with DAPI (blue fluorescence). Expression of PSA was decreased in VK2 treated VCaP cells compared to untreated controls. Images under 60× magnification with Scale bar: 10μm. (B). Levels of PSA were determined by ELISA. VK2 reduces the secretion of PSA in culture supernatants of CRPC cells. The bars in the figure represent mean ± SD. Measurements were done in triplicates per experimental point. *P< 0.01; #P< 0.05 for differences between untreated controls and VK2 treatments.
Highlights.
Vitamin K2 (VK2) inhibits the tumorigenic potential of castration-resistant prostate cancer (CRPC) cells.
VK2 reduces the anchorage-independent and 3D spheroid growth of CRPC VCaP cells.
VK2 induces senescence and apoptosis through ROS activation in VCaP.
VK2 down regulates androgen receptor, Oct3/4 (stem cell marker) and key anti-apoptotic genes to target CRPC.
VK2 is a potential anti-cancer agent for CRPC treatment.
Acknowledgments
This study is partly supported by funding received from NIH, United States (R21 CA184646-01A1). Authors would like to thank Kyle Ernzen (Viterbo University) for editing the manuscript.
Footnotes
Publisher's Disclaimer: This is a PDF file of an unedited manuscript that has been accepted for publication. As a service to our customers we are providing this early version of the manuscript. The manuscript will undergo copyediting, typesetting, and review of the resulting proof before it is published in its final citable form. Please note that during the production process errors may be discovered which could affect the content, and all legal disclaimers that apply to the journal pertain.
Consent for publication
All the authors of this manuscript have given their consent for publication.
Conflict of Interest Statement
Authors declare that they do not have conflict of interest.
References
- Bindukumar B, Schwartz SA, Nair MPN, Aalinkeel R, Kawinski E, Chadha KC. Prostate-specific antigen modulates the expression of genes involved in prostate tumor growth. Neoplasia N Y N. 2005;7:241–252. doi: 10.1593/neo.04529. [DOI] [PMC free article] [PubMed] [Google Scholar]
- Chang CC, Shieh GS, Wu P, Lin CC, Shiau AL, Wu CL. Oct-3/4 expression reflects tumor progression and regulates motility of bladder cancer cells. Cancer Res. 2008;68:6281–6291. doi: 10.1158/0008-5472.CAN-08-0094. [DOI] [PubMed] [Google Scholar]
- Chen CD, Welsbie DS, Tran C, Baek SH, Chen R, Vessella R, Rosenfeld MG, Sawyers CL. Molecular determinants of resistance to antiandrogen therapy. Nat Med. 2004;10:33–39. doi: 10.1038/nm972. [DOI] [PubMed] [Google Scholar]
- Dasari S, Ali SM, Zheng G, Chen A, Dontaraju VS, Bosland MC, Kajdacsy-Balla A, Munirathinam G. Vitamin K and its analogs: Potential avenues for prostate cancer management. Oncotarget. 2017 doi: 10.18632/oncotarget.17997. [DOI] [PMC free article] [PubMed] [Google Scholar]
- Depowski PL, Rosenthal SI, Ross JS. Loss of expression of the PTEN gene protein product is associated with poor outcome in breast cancer. Mod Pathol Off J U S Can Acad Pathol Inc. 2001;14:672–676. doi: 10.1038/modpathol.3880371. [DOI] [PubMed] [Google Scholar]
- Dreher T, Zentgraf H, Abel U, Kappeler A, Michel MS, Bleyl U, Grobholz R. Reduction of PTEN and p27kip1 expression correlates with tumor grade in prostate cancer. Analysis in radical prostatectomy specimens and needle biopsies. Virchows Arch Int J Pathol. 2004;444:509–517. doi: 10.1007/s00428-004-1004-6. [DOI] [PubMed] [Google Scholar]
- Duan F, Yu Y, Guan R, Xu Z, Liang H, Hong L. Vitamin K2 Induces Mitochondria-Related Apoptosis in Human Bladder Cancer Cells via ROS and JNK/p38 MAPK Signal Pathways. PloS One. 2016;11:e0161886. doi: 10.1371/journal.pone.0161886. [DOI] [PMC free article] [PubMed] [Google Scholar]
- Fu D, Lv X, Hua G, He C, Dong J, Lele SM, Li DWC, Zhai Q, Davis JS, Wang C. YAP regulates cell proliferation, migration, and steroidogenesis in adult granulosa cell tumors. Endocr Relat Cancer. 2014;21:297–310. doi: 10.1530/ERC-13-0339. [DOI] [PMC free article] [PubMed] [Google Scholar]
- Henshall SM, Quinn DI, Lee CS, Head DR, Golovsky D, Brenner PC, Delprado W, Stricker PD, Grygiel JJ, Sutherland RL. Altered expression of androgen receptor in the malignant epithelium and adjacent stroma is associated with early relapse in prostate cancer. Cancer Res. 2001;61:423–427. [PubMed] [Google Scholar]
- Hoimes CJ, Kelly WK. Redefining hormone resistance in prostate cancer. Ther Adv Med Oncol. 2010;2:107–123. doi: 10.1177/1758834009356433. [DOI] [PMC free article] [PubMed] [Google Scholar]
- Huang H, Cheville JC, Pan Y, Roche PC, Schmidt LJ, Tindall DJ. PTEN induces chemosensitivity in PTEN-mutated prostate cancer cells by suppression of Bcl-2 expression. J Biol Chem. 2001;276:38830–38836. doi: 10.1074/jbc.M103632200. [DOI] [PubMed] [Google Scholar]
- Jaworska D, Król W, Szliszka E. Prostate Cancer Stem Cells: Research Advances. Int J Mol Sci. 2015;16:27433–27449. doi: 10.3390/ijms161126036. [DOI] [PMC free article] [PubMed] [Google Scholar]
- Karasawa S, Azuma M, Kasama T, Sakamoto S, Kabe Y, Imai T, Yamaguchi Y, Miyazawa K, Handa H. Vitamin K2 covalently binds to Bak and induces Bak-mediated apoptosis. Mol Pharmacol. 2013;83:613–620. doi: 10.1124/mol.112.082602. [DOI] [PubMed] [Google Scholar]
- Lamson DW, Plaza SM. The anticancer effects of vitamin K. Altern Med Rev J Clin Ther. 2003;8:303–318. [PubMed] [Google Scholar]
- Malik A, Afaq S, Shahid M, Akhtar K, Assiri A. Influence of ellagic acid on prostate cancer cell proliferation: a caspase-dependent pathway. Asian Pac J Trop Med. 2011;4:550–555. doi: 10.1016/S1995-7645(11)60144-2. [DOI] [PubMed] [Google Scholar]
- Monami G, Emiliozzi V, Bitto A, Lovat F, Xu SQ, Goldoni S, Fassan M, Serrero G, Gomella LG, Baffa R, Iozzo RV, Morrione A. Proepithelin regulates prostate cancer cell biology by promoting cell growth, migration, and anchorage-independent growth. Am J Pathol. 2009;174:1037–1047. doi: 10.2353/ajpath.2009.080735. [DOI] [PMC free article] [PubMed] [Google Scholar]
- Nelson WG, De Marzo AM, Isaacs WB. Prostate cancer. N Engl J Med. 2003;349:366–381. doi: 10.1056/NEJMra021562. [DOI] [PubMed] [Google Scholar]
- Nimptsch K, Rohrmann S, Kaaks R, Linseisen J. Dietary vitamin K intake in relation to cancer incidence and mortality: results from the Heidelberg cohort of the European Prospective Investigation into Cancer and Nutrition (EPIC-Heidelberg) Am J Clin Nutr. 2010;91:1348–1358. doi: 10.3945/ajcn.2009.28691. [DOI] [PubMed] [Google Scholar]
- Nimptsch K, Rohrmann S, Linseisen J. Dietary intake of vitamin K and risk of prostate cancer in the Heidelberg cohort of the European Prospective Investigation into Cancer and Nutrition (EPIC-Heidelberg) Am J Clin Nutr. 2008;87:985–992. doi: 10.1093/ajcn/87.4.985. [DOI] [PubMed] [Google Scholar]
- Otera H, Ohsakaya S, Nagaura ZI, Ishihara N, Mihara K. Export of mitochondrial AIF in response to proapoptotic stimuli depends on processing at the intermembrane space. EMBO J. 2005;24:1375–1386. doi: 10.1038/sj.emboj.7600614. [DOI] [PMC free article] [PubMed] [Google Scholar]
- Otsuka M, Kato N, Shao RX, Hoshida Y, Ijichi H, Koike Y, Taniguchi H, Moriyama M, Shiratori Y, Kawabe T, Omata M. Vitamin K2 inhibits the growth and invasiveness of hepatocellular carcinoma cells via protein kinase A activation. Hepatol Baltim Md. 2004;40:243–251. doi: 10.1002/hep.20260. [DOI] [PubMed] [Google Scholar]
- Podhorecka M, Skladanowski A, Bozko P. H2AX Phosphorylation: Its Role in DNA Damage Response and Cancer Therapy. J Nucleic Acids. 2010;2010 doi: 10.4061/2010/920161. [DOI] [PMC free article] [PubMed] [Google Scholar]
- Ricciardelli C, Choong CS, Buchanan G, Vivekanandan S, Neufing P, Stahl J, Marshall VR, Horsfall DJ, Tilley WD. Androgen receptor levels in prostate cancer epithelial and peritumoral stromal cells identify non-organ confined disease. The Prostate. 2005;63:19–28. doi: 10.1002/pros.20154. [DOI] [PubMed] [Google Scholar]
- Roninson IB. Tumor cell senescence in cancer treatment. Cancer Res. 2003;63:2705–2715. [PubMed] [Google Scholar]
- Samykutty A, Shetty AV, Dakshinamoorthy G, Kalyanasundaram R, Zheng G, Chen A, Bosland MC, Kajdacsy-Balla A, Gnanasekar M. Vitamin k2, a naturally occurring menaquinone, exerts therapeutic effects on both hormone-dependent and hormone-independent prostate cancer cells. Evid-Based Complement Altern Med ECAM. 2013;2013:287358. doi: 10.1155/2013/287358. [DOI] [PMC free article] [PubMed] [Google Scholar]
- Shao C, Ahmad N, Hodges K, Kuang S, Ratliff T, Liu X. Inhibition of polo-like kinase 1 (Plk1) enhances the antineoplastic activity of metformin in prostate cancer. J Biol Chem. 2015;290:2024–2033. doi: 10.1074/jbc.M114.596817. [DOI] [PMC free article] [PubMed] [Google Scholar]
- Shetty A, Dasari S, Banerjee S, Gheewala T, Zheng G, Chen A, Kajdacsy-Balla A, Bosland MC, Munirathinam G. Hepatoma-derived growth factor: A survival-related protein in prostate oncogenesis and a potential target for vitamin K2. Urol Oncol. 2016;34:483.e1–483.e8. doi: 10.1016/j.urolonc.2016.05.027. [DOI] [PMC free article] [PubMed] [Google Scholar]
- Siegel RL, Miller KD, Jemal A. Cancer statistics, 2015. CA Cancer J Clin. 2015;65:5–29. doi: 10.3322/caac.21254. [DOI] [PubMed] [Google Scholar]
- Suresh S, Raghu D, Karunagaran D. Menadione (Vitamin K3) induces apoptosis of human oral cancer cells and reduces their metastatic potential by modulating the expression of epithelial to mesenchymal transition markers and inhibiting migration. Asian Pac J Cancer Prev APJCP. 2013;14:5461–5465. doi: 10.7314/apjcp.2013.14.9.5461. [DOI] [PubMed] [Google Scholar]
- Tamori A, Habu D, Shiomi S, Kubo S, Nishiguchi S. Potential role of vitamin K(2) as a chemopreventive agent against hepatocellular carcinoma. Hepatol Res Off J Jpn Soc Hepatol. 2007;37(Suppl 2):S303–307. doi: 10.1111/j.1872-034X.2007.00202.x. [DOI] [PubMed] [Google Scholar]
- Tokita H, Tsuchida A, Miyazawa K, Ohyashiki K, Katayanagi S, Sudo H, Enomoto M, Takagi Y, Aoki T. Vitamin K2-induced antitumor effects via cell-cycle arrest and apoptosis in gastric cancer cell lines. Int J Mol Med. 2006;17:235–243. [PubMed] [Google Scholar]
- van Bokhoven A, Varella-Garcia M, Korch C, Miller GJ. TSU-Pr1 and JCA-1 cells are derivatives of T24 bladder carcinoma cells and are not of prostatic origin. Cancer Res. 2001;61:6340–6344. [PubMed] [Google Scholar]
- Wang C, Youle RJ. The role of mitochondria in apoptosis*. Annu Rev Genet. 2009;43:95–118. doi: 10.1146/annurev-genet-102108-134850. [DOI] [PMC free article] [PubMed] [Google Scholar]
- Yao K, Jiang X, He L, Tang Y, Yin G, Zeng Q, Jiang Z, Tan J. Anacardic acid sensitizes prostate cancer cells to radiation therapy by regulating H2AX expression. Int J Clin Exp Pathol. 2015;8:15926–15932. [PMC free article] [PubMed] [Google Scholar]
- Yokoyama T, Miyazawa K, Naito M, Toyotake J, Tauchi T, Itoh M, Yuo A, Hayashi Y, Georgescu MM, Kondo Y, Kondo S, Ohyashiki K. Vitamin K2 induces autophagy and apoptosis simultaneously in leukemia cells. Autophagy. 2008;4:629–640. doi: 10.4161/auto.5941. [DOI] [PubMed] [Google Scholar]
Associated Data
This section collects any data citations, data availability statements, or supplementary materials included in this article.
Supplementary Materials
Sup. Figure 1: Vitamin K2 induces Apoptosis in VCaP cells by TUNEL assay. (A) VCaP cells were treated with various concentrations of VK2 (50, 100 and 200 μM) for 48 hours. Cells were stained with Hoechst 33342 to detect apoptotic cells and red for nucleus. Phase-contrast images under 10× magnification with Scale bar 200μm. (B) Quantitative analysis of color intensity produced by Red color. The bars in the figure represent mean ± SD. Measurements were done in triplicates per experimental point. *P< 0.01 for differences between untreated controls and VK2 treatments. The TUNEL spots (red) indicate the DNA fragments in the nuclei of the cell in comparison with intact nuclei stained by DAPI (blue).
Sup. Figure 2: VK2 induces apoptosis by activating caspase-3. (A) VCaP cells were treated with various concentrations of VK2 along with untreated control and then incubated with cleaved caspase-3 primary antibody and secondary antibody conjugated with FITC. VK2 treated VCaP cells shows strong green fluorescence indicating cleaved caspase-3 (FITC-Green color) activation compared to untreated cells. DAPI (blue color) was used to counterstain the nucleus. Images under 60× magnification with scale bar: 10μm. (B) Quantitative analysis of relative expression of caspase-3 by ELISA. The bars in the figure represent mean ± SD. Measurements were done in triplicates per experimental point. *P< 0.01 for differences between untreated controls and VK2 treatments.
Sup. Figure 3: Treatment of VCaP cells with VK2 results in senescence activation. (A) Senescent cells were detected using β-Gal staining. Formation of blue precipitates in the cytoplasm of cells indicated that the cells undergo cellular senescence in response to VK2 treatment (6 hours) in VCaP cells. Phase-contrast images under 10× magnification with scale bar 200μm. (B) Quantification of average number of senescent cells per well. The bars in the figure represent mean ± SD. Measurements were done in triplicates per experimental point. *P< 0.01 for differences between untreated controls and VCaP cells treated with VK2.
Sup. Figure 4: VK2 induces G0 cell cycle arrest in VCaP cells. Cells were treated with VK2 for 48 hours and cell cycle distribution of propidium iodide (PI)-labeled cells was analyzed by flow cytometric analyses. (A) Histograms of various concentrations of VK2 indicating that the cells are arrested in G0 phase of cell cycle. (B) Histogram showing the percentages of cells in each phase of the cell cycle. The percentage of cells increased with increasing concentrations of VK2 in the G0 phase and decreased in the G1 phase. The bars in the figure represent mean ± SD. Measurements were done in triplicates per experimental point. *P<0.01; $P<0.05 for differences between controls and VK2 treatments.
Sup. Figure 5: VK2 targets multiple signaling pathways in VCaP cells. Cells were treated with various concentrations of VK2 and harvested at 48 hours and equal amount of protein were subjected to SDS-PAGE (12%) and analyzed by Western blot and probed with various protein markers (A) Effect of VK2 on the cleavage of pro-caspase 3 and PARP-1; VK2 treatment activates the caspase-3 into pro- and cleaved caspase 3, 7, and 9. (B) Down regulation of expression of Androgen receptor (AR), TCTP, HMGB1, and HMGB2. (C) Downregulation of the expression of survivin, PCNA, BiP, MMP-2, XIAP, Erg and YAP. (D) Downregulation of checkpoint genes, including PhosphoChk 1, PhosphoChk 2, PhosphoCDC-2, and upregulation of p21 and Bax. (E) Decreased expression of E2F1, NQO1 and Oct-3/4 and increased expression of heme oxygenase-1 (HO-1). The relative expression of protein levels was quantified by Image-J software and indicated on top of each blot. (F–K) Quantitative analysis of Western blots. The intensity of the protein bands was measured and normalized from corresponding housekeeping protein (β-Actin or GAPDH) using ImageJ analysis and presented as graph. The bars in the figure represent mean ± SD. Measurements were done in triplicates per experimental point. *P< 0.01 and #P<0.05 for differences between untreated controls and VK2 treatments.
Sup. Figure 6: VK2 induces phosphoH2AX. VCaP cells were treated with VK2 (50-200μM) for 48 hours. Cells were stained with primary antibody (pH2AX 1:100) and followed by secondary antibody conjugated with FITC (1:500) and observed under confocal microscope. Cisplatin (20μM) treatment served as positive control. Activated or induced pH2AX appear bright green color dots surrounded by the nucleus and the counter stained blue colored nuclear staining (DAPI). Images under 60× magnification with Scale bar: 10μm. Figures shown for each experimental point are representative of one of the triplicates used in the experiment.
Sup. Figure 7: VK2 treatment downregulates expression levels of PSA: VCaP cells were treated with VK2 (50, 100 and 200μM) and subjected to Immunofluorescence microscopy probed with PSA (green fluorescence), counter stained with DAPI (blue fluorescence). Expression of PSA was decreased in VK2 treated VCaP cells compared to untreated controls. Images under 60× magnification with Scale bar: 10μm. (B). Levels of PSA were determined by ELISA. VK2 reduces the secretion of PSA in culture supernatants of CRPC cells. The bars in the figure represent mean ± SD. Measurements were done in triplicates per experimental point. *P< 0.01; #P< 0.05 for differences between untreated controls and VK2 treatments.