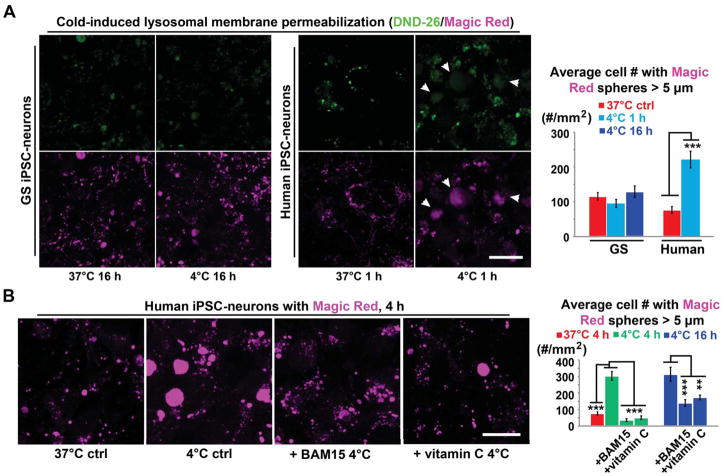
Figure 4. Cold-induced Lysosomal Membrane Permeabilization (LMP) in Human iPSC-neurons.
(A) (Left panel) Live imaging of lysosomes in GS and human iPSC-neurons with DND-26 (green) and Magic Red (magenta; see STAR METHODS). Note: Following 1-h incubation at 4°C, accumulation of diffuse cytoplasmic fluorescence in marked human neurons (arrowheads) indicating LMP. Scale bar: 20 μm. (Right Panel) Quantification of cells containing diffused Magic Red signals (Diameter > 5μm) (n = 6 experiments; Student’s t-test for two-group comparison; *** p < 0.001).
(B) (Left panel) Live imaging of lysosomes in human iPSC-neurons with Magic Red under denoted conditions. Note: BAM15 (0.1 μM) or the antioxidant vitamin C (0.5 mM) alleviated LMP in human neurons treated following 4-h incubation at 4°C. Scale bar: 20 μm. (Right Panel) Quantification of cells containing diffused Magic Red signals (Diameter > 5μm) (n = 5 experiments; Student’s t-test between untreated controls with or without cold exposure; ANOVA plus post hoc Tukey test for multiple cold-exposed groups; ** p < 0.01; *** p < 0.001). See also Figure S5 for the involvement of other PQC components. For these experiments, neurons were derived from 2 GS and 3 human iPSC lines for each group.

