Abstract
Oncogenic membrane receptor tyrosine kinases such as MET and EGFR, or auto-active variants thereof, are important targets for cancer precision therapy. Targeted inhibition of these oncogenic receptors however invariably leads to resistance, resulting from acquisition of resistance-inducing mutations or from selective outgrowth of a priori resistant tumour cells. Most applied molecular protocols cannot distinguish between intracellular and intercellular heterogeneity of oncogene (variant) expression, which may lead to misinterpretation of the molecular make-up of a cancer and suboptimal application of targeted therapies. We here combined two related techniques to allow semiquantitative and localized in situ detection of specific transcript splice variants using single molecule molecular inversion probe (smMIP)-based next generation sequencing and padlock probe-based rolling circle amplification, respectively. We show highly specific padlock probe-based multiplex detection of MET, METΔ7-8 and METΔ14 transcripts, lacking exons 7–8 and exon 14 respectively, and of EGFR and the auto-active EGFRvIII, lacking exons 2–7. The combination of quantitative transcript variant detection with smMIPs and transcript localization using padlock probes can be used for detection of oncogenic transcripts on the single-cell level, allowing study of tumour heterogeneity. Visualization of tumour heterogeneity can shed light on the biology underlying drug resistance and potentially improve targeted therapeutics.
Introduction
Membrane receptor tyrosine kinases, e.g. EGFR, FGFR, IGF1-R, MET, AXL, KIT, RON, VEGFRs and PDGFRs1, have become important targets for cancer precision therapy. Although inhibition of the oncogenic products of these genes frequently leads to initial responses, experience is that eventually treatment-resistant tumours develop. Treatment failure may result from intrinsic intratumoural heterogeneity or from acquisition of resistance-inducing mutations2–4. An example of the latter is acquisition of EGFRT790M or EGFRC797S mutations in non small cell lung cancers upon treatment with the EGFR tyrosine kinase inhibitor erlotinib5,6. Novel precision medicines have been developed that specifically inhibit these mutant EGFR variants7. Formally however, it is unclear whether such aberrations are acquired de novo or whether a priori resistant cells pre-existed in the primary tumour, experiencing a growth advantage and eventually replacing the treatment-sensitive tumour bulk. This is a highly important question, since in the latter case patients should be treated with combination therapy comprising relevant tyrosine kinase inhibitors at start. Therefore it is important to investigate heterogeneity of expression of tyrosine kinases, but also other oncogenes, in tumours in more detail.
Molecular research as well as diagnostics of cancer currently consists of analysis of genomic DNA which is extracted from cancer tissues that also contain non-tumour cells. In these situations it is impossible to assign wild-type alleles to cancer- or stromal cells, or to detect tumour heterogeneity. Examples of oncogenic receptors are the MET and EGFR oncogenes, of which different auto-active variants exist. The METΔ7-8 variant results from a ~2 Kb intragenic deletion which results in spliced mRNA lacking exons 7 and 8. This variant, that misses only 80 amino acids in the ectodomain, is expressed in 6% of high-grade gliomas, remains intracellularly and its activation is ligand independent8. METΔ14 is a splice variant lacking exon 14, a result of exon-skipping point mutations in splice sites9,10, and is hyperactive due to increased protein stability. METΔ14 is detected in 0.4% of glioma and 3–4% of non-small cell lung carcinoma (NSCLC) cases9–12. Increased MET (variant) expression has been described for NSCLC under gefitinib treatment and may represent a rescue kinase for EGFR inhibition13–16.
A second example of oncogene aberration is EGFRvIII. Whereas EGFR is amplified in 50% of glioblastomas, half of these events is accompanied by an intragenic deletion, resulting in EGFR transcripts lacking exons 2–79,17. Protein products of this transcript lack a large part of the extracellular domain and are auto-active. Because the EGFRvIII protein contains a neo-epitope at the exon 1–8 junction, it is tumour specific and therefore of considerable interest for targeted therapies18,19. In glioblastoma, expression of this variant emerges after initial EGFR amplification and is heterogeneous, being more prominent in diffuse infiltrating areas of the brain17. Importantly, this spatial heterogeneity cannot be inferred from genetic analysis. This highlights the need for expression analysis on the single-cell level.
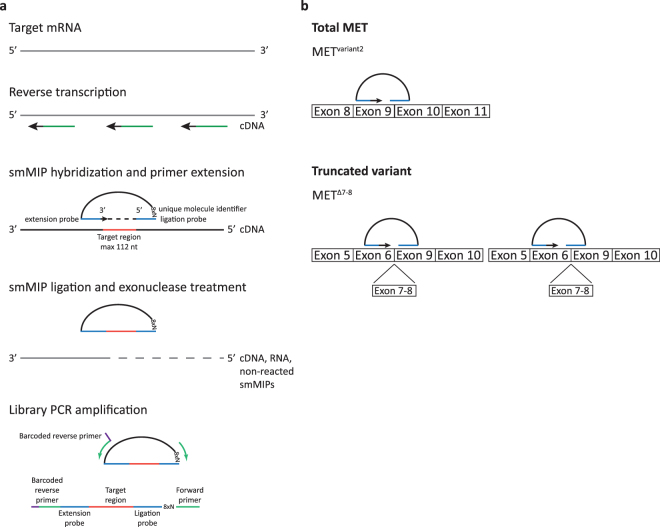
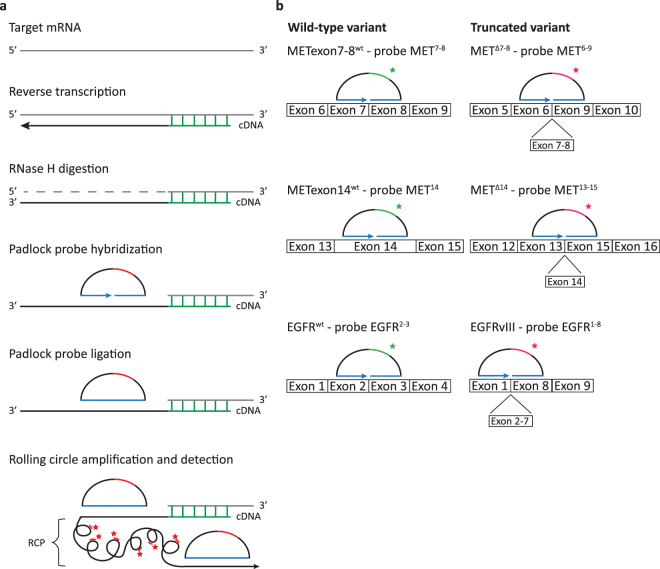
In this study, we combine single molecule molecular inversion probe (smMIP) targeted transcriptome sequencing20,21 (Fig. 1) with in situ detection of transcript splice variants using padlock probe-based rolling circle amplification22–26 (Fig. 2). We show that we are able to specifically and semiquantitatively detect transcript variants in RNA samples from both cell lines and xenografts using smMIPs, and we demonstrate how in situ padlock probe rolling circle amplification adds essential information on transcript localization and tumour heterogeneity.
Figure 1.
Quantitative detection of transcript splice variants using smMIPs. (a) Schematic overview of the method. mRNA is reverse transcribed into cDNA using random primers. SmMIP probes hybridize to the target region of interest, leaving a gap of ~112 nucleotides. The gap is filled by primer extension and ligation, whereafter all remaining linear smMIPs, RNA and cDNA are removed by exonuclease treatment. All circular smMIPs are PCR amplified using a unique barcoded reverse primer for each sample. Resulting reads are mapped against reference transcriptomes, normalized to the total read count within a sample (FPM), and averaged per transcript variant. (b) Design of smMIP probes. To determine the total expression of a gene, smMIPs were designed against shared parts of the transcript of interest (upper panel). For specific detection of splice variants smMIPs were designed to target variant-specific exon-exon junctions (for example the exon6–9 junction for METΔ7-8), either covering the junction with the gap or the ligation/extension probe (lower panel left and right, respectively). Note that for graphical representation, the figure is not to scale.
Figure 2.
In situ detection of whole-exon deletion splice variants using padlock probes. (a) Schematic overview of the method. mRNA is converted into localized cDNA molecules, which can be targeted through padlock probe hybridization and rolling circle amplification. Rolling circle products (RCPs) can then be detected with fluorescently labeled probes. Nucleic acid bridges in the BNA primer are depicted in green, padlock probe target sites are depicted in blue and padlock probe detection sites are depicted in red. (b) Design of padlock probes targeting METexon7–8wt, METΔ7-8, METexon14wt, METΔ14, EGFRwt and EGFRvIII. For specific detection of transcript splice variants, padlock probes were designed to target the mutation-specific exon-exon junction (detected with magenta fluorescence). For distinctive detection of their associated wild-type variants, padlock probes were targeted at the exon(s) missing in the exon deletion transcripts (detected with green fluorescence). Note that for graphical representation, the figure is not to scale.
Results
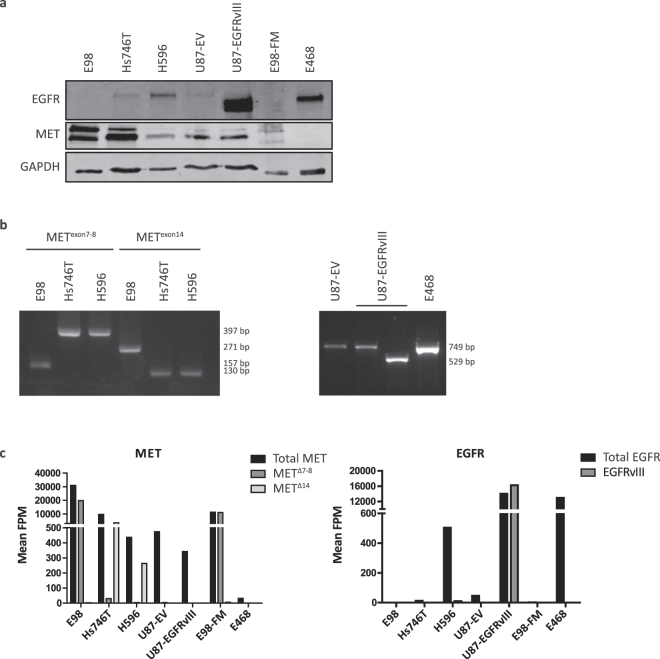
To investigate whether padlock assays can be used for specific in situ detection of oncogene transcripts, we here examined expression of MET and EGFR and auto-active splice variants of these tyrosine kinases, in a cohort of cell lines and xenografts with defined EGFR and MET expression. To set up the technique we used cell lines E98 and its corresponding xenograft (E98-FM, METΔ7-8 amplification)8, cell lines Hs746T (METΔ14, high expression), H596 (METΔ14, low expression), U87-EV (EGFRwt, low expression), U87-EGFRvIII (over-expression)27, and xenograft E468 (EGFR amplification)28. Relative protein expression levels of MET and EGFR in the different cell lines and xenografts are shown in Fig. 3a. By PCR analysis we confirmed the MET transcript status of E98, Hs746T and H596, and EGFR transcript mutation status of E468, U87-EV and U87-EGFRvIII (Fig. 3b). We semiquantitatively determined transcript variant-specific expression levels of MET and EGFR in all cell lines and xenografts using smMIPs (Fig. 3c).
Figure 3.
Expression levels and mutation status of MET and EGFR in relevant cell lines and xenografts. (a) western blot of cell lines E98, Hs746T and H596, U87-EV, U87-EGFRvIII, and xenografts E98-FM and E468, showing relative (total) MET and EGFR expression. Note that MET shows two proteins of different sizes, corresponding to the preform and the processed form of the protein8. (b) Left: MET PCR on cell lines E98, Hs746T and H596 to confirm METΔ7-8 and METΔ14 mutation status. Right: EGFR PCR on cell lines U87-EV and U87-EGFRvIII, and xenograft E468, to confirm EGFRwt and EGFRvIII status. (c) SmMIP targeted transcriptome profiling of MET (left) and EGFR (right) quantifies variant-specific expression levels in cell lines and xenografts. While E98 cells and xenografts express the METΔ7-8 variant, Hs746T and H596 predominantly express the METΔ14 variant. U87 cells express METwt transcripts. EGFRwt transcript expression is present in Hs746T, H596, U87 and E468 cells and xenografts, while the EGFRvIII variant is only present in the U87-EGFRvIII cell line.
We first tested the specificity of the MET-targeting padlock probes on cell lines with known MET status. Single-probe assays with padlock probe MET7,8 resulted in fluorescent signal in Hs746T, but not in E98 cells. Conversely, single-probe assays with padlock probe MET6–9 resulted in fluorescent signal in E98, but not in Hs746T cells (Fig. 4a). These results are in line with the fact that E98 cells exclusively express METΔ7-8, while Hs746T cells only express METexon7–8wt transcripts, confirming the specificity of MET7,8 and MET6–9 probes. Similarly, we performed single-probe padlock assays with the MET14 and MET13–15 probes on E98 cells in which no METΔ14 is expressed, and Hs746T and H596 cell lines, expressing METΔ14. As expected, in E98 cells METexon14wt transcripts were readily detected with probe MET14, while the assay was negative when performed with the MET13–15 probe (Fig. 4b upper panel). Conversely, Hs746T and H596 cells were positive when assayed with the padlock MET13–15 probe, and negative with the MET14 probe (Fig. 4b middle and lower panels). Numbers of fluorescent spots in H596 cells were lower than in Hs746T cells, in agreement with the lower levels of MET protein that we detected by western blot in these cell lines (Fig. 3a) and lower levels of MET transcript as detected by smMIP-sequencing (Fig. 3c).
Figure 4.
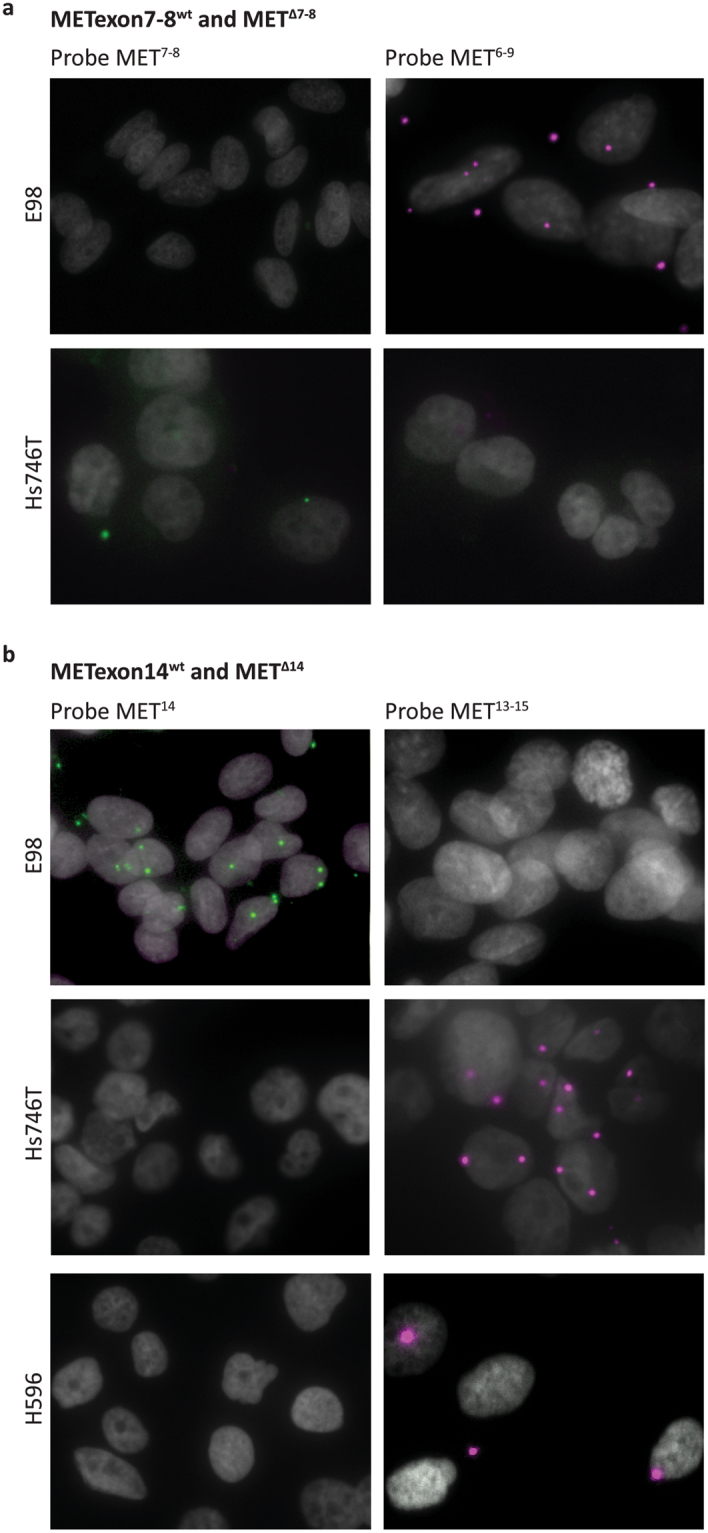
Single-probe in situ mutation detection of MET using padlock probe rolling circle amplification on cell lines. (a) In situ detection of METexon7–8wt and METΔ7-8 transcripts in E98 and Hs746T cells using padlock probes MET7,8 and MET6–9, respectively. METexon7–8wt transcripts are displayed as green RCPs, METΔ7-8 transcripts are displayed as magenta RCPs. Cell nuclei are shown in grey. Original magnification 40x. (b) In situ detection of METexon14wt and METΔ14 transcripts in E98, Hs746T and H596 cell lines using padlock probes MET14 and MET13–15, respectively. METexon14wt transcripts are displayed as green RCPs, METΔ14 transcripts are displayed as magenta RCPs. Cell nuclei are shown in grey. Original magnification 40x.
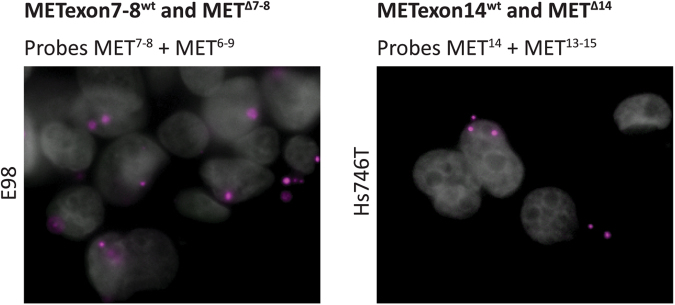
Having confirmed the specificity of these probes, we subjected E98 and Hs746T cells to a combination of MET7,8 and MET6–9 probes, and MET14 and MET13–15 probes, respectively. This duo-probe padlock assay allows duplex detection of wild-type (detected in green) and mutant variants (detected in magenta) of the same RNA transcript simultaneously. The selectivity of the padlock probes was preserved when mutant-specific probes were applied together with their corresponding wild-type probe, and also the efficiency was not notably affected (Fig. 5).
Figure 5.
Multi-plex in situ mutation detection of MET using padlock probe rolling circle amplification on cell lines. In situ duo-probe detection of METexon7–8wt and METΔ7-8 transcripts in E98 cells (left) and METexon14wt and METΔ14 transcripts in Hs746T cells (right) using padlock probes MET7,8 and MET6–9, and MET14 and MET13–15, respectively. METexon7–8wt and METexon14wt transcripts are displayed as green RCPs, METΔ7-8 and METΔ14 transcripts are displayed as magenta RCPs. Cell nuclei are shown in grey. Original magnification 40x.
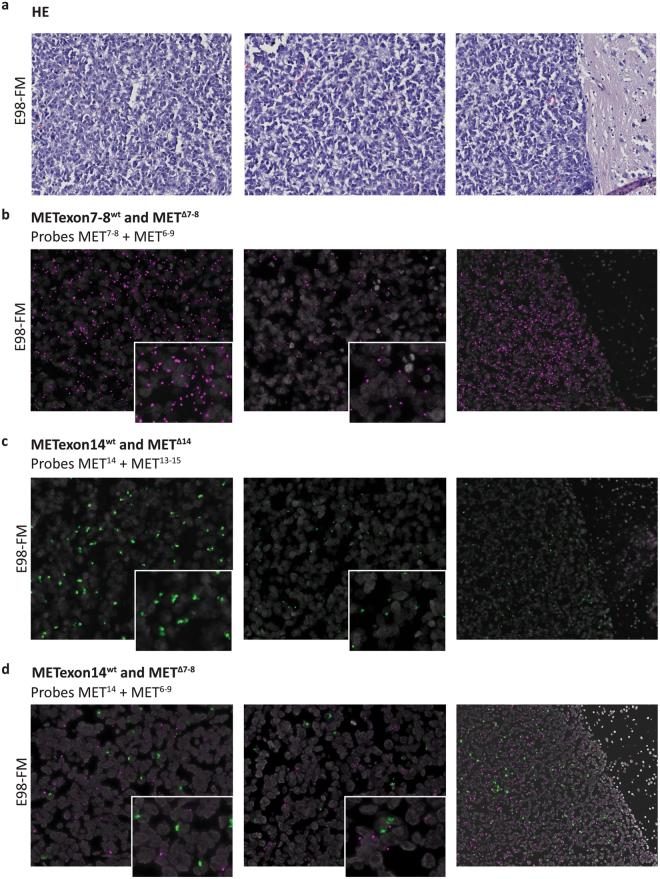
After successful and specific detection of MET splice variants in cell lines, we tested our duo-probe padlock assay on FFPE xenograft material. We subjected serial E98-FM FFPE tissue slides, carrying the METΔ7-8 mutation but with a wild type exon 14 allele, to duo-probe padlock assays using a combination of probes MET6–9 and MET7,8 (Fig. 6b), MET13–15 and MET14 (Fig. 6c), or MET14 and MET6–9 (Fig. 6d). H&E sections serial to the padlock assay tissues are depicted in Fig. 6a. Both METΔ7-8 and METexon14wt transcripts were specifically detected in E98 xenograft tissue, without detection spots for METexon7–8wt or METΔ14 transcripts, respectively (Fig. 6b,c). We could visualize different tumour areas with high and low expression of the targeted MET transcripts (Fig. 6b,c, left and middle panels, respectively). Note that normal tissue (right part of right panels) was completely negative. A double-positive padlock assay targeting METexon14wt and METΔ7-8 on E98 xenograft tissue showed specific detection of both transcripts simultaneously (Fig. 6d). Probe specificity is again highlighted at the tumour border (Fig. 6d, right panel). Although both padlock probes were readily identified in these sections, co-localization was only occasionally observed (see Supplementary Fig. 2, arrows). This is possibly due to the low sensitivity of the padlock probe assay. Of note, signals were slightly decreased in the double-positive assay as compared to the single-positive padlock assays. Although we could not quantify this, we attribute this to competition of padlock probes on the same transcript.
Figure 6.
Multi-plex in situ mutation detection of MET using padlock probe rolling circle amplification on E98-FM FFPE xenograft tissue. (a) Serial H&E stainings. (b) In situ duo-probe detection of METexon7–8wt and METΔ7-8 transcripts using padlock probes MET7,8 and MET6–9, respectively. (c) In situ duo-probe detection of METexon14wt and METΔ14 transcripts using padlock probes MET14 and MET13–15, respectively. (d) In situ duo-probe detection of METexon14wt and METΔ7-8 transcripts using padlock probes MET14 and MET6–9, respectively. Wild-type transcripts are displayed as green RCPs, mutant transcripts are displayed as magenta RCPs. Cell nuclei are shown in grey. Note that in all assays the tumour border emphasizes the specificity of the padlock probes, showing no fluorescent detection spots in normal brain tissue (right figures, original magnification 20x). Compare the left and middle panels for each assay, visualizing differences in transcript expression in different tumour areas. Inserts give a zoomed view of the underlying image. Original magnification 40x.
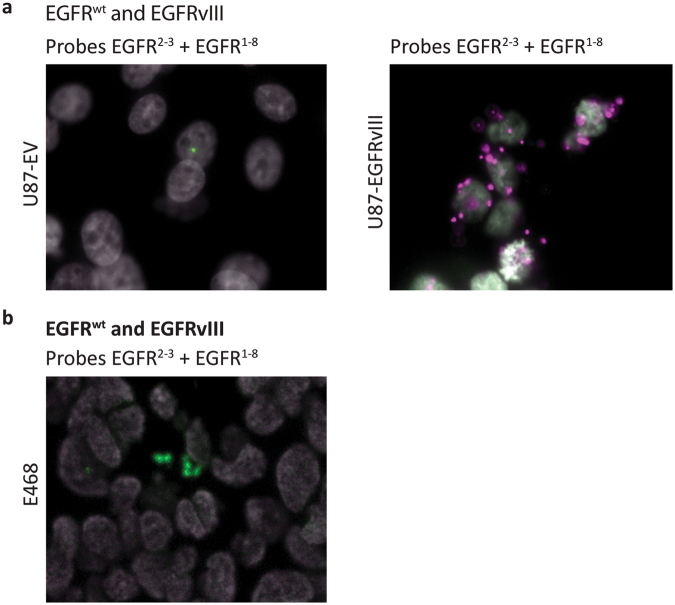
Similar to the padlock assays targeting MET, we performed padlock assays targeting EGFRwt and EGFRvIII transcripts. We subjected U87-EV (EGFRwt) and U87-EGFRvIII overexpressing cell lines to a duplex assay to detect EGFRwt and EGFRvIII transcripts, using padlock probes EGFR2,3 (green) and EGFR1–8 (magenta), respectively. In U87-EV cells this assay resulted in fluorescent signal for EGFRwt, while EGFRvIII specific transcripts were abundantly detected in U87-EGFRvIII overexpressing cells (Fig. 7a). In U87-EGFRvIII cells no EGFRwt signals were detected in the duplex assay, probably because of the low abundance of EGFRwt transcripts in these cells, compared to high overexpression of EGFRvIII transcripts. Note that the number of EGFRwt fluorescent spots in U87-EV cells is much lower than the number of EGFRvIII spots in U87-EGFRvIII cells, which corresponds to the difference in EGFR expression (Fig. 3a,c). We also subjected EGFRwt expressing E468 xenograft tissue to a duplex EGFR padlock assay. Figure 7b shows specific detection of EGFRwt transcripts.
Figure 7.
Multi-plex in situ mutation detection of EGFR using padlock probe rolling circle amplification on cell lines and E468 xenograft tissue. A) In situ duo-probe detection of EGFRwt and EGFRvIII transcripts using padlock probes EGFR2,3 and EGFR1–8, on U87-EV and U87-EGFRvIII cells (original magnification 40x). B) In situ duo-probe detection of EGFRwt and EGFRvIII transcripts using padlock probes EGFR2,3 and EGFR1–8, on E468 xenograft FFPE tissue (original magnification 20x). EGFRwt transcripts are displayed as green RCPs, EGFRvIII transcripts are displayed as magenta RCPs. Cell nuclei are shown in grey.
Discussion
To be able to investigate tumour heterogeneity with respect to oncogene expression, we applied padlock probe rolling circle amplification to indentify EGFR, MET and the whole-exon deletion splice variants of these oncogenes that play a role in, among others, glioma and NSCLC1,5,16,29–31. Simultaneous in situ detection of tyrosine kinase splice variants with their associated wild-type variants enables visualization of tumour heterogeneity in FFPE tissue sections, material which is routinely used in diagnostics and can be preserved for years.
In recent years, articles have reported on the use of padlock probes for in situ analysis of single-nucleotide transcript variants22,24 and fusion transcripts23. Here, we adapted these protocols to allow in situ identification of whole-exon deletion splice variants. Probe specificity was validated in single-probe assays on cell lines with known MET or EGFR status, and was preserved in duplex padlock assays. As for now, a drawback is low sensitivity of padlock probe assays, possibly explaining the lack of co-localization of MET14 and MET6–9 probes in Fig. 6d. The distinction between intercellular and intracellular tumoural heterogeneity, with different oncogene variants being present within the same cell or with subclones of cells carrying different oncogene variants, respectively2,3,32, can therefore not be made. This distinction is important since cells co-expressing different tyrosine kinases that initiate similar signalling pathways, will respond differently to drugs than cells expressing only the targeted kinase. Low sensitivity of padlock probe assays has been described before22,24,25. However, the reason is not clear and may be related to any of the complex steps in the procedure, including fixation method/RNA quality, RNA secondary structures that hamper effective in situ reverse transcription, and the presence of single nucleotide polymorphisms (SNPs) impeding hybridisation of the BNA probe and the padlock probe. Improvement of sensitivity of the method is necessary to detect co-expression of different transcripts in one cancer cell. However, the high specificity of the padlock assay will allow the investigation of intratumoural, intercellular heterogeneity of splice variant transcript expression. To allow successful padlock assays on clinical tissue, the essentiality of RNA integrity probably requires that tumour tissue is fixated shortly after surgery or biopsy in proper preservatives.
For smMIP-based targeted RNA sequencing we have observed a variance in efficacy between different smMIPs targeting the same transcript. We have reported that the average of five smMIPs targeting one transcript gives a reliable estimate of the expression level of a transcript21. Because padlock assays rely on the hybridisation of one individual probe for each transcript variant, these are not suitable for quantification of transcript (variant) expression levels. In situ rolling circle amplification using padlock probes does allow visualization of intercellular heterogeneity within tumour tissues. In contrast, smMIP-based targeted RNA sequencing allows quantitative and specific detection of splice variants, but does not enable visualization of tumour heterogeneity and localization of specific transcripts. The combination of both techniques possibly allows differentiation between intrinsic and acquired transcript expression (induced tumour heterogeneity), and between intrinsic and acquired treatment resistance development. This is an interesting aspect for future studies and may give more insight into tumour resistance biology. This potentially has implications for targeted therapy, because patients with pre-existent resistant tumour clones may benefit significantly from combination therapies at start.
In conclusion, we here show the high value of combining two molecular inversion probe techniques. Using smMIP targeted transcriptomics we can quantitatively measure transcript variant-specific gene expression. Additionally, padlock probe rolling circle amplification enables specific and local visualization of transcript variants in situ, however with low efficacy. The technique of smMIP-based RNA splice variant sequencing can be easily expanded with smMIP probes to detect other transcript variants, and can serve as an important tool for detection of molecular heterogeneity and investigation of the role of splice variants in therapy resistance.
Materials and Methods
Cell lines and xenografts
Cell lines Hs746T and H596 were obtained from ATCC (Manassas, VA). Cell lines E9828, Hs746T, H596, U87-EV and U87-EGFRvIII (obtained from dr. Web Cavenee, Ludwig Cancer Inst., USA27) were cultured at 37 °C in the presence of 5% CO2 in Dulbecco’s Modified Eagle’s Medium (DMEM) containing 4.5 g/L glucose and 4 mM L-glutamin (Lonza, Basel, Switserland), 10% fetal calf serum (FCS, Gibco, Waltham, MA, USA) and 40 µg/ml gentamycin (Centrafarm, Ettenleur, The Netherlands). The METΔ7-8-expressing astrocytoma cell line E98 and the EGFR-expressing astrocytoma line E468, as well as the generation of orthotopic xenografts thereof, has been described before8,28.
Western blot
Cells were lysed in 1x RIPA buffer (Cell Signaling Technology, CST, Danvers, MA) with 1 mM phenylmethylsulfonyl fluoride (PMSF), according to manufacturer’s instructions. Protein lysates were subjected to electrophoresis on 10% SDS-PAGE gels and electroblotted onto nitrocellulose membranes (Whatman Optitran BA-S85, GE Healthcare, Little Chalfont, UK). After blocking aspecific binding sites in blocking buffer (1:1 PBS/Odyssey blocking buffer [LI-COR Biosciences, Lincoln, NE, USA]), blots were incubated o/n at 4 °C with primary antibodies: rabbit-anti-MET (1:2500, CST, #8198), rabbit-anti-EGFR D38B1 (1:2000, CST, #4267) and mouse-anti-GAPDH (1:5000, Abcam, ab8245). Primary antibodies were detected with appropriate IRDye680- or IRDye800-conjugated secondary antibodies (Invitrogen Molecular Probes, Waltham, MA, USA) incubated 1 hr at RT shielded from light. Signals were visualized using the Odyssey imaging system (LI-COR Biosciences, Lincoln, NE, USA).
PCR
RNA was isolated from cell lines and snap-frozen xenograft tissue using TRIzol reagent (Life Technologies, ThermoFisher Scientific, Waltham, MA, USA) and reverse transcribed with Superscript II (Invitrogen, ThermoFisher Scientific, Waltham, MA, USA) using random hexamer primers, according to the manufacturer’s instructions. RT-PCR was performed using Amplitaq Gold 360 mastermix (Applied Biosystems, Life Technologies), which for PCR on MET was supplemented with 1 mM MgCl2 and 20 µg/ml BSA (both New England Biolabs, Ipswich, MA, USA). To distinguish METΔ7-8 transcripts from their wild-type variant (METexon7–8wt), primers MET1997Fw (5′-CTCCTTGGAAATGAGAGCTG-3′, forward, located in exon 6) and MET2393Rv (5′-AGATGCTTGTCTCTCGGTTG-3′, reverse, located in exon 9) were used. This PCR results in a 397-bp amplicon for METexon7–8wt and a 157-bp product for METΔ7-8. To distinguish METΔ14 transcripts and their wild-type variant (METexon14wt) primers MET2982Fw (5′- CAGGATTGATTGCTGGTGTTGTCTC-3′, forward, located in exon 13) and MET3252Rv (5′- CGGCATGAACCGTTCTGAGATG-3′, reverse, located in exon 15) were used, resulting in a PCR product of 271 bp for METexon14wt and 130 bp for METΔ14. To detect EGFRwt transcripts primers EGFR819Fw (5′-GATATCACCATGCGACCCTCCGGG-3′, forward, located in exon 5) and EGFR1567Rv (5′-CGACTGCAAGAGAAAACTGA-3′, reverse, located in exon 12) were used, resulting in a 749-bp product for EGFRwt. For detection of EGFRvIII transcripts in U87-EGFRvIII cells, primers EGFR258Fw (5′-GATATCACCATGCGACCCTCCGGG-3′, forward, located in exon 1) and EGFR1567Rv (5′-CGACTGCAAGAGAAAACTGA-3′, reverse, located in exon 12) were used, resulting in a 529-bp product for EGFRvIII. PCR conditions were: initial denaturation of 3 min at 95 °C, followed by 36 cycles of denaturation at 95 °C, 30 s; annealing at 60 °C, 30 s; elongation at 72 °C, 30 s, and a final elongation step of 5 min at 72 °C.
smMIP targeted RNA sequencing
RNA from cell lines and snap-frozen xenograft tissue was isolated and converted to cDNA as described under ‘PCR’. The smMIP method and its application for targeted transcriptome sequencing has been described before20,21 and is depicted in Fig. 1a. SmMIPs were designed against target regions of interest (UCSC human genome assembly hg19, and variant-specific FASTA sequences) with ligation and extension probes localized on different exons, depending on the splice variant to be detected, and leaving a gap of maximum 112 nt. SmMIPs were designed based on the MIPgen algorithm as described by Boyle et al.33 and added to a large panel of previously designed smMIPs21. The panel of phosphorylated smMIPs was hybridized to cDNA after which the gap was filled by primer extension and ligation. Non-reacted smMIPs and remaining RNA and cDNA were removed by exonuclease treatment, followed by PCR amplification of the circularized smMIP library using a unique barcoded reverse primer for each sample. After library pooling and purification using AMPureXP beads (Beckman Coulter Genomics, High Wycombe, UK) smMIP-PCR libraries were sequenced on the Illumina Nextseq platform (Illumina, San Diego, CA) at the Radboudumc sequencing facility. Reads were mapped against the reference transcripts (UCSC human genome assembly hg19 and variant-specific FASTA sequences) using the SeqNext module of JSI SequencePilot version 4.2.2 build 502 (JSI Medical Systems, Ettenheim, Germany). The random 8xN nucleotide tag flanking the ligation probe was used to reduce PCR amplicates to one consensus read originating from the same smMIP (unique read). Read counts for each smMIP were normalized to the total read count within a sample and multiplied by 106 (Fragments per Million, FPM). Individual transcript levels were expressed as mean FPM of all smMIPs targeting that transcript.
SmMIPs were designed against transcript variants of MET (total MET, METΔ7-8, METΔ14) and EGFR (total EGFR, EGFRvIII). SmMIP sequences are depicted in Table 1. An example of smMIP design for total MET (transcript variant 2) and METΔ7-8 is depicted in Fig. 1b. To determine the cumulated expression of all MET transcript variants, smMIPs were designed against shared parts of the transcripts (total MET). To enable detection of truncated transcripts, smMIPs were designed against splice variant-specific exon-exon junctions, either with the maximum 112 nt gap or the ligation/extension probe covering the exon-exon junction (exon 6–9 junction for METΔ7-8). SmMIPs were designed in a similar way for METΔ14, total EGFR and EGFRvIII.
Table 1.
SmMIP nucleotide sequences. Ligation and extension probes are depicted in Italic.
| Transcript | Exon targets | MIP sequence (5′→3′) | |
|---|---|---|---|
| Extension | Ligation | ||
| variant | probe | probe | |
| Total MET | Exon 9 | Exon 9–10 | GTGGTGGGAGCACAATAACAGGTGTTGNNNNNNNNCTTCAGCTTCCCGATATCCGACGGTAGTGTCAAACCATTTCAACTGAG |
| (variant 2) | Exon 9 | Exon 11 | GCATGTCAACATCGCTCTAATTCAGNNNNNNNNCTTCAGCTTCCCGATATCCGACGGTAGTGTATTCATCCAACCAAATCTTT |
| METΔ7-8 | Exon 6 | Exon 6–9 | GCACGATGAATACTGTGTCAAACAGNNNNNNNNCTTCAGCTTCCCGATATCCGACGGTAGTGTTTGAAGGAGGGACAAGGCTG |
| Exon 6 | Exon 9 | GCCAACCGAGAGACAAGCATCTTCANNNNNNNNCTTCAGCTTCCCGATATCCGACGGTAGTGTAATGAGAGCTGCACCTTGAC | |
| METΔ14 | Exon 13 | Exon 15 | GTTTCCTAATTCATCTCAGAACGGTTCANNNNNNNNCTTCAGCTTCCCGATATCCGACGGTAGTGTAATAGTTCAACCAGATC |
| Exon 13 | Exon 15 | CAGTCCATTACTGCAAAATACTGTCCACANNNNNNNNCTTCAGCTTCCCGATATCCGACGGTAGTGTAAAAAGAGAAAGCAAA | |
| Total EGFR | Exon 1 | Exon 2 | GGAAATTACCTATGTGCAGAGGAATTATGNNNNNNNNCTTCAGCTTCCCGATATCCGACGGTAGTGTCTGGAGGAAAAGAAAG |
| Exon 3 | Exon 3 | GCAAATAAAACCGGACTGAAGGAGCNNNNNNNNCTTCAGCTTCCCGATATCCGACGGTAGTGTGTGGCTGGTTATGTCCTCAT | |
| Exon 3 | Exon 4 | GCCCTGTGCAACGTGGAGAGCATCNNNNNNNNCTTCAGCTTCCCGATATCCGACGGTAGTGTCTACGAAAATTCCTATGCCTT | |
| Exon 5–6 | Exon 6–7 | GCCTGGTCTGCCGCAAATTCCGAGACGAANNNNNNNNCTTCAGCTTCCCGATATCCGACGGTAGTGTCCAGAAACTGACCAAA | |
| Exon 7 | Exon 8 | GCCTGTGGGGCCGACAGCTATGAGATGGANNNNNNNNCTTCAGCTTCCCGATATCCGACGGTAGTGTTCTACAACCCCACCAC | |
| Exon 9 | Exon 10–11 | CGTAAAGGAAATCACAGGGTTTTTGCTGANNNNNNNNCTTCAGCTTCCCGATATCCGACGGTAGTGTAAACACTTCAAAAACT | |
| Exon 15 | Exon 17 | GCCCTGGGGATCGGCCTCTTCATNNNNNNNNCTTCAGCTTCCCGATATCCGACGGTAGTGTACCTGTGCCATCCAAACTGCAC | |
| Exon 17–18 | Exon 18–19 | GCACGGTGTATAAGGGACTCTGGATNNNNNNNNCTTCAGCTTCCCGATATCCGACGGTAGTGTTGCTGCAGGAGAGGGAGCTT | |
| Exon 18 | Exon 19–20 | GCCAACAAGGAAATCCTCGATGAAGCNNNNNNNNCTTCAGCTTCCCGATATCCGACGGTAGTGTAAAAGATCAAAGTGCTGGG | |
| Exon 19 | Exon 20 | TCTGCCTCACCTCCACCGTGCANNNNNNNNCTTCAGCTTCCCGATATCCGACGGTAGTGTAAGTTAAAATTCCCGTCGCTATC | |
| Exon 20 | Exon 20 | GCTCCCAGTACCTGCTCAACTGGTGTGTNNNNNNNNCTTCAGCTTCCCGATATCCGACGGTAGTGTTGGACAACCCCCACGT | |
| Exon 21 | Exon 21–22 | GCAGAAGGAGGCAAAGTGCCTATCAANNNNNNNNCTTCAGCTTCCCGATATCCGACGGTAGTGTAGGACCGTCGCTTGGTGCA | |
| Exon 21 | Exon 23 | GAGTTGATGACCTTTGGATCCAAGCCNNNNNNNNCTTCAGCTTCCCGATATCCGACGGTAGTGTCGGAAGAGAAAGAATACCA | |
| Exon 23–24 | Exon 25 | GCCAAGTCCTACAGACTCCAACNNNNNNNNCTTCAGCTTCCCGATATCCGACGGTAGTGTCATGGTCAAGTGCTGGATGATAG | |
| Exon 26 | Exon 27 | GACAGCATAGACGACACCTTCCTCCCAGNNNNNNNNCTTCAGCTTCCCGATATCCGACGGTAGTGTAGTGCAACCAGCAACAA | |
| Exon 28 | Exon 28 | GCCACCAAATTAGCCTGGACAACCCTGNNNNNNNNCTTCAGCTTCCCGATATCCGACGGTAGTGTAGAGACCCACACTACCA | |
| EGFRvIII | Exon 1 | Exon 8 | GTGGTGACAGATCACGGCTCGTGNNNNNNNNCTTCAGCTTCCCGATATCCGACGGTAGTGTGAGAGCCGGAGCGAGCTCTT |
| Exon 1 | Exon 8–9 | GCCGCAAAGTGTGTAACGGAATAGGTANNNNNNNNCTTCAGCTTCCCGATATCCGACGGTAGTGTCTGGAGGAAAAGAAAG | |
Padlock probe design
The protocol for padlock probe rolling circle amplification and the design of padlock probes with associated bridged nucleic acid (BNA) primers was adapted from Weibrecht et al.26 and is summarized in Fig. 2a,b. Wild-type transcripts were distinctively detected with padlock probes targeting ‘normal’ exon-exon junctions that are missing in the exon-deletion transcript variants. For specific detection of splice variants, padlock probes were designed to target the splice variant-specific MET exon-exon junctions 6–9 (for detection of METΔ7-8) and 13–15 (for detection of METΔ14) and EGFR exon-exon junction 1–8 (for detection of EGFRvIII, Fig. 2b). To allow dual detection of splice variants together with their associated wild-type transcripts, specific sequences were included in the backbone of the padlock probe allowing detection via hybridization of complementary fluorescent probes. Bridged Nucleic Acid (BNA) primer, padlock probe and detection probe nucleotide sequences, as well as the nomenclature of probes and transcript variants used in this paper, are outlined in Table 2. Before use, padlock probes (IDT, Leuven, Belgium) were 5′-phosphorylated using 0.2 U/µl T4 PNK in 1x PNK buffer A (ThermoFisher Scientific, Waltham, MA, USA) according to manufacturer’s instructions.
Table 2.
BNA primer, padlock probe and detection probe nucleotide sequences.
| Transcript variant | Exon targets (probe) | Nucleotide sequences (5′→3′) | ||
|---|---|---|---|---|
| BNA primer | Padlock probe | Detection probe | ||
| METexon7-8wt | Exon 7-8 (MET7,8) | CAGCCATAGGACC GTATTTCGGCGA |
GATCCTGTAATAACAAGTATGTGACATACTGACAAAGTAGCCGTG ACTATCGACTTGACCAGTTAGCAAAACAGTACATTCTCCTATGTG |
Cy5-AGTAGCCGTGACTATCGACT |
| METΔ7-8 | Exon 6-9 fusion (MET6–9) |
GGGCTGGGGTATA ACATTCAAGAAT |
TGTGTCAAACAGTATTCTTGGTGACATACTGACACCTCAATGCACA TGTTTGGCTCCTGACCAGTTAGCAAGTGAGAGCACGATGAATAC |
TexRd-XN-CCTCAATGCACATGTTTGGCTCC |
| METexon14wt | Exon 14 (MET14) |
CACTTCGGGCACTT ACAAGCCTATC |
CACTCCTCATTTGGATAGGCGTGACATACTGACAAAGTAGCCGTG ACTATCGACTTGACCAGTTAGCAAACGCTACGATGCAAGAGTACA |
Cy5-AGTAGCCGTGACTATCGACT |
| METΔ14 | Exon 13-15 fusion (MET13–15) |
TCGGCATGAACCG TTCTGAGATGAA |
ATCAGTTTCCTAATTCATCTGTGACATACTGACACCTCAATGCACAT GTTTGGCTCCTGACCAGTTAGCAAAAGAGAAAGCAAATTAAAG |
TexRd-XN-CCTCAATGCACATGTTTGGCTCC |
| EGFRwt | Exon 2-3 (EGFR2,3) |
AGGGCAATGAGGA CATAACCAGCCA |
ACCATCCAGGAGGTGGCTGGGTGACATACTGACAAAGTAGCCGT GACTATCGACTTGACCAGTTAGCAAAATGATCTTTCCTTCTTAAAG |
Cy5-AGTAGCCGTGACTATCGACT |
| EGFRvIII | Exon 1-8 fusion (EGFR1–8) |
CTCGGACGCACGAGCCGTGATCTGT |
GTAATTATGTGGTGACAGATGTGACATATGAAACCTCAATGCTGCTGC TGTACTAC TGACCAGTTAGCAGGCTCTGGAGGAAAAGAAAG |
TexRd-XN-CCTCAATGCTGCTGCTGTACTAC |
BNA primer Bridged Nucleic Acids are depicted in bold. Padlock probe target-specific sequences are depicted in italic. Detection probe complementary sequences in the padlock probe are coloured bold italic (wild-type) or italic underline (mutant).
Padlock probe rolling circle amplification
The protocol for padlock probe rolling circle amplification is summarized in Fig. 2a. For padlock assays on cell lines, cells were seeded on 8-well Lab-Tek II chamber slides (ThermoFisher Scientific, Waltham, MA, USA) and fixated the following day in 3.7% freshly prepared formaldehyde in DEPC-treated PBS (DEPC-PBS) for 30 min at room temperature. Fixated cells were washed twice with DEPC-PBS and dehydrated through an ethanol series (70%, 85% and 99.5%). Secure-seals (Grace Bio-Labs inc., Bend, Oregon, USA) with a volume of 50 µl (Ø 9 mm, 0.8 mm deep) were mounted on the Lab-Tek slides and cells were rehydrated by addition of DEPC-PBS-Tween (DEPC-PBS with 0.05% Tween-20). For tissue analyses, formalin-fixed paraffin-embedded (FFPE) sections of E98 xenografts (E98-FM, generated from the E98 cell line) and E468 xenografts were deparaffinized and fixated in 3.7% paraformaldehyde (PFA) in diethylpyrocarbonate (DEPC)-treated PBS. Tissue sections were permeabilized with pepsin (2 mg/ml in 0.1 M HCl) and dehydrated through an ethanol series (70%, 85% and 99.5%). Secure-seals (Grace Bio-Labs inc., Bend, Oregon, USA) with a volume of 250 µl (Ø 20 mm, 0.8 mm deep) were mounted and cells were rehydrated with DEPC-PBS-Tween. All following incubation steps were performed within the secure seal chambers, incubated in a hybridizer (Dakocytomation, Glostrup, Denmark).
In situ reverse transcription was performed using BNA primers positioned within ≤1 nt from the 5′ end of the padlock probe target site (see Table 2 for nucleotide sequences). BNA primer hybridization and mRNA reverse transcription were performed o/n at 42 °C using 200 nM of BNA primer (IDT, Leuven Belgium), 20 U/µl RevertAid H minus M-MuLV reverse transcriptase in 1x M-MuLV reaction buffer (ThermoFisher Scientific, Waltham, MA, USA), 1 U/µl RiboLock RNase Inhibitor (ThermoFisher Scientific, Waltham, MA, USA), 500 µM dNTP and 0.2 µg/µl BSA (New England Biolabs, Ipswich, MA, USA). Post-fixation was performed with 3.7% formaldehyde (5 min) or 3.7% PFA (45 min) for cells or tissues, respectively. FFPE tissues were subsequently treated with glycine (2 g/100 ml in DEPC-PBS, 20 min RT) to decrease autofluorescence. Secure seal chambers were flushed with DEPC-PBS-Tween. Padlock probes (100 nM) were hybridized to the cDNA and ligated using 0.5 U/µl Ampligase in 1x Ampligase buffer (Epicentre, Madison, Wisconsin, USA) containing 0.4 U/µl RNase H (New England Biolabs, Ipswich, MA, USA), 1 U/µl RiboLock RNase Inhibitor, 0.2 µg/µl BSA, 50 mM KCl and 20% formamide (30 min 37 °C, 30 min 45 °C).
Rolling circle amplification of the ligated padlock probe was performed o/n at 37 °C using Phi29 DNA polymerase (ThermoFisher Scientific, Waltham, MA, USA). Secure seal chambers were flushed with DEPC-PBS-Tween and Phi29 DNA polymerase was added at a concentration of 1 U/µl in 1x Phi29 DNA polymerase buffer (ThermoFisher Scientific, Waltham, MA, USA) with 1 U/µl RiboLock RNase Inhibitor, 250 µM dNTP, 0.2 µg/µl BSA and 5% glycerol. After washing with DEPC-PBS-Tween, rolling circle products (RCPs) were visualized by hybridization to 100 nM of corresponding fluorescent detection probe (See Table 2) (IDT, Leuven, Belgium) in 1x saline-sodium citrate (SSC) and 20% formamide (37 °C, 30 min). The slides were dehydrated through an ethanol series (70%, 85% and 99.5%) and mounted with Vectashield (Vector Laboratories Inc., Burlingame, CA, USA) containing 375 ng/ml DAPI for nuclear counterstaining.
Slides were imaged using the Vectra (Caliper Life Sciences, Waltham, MA, USA). Slide analysis was performed with the Vectra Automated Quantitative Pathology Imaging System (Version 3.0.3, PerkinElmer Inc., Waltham, MA, USA) and inForm Advanced Image Analysis Software (Version 2.2.1, PerkinElmer Inc., Waltham, MA, USA). Contrast-enhancement was applied on the resulting images using GIMP version 2.8.20.
Data availability
The datasets generated during and/or analysed during the current study are available from the corresponding author on reasonable request
Electronic supplementary material
Author Contributions
C.v.d.H., A.D. and T.d.B. performed the experiments. C.v.d.H. and W.L. wrote the main manuscript text. C.v.d.H. prepared the figures. F.S. performed padlock assay optimization experiments. All authors reviewed the manuscript. W.L. was responsible for overall project organisation.
Competing Interests
The authors declare no competing interests.
Footnotes
Electronic supplementary material
Supplementary information accompanies this paper at 10.1038/s41598-018-25328-5.
Publisher's note: Springer Nature remains neutral with regard to jurisdictional claims in published maps and institutional affiliations.
References
- 1.Scagliotti GV, Novello S, von Pawel J. The emerging role of MET/HGF inhibitors in oncology. Cancer treatment reviews. 2013;39:793–801. doi: 10.1016/j.ctrv.2013.02.001. [DOI] [PubMed] [Google Scholar]
- 2.Hiley C, de Bruin EC, McGranahan N, Swanton C. Deciphering intratumor heterogeneity and temporal acquisition of driver events to refine precision medicine. Genome biology. 2014;15:453. doi: 10.1186/s13059-014-0453-8. [DOI] [PMC free article] [PubMed] [Google Scholar]
- 3.McGranahan N, Swanton C. Biological and therapeutic impact of intratumor heterogeneity in cancer evolution. Cancer cell. 2015;27:15–26. doi: 10.1016/j.ccell.2014.12.001. [DOI] [PubMed] [Google Scholar]
- 4.Parker NR, et al. Intratumoral heterogeneity identified at the epigenetic, genetic and transcriptional level in glioblastoma. Scientific reports. 2016;6:22477. doi: 10.1038/srep22477. [DOI] [PMC free article] [PubMed] [Google Scholar]
- 5.Tang Z, et al. Dual MET-EGFR combinatorial inhibition against T790M-EGFR-mediated erlotinib-resistant lung cancer. Br J Cancer. 2008;99:911–922. doi: 10.1038/sj.bjc.6604559. [DOI] [PMC free article] [PubMed] [Google Scholar]
- 6.Morgillo F, Della Corte CM, Fasano M, Ciardiello F. Mechanisms of resistance to EGFR-targeted drugs: lung cancer. ESMO Open. 2016;1:e000060. doi: 10.1136/esmoopen-2016-000060. [DOI] [PMC free article] [PubMed] [Google Scholar]
- 7.Osimertinib Is Active in Patients with EGFRT790M-Positive NSCLC. Cancer Discov6, 1305, 10.1158/2159–8290.CD-RW2016-200 (2016).
- 8.Navis AC, et al. Identification of a novel MET mutation in high-grade glioma resulting in an auto-active intracellular protein. Acta neuropathologica. 2015;130:131–144. doi: 10.1007/s00401-015-1420-5. [DOI] [PMC free article] [PubMed] [Google Scholar]
- 9.Frampton GM, et al. Activation of MET via diverse exon 14 splicing alterations occurs in multiple tumor types and confers clinical sensitivity to MET inhibitors. Cancer Discov. 2015;5:850–859. doi: 10.1158/2159-8290.CD-15-0285. [DOI] [PubMed] [Google Scholar]
- 10.Paik PK, et al. Response to MET inhibitors in patients with stage IV lung adenocarcinomas harboring MET mutations causing exon 14 skipping. Cancer Discov. 2015;5:842–849. doi: 10.1158/2159-8290.CD-14-1467. [DOI] [PMC free article] [PubMed] [Google Scholar]
- 11.Cancer Genome Atlas Research, N. Comprehensive molecular profiling of lung adenocarcinoma. Nature. 2014;511:543–550. doi: 10.1038/nature13385. [DOI] [PMC free article] [PubMed] [Google Scholar]
- 12.Reungwetwattana T, Ou SH. MET exon 14 deletion (METex14): finally, a frequent-enough actionable oncogenic driver mutation in non-small cell lung cancer to lead MET inhibitors out of “40 years of wilderness” and into a clear path of regulatory approval. Translational lung cancer research. 2015;4:820–824. doi: 10.3978/j.issn.2218-6751.2015.12.03. [DOI] [PMC free article] [PubMed] [Google Scholar]
- 13.Bean J, et al. MET amplification occurs with or without T790M mutations in EGFR mutant lung tumors with acquired resistance to gefitinib or erlotinib. Proc Natl Acad Sci USA. 2007;104:20932–20937. doi: 10.1073/pnas.0710370104. [DOI] [PMC free article] [PubMed] [Google Scholar]
- 14.Cappuzzo F, et al. MET increased gene copy number and primary resistance to gefitinib therapy in non-small-cell lung cancer patients. Ann Oncol. 2009;20:298–304. doi: 10.1093/annonc/mdn635. [DOI] [PMC free article] [PubMed] [Google Scholar]
- 15.Engelman JA, et al. MET amplification leads to gefitinib resistance in lung cancer by activating ERBB3 signaling. Science. 2007;316:1039–1043. doi: 10.1126/science.1141478. [DOI] [PubMed] [Google Scholar]
- 16.Zucali PA, et al. Role of cMET expression in non-small-cell lung cancer patients treated with EGFR tyrosine kinase inhibitors. Annals of oncology: official journal of the European Society for Medical Oncology. 2008;19:1605–1612. doi: 10.1093/annonc/mdn240. [DOI] [PMC free article] [PubMed] [Google Scholar]
- 17.Eskilsson E, et al. EGFRvIII mutations can emerge as late and heterogenous events in glioblastoma development and promote angiogenesis through Src activation. Neuro Oncol. 2016;18:1644–1655. doi: 10.1093/neuonc/now113. [DOI] [PMC free article] [PubMed] [Google Scholar]
- 18.Gan HK, Cvrljevic AN, Johns TG. The epidermal growth factor receptor variant III (EGFRvIII): where wild things are altered. The FEBS journal. 2013;280:5350–5370. doi: 10.1111/febs.12393. [DOI] [PubMed] [Google Scholar]
- 19.Zadeh G, Bhat KP, Aldape K. EGFR and EGFRvIII in glioblastoma: partners in crime. Cancer cell. 2013;24:403–404. doi: 10.1016/j.ccr.2013.09.017. [DOI] [PubMed] [Google Scholar]
- 20.Arts P, et al. Quantification of differential gene expression by multiplexed targeted resequencing of cDNA. Nat Commun. 2017;8:15190. doi: 10.1038/ncomms15190. [DOI] [PMC free article] [PubMed] [Google Scholar]
- 21.de Bitter T, et al. Profiling of the metabolic transcriptome via single molecule molecular inversion probes. Sci Rep. 2017;7:11402. doi: 10.1038/s41598-017-11035-0. [DOI] [PMC free article] [PubMed] [Google Scholar]
- 22.Grundberg I, et al. In situ mutation detection and visualization of intratumor heterogeneity for cancer research and diagnostics. Oncotarget. 2013;4:2407–2418. doi: 10.18632/oncotarget.1527. [DOI] [PMC free article] [PubMed] [Google Scholar]
- 23.Kiflemariam S, et al. In situ sequencing identifies TMPRSS2-ERG fusion transcripts, somatic point mutations and gene expression levels in prostate cancers. The Journal of pathology. 2014;234:253–261. doi: 10.1002/path.4392. [DOI] [PubMed] [Google Scholar]
- 24.Larsson C, Grundberg I, Soderberg O, Nilsson M. In situ detection and genotyping of individual mRNA molecules. Nat Methods. 2010;7:395–U381. doi: 10.1038/nmeth.1448. [DOI] [PubMed] [Google Scholar]
- 25.Larsson C, et al. In situ genotyping individual DNA molecules by target-primed rolling-circle amplification of padlock probes. Nat Methods. 2004;1:227–232. doi: 10.1038/nmeth723. [DOI] [PubMed] [Google Scholar]
- 26.Weibrecht I, et al. In situ detection of individual mRNA molecules and protein complexes or post-translational modifications using padlock probes combined with the in situ proximity ligation assay. Nature protocols. 2013;8:355–372. doi: 10.1038/nprot.2013.006. [DOI] [PubMed] [Google Scholar]
- 27.van der Mijn JC, et al. Analysis of AKT and ERK1/2 protein kinases in extracellular vesicles isolated from blood of patients with cancer. J Extracell Vesicles. 2014;3:25657. doi: 10.3402/jev.v3.25657. [DOI] [PMC free article] [PubMed] [Google Scholar]
- 28.Claes A, et al. Phenotypic and genotypic characterization of orthotopic human glioma models and its relevance for the study of anti-glioma therapy. Brain pathology. 2008;18:423–433. doi: 10.1111/j.1750-3639.2008.00141.x. [DOI] [PMC free article] [PubMed] [Google Scholar]
- 29.Kong DS, et al. Prognostic significance of c-Met expression in glioblastomas. Cancer. 2009;115:140–148. doi: 10.1002/cncr.23972. [DOI] [PubMed] [Google Scholar]
- 30.Lynch TJ, et al. Activating mutations in the epidermal growth factor receptor underlying responsiveness of non-small-cell lung cancer to gefitinib. New Engl J Med. 2004;350:2129–2139. doi: 10.1056/NEJMoa040938. [DOI] [PubMed] [Google Scholar]
- 31.Paez JG, et al. EGFR mutations in lung cancer: Correlation with clinical response to gefitinib therapy. Science. 2004;304:1497–1500. doi: 10.1126/science.1099314. [DOI] [PubMed] [Google Scholar]
- 32.Oxnard GR. The cellular origins of drug resistance in cancer. Nature medicine. 2016;22:232–234. doi: 10.1038/nm.4058. [DOI] [PubMed] [Google Scholar]
- 33.Boyle EA, O’Roak BJ, Martin BK, Kumar A, Shendure J. MIPgen: optimized modeling and design of molecular inversion probes for targeted resequencing. Bioinformatics. 2014;30:2670–2672. doi: 10.1093/bioinformatics/btu353. [DOI] [PMC free article] [PubMed] [Google Scholar]
Associated Data
This section collects any data citations, data availability statements, or supplementary materials included in this article.
Supplementary Materials
Data Availability Statement
The datasets generated during and/or analysed during the current study are available from the corresponding author on reasonable request


