

SUMMARY
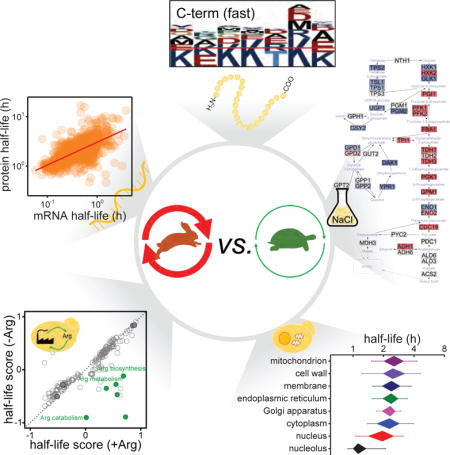
Protein turnover maintains the recycling needs of the proteome and its malfunction has been linked to aging and age-related diseases. However, not all proteins turnover equally and the factors that contribute to accelerate or slow down turnover are mostly unknown. We measured turnover rates for 3,160 proteins in exponentially growing yeast and analyzed their dependence on physical, functional, and genetic properties. We found that functional characteristics including protein localization, complex membership, and connectivity, have greater effect on turnover than sequence elements. We also found that protein turnover and mRNA turnover are correlated. Analysis under nutrient perturbation and osmotic stress revealed that protein turnover highly depends on cellular state, and is faster when proteins are being actively used. Finally, stress-induced changes in protein and transcript abundance correlated with changes in protein turnover. This study provides a resource of protein turnover rates and principles to understand the recycling needs of the proteome under basal conditions and perturbation.
eTOC blurb
Turnover measurements of the yeast proteome reveal co-regulation with mRNA stability and dependence on protein functional attributes, including protein active state.
INTRODUCTION
The balance between protein synthesis and degradation, also known as protein turnover, is vital for setting protein abundance and for maintaining proteostasis. Loss of proteostasis leads to the accumulation of damaged proteins and is a hallmark of aging (López-Otín et al., 2013). Neurodegenerative disorders like Parkinson’s and Alzheimer’s diseases, as well as other age-related diseases like cancer and diabetes have also been linked to dysfunctions in protein turnover (Balch et al., 2008). Characterizing protein turnover can help understanding the recycling needs of different proteins within a cell, and deciphering the molecular mechanisms involved in aging and age-related diseases.
Despite the importance of protein turnover, our knowledge of what drives protein turnover is still limited. Previous studies in yeast began to explore the dependence of turnover on protein characteristics such as abundance, size, and amino acid composition, with no general agreement (Belle et al., 2006; Christiano et al., 2014; Helbig et al., 2011; Martin-Perez and Villen, 2015; Pratt et al., 2002). Turnover studies in human and mammalian cells have interrogated additional properties and found that highly disordered proteins and proteins containing degron motifs have faster turnover (Boisvert et al., 2012; Cambridge et al., 2011; Doherty et al., 2009; Schwanhäusser et al., 2011). Several of these studies show that proteins sharing function or localization have similar turnover rates. However, there is not a single study where many factors are explored in a systematic way.
To fill this gap of knowledge, we applied metabolic labeling and mass spectrometry to compile a comprehensive dataset of protein half-lives in yeast and used this dataset to systematically interrogate the contribution of many different molecular attributes to protein turnover, from sequence elements to functional characteristics. This resource illuminates the dynamic behavior of proteins and highly complements mRNA and protein abundance measurements that reflect cellular state. In addition to the resource of protein turnover rates on basal steady-state conditions, we examined how turnover is regulated upon change in nutrient availability or environmental stress, as a first step towards understanding the mechanisms underlying protein turnover dynamics.
RESULTS
A comprehensive resource of protein half-lives in Saccharomyces cerevisiae
To obtain protein half-life values in S. cerevisiae, defined as the time to replace 50% of the protein, we conducted a pulsed SILAC experiment and measured the rate of incorporation of heavy lysine into proteins by mass spectrometry (Doherty et al., 2009; Schwanhäusser et al., 2009) (Figure 1A). A prototrophic yeast strain was cultured in duplicate and samples were collected during exponential growth phase at 6 time points between 1 and 6 hours after heavy media switch. Within this range, protein expression remained constant (Figure S1A, S1B), and few proteins (~1%) showed extreme (i.e. near 0 or 1) relative isotopic abundance (RIA) values (Figure 1A). We reproducibly measured half-lives for 3,160 proteins (Data S1, Figure S1C). Most half-lives were calculated by curve fitting of heavy label incorporation over time. However, when curve fitting was not possible because of insufficient number of high-quality quantifications (i.e. at least two quantified peptide ratios per protein), protein half-lives were estimated by single-point measurements using heavy and light peptide intensities, as described elsewhere (Pratt et al., 2002). Single-point half-life estimates showed good correlation and acceptable reproducibility when compared to half-lives calculated by curve fitting (Figure S1D, S1E). Importantly, single-point measurements enabled a larger dynamic range for our study, obtaining half-life values for 40% additional proteins, mostly in the low abundance range (Figure S1F). Protein half-lives ranged from a few minutes to over a hundred hours, spanning three orders of magnitude and being non-normally distributed (Kolmogorov–Smirnov test, p < 5.2E-34) as previously described in yeast (Christiano et al., 2014) and human cells (Doherty et al., 2009). The median half-life was 2.18 h, similar to our previous study (Martin-Perez and Villen, 2015). This value also matches the cellular doubling-time (2.0 ± 0.1 h), in agreement with previous turnover studies in human cells (Boisvert et al., 2012; Gawron et al., 2016), suggesting that generally protein replacement is driven by dilution due to cell division.
Figure 1. Global analysis of protein turnover in exponentially growing yeast.
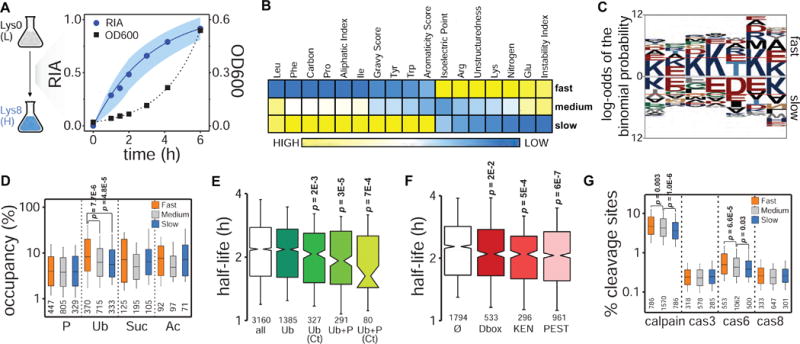
(A) Experimental design. Pulsed SILAC and dynamics of global protein labeling (RIA: relative isotopic abundance; dots: median values at each time point, shadow: standard deviations) and cell growth (OD600) for replicate 2. (B) Heatmap of Z-score transformed median values of physicochemical properties for proteins with fast, medium and slow turnover representing the lower (<25%), intermediate (25–75%), and upper (>75%) quartile ranges, respectively, of the protein half-life distribution. Only properties having significant Spearman’s correlations with protein turnover are shown (Bonferroni corrected p<0.01) (see also Figure S3). (C) Sequence analysis of the last 7 amino acids at the protein C-terminus (red lines indicate p<0.05 significance level, C-termini from all ORFs present in the SGD proteome were used as background) (see also Figure S4). (D) Comparison of PTMs occupancy (i.e. percentage of modifiable residues for which an actual modification has been reported) (P: phosphorylation; Ub: ubiquitylation; Suc: succinylation; Ac: acetylation). (E, F) Half-life distributions for proteins containing phosphorylation and ubiquitylation sites (modification information from (Christiano et al., 2014; Swaney et al., 2013)) (E) and specific degron motifs (F) compared to all proteome half-lives (Ø indicates no degrons). Median proteome half-life is represented by a grey dotted line in both plots (see also Figure S4). (G) Comparison of calpain and caspase cleavage sites density.
Protein expression levels in our study correlated strongly (Pearson’s r = 0.70 – 0.86) with previous reports (de Godoy et al., 2008; Helbig et al., 2011; Kulak et al., 2014; Wang et al., 2012) (Figure S2A); and although protein half-lives were significantly correlated with some previous turnover studies (Belle et al., 2006; Christiano et al., 2014; Helbig et al., 2011; Martin-Perez and Villen, 2015), the overall agreement with, and among other turnover studies was poor (Figure S2B), similar to what had already been described for mRNA turnover studies (Geisberg et al., 2014). Despite the differences in individual turnover rates, there were conserved trends. For instance, several individual proteins known to be short (e.g. anti-oxidant proteins Spe1, Nce3) and long-lived (e.g. histones) showed the expected turnover behavior across studies. In addition, a subset of proteins that have been reported as long-lived proteins in yeast (Thayer et al., 2014) also showed longer half-lives in our study (Figure S2C).
Comparisons with other yeast turnover studies
We found that the disagreement between half-lives was mostly due to the approach used. The most discordant dataset was Belle et al., which used cycloheximide arrest and western blot, whereas the other studies used pulse labeling and mass spectrometry, yet not exactly in the same way. To test whether protocol differences may affect turnover measurements we conducted an experiment in duplicate comparing side-by-side our protocol, where unlabeled cells were directly diluted into heavy media, and the protocol used by Christiano et al., where pre-labeled cells were washed three times by centrifugation at 4°C before switching to light media (Data S2). Protein abundances were very similar when comparing both protocols, whereas protein half-lives were less correlated (Figure S2D). We used two-dimensional (2D) enrichment analysis of GO terms (Cox and Mann, 2012) to assess differences in protein turnover at the pathway level. This statistical method integrates high-throughput omics datasets to detect those terms whose members show consistent values (e.g. high or low) in one or both compared datasets. Main differences in protein turnover were found in ribosomal, mitochondrial and stress responsive proteins (Figure S2E). Using our protocol, we observed faster turnover of ribosomal proteins and slower of mitochondrial ones, which agrees with previous reports in flies and mammals (Lam et al., 2007; Price et al., 2010; Vincow et al., 2013). These differences could be attributed to the various washing steps reducing growth and activating a stress response, as has been previously suggested (Schade et al., 2004; Soto et al., 2007).
When comparing the results from this experiment to the results from our main experiment using the same protocol, we obtained good correlation (Figure S2F). However, the correlation between the half-lives measured using the alternative protocol on a yeast prototroph with the results from the original publication on an auxotrophic strain (Christiano et al., 2014) was mediocre (Figure S2G), possibly due to differences in protein metabolism between yeast strains (Alam et al., 2016). Thus, other factors contributing to the discrepancies between turnover studies may be differences in the genetic background and growth conditions.
Finally, in addition to the poor correlation there were differences in absolute half-life values between studies, which resulted from using different half-life definitions and calculation methods. This fact, however, did not alter the observed correlations (Figure S2H, see STAR Methods).
Effects of sequence properties on protein turnover
To systematically examine the effects of protein sequence attributes on turnover, we first classified proteins into three groups according to the distribution of protein half-lives (unstable: lower quartile, <25%; intermediate: interquartile range, 25–75%; stable: upper quartile, >75%), and then conducted sequence, correlation, and comparative statistical analyses. Among the 36 physicochemical properties studied by correlation analysis, we found significant dependence of protein turnover on structuredness, hydrophobicity (aliphatic index, GRAVY, and aromaticity scores), isoelectric point, and C:N content (Figure 1B, Figure S3), although some protein groups (e.g. HSPs and histones) deviated from the general trends (Figure S3C). We obtained comparable results when conducting the same analysis using data from a previous study (Christiano et al., 2014) (Figure S3).
The presence of certain amino acids in the N-terminus of a protein can be destabilizing and has been proposed as a predictor of the protein’s half-life (Bachmair et al., 1986; Gawron et al., 2016). Protein N-termini sequence analysis revealed a significant enrichment of alanine and serine residues in the position immediately adjacent to the initiator methionine on short-lived proteins (Figure S4A). Their small size typically promotes methionine cleavage and subsequent N-terminal acetylation, which may be recognized by the N-end rule pathway, acting therefore as degradation signals (Bachmair et al., 1986; Gibbs et al., 2014). This would explain the faster turnover observed for proteins with experimentally detected acetylation at their N-termini (Mommen et al., 2012) (Figure S4B). Short-lived proteins also showed a significant enrichment of lysine residues on their C-terminal sequences (Figure 1C, Figure S4A). Notably, many post-translational modifications (PTMs) target this amino acid, bestowing regulatory properties that could be related to degradation. In fact, the presence of multiple lysine residues in the C-terminus of mammalian proteins has been proposed as a mechanism to control protein levels under normal conditions via ubiquitylation and proteasomal degradation (Rodriguez et al., 2000). The analysis of PTMs along yeast protein sequences confirmed a bias of ubiquitylation and phosphorylation sites around the C-terminus (Figure S4C).
To assess the effect of PTMs on protein turnover we calculated PTM occupancies for each protein and looked for differences among the three protein turnover groups. We define PTM occupancy as the percentage of modifiable residues for which an actual modification has been reported (e.g. for phosphorylation: percentage of phosphosites over total number of Ser, Thr, and Tyr). We observed that proteins with fast turnover had higher occupancy of ubiquitylation sites, and no significant differences were detected for other PTMs (Figure 1D). Next, we asked whether combinations of different PTMs may regulate protein turnover, as we proposed (Swaney et al., 2013). By integrating data from our previous study with protein half-lives measured here, we found that co-occurrence of phosphorylation and ubiquitylation events within the same molecule accelerates the turnover of the protein to greater extent than the ubiquitin modification alone, especially when these events occur at the protein’s C-terminus (Figure 1E). This result underscores the importance of C-terminal sequences in degradative signaling.
Several short linear sequence motifs can also facilitate protein degradation. These degron motifs include D-box, KEN-box, and PEST sequences. Protein turnover analysis revealed that proteins containing at least one degron motif were significantly less stable than average (Figure S4D), as previously observed in mammalian cells (Boisvert et al., 2012; Cambridge et al., 2011), suggesting that their function is conserved across eukaryotes. The occurrence of multiple degrons within the same protein, however, did not increase its turnover any further, ruling out additive or synergistic effects. When analyzed individually, PEST motifs showed the greatest effect on protein turnover (Figure 1F). PEST sequences have also been related to alternative degradation pathways like calpain proteases (Shumway et al., 1999), a family of Ca2+-dependent cysteine proteases conserved across eukaryotes. This led us to interrogate the influence of protease cleavage sites on protein turnover. We observed significantly higher frequency of calpain cleavage sites in the sequence of short-lived proteins (Figure 1G). Caspase 3, 6 and 8-like activities have also been reported on yeast (Wilkinson and Ramsdale, 2011). In our data, we observed increase of Cas6 cleavage sites in short-lived proteins. Together, these results suggest that sequence properties associated with both proteasomal and proteolytic degradation contribute to protein turnover.
Effects of protein abundance and functional characteristics on protein turnover
We did not find a correlation between protein abundance and turnover (Figure S4E). To examine the influence of protein function on the half-life of proteins, we mapped all the proteins with measured half-lives to GO annotations representing major biological processes, molecular functions, and cellular components; and compared the half-live distributions between the different groups (Figure 2A, S5A, S5B). We found that protein turnover is heavily organized according to cellular compartmentalization, cellular processes, and molecular functions. For example, nuclear and ribosomal proteins had faster turnover than structural, membrane and organelle-specific ones (e.g. mitochondrion). Also, proteins related with energy production pathways, and with proteasome or other mechanisms of protein degradation (e.g. autophagy), contributed significantly to the fraction of long-lived proteins. Comparison with previous turnover studies in yeast (Christiano et al., 2014) using 2D enrichment analysis showed similar behavior for many protein groups (Figure S5C), as observed before when comparing experimental protocols.
Figure 2. Analysis of cellular localization, complex membership and protein activity on protein turnover.
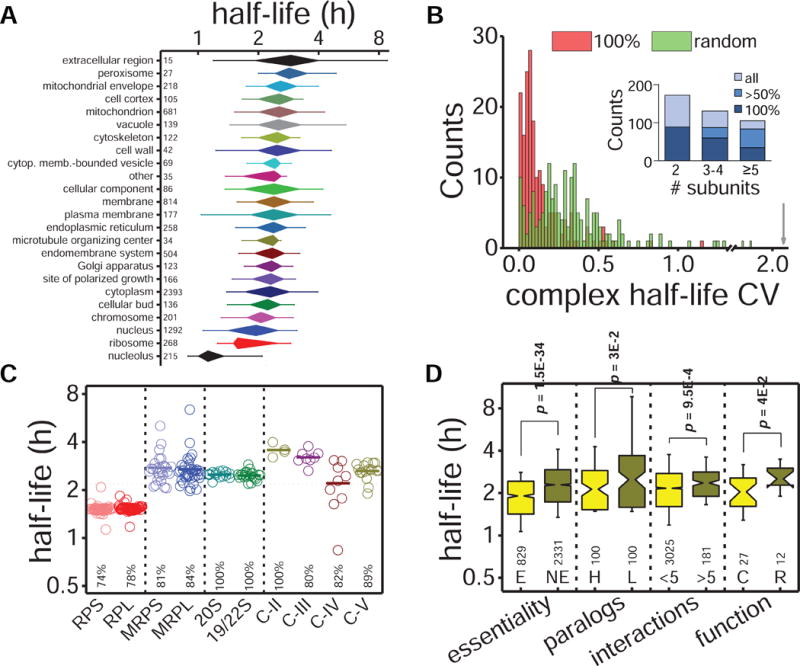
(A) Distribution of protein half-lives within the different GO cellular component slim terms (see also Figure S5). (B) CVs distribution of half-lives in complete protein complexes (i.e. half-life measurements for all members, n = 183 complexes) and in a simulated distribution using random half-lives from the entire proteome. The grey arrow indicates the half-live CV for the whole proteome. Inner graph shows the distribution of protein complexes according to the number of members and the completion percentage of half-life measurements within each complex. (C) Half-life distribution for protein complex members: cytoplasmic (RPS and RPL) and mitochondrial (MRPS and MRPL) ribosome subunits, proteasome subunits (20S and 19/22S), and respiratory chain complexes (C-II, C-III, C-IV and C-V). Bold lines indicate average values, and coverage for each complex is indicated at the bottom. (D) Protein turnover analysis comparing traits related to essentiality (essential (E) vs. nonessential (NE) proteins), duplicity (high (H) vs. low (L) expressed paralog genes, considering >5-fold difference in protein abundance), connectivity (≤5 vs. >5 protein interactions), and protein function (catalytic (C) vs. regulatory (R) subunits). Median half-life of the proteome is represented by a grey dotted line.
Next, we investigated if different subunits within the same protein complex also exhibited similar turnover. To do this, we mapped proteins from our dataset to protein complexes from a curated database in yeast (Pu et al., 2009). For more robust statistical analysis, we restricted our analysis to complexes for which we had calculated half-lives for at least 50% of its members (259 out of 408 complexes) (Figure 2B, Data S3). Most complexes, such as the ribosome, the proteasome, and most complexes of electron transport chain, showed very homogenous turnover (median CV = 10.4% in the half-lives of their members), suggesting that the synthesis and degradation of the different subunits are highly coordinated (Figure 2B, 2C). This homogeneity is higher than expected by random chance (Mann-Whitney test, p = 5.2E-21). In other macromolecular complexes, such as the mitochondrial ribosome and the mitochondrial respiratory complex IV, the turnover of the different subunits diverged substantially. This variance may arise from the non-concatenated complex assembly process due to the presence of mitochondrial and nuclear encoded proteins, or to the different location of the various subunits as described for mammalian complex IV (Kim et al., 2012). According to complex membership, we identified some outlier half-lives: ribosomal Rps9a, Rpl15b and Mrpl4; proteasomal Pre9; and respiratory chain Atp19 and Cox5a. Most of these subunits are dispensable for the complex functionality, suggesting either a different function or a transitory membership.
To rule out any effect of the protein complex and GO terms interdependence in the analysis of protein turnover, we compared the half-lives of the proteins belonging to two representative complexes (the ribosome and the proteasome) with a randomly generated set of proteins selected from their related GO biological process term (‘cytoplasmic translation’ for the ribosome and ‘proteolysis involved in cellular protein catabolic process’ for the proteasome) (Figure S5D). In both cases the variability in the original complexes is much lower than in the randomly generated sets, which corroborates a tight coordinated turnover of the different complex subunits. To address the reciprocal question (i.e. whether the results with GO terms could be explained by co-complex membership) we compared the distribution of half-lives within GO terms when protein complex members were included or not (Figure S5E, S5F). The distribution of GO terms was not significantly changed, ruling out any dependence of co-complex membership on the correlation of protein turnover rates with their function or subcellular localization.
Next, we reasoned that essential proteins might impose strict fidelity requirements and lower threshold to damage, and hence be more frequently renewed than non-essential. To test this hypothesis, we classified proteins as essential or non-essential and looked for differences between the distributions of half-lives of the two groups. Indeed, essential proteins had significantly shorter half-lives (Figure 2D). We also compared pairs of paralogs that resulted from the whole-genome duplication event and found an inverse correlation between paralogs’ abundance and half-life (Figure 2D). Diverging expression patterns of redundant paralogs may indicate differences in their active state (Prince and Pickett, 2002) and thus in their turnover. We then asked whether protein connectivity (i.e. number of protein interaction partners) influenced protein turnover, reasoning that a bound state may protect proteins from rapid degradation (Cambridge et al., 2011). We used binary interaction maps from yeast two-hybrid analysis (Yu et al., 2008) to classify proteins according to their number of protein interactors, and observed that highly connected proteins (i.e. protein hubs) tended to have longer half-lives (Figure 2D). This is consistent with our previous results on essentiality, given that protein connectivity is not related to essentiality but to pleiotropy (Yu et al., 2008).
Finally, analysis of protein function within protein complexes revealed that catalytic subunits turnover faster than their regulatory counterparts (Figure 2D), suggesting that their direct involvement in enzymatic reactions may cause faster attrition and thus require faster replacement (Gracy et al., 1998). To experimentally test that proteins have faster turnover when are actively used, we conducted two experiments in which we tuned protein activity in a pathway-specific manner and measured changes in turnover rates. We used 2D enrichment analysis of GO terms to assess protein turnover at the pathway level. In the first experiment, we altered the activity of proteins involved in arginine biosynthesis by growing cells in the presence or absence of this amino acid. In absence of arginine, cells require the activation of enzymes in the arginine biosynthetic pathway to synthesize it metabolically. Cells grew similarly in both conditions (doublings at 1.85 ± 0.07 h and 1.89 ± 0.03 h for arginine rich and depleted media respectively) and protein half-lives were mostly unaffected, except for proteins related to arginine biosynthesis which, as we expected, had significantly faster turnover in the absence of the amino acid (Figure 3A, Data S4). In the second experiment, we changed the main source of carbon in the growth media. Cells were initially grown in raffinose, a trisaccharide composed of galactose, glucose, and fructose, as their only carbon source. Cells were then split into two cultures; one was grown in the raffinose media, and the other in galactose media. Growth rate was similar in both media (doubling at 2.83 ± 0.10 h for raffinose and 3.02 ± 0.20 h for galactose), but protein turnover rates were very different, indicative of a dramatic metabolic rewiring after changing the energy-yielding carbon source (Figure 3B, Data S5). Cells growing in galactose slowed down the turnover of proteins required to metabolize raffinose, such as those related with glucose uptake (i.e. hexokinases and glucokinases) and extracellular polysaccharide cleavage (i.e. glucosidase activity). Contrarily, proteins involved in galactose metabolism had faster turnover. These results support a correlation between protein use and turnover. Taken together, our results indicate that several layers of functional organization contribute to protein turnover, including protein’s subcellular localization, functional characteristics, interactions with other proteins, and protein activity.
Figure 3. Effects of active protein usage on turnover.
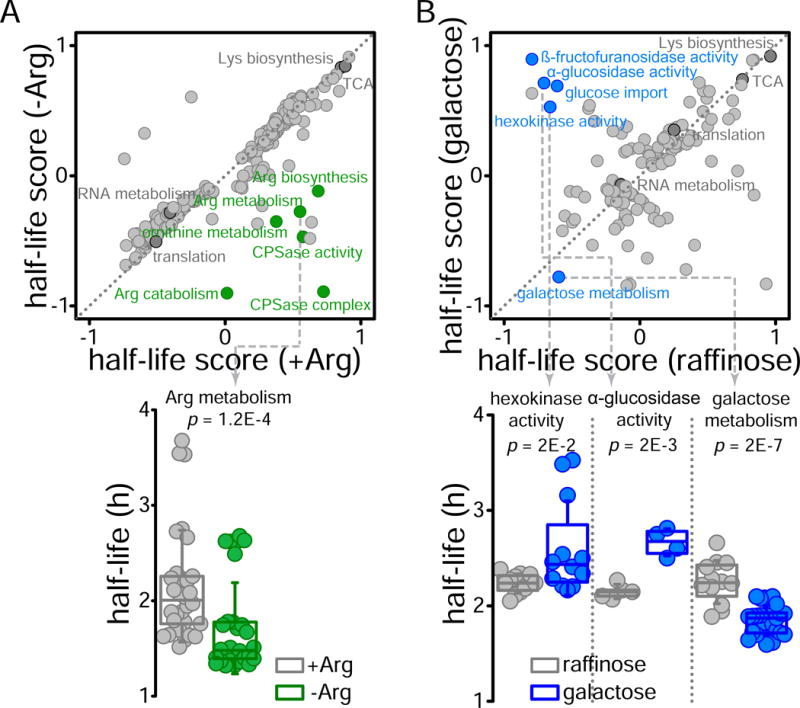
(Top) 2D annotation enrichment analysis (p<0.01) of GO terms comparing protein half-life values between cells growing in arginine rich or deficient media (A) and in raffinose or galactose as the only carbon source (B). Identity function is represented by a diagonal grey dotted line. (Bottom) Boxplots comparing the protein half-lives of members from selected GO terms showing significant differences.
Effects of mRNA on protein turnover
There is an ongoing debate as to whether protein expression is transcriptionally determined, or it is translationally controlled. Recent studies have shown that protein abundance correlates well with mRNA abundance (Csárdi et al., 2015; Lu et al., 2007). Can protein turnover be similarly correlated to mRNA turnover? To address this question, we correlated protein abundances and half-lives from our study with published mRNA expression (Miura et al., 2008) and half-life data (Geisberg et al., 2014). We observed a significant correlation between protein and mRNA half-lives (Pearson’s r = 0.65) mirroring that between mRNA and protein levels (Pearson’s r = 0.67) (Figure 4A, 4B). We also observed that protein levels spanned a much broader range than transcript levels (Csárdi et al., 2015), but protein and mRNA half-lives spanned in similar ranges. Further investigation would be required to assess whether this latter result may be due to technical limitations regarding dynamic range when measuring half-lives, or to the contribution of the dilution rate.
Figure 4. Comparison of transcriptome and proteome abundance and turnover in exponentially growing yeast.
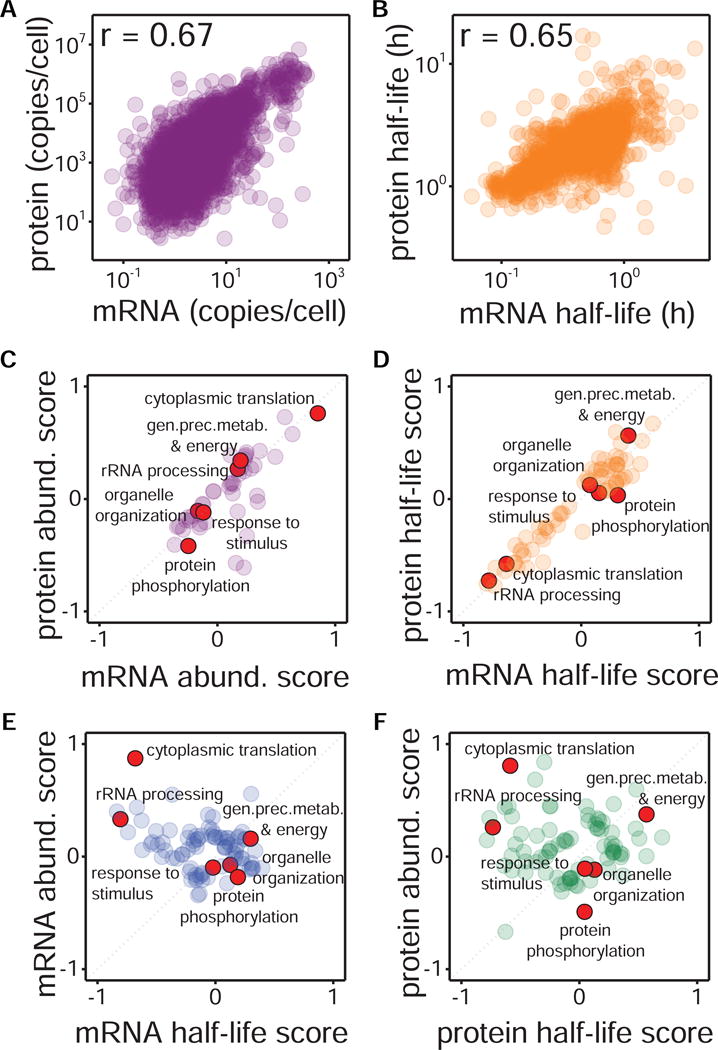
(A) Logarithmic scale correlation between mRNA (from (Bachmair et al., 1986; Gawron et al., 2016; Miura et al., 2008)) and protein abundances (n = 2720). (B) Logarithmic scale correlation between mRNA turnover (from (Bachmair et al., 1986; Geisberg et al., 2014; Gibbs et al., 2014)) and protein turnover (n = 2143; curve-fitting estimates are used). (C, D) 2D annotation enrichment analysis (FDR<0.01) of GO biological process (GOBP) terms comparing yeast transcriptome and proteome values for expression (C) and turnover (D). (E, F) 2D annotation enrichment analysis (FDR<0.01) of GOBP terms comparing turnover and expression values for mRNA (E) and protein (F). Red dots exemplify representative GOBP terms, while identity function is represented by a diagonal grey dotted line.
To investigate whether the correlation between mRNA and protein turnover (and abundances) occurs only on specific biological processes, we performed 2D enrichment analysis of GO terms. This analysis indicated that mRNA and protein turnover (and abundances) were consistently regulated across the different processes since most biological process terms are placed right on the diagonal (Figures 4C, 4D). In contrast, when considering mRNA and protein separately, their abundances and turnover were clearly uncoupled (Figures 4E, 4F). Notably GO terms related to protein translation (e.g. cytoplasmic translation and rRNA processing) were inversely correlated. Collectively, our results suggest that the turnover of proteins and mRNAs are co-regulated in exponentially growing yeast but are independent of their respective abundances.
Predictive models of protein turnover
Our analyses suggest that multiple factors, including physicochemical and functional properties, contribute to different extent to protein turnover; and that mRNA turnover seems the best predictor of protein turnover rates. To further improve the predictability of protein turnover we considered combinations of different properties through multiple linear regression analysis (Figure S6). We generated several predictive models using combinations that: i) included only physicochemical properties, ii) also added functional properties (e.g. protease cleavage sites, post-translational modifications, etc.) and/or iii) added mRNA turnover. We observed that the predictability of protein half-lives (defined as the correlation between predicted and measured half-lives) improved when including (all “quantifiable”) biological variables to the model (Pearson’s r = 0.54) compared to only physicochemical properties (r = 0.39 with all, r = 0.18 with only the best (% of carbon)); and the correlation was the highest (r = 0.72) when including mRNA turnover into the models (Figure S6). The predictive models of protein turnover using half-lives from previous studies showed no improvement when adding biological information (Figure S6).
To further evaluate the performance of the single and multiple variable models we used Receiver Operating Characteristic (ROC) curves, which represent the true positive rate against the false positive rate of a binary classifier system. To construct the curves, we selected the 25% proteins with fastest turnover (shortest half-lives) from our dataset and tested the ability of the different models to correctly classify these proteins into this quartile. All the models tested yielded some signal (AUC > 0.5), and models including all physicochemical properties could correctly classify a significant number of proteins (AUC = 0.71) (Figure 5). We also observed that under basal conditions mRNA turnover is better determinant of protein turnover than all protein physicochemical properties combined (AUC ≥ 0.8 vs. AUC 0.71). To restate the strong association between mRNA and protein turnover, we included analysis with mRNA turnover data from two independent studies (Geisberg et al., 2014; Presnyak et al., 2015). In both cases the correlations were high and the ROC AUC at 0.8–0.84 illustrate the excellent predictability of protein turnover using mRNA turnover data. However, in the absence of mRNA turnover data, physicochemical and biological properties combined are almost as good of a predictor of protein half-lives. Comparable results were obtained when constructing ROC curves for the 25% proteins with longest half-lives (Figure 5).
Figure 5. Receiver operating characteristic (ROC) curves illustrating the performance of different protein turnover predictor models.
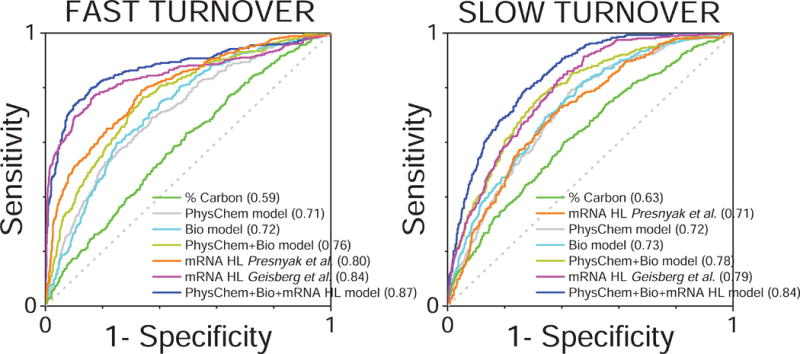
Plot of the true positive rate (sensitivity) against the false positive rate (1-specificity) for the different predictive MLR-derived models classifying proteins with fast (25% quartile with the shortest half-lives, left panel) and slow (25% quartile with the longest half-lives, right panel) turnover (see also Figure S6). ROC curves for protein carbon percentage (the physicochemical parameter showing the highest correlation with protein turnover), and mRNA half-life (from (Geisberg et al., 2014; Mommen et al., 2012; Presnyak et al., 2015)) as single predictors of protein turnover are also shown. The area under the curve (AUC) for each ROC curve, indicative of the discrimination capacity of each model, is shown in parenthesis within the series labeling legend. The diagonal dotted line indicates no-discrimination.
Dynamic regulation of protein turnover upon osmotic stress
All protein turnover results described so far refer to unperturbed steady-state conditions. To test how environmental changes affect protein turnover in yeast we exposed cells to high osmolarity (500 mM NaCl) for three hours and measured global changes in protein half-lives (Figure 6A, Data S6). We observed an overall decrease in protein turnover, probably driven by a slowdown in cellular growth (Figure 6B). Regardless of cell growth differences, osmotic stress altered the turnover rate of a significant portion of the proteome while maintaining similar distribution of protein half-lives (Figure 6C). To understand the nature of this remodeling we compared stress-induced changes in protein half-life with reported changes at the protein and mRNA levels (Lee et al., 2011; Martin-Perez and Villen, 2015). Overall changes in protein half-life showed a much narrower distribution than mRNA and protein abundance changes, suggesting that turnover changes amplified to protein output (Figure 6D). As expected, changes in protein half-lives were inversely correlated with changes in mRNA and protein abundances (i.e. increases in mRNA and protein levels correlated with shortened protein half-lives) (Figure 6E). Proteins with increased turnover rates upon the salt stress were enriched in osmotic stress response pathways (e.g. trehalose metabolism), while those with decreased turnover were mostly related to protein synthesis processes (Figure 6E). Similarly, turnover changes in protein complexes were consistent with mRNA and protein abundance changes, and with the concept that increased activity leads to shorter half-lives (Figure 6F). For example, we observed an increase in turnover of mitochondrial complex V relative to the ribosome that is concomitant to increased activity of the energy production machinery to face the osmotic challenge, and a slowdown of the protein synthesis machinery. In contrast, increased turnover rates were also observed in cases where mRNA decreases and protein increases (bottom of heatmap, Figure 6E). This group of proteins was enriched in amino acid synthesis and chromatin organization processes.
Figure 6. Protein turnover changes during osmotic stress.
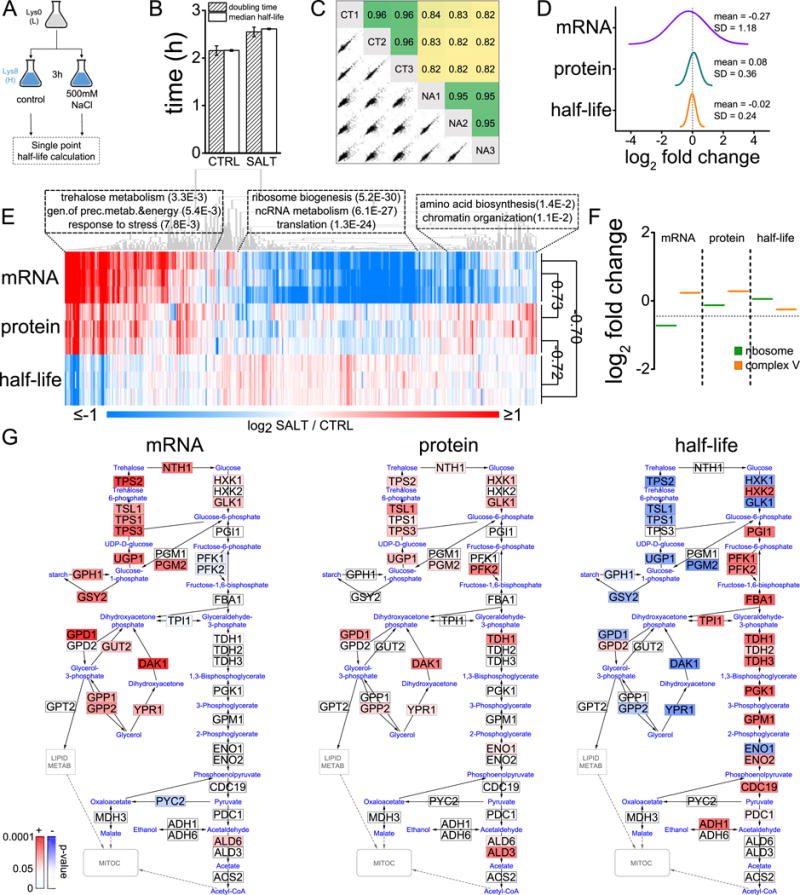
(A) Experimental design. (B) Comparison of growth rate and median half-life in control (CT) and salt treatment (NA). Bars represent mean ± SD of three replicates. (C) Multi-scatter plots in log scale and Pearson’s correlations of relative half-life measurements (normalized by median value). (D) Distribution of median log2 changes in mRNA, protein and half-life (mRNA and protein values correspond to 0.5 and 4 hours after salt treatment respectively, times at which most changes occur, and were obtained from (Lee et al., 2011; Rodriguez et al., 2000)). (E) Heatmap of log2 changes in mRNA, protein and half-life. Only those genes with at least 2 (out of 3) replicate values for each variable are shown (n = 1150). Pearson’s correlations between median values are indicated on the right. Representative enriched processes of selected clusters are shown with corresponding FDR q-value. (F) Examples of changes in protein complexes (circles represent individual proteins and bold lines indicates average complex values). (G) mRNA, protein and half-life changes in yeast cytoplasmic carbon metabolism pathways. Enzymes from these pathways identified in our study are colored according to the significance of the observed change.
To characterize in detail the dynamic response to osmotic stress, we mapped changes in mRNA, protein and half-life to the central carbohydrate metabolism in yeast (Figure 6G). Alterations to protein and mRNA focused on the increased abundance of enzymes involved in glycerol and trehalose metabolism while enzymes in the glycolytic/gluconeogenic pathway remained practically unaltered. In contrast, changes in protein half-life clearly reflect a ‘two-speed’ system. While the turnover of enzymes involved in stress-activated ATP-consuming cycles was accelerated, the turnover of the main glycolytic enzymes decayed. This dual dynamic behavior would reflect the level of activity supported by the distinct parts of the system in response to osmotic insult. Some paralog genes (e.g. HXK1/HXK2, PGM1/PGM2, ENO1/ENO2, GPD1/GPD2) change their turnover rate in opposite directions likely due to their functional separation and different activity under stress conditions. In contrast, PFK1/PFK2 the two subunits of hetero-octameric phosphofructokinase showed an identical behavior.
DISCUSSION
We compiled a comprehensive dataset of protein turnover rates in S. cerevisiae and investigated diverse molecular attributes that can contribute to protein turnover. We show that the bulk replacement rate of the proteome is dominated by cell division and growth, as evidenced by the similarity between the proteome median half-life and the cell doubling time. However, not all proteins turnover at equal rates, and factors such as protein sequence, structure, physiological function, subcellular localization, activity level, and mRNA stability, contribute to protein turnover to different extent.
Our results suggest that short-lived proteins contain specific sequence elements that may serve as degradation signals, but the individual contributions of each of these elements to protein turnover are generally small. These elements include degron motifs and an increased content of lysine residues, which may be targeted by ubiquitin modification. Both of these elements are more prominent at the protein C-terminus, suggesting that this typically disordered region is targeted by degradation pathways. We also found that unstructured proteins tend to have faster turnover rates, likely by their exposure to proteases and degradative post-translational modifications. Other conserved degradation mechanisms such as the N-end rule pathway and protease systems seem to contribute to protein turnover as well. For example, we found an enrichment of cleavage sites for calpain and other protease activities in short-lived proteins, suggesting that these mechanisms can be as relevant as the proteasome in maintaining proper recycling of certain proteins.
More than being influenced by protein attributes that are genetically encoded, we found that protein turnover is strongly determined by properties directly related to protein function, such as protein-protein interactions and protein activity; suggesting that protein turnover may drive system adaptability. For instance, we found faster turnover of catalytic subunits compared to regulatory ones, proteins from ‘used’ paralog genes compared to ‘unused’, and essential proteins compared to non-essential. As an additional support to these findings, we have experimentally demonstrated that an increase of protein usage results in faster turnover. For example, we showed that the turnover of proteins in the arginine biosynthetic pathway increases when cells are grown in the absence of arginine and thus forced to produce the amino acid endogenously. This same trend is also present at higher levels of biological organization. On complex multicellular organisms, tissue-specific proteomes show very different turnover rates (Hammond et al., 2016; Hsieh et al., 2012), and in general those tissues considered to be most active show faster turnover. For example, liver has high metabolic rate and global faster protein turnover than tissues with lower metabolic rate like muscle. This same trend is also observed when comparing the turnover rates of a given protein on different tissues (Hsieh et al., 2012). While an association between protein activity and turnover had not been suggested on previous proteomic studies, protein-centric studies had linked protein activity to faster attrition and turnover rates in diverse enzyme families. These studies suggest a mechanism in which catalysis and ligand binding cause conformational changes that promote protein modifications (deamidation, oxidation and/or ubiquitination) that destabilize the protein (Goldberg and Boches, 1982; Gracy et al., 1998; Harris et al., 1999).
Protein levels are mostly modulated by transcript levels and translation rates (Csárdi et al., 2015; Lu et al., 2007; Thayer et al., 2014). However, we were surprised to find a correlation between protein turnover and mRNA turnover, given that earlier studies in mouse fibroblasts found these were independently regulated (Schwanhäusser et al., 2011). Indeed, we found mRNA stability to be the best individual predictor of protein half-lives of all the parameters examined here. This intriguing result poses some questions. First, is the correlation condition-dependent? Our central experiment was conducted under nutrient-rich lab growth conditions where protein levels are in steady state and protein recycling is not limited or driven by metabolic or bioenergetic constraints. But growth under nutrient-limited conditions, acute stimuli or stress, such as those experienced in the wild, may result in different protein dynamics, which might be mostly uncoupled of mRNA, as has been observed for global transcript and protein abundances (Cheng et al., 2016; Lee et al., 2011). Second, is the correlation between mRNA and protein turnover exclusive to yeast with additional regulation masking this synchrony in higher eukaryotes? Mammals are inherently more complex. Notably, their nuclear genome contains multiple introns on each protein-coding gene, yielding a higher number of protein isoforms. Their non-coding RNA regions (UTRs) are also longer and contain more regulatory elements, permitting further fine-tuning (Baek et al., 2008). Additional regulation at the protein level could be explained by an increased complexity of regulatory signaling networks, and therefore higher number of PTMs and degron motifs. Third, what is the molecular mechanism that maintains mRNA and protein stabilities in synchrony? Is there a feedback mechanism between protein degradation and mRNA turnover? We postulate that the coupling of both processes may serve as an energetically saving mechanism in exponentially growing cells. In this sense, a co-evolution of turnover mechanisms in both molecules may happen, for instance transcripts with short half-lives would have evolved to contain shorter UTR regions, as recently suggested (Mishima and Tomari, 2016); whereas short lived proteins would have increased the content of degrons and/or ubiquitination sites. Supporting this idea, we found a positive correlation between protein turnover and median UTR length (Figure S4F). Deciphering the origins and circumstances of this co-regulation requires conducting new experiments addressing these fundamental questions.
We also measured protein turnover rates under osmotic stress and revealed that protein turnover adaptations upon this insult are driven by transcriptional changes in stress-induced pathways (e.g. trehalose and glycerol metabolism). However, pathways related with basal cellular functions (e.g. glycolysis) diminishing in activity (in our case by competition for intermediate metabolites) were primarily regulated at the protein turnover level without significant changes in protein and mRNA abundance. A change in protein turnover could then be attributed to activity status, which is supported by the selective turnover increase of known stress activated paralogs (e.g. HXK1 and ENO1) (Eden et al., 2011; Petti et al., 2011). Similar regulatory profile has been recently described for dendritic cells following lipopolysaccharide stimulation where the activation of immune response is dominated by transcriptional changes but regulation of core functions is mostly happening through changes to protein synthesis and degradation rates (Jovanovic et al., 2015). Additional studies are needed to understand the extent of these dynamic changes and whether they become permanent after cells face the stress, as recently suggested (Cheng et al., 2016).
The dependence of protein turnover on protein activity, and the turnover dynamics observed in the nutrient and stress perturbation experiments suggests that protein turnover is very dependent on cellular state, and that variations in growth conditions can significantly alter turnover. It seems alarming that none of the previous protein turnover studies in yeast correlate well with each other. In particular we found ribosomal and mitochondrial proteins to be the most different. But this result should be taken with a grain of salt, since the studies were conducted differently, with multiple variables that could alter cellular state. Also, a close comparison between studies showed similar trends for some of the properties analyzed. The way half-lives were defined and calculated, whether as the time to replace or to degrade 50% of the protein, affects the absolute half-live values, but not their relative ranking. In our study we tried to be cautious about interfering with metabolism and cell growth by using a prototrophic S. cerevisiae strain and keeping the culture at constant temperature throughout the experiment. Our recommendation for future studies is not as much on the strain or protocol to use, as on consistency, keeping in mind that protein turnover is sensitive to perturbations. This sensitivity can be leveraged in future comparative studies where turnover can be used as a functional marker associated to cellular state.
Protein turnover still remains largely unexplored. Studies such as the one presented here provide basic principles for better understanding protein turnover but additional conditional studies are needed to increase the knowledge about its complex regulation and to assess its importance in cellular function. Protein turnover measurements can provide significant information about the cellular state and protein function, being complementary to other molecular readouts and likely more sensitive to physiological adaptations than just protein levels.
STAR METHODS
Contact for reagent and resource sharing
Further information and requests for resources and reagents should be directed to and will be fulfilled by the Lead Contact, Judit Villén (jvillen@u.washington.com).
Experimental model and subject details
Yeast strains
The wild-type Saccharomyces cerevisiae diploid strain DBY10144 (MATa/α) from the FY (S288C) background (parental strains FY4H and FY3G) and prototroph for lysine, was used in all experiments and was kindly provided by the Dunham Lab from the Department of Genome Sciences at the University of Washington. Yeast strains were stored at −80°C in glycerol stocks.
Method details
Yeast growth
Yeast cells from DBY10144 strain were cultured overnight at 30°C in 5 ml of synthetic complete medium containing 6.7 g/l yeast nitrogen base, 2 g/l of drop-out mix with all amino acids except lysine and 2% glucose and supplemented with 0.436 mM of L-lysine. Then cells were inoculated into 400 ml of heavy medium containing 13C6,15N2-lysine at OD600 = 0.02. Cells were grown for 6h in heavy medium, collecting samples at 1, 1.5, 2, 3, 4 and 6 h into the labeling phase (Figure 1A). OD600 was measured at each time point and cells were harvested by centrifugation (10,000g for 5 min at 4°C). Cell pellets were washed twice with ice-cold water, snap frozen and stored at -80°C. A duplicate experiment was conducted a week after and samples were similarly collected before analytical processing. For additional turnover experiments prototroph cells were initially grown in media with no lysine before being pulsed with heavy lysine (final concentration of 0.436 mM) and chased at a single time point following the same harvesting procedures explained above. Growth was monitored in all cases. For arginine availability experiments, two cell cultures were grown overnight in either arginine containing (0.436 mM L-arginine) or deficient (0 mM L-arginine) media, and then each culture was inoculated per triplicate at OD600 = 0.1 in the same media. After two hours, cells were pulsed with heavy lysine and grown for two more hours before harvesting them. For raffinose and galactose experiments, cells were grown overnight in media containing 2% raffinose instead of glucose and then inoculated per triplicate at OD600 = 0.025 in media containing either 2% raffinose or 2% galactose. After four hours, cells were pulsed with heavy lysine and grown for two more hours before harvesting. For osmotic stress experiments, cells were grown overnight in synthetic complete media without lysine and then inoculated in triplicate to OD600 = 0.5 into heavy lysine media containing 500 mM NaCl. Cells were grown for 3h and harvested at this point. A triplicate control experiment with no salt addition was performed in parallel.
Sample preparation
Cell pellets were resuspended in lysis buffer composed of 8M urea, 75mM NaCl, 50mM Tris, pH 8.2, protease and phosphatase (50mM NaF, 50mM β-glycerophosphate, 10mM Na-pyrophosphate, 1 mM Na-orthovanadate) inhibitors. Cells were lysed by 4 rounds of bead beating (1 min beating, 1.5 min rest) with zirconia/silica beads. Lysate protein concentration was measured by Bradford assay. Protein was reduced with 5mM dithiothreitol (DTT) for 30 min at 55°C and alkylated with 15mM iodoacetamide in the dark for 30 min at room temperature. The alkylation reaction was quenched by incubating with additional 5 mM DTT for 15 min at room temperature. Samples were diluted two-fold with 50mM Tris pH 8.9 and 2mM calcium chloride. Proteolytic digestion was performed by addition of lysyl endopeptidase (LysC), 1:50 enzyme to protein ratio, and incubated at room temperature overnight. The digestion was quenched by addition of formic acid to pH ~ 2.5. Peptides were desalted and fractionated by high pH reverse phase in StageTips (Rappsilber et al., 2007; Swaney et al., 2013). Briefly, in-house made StageTips containing 14-gauge four-layered Empore SDB-XC material plugs, were conditioned first with methanol and then with 70% acetonitrile, 0.1% ammonium hydroxide, and equilibrated with 0.1% formic acid. Samples were loaded into the StageTips, washed three times with 0.1% formic acid and eluted into 4 fractions with increasing concentrations of acetonitrile (6, 12, 18 and 80%) in 0.1% ammonium hydroxide. Peptide fractions were immediately acidified with 10% formic acid, 75% acetonitrile, dried by vacuum centrifugation, and stored at −20°C until LC-MS/MS analysis. For the nutrient availability and salt stress experiments no fractionation was performed, and digested peptides were directly loaded into StageTips containing four-layered C18 material plugs, desalted by three washes with 0.1% acetic acid, eluted into a MS vial with 80% acetonitrile in 0.1% acetic acid, dried and stored at −20°C until analysis.
LC-MS/MS analysis
Peptides were resuspended in 4% formic acid, 3% acetonitrile and analyzed by nLC-MS/MS analysis in a hybrid quadrupole-orbitrap (QExactive) mass spectrometer (Thermo Fisher, Bremen, Germany) equipped with an Easy1000 nanoLC (Thermo Fisher, Odense, Denmark) system as follows: peptides were first loaded onto a 100-μm ID × 3-cm precolumn packed with Reprosil C18 3-μm beads, and separated by reverse phase chromatography on a 100-μm ID × 30-cm analytical column packed with 1.9-μm beads of the same material and housed into a column heater set at 50°C. The average separation gradient ranged from 9 to 32% acetonitrile in 0.125% formic acid over 94 min, with minor adjustments for low, medium and high hydrophobic fractions. The total duration of the method, including column wash and equilibration was 120 min. All spectra were collected with Orbitrap detection. Full MS scans were acquired in centroid mode from 300 to 1500 m/z at 70,000 FWHM resolution with fill target of 3E6 ions and maximum injection time of 100 ms. The 20 most abundant ions on the full MS scan were selected for fragmentation using a 2.0 m/z precursor isolation window and beam-type collisional-activation dissociation (HCD). MS/MS spectra were collected at 17,500 FWHM resolution with fill target of 5E4 ions and maximum injection time of 50 ms. Fragmented precursors were dynamically excluded from selection for 40 s.
Quantification and statistical analysis
MS data analysis
MS/MS spectra were searched with MaxQuant (Boisvert et al., 2012; Cambridge et al., 2011; Cox and Mann, 2008) against the SGD Saccharomyces cerevisiae protein sequence database (downloaded January 2015, 6713 entries) with common contaminants added. The precursor mass tolerance was set to 6 ppm, and the fragment ion tolerance was set to 20 ppm. A static modification on cysteine residues and variable modifications of methionine oxidation and protein N-terminal acetylation were used for all searches. LysC was the specified enzyme allowing for up to two missed cleavages. The minimum required peptide length was seven residues. The target-decoy database search strategy was used to guide filtering and estimate false discovery rates (FDR). All data was filtered to 1% FDR at both peptide and protein levels. Proteins with at least two peptides (one of them unique to the protein) were considered identified. The “match between runs” option was enabled with a time window of 0.7 min to match identifications between replicates. The “requant” option of MaxQuant was disabled.
Protein abundance and half-life estimation
Absolute protein abundances as copies per cell were calculated by applying the “proteomic ruler” plugin (Pu et al., 2009; Wiśniewski et al., 2014) in Perseus software (Kim et al., 2012; Tyanova et al., 2016) using the aggregated intensities of both heavy and light versions for each protein group excluding contaminants and reverse hits.
Protein half-lives were calculated according to the procedure we previously described (Martin-Perez and Villen, 2015; Shumway et al., 1999). Briefly, heavy to light intensity ratios from the MaxQuant protein groups output table were used to calculate the proportion of heavy label incorporation (i.e. Relative Isotope Abundance, RIA) at each time point (Figure 1A). Then, we fitted the RIA values for each protein over time using the formula of an exponential curve:
From this formula, we calculated the turnover rate constant (k) and use it to obtain half-lives (t1/2) as follows:
Thus, the half-life for each protein is defined as the time when the protein is half labeled and corresponds to the time it takes for half of the protein to turn over (Boisvert et al., 2012; Eden et al., 2011; Gawron et al., 2016; Wilkinson and Ramsdale, 2011). Only proteins with a significant goodness of fit (Pearson’s chi-squared test p ≤ 0.05, and R2 > 0.5) were kept in the final dataset. If curve fitting was not possible due to insufficient data points or poor quality of fitting, half-lives were estimated by single-point measurements as described (Christiano et al., 2014; Pratt et al., 2002), with minor modifications. RIA values determined at a single time point (RIAt) using heavy and light protein intensities were used to calculate the protein half-live according to the following equation and assuming an incorporation plateau value of 1:
If more than one single point measurement were calculated for a protein, the median of all of them was used as the final estimated value. Next, protein half-lives were normalized by the cell doubling time of each replicate to minimize the experimental variability (e.g. cell inoculum, media preparation, etc.) which may lead to slight differences in growth and therefore in the incorporation rates between replicates. Then, to get absolute time values, normalized half-life values were multiplied by the averaged doubling time in each experiment/condition. For the additional experiments, protein half-lives were calculated by the single-point method using heavy to light intensity ratios. The measurements of the half-lives for the control groups of these experiments correlated well with our central multi-point experiment (Pearson’s r = 0.70 and 0.80, for the arginine availability and salt stress experiments respectively).
Differences in half-life calculation methods
In addition to the poor correlation between individual half-lives values among different turnover studies, the median half-life was also very different. We attribute this disagreement to the way half-lives were defined and calculated in each study. Our study, as most protein turnover studies based on pulse-chase with labeled amino acids, rely on fitting labeling trajectories to first order kinetic curves. Essentially, we fitted the % of labeling incorporation (i.e. relative isotope abundance or RIA) for each protein over time using the formula of an exponential curve to obtain the turnover rate constant and used this rate to calculate half-lives. The same approach has been used by others to calculate protein half-lives, defined as the time for removal of half of the protein (Eden et al., 2011), as well as ‘turnover times’ which corresponds to the time it takes for 50% of the protein to turn over and is defined as the mean time for 50% incorporation of labeling for all peptides from that protein (Boisvert et al., 2012; Gawron et al., 2016). However, many other studies, used the protein degradation rate (i.e. K degradation = K turnover -K growth) to calculate half-lives which represents the time taken for 50% of the pool of each preexisting protein species to be degraded. Using different definition of protein half-lives (whether subtracting or not the growth rate) affects the absolute half-live values, but not their relative ranking. For this reason, when using the degradation rates to calculate protein half-lives, we obtained comparable median protein half-lives with previous studies (Christiano et al., 2014), but the correlation remained essentially unaltered (Figure S2H). One problem that we anticipate is the effect of inaccurate growth rates measurements on the calculation of ‘degradative half-lives’, especially for long-lived proteins or proteins with half-lives close to the cellular doubling-time, which would either tend to infinity or could not be calculated if degradation rates were lower than growth rate. For this reason, estimated half-lives using protein turnover values can reflect more directly both protein synthesis and degradation rates and be measured more accurately (Boisvert et al., 2012).
Data analysis, bioinformatics, and statistics
Datasets were normality tested by using Kolmogorov-Smirnov test. Statistical comparisons were performed by t-test or nonparametric Mann-Whitney test depending on whether the data was normally distributed or not, respectively. Significant differences were established at the level of p<0.05 in both cases. Boxplots represents 25 and 75 percentiles and whiskers 10 and 90 percentiles unless otherwise stated. Spearman’s and Pearson’s correlation coefficients were calculated using OriginPro software package with missing values excluded in a pairwise manner.
Hierarchical clustering for heatmap and 2D annotation enrichment analysis were performed in Perseus, similarly to described elsewhere (Cox and Mann, 2012; Prince and Pickett, 2002). GOrilla webtool (http://cbl-gorilla.cs.technion.ac.il/) (Cambridge et al., 2011; Eden et al., 2009) was used to identify enriched GO terms in selected heatmap clusters. Pathway analysis was performed using WikiPathways (http://www.wikipathways.org) (Kutmon et al., 2016; Yu et al., 2008) and Cytoscape (http://www.cytoscape.org/) (Shannon et al., 2003).
Protein physicochemical properties, PTMs (type and localization) and GO slim terms in yeast were obtained from the SGD Project (www.yeastgenome.org) (Cherry et al., 2012). Sequence analysis of the N and C protein terminus was performed with pLogo (http://plogo.uconn.edu/) (O’Shea et al., 2013). SitePrediction website (http://www.dmbr.ugent.be/prx/bioit2-public/SitePrediction/index.php) (Verspurten et al., 2009) was used for structure prediction, potential PEST sequence analysis and cleavage site predictions of most proteases (average score >99.9%). GPS-CCD (Liu et al., 2011) and GPS-ARM (Liu et al., 2012) software tools were used to predict calpain cleavage sites, and D- and KEN-boxes, respectively, using the highest cutoff threshold in both cases.
Predictive models of protein half-lives were derived by means of multiple linear regression analyses using OriginPro software, and adjusted correlation coefficients (Adj. R2) were calculated. Input data from the different variables employed was log-transformed to ensure normality. To test the models for overfitting, the data was randomly divided in halves, and each half was used to cross-validate the regression derived from the other half of the data. Receiver operator characteristic (ROC) curves analysis was performed with OriginPro software to determine the sensitivity and specificity of each predictor / model on classifying a set of proteins. From this information, the predictor’s ROC area under the curve (AUC) was determined.
Data and software availability
All raw mass spectrometry data files from this study are available at MassIVE (MSV000079673) and ProteomeXchange (PXD004028) repositories.
Supplementary Material
Data S1. Protein half-lives (Data S1A) and abundances (Data S1B) calculated in the main experiment. Related to Figure 1; Figure 2; Figure 4; Figure 5; and Figures S1 to S6.
Data S2. Protein intensities and half-lives in protocol comparison experiment. Related to STAR Methods and Figure S2.
Data S3. Protein half-lives and abundances in yeast protein complexes. Related to Figure 2.
Data S4. Protein intensities and half-lives in arginine availability experiment. Related to Figure 3.
Data S5. Protein intensities and half-lives in carbon source experiment. Related to Figure 3.
Data S6. Protein intensities and half-lives in osmotic (salt) stress experiment. Related to Figure 6.
Supplemental Information.
Highlights.
Protein functional characteristics have greater impact on protein turnover than sequence properties
Protein turnover is faster when proteins are actively used
mRNA stability and protein turnover are correlated in exponentially growing yeast
Protein turnover is highly sensitive to changes in cellular state
Acknowledgments
We thank Dr. Maitreya Dunham and Samuel Lancaster from the Department of Genome Sciences at the University of Washington for providing the S. cerevisiae strains used in this study. We also thank all members of the Villén laboratory and Masanao Yajima for valuable feedback on the manuscript. This work was supported by a Junior Award from the Nathan Shock Center of Excellence in Basic Biology of Aging at the University of Washington (NIH/NIA 3P30AG013280), an Ellison Medical Foundation New Scholar Award (AG-NS-0953-12), and a grant from the National Institutes of Health (1R35GM119536).
Footnotes
Publisher's Disclaimer: This is a PDF file of an unedited manuscript that has been accepted for publication. As a service to our customers we are providing this early version of the manuscript. The manuscript will undergo copyediting, typesetting, and review of the resulting proof before it is published in its final citable form. Please note that during the production process errors may be discovered which could affect the content, and all legal disclaimers that apply to the journal pertain.
AUTHOR CONTRIBUTIONS
M.M-P. and J.V. designed the experiments. M.M-P. performed the experiments and analyzed data. J.V. supervised research. M.M-P. and JV wrote the paper.
References
- Alam MT, Zelezniak A, Mülleder M, Shliaha P, Schwarz R, Capuano F, Vowinckel J, Radmaneshfar E, Krüger A, Calvani E, et al. The metabolic background is a global player in Saccharomyces gene expression epistasis. Nat Microbiol. 2016;1:15030. doi: 10.1038/nmicrobiol.2015.30. [DOI] [PMC free article] [PubMed] [Google Scholar]
- Bachmair A, Finley D, Varshavsky A. In vivo half-life of a protein is a function of its amino-terminal residue. Science. 1986;234:179–186. doi: 10.1126/science.3018930. [DOI] [PubMed] [Google Scholar]
- Baek D, Villen J, Shin C, Camargo FD, Gygi SP, Bartel DP. The impact of microRNAs on protein output. Nature. 2008;455:64–71. doi: 10.1038/nature07242. [DOI] [PMC free article] [PubMed] [Google Scholar]
- Balch WE, Morimoto RI, Dillin A, Kelly JW. Adapting proteostasis for disease intervention. Science. 2008;319:916–919. doi: 10.1126/science.1141448. [DOI] [PubMed] [Google Scholar]
- Belle A, Tanay A, Bitincka L, Shamir R, O’Shea EK. Quantification of protein half-lives in the budding yeast proteome. Proc Natl Acad Sci USA. 2006;103:13004–13009. doi: 10.1073/pnas.0605420103. [DOI] [PMC free article] [PubMed] [Google Scholar]
- Boisvert FM, Ahmad Y, Gierlinski M, Charrière F, Lamont D, Scott M, Barton G, Lamond AI. A quantitative spatial proteomics analysis of proteome turnover in human cells. Mol Cell Proteomics. 2012;11 doi: 10.1074/mcp.M111.011429. M111.011429. [DOI] [PMC free article] [PubMed] [Google Scholar]
- Cambridge SB, Gnad F, Nguyen C, Bermejo JL, Krüger M, Mann M. Systems-wide proteomic analysis in mammalian cells reveals conserved, functional protein turnover. J Proteome Res. 2011;10:5275–5284. doi: 10.1021/pr101183k. [DOI] [PubMed] [Google Scholar]
- Cheng Z, Teo G, Krueger S, Rock TM, Koh HW, Choi H, Vogel C. Differential dynamics of the mammalian mRNA and protein expression response to misfolding stress. Mol Syst Biol. 2016;12:855. doi: 10.15252/msb.20156423. [DOI] [PMC free article] [PubMed] [Google Scholar]
- Cherry JM, Hong EL, Amundsen C, Balakrishnan R, Binkley G, Chan ET, Christie KR, Costanzo MC, Dwight SS, Engel SR, et al. Saccharomyces Genome Database: the genomics resource of budding yeast. Nucleic Acids Res. 2012;40:D700–D705. doi: 10.1093/nar/gkr1029. [DOI] [PMC free article] [PubMed] [Google Scholar]
- Christiano R, Nagaraj N, Fröhlich F, Walther TC. Global Proteome Turnover Analyses of the Yeasts S. cerevisiae and S. pombe. Cell Rep. 2014;9:1959–1965. doi: 10.1016/j.celrep.2014.10.065. [DOI] [PMC free article] [PubMed] [Google Scholar]
- Cox J, Mann M. 1D and 2D annotation enrichment: a statistical method integrating quantitative proteomics with complementary high-throughput data. BMC Bioinformatics. 2012;13(Suppl 16):S12. doi: 10.1186/1471-2105-13-S16-S12. [DOI] [PMC free article] [PubMed] [Google Scholar]
- Cox J, Mann M. MaxQuant enables high peptide identification rates, individualized p.p.b.-range mass accuracies and proteome-wide protein quantification. Nat Biotechnol. 2008;26:1367–1372. doi: 10.1038/nbt.1511. [DOI] [PubMed] [Google Scholar]
- Csárdi G, Franks A, Choi DS, Airoldi EM, Drummond DA. Accounting for experimental noise reveals that mRNA levels, amplified by post-transcriptional processes, largely determine steady-state protein levels in yeast. PLoS Genet. 2015;11:e1005206. doi: 10.1371/journal.pgen.1005206. [DOI] [PMC free article] [PubMed] [Google Scholar]
- de Godoy LMF, Olsen JV, Cox J, Nielsen ML, Hubner NC, Fröhlich F, Walther TC, Mann M. Comprehensive mass-spectrometry-based proteome quantification of haploid versus diploid yeast. Nature. 2008;455:1251–1254. doi: 10.1038/nature07341. [DOI] [PubMed] [Google Scholar]
- Doherty MK, Hammond DE, Clague MJ, Gaskell SJ, Beynon RJ. Turnover of the human proteome: determination of protein intracellular stability by dynamic SILAC. J Proteome Res. 2009;8:104–112. doi: 10.1021/pr800641v. [DOI] [PubMed] [Google Scholar]
- Eden E, Geva-Zatorsky N, Issaeva I, Cohen A, Dekel E, Danon T, Cohen L, Mayo A, Alon U. Proteome half-life dynamics in living human cells. Science. 2011;331:764–768. doi: 10.1126/science.1199784. [DOI] [PubMed] [Google Scholar]
- Eden E, Navon R, Steinfeld I, Lipson D, Yakhini Z. GOrilla: a tool for discovery and visualization of enriched GO terms in ranked gene lists. BMC Bioinformatics. 2009;10:48. doi: 10.1186/1471-2105-10-48. [DOI] [PMC free article] [PubMed] [Google Scholar]
- Gawron D, Ndah E, Gevaert K, Van Damme P. Positional proteomics reveals differences in N-terminal proteoform stability. Mol Syst Biol. 2016;12:858. doi: 10.15252/msb.20156662. [DOI] [PMC free article] [PubMed] [Google Scholar]
- Geisberg JV, Moqtaderi Z, Fan X, Ozsolak F, Struhl K. Global analysis of mRNA isoform half-lives reveals stabilizing and destabilizing elements in yeast. Cell. 2014;156:812–824. doi: 10.1016/j.cell.2013.12.026. [DOI] [PMC free article] [PubMed] [Google Scholar]
- Gibbs DJ, Bacardit J, Bachmair A, Holdsworth MJ. The eukaryotic N-end rule pathway: conserved mechanisms and diverse functions. Trends Cell Biol. 2014;24:603–611. doi: 10.1016/j.tcb.2014.05.001. [DOI] [PubMed] [Google Scholar]
- Goldberg AL, Boches FS. Oxidized proteins in erythrocytes are rapidly degraded by the adenosine triphosphate-dependent proteolytic system. Science. 1982;215:1107–1109. doi: 10.1126/science.7038874. [DOI] [PubMed] [Google Scholar]
- Gracy RW, Talent JM, Zvaigzne AI. Molecular wear and tear leads to terminal marking and the unstable isoforms of aging. J Exp Zool. 1998;282:18–27. [PubMed] [Google Scholar]
- Hammond DE, Claydon AJ, Simpson DM, Edward D, Stockley P, Hurst JL, Beynon RJ. Proteome Dynamics: Tissue Variation in the Kinetics of Proteostasis in Intact Animals. Mol Cell Proteomics. 2016;15:1204–1219. doi: 10.1074/mcp.M115.053488. [DOI] [PMC free article] [PubMed] [Google Scholar]
- Harris KF, Shoji I, Cooper EM, Kumar S, Oda H, Howley PM. Ubiquitin-mediated degradation of active Src tyrosine kinase. Proc Natl Acad Sci USA. 1999;96:13738–13743. doi: 10.1073/pnas.96.24.13738. [DOI] [PMC free article] [PubMed] [Google Scholar]
- Helbig AO, Daran-Lapujade P, van Maris AJA, de Hulster EAF, de Ridder D, Pronk JT, Heck AJR, Slijper M. The diversity of protein turnover and abundance under nitrogen-limited steady-state conditions in Saccharomyces cerevisiae. Mol Biosyst. 2011;7:3316–3326. doi: 10.1039/c1mb05250k. [DOI] [PubMed] [Google Scholar]
- Hsieh EJ, Shulman NJ, Dai DF, Vincow ES, Karunadharma PP, Pallanck L, Rabinovitch PS, MacCoss MJ. Topograph, a software platform for precursor enrichment corrected global protein turnover measurements. Mol Cell Proteomics. 2012;11:1468–1474. doi: 10.1074/mcp.O112.017699. [DOI] [PMC free article] [PubMed] [Google Scholar]
- Jovanovic M, Rooney MS, Mertins P, Przybylski D, Chevrier N, Satija R, Rodriguez EH, Fields AP, Schwartz S, Raychowdhury R, et al. Immunogenetics. Dynamic profiling of the protein life cycle in response to pathogens. Science. 2015;347:1259038. doi: 10.1126/science.1259038. [DOI] [PMC free article] [PubMed] [Google Scholar]
- Kim TY, Wang D, Kim AK, Lau E, Lin AJ, Liem DA, Zhang J, Zong NC, Lam MPY, Ping P. Metabolic labeling reveals proteome dynamics of mouse mitochondria. Mol Cell Proteomics. 2012;11:1586–1594. doi: 10.1074/mcp.M112.021162. [DOI] [PMC free article] [PubMed] [Google Scholar]
- Kulak NA, Pichler G, Paron I, Nagaraj N, Mann M. Minimal, encapsulated proteomic-sample processing applied to copy-number estimation in eukaryotic cells. Nat Methods. 2014;11:319–324. doi: 10.1038/nmeth.2834. [DOI] [PubMed] [Google Scholar]
- Kutmon M, Riutta A, Nunes N, Hanspers K, Willighagen EL, Bohler A, Mélius J, Waagmeester A, Sinha SR, Miller R, et al. WikiPathways: capturing the full diversity of pathway knowledge. Nucleic Acids Res. 2016;44:D488–D494. doi: 10.1093/nar/gkv1024. [DOI] [PMC free article] [PubMed] [Google Scholar]
- Lam YW, Lamond AI, Mann M, Andersen JS. Analysis of nucleolar protein dynamics reveals the nuclear degradation of ribosomal proteins. Curr Biol. 2007;17:749–760. doi: 10.1016/j.cub.2007.03.064. [DOI] [PMC free article] [PubMed] [Google Scholar]
- Lee MV, Topper SE, Hubler SL, Hose J, Wenger CD, Coon JJ, Gasch AP. A dynamic model of proteome changes reveals new roles for transcript alteration in yeast. Mol Syst Biol. 2011;7:514. doi: 10.1038/msb.2011.48. [DOI] [PMC free article] [PubMed] [Google Scholar]
- Liu Z, Cao J, Gao X, Ma Q, Ren J, Xue Y. GPS-CCD: a novel computational program for the prediction of calpain cleavage sites. PLoS ONE. 2011;6:e19001. doi: 10.1371/journal.pone.0019001. [DOI] [PMC free article] [PubMed] [Google Scholar]
- Liu Z, Yuan F, Ren J, Cao J, Zhou Y, Yang Q, Xue Y. GPS-ARM: computational analysis of the APC/C recognition motif by predicting D-boxes and KEN-boxes. PLoS ONE. 2012;7:e34370. doi: 10.1371/journal.pone.0034370. [DOI] [PMC free article] [PubMed] [Google Scholar]
- López-Otín C, Blasco MA, Partridge L, Serrano M, Kroemer G. The hallmarks of aging. Cell. 2013;153:1194–1217. doi: 10.1016/j.cell.2013.05.039. [DOI] [PMC free article] [PubMed] [Google Scholar]
- Lu P, Vogel C, Wang R, Yao X, Marcotte EM. Absolute protein expression profiling estimates the relative contributions of transcriptional and translational regulation. Nat Biotechnol. 2007;25:117–124. doi: 10.1038/nbt1270. [DOI] [PubMed] [Google Scholar]
- Martin-Perez M, Villen J. Feasibility of protein turnover studies in prototroph Saccharomyces cerevisiae strains. Anal Chem. 2015;87:4008–4014. doi: 10.1021/acs.analchem.5b00264. [DOI] [PMC free article] [PubMed] [Google Scholar]
- Mishima Y, Tomari Y. Codon Usage and 3′ UTR Length Determine Maternal mRNA Stability in Zebrafish. Mol Cell. 2016;61:874–885. doi: 10.1016/j.molcel.2016.02.027. [DOI] [PubMed] [Google Scholar]
- Miura F, Kawaguchi N, Yoshida M, Uematsu C, Kito K, Sakaki Y, Ito T. Absolute quantification of the budding yeast transcriptome by means of competitive PCR between genomic and complementary DNAs. BMC Genomics. 2008;9:574. doi: 10.1186/1471-2164-9-574. [DOI] [PMC free article] [PubMed] [Google Scholar]
- Mommen GPM, van de Waterbeemd B, Meiring HD, Kersten G, Heck AJR, de Jong APJM. Unbiased selective isolation of protein N-terminal peptides from complex proteome samples using phospho tagging (PTAG) and TiO(2)-based depletion. Mol Cell Proteomics. 2012;11:832–842. doi: 10.1074/mcp.O112.018283. [DOI] [PMC free article] [PubMed] [Google Scholar]
- O’Shea JP, Chou MF, Quader SA, Ryan JK, Church GM, Schwartz D. pLogo: a probabilistic approach to visualizing sequence motifs. Nat Methods. 2013;10:1211–1212. doi: 10.1038/nmeth.2646. [DOI] [PubMed] [Google Scholar]
- Petti AA, Crutchfield CA, Rabinowitz JD, Botstein D. Survival of starving yeast is correlated with oxidative stress response and nonrespiratory mitochondrial function. Proc Natl Acad Sci USA. 2011;108:E1089–E1098. doi: 10.1073/pnas.1101494108. [DOI] [PMC free article] [PubMed] [Google Scholar]
- Pratt JM, Petty J, Riba-Garcia I, Robertson DHL, Gaskell SJ, Oliver SG, Beynon RJ. Dynamics of protein turnover, a missing dimension in proteomics. Mol Cell Proteomics. 2002;1:579–591. doi: 10.1074/mcp.m200046-mcp200. [DOI] [PubMed] [Google Scholar]
- Presnyak V, Alhusaini N, Chen YH, Martin S, Morris N, Kline N, Olson S, Weinberg D, Baker KE, Graveley BR, et al. Codon optimality is a major determinant of mRNA stability. Cell. 2015;160:1111–1124. doi: 10.1016/j.cell.2015.02.029. [DOI] [PMC free article] [PubMed] [Google Scholar]
- Price JC, Guan S, Burlingame A, Prusiner SB, Ghaemmaghami S. Analysis of proteome dynamics in the mouse brain. Proc Natl Acad Sci USA. 2010;107:14508–14513. doi: 10.1073/pnas.1006551107. [DOI] [PMC free article] [PubMed] [Google Scholar]
- Prince VE, Pickett FB. Splitting pairs: the diverging fates of duplicated genes. Nat Rev Genet. 2002;3:827–837. doi: 10.1038/nrg928. [DOI] [PubMed] [Google Scholar]
- Pu S, Wong J, Turner B, Cho E, Wodak SJ. Up-to-date catalogues of yeast protein complexes. Nucleic Acids Res. 2009;37:825–831. doi: 10.1093/nar/gkn1005. [DOI] [PMC free article] [PubMed] [Google Scholar]
- Rappsilber J, Mann M, Ishihama Y. Protocol for micro-purification, enrichment, pre-fractionation and storage of peptides for proteomics using StageTips. Nat Protoc. 2007;2:1896–1906. doi: 10.1038/nprot.2007.261. [DOI] [PubMed] [Google Scholar]
- Rodriguez MS, Desterro JM, Lain S, Lane DP, Hay RT. Multiple C-terminal lysine residues target p53 for ubiquitin-proteasome-mediated degradation. Molecular and Cellular Biology. 2000;20:8458–8467. doi: 10.1128/mcb.20.22.8458-8467.2000. [DOI] [PMC free article] [PubMed] [Google Scholar]
- Schade B, Jansen G, Whiteway M, Entian KD, Thomas DY. Cold adaptation in budding yeast. Mol Biol Cell. 2004;15:5492–5502. doi: 10.1091/mbc.E04-03-0167. [DOI] [PMC free article] [PubMed] [Google Scholar]
- Schwanhäusser B, Busse D, Li N, Dittmar G, Schuchhardt J, Wolf J, Chen W, Selbach M. Global quantification of mammalian gene expression control. Nature. 2011;473:337–342. doi: 10.1038/nature10098. [DOI] [PubMed] [Google Scholar]
- Schwanhäusser B, Gossen M, Dittmar G, Selbach M. Global analysis of cellular protein translation by pulsed SILAC. Proteomics. 2009;9:205–209. doi: 10.1002/pmic.200800275. [DOI] [PubMed] [Google Scholar]
- Shannon P, Markiel A, Ozier O, Baliga NS, Wang JT, Ramage D, Amin N, Schwikowski B, Ideker T. Cytoscape: a software environment for integrated models of biomolecular interaction networks. Genome Res. 2003;13:2498–2504. doi: 10.1101/gr.1239303. [DOI] [PMC free article] [PubMed] [Google Scholar]
- Shumway SD, Maki M, Miyamoto S. The PEST domain of IkappaBalpha is necessary and sufficient for in vitro degradation by mu-calpain. J Biol Chem. 1999;274:30874–30881. doi: 10.1074/jbc.274.43.30874. [DOI] [PubMed] [Google Scholar]
- Soto T, Núñez A, Madrid M, Vicente J, Gacto M, Cansado J. Transduction of centrifugation-induced gravity forces through mitogen-activated protein kinase pathways in the fission yeast Schizosaccharomyces pombe. Microbiology (Reading, Engl) 2007;153:1519–1529. doi: 10.1099/mic.0.2006/004283-0. [DOI] [PubMed] [Google Scholar]
- Swaney DL, Beltrao P, Starita L, Guo A, Rush J, Fields S, Krogan NJ, Villen J. Global analysis of phosphorylation and ubiquitylation cross-talk in protein degradation. Nat Methods. 2013;10:676–682. doi: 10.1038/nmeth.2519. [DOI] [PMC free article] [PubMed] [Google Scholar]
- Thayer NH, Leverich CK, Fitzgibbon MP, Nelson ZW, Henderson KA, Gafken PR, Hsu JJ, Gottschling DE. Identification of long-lived proteins retained in cells undergoing repeated asymmetric divisions. Proc Natl Acad Sci USA. 2014;111:14019–14026. doi: 10.1073/pnas.1416079111. [DOI] [PMC free article] [PubMed] [Google Scholar]
- Tyanova S, Temu T, Sinitcyn P, Carlson A, Hein MY, Geiger T, Mann M, Cox J. The Perseus computational platform for comprehensive analysis of (prote)omics data. Nat Methods. 2016;13:731–740. doi: 10.1038/nmeth.3901. [DOI] [PubMed] [Google Scholar]
- Verspurten J, Gevaert K, Declercq W, Vandenabeele P. SitePredicting the cleavage of proteinase substrates. Trends Biochem Sci. 2009;34:319–323. doi: 10.1016/j.tibs.2009.04.001. [DOI] [PubMed] [Google Scholar]
- Vincow ES, Merrihew G, Thomas RE, Shulman NJ, Beyer RP, MacCoss MJ, Pallanck LJ. The PINK1-Parkin pathway promotes both mitophagy and selective respiratory chain turnover in vivo. Proc Natl Acad Sci USA. 2013;110:6400–6405. doi: 10.1073/pnas.1221132110. [DOI] [PMC free article] [PubMed] [Google Scholar]
- Wang M, Weiss M, Simonovic M, Haertinger G, Schrimpf SP, Hengartner MO, von Mering C. PaxDb, a database of protein abundance averages across all three domains of life. Molecular & Cellular Proteomics. 2012;11:492–500. doi: 10.1074/mcp.O111.014704. [DOI] [PMC free article] [PubMed] [Google Scholar]
- Wilkinson D, Ramsdale M. Proteases and caspase-like activity in the yeast Saccharomyces cerevisiae. Biochem Soc Trans. 2011;39:1502–1508. doi: 10.1042/BST0391502. [DOI] [PubMed] [Google Scholar]
- Wiśniewski JR, Hein MY, Cox J, Mann M. A “proteomic ruler” for protein copy number and concentration estimation without spike-in standards. Mol Cell Proteomics. 2014;13:3497–3506. doi: 10.1074/mcp.M113.037309. [DOI] [PMC free article] [PubMed] [Google Scholar]
- Yu H, Braun P, Yildirim MA, Lemmens I, Venkatesan K, Sahalie J, Hirozane-Kishikawa T, Gebreab F, Li N, Simonis N, et al. High-quality binary protein interaction map of the yeast interactome network. Science. 2008;322:104–110. doi: 10.1126/science.1158684. [DOI] [PMC free article] [PubMed] [Google Scholar]
Associated Data
This section collects any data citations, data availability statements, or supplementary materials included in this article.
Supplementary Materials
Data S1. Protein half-lives (Data S1A) and abundances (Data S1B) calculated in the main experiment. Related to Figure 1; Figure 2; Figure 4; Figure 5; and Figures S1 to S6.
Data S2. Protein intensities and half-lives in protocol comparison experiment. Related to STAR Methods and Figure S2.
Data S3. Protein half-lives and abundances in yeast protein complexes. Related to Figure 2.
Data S4. Protein intensities and half-lives in arginine availability experiment. Related to Figure 3.
Data S5. Protein intensities and half-lives in carbon source experiment. Related to Figure 3.
Data S6. Protein intensities and half-lives in osmotic (salt) stress experiment. Related to Figure 6.
Supplemental Information.