Abstract
Although individuals age and die with time, an animal species can continue indefinitely, because of its immortal germ-cell lineage1. How the germline avoids transmitting damage from one generation to the next remains a fundamental question in biology. Here we identify a lysosomal switch that enhances germline proteostasis before fertilization. We find that Caenorhabditis elegans oocytes whose maturation is arrested by the absence of sperm2 exhibit hallmarks of proteostasis collapse, including protein aggregation. Remarkably, sperm-secreted hormones re-establish oocyte proteostasis once fertilization becomes imminent. Key to this restoration is activation of the vacuolar H+-ATPase (V-ATPase), a proton pump that acidifies lysosomes3. Sperm stimulate V-ATPase activity in oocytes by signalling the degradation of GLD-1, a translational repressor4 that blocks V-ATPase synthesis. Activated lysosomes, in turn, promote a metabolic shift that mobilizes protein aggregates for degradation, and reset proteostasis by enveloping and clearing the aggregates. Lysosome acidification also occurs during Xenopus oocyte maturation; thus, a lysosomal switch that enhances oocyte proteostasis in anticipation of fertilization may be conserved in other species.
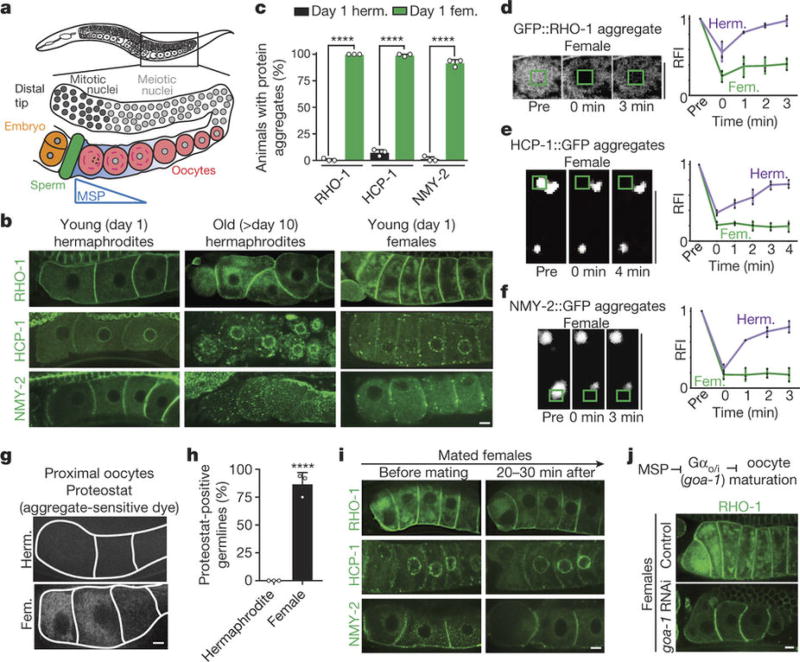
Studies in C. elegans have suggested that damage-clearance mechanisms in the germline may prevent parental damage from being transmitted to progeny5. In the C. elegans hermaphrodite, germ cells form a developmental gradient, with mature oocytes located proximally, near the sperm (Fig. 1a). Protein carbonylation, a form of oxidative damage, is high in immature distal germ cells, but decreases in sperm-proximal oocytes5. This decrease is likely to be signalled by sperm-derived ‘major sperm proteins’ (MSPs), which trigger meiotic maturation in nearby oocytes2,6 (Fig. 1a), because ‘female’ mutants, which lack sperm, do not eliminate the protein carbonyls5. While these observations hint that sperm signals may prompt damage removal, the nature and scope of any quality-control programs are unclear.
Figure 1. Sperm signalling enhances oocyte proteostasis.
a, C. elegans germline. b, Aggregation-prone proteins in oocytes. Aged hermaphrodites deplete sperm. c, Percentage of animals with oocyte protein aggregation; herm., hermaphrodites; fem., females. Mean ± s.d. from three biological replicates, each of n = 50 animals. ****P < 0.0001. d–f, Photobleaching of aggregation-prone proteins. Fluorescence recovery (mean ± s.d.) of each protein was measured for three hermaphrodites or three females. g, Proteostat-labelled oocytes. h, Proteostat-positive germlines. Mean ± s.d. from three biological replicates, each of n = 50 animals. ****P < 0.0001. i, Aggregation-prone proteins after mating. j, GFP::RHO-1-expressing females following control or goa-1 RNAi. Bars, 5 µm.
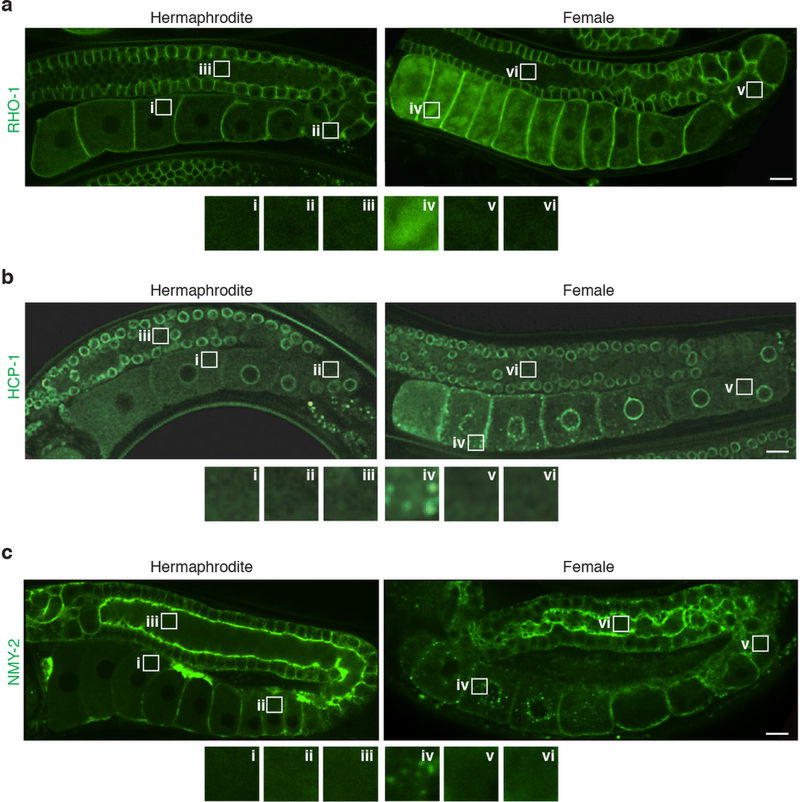
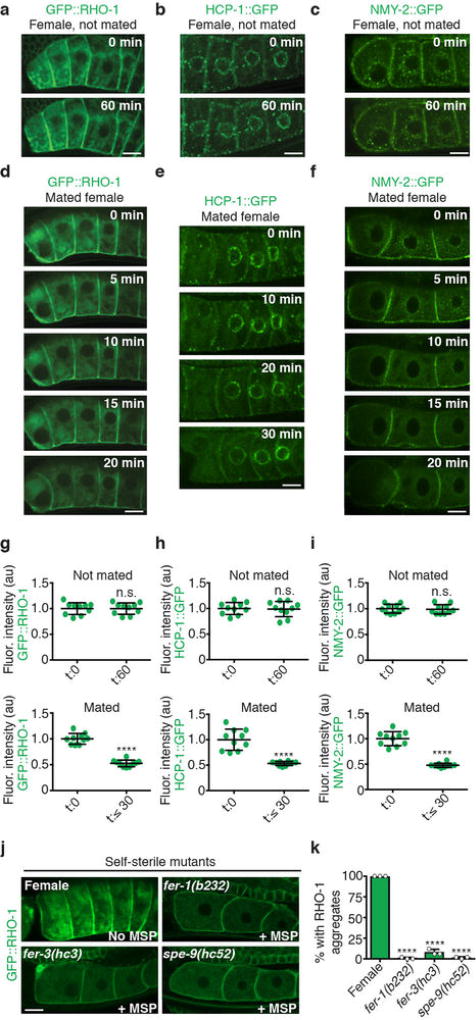
Because protein carbonylation can be observed only in fixed animals5, we sought to identify markers that could be used to track damage clearance in real time. In C. elegans, many proteins become insoluble with age7 (Fig. 1b). We found that GFP-tagged aggregation-prone proteins7 formed stationary, FRAP (fluorescence recovery after photobleaching)-immobile aggregates in the oocytes of sperm-deficient, young-adult females (Fig. 1b–f; Extended Data Figs 1a–c, 2a–c). These aggregates were restricted to proximal oocytes and did not occupy distal regions (Extended Data Fig. 1a–c), similar to those seen in aged hermaphrodites7. We also detected endogenous protein aggregates in the oocytes of females, using the protein-aggregate detection reagent Proteostat (Fig. 1g, h). Notably, when sperm were introduced through mating, the protein aggregates became dynamic and were eliminated within an hour (Fig. 1i; Extended Data Fig. 2d–i).
Protein aggregates were cleared before oocytes were fertilized (Extended Data Fig. 2d–f), suggesting that sperm signalling, and not fertilization, influences protein aggregation in oocytes. Indeed, animals that produce infertile sperm but maintain MSP signaling8,9 did not exhibit oocyte protein aggregation (Extended Data Fig. 2j, k). Mimicking MSP signalling in females by knocking down goa-1, a downstream Gαo/i-protein target of MSP signalling that blocks oocyte maturation10, also prevented aggregation (Fig. 1j). These data confirm that the sperm-dependent oocyte-maturation pathway triggers elimination of protein-aggregates in C. elegans.
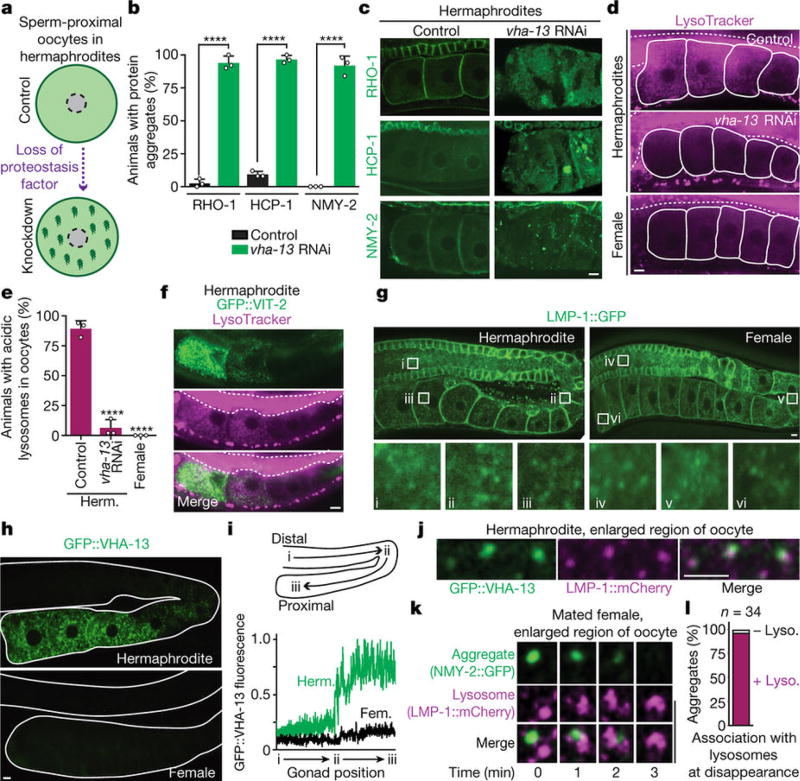
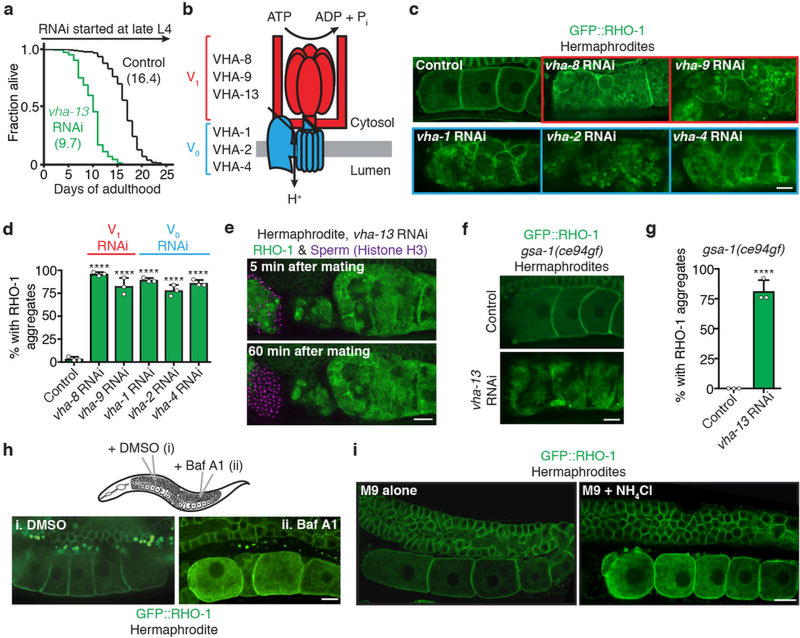
We screened for sperm-responsive factors that were required for aggregate removal (Fig. 2a), focusing on genes required for fertility that have been annotated for a role in proteostasis and/or metabolism11. We used RNA interference (RNAi) to knock down expression of approximately 60 genes; one of these knockdowns produced a striking protein-aggregation phenotype in oocytes from hermaphrodites (Fig. 2b, c). This gene, vha-13, encodes a catalytic subunit of the V-ATPase, a lysosomal proton pump3 that is important for longevity12 (Extended Data Fig. 3a). Knockdown of other V-ATPase subunits produced similar protein-aggregation phenotypes (Extended Data Fig. 3b–d). Protein aggregates caused by V-ATPase gene knockdowns were not eliminated by mating (Extended Data Fig. 3e), nor by the gsa-1(ce94gf) mutation in Gαs (Extended Data Fig. 3f, g), which constitutively activates the MSP-responsive oocyte-maturation pathway10. Thus, the lysosomal V-ATPase is a downstream component of the oocyte quality-control program.
Figure 2. Sperm-activated lysosomes clear protein aggregates.
a, Overview of the screen. b, c, Aggregation-prone proteins following control or vha-13RNAi. Percentage of animals with oocyte protein aggregation. Mean ± s.d. from three biological replicates, each of n = 50 animals. ****P < 0.0001. d, Oocytes stained with LysoTracker. Dotted line, intestine. e, Percentage of animals with lysosomal acidity in oocytes. Mean ± s.d. from three biological replicates, each of n = 50 animals. ****P < 0.0001. f, LysoTracker-stained, GFP::VIT-2-expressing hermaphrodites. Dotted line, intestine. g, h, Expression of LMP-1::GFP and GFP::VHA-13 in the germline. i, Line profiles of GFP::VHA-13 fluorescence. j, Co-localization of GFP::VHA-13 with LMP-1::mCherry in oocytes of hermaphrodites. k, l, Aggregate degradation in lysosomes after mating. Bars, 5 µm.
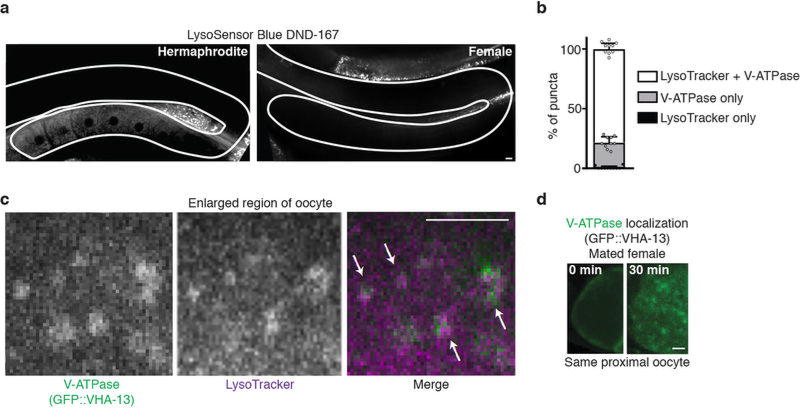
The V-ATPase proton pump acidifies the lysosome3. We found that inhibiting V-ATPase activity using bafilomycin A1 (ref. 13) or neutralizing lysosomal acidity with a weak base14 induced oocyte protein aggregation in hermaphrodites (Extended Data Fig. 3h, i). We therefore hypothesized that lysosome acidification plays a regulatory role in germline proteostasis. If this is true, then lysosome acidification should occur in response to sperm. Remarkably, hermaphrodite, but not female, germlines exhibited acidic lysosomes (Fig. 2d, e; Extended Data Fig. 4a) that accumulated specifically in maturing, proximal oocytes in a V-ATPase-dependent manner (Fig. 2d–f; Extended Data Fig. 4a).
To visualize lysosomes, we expressed a GFP-fusion protein of LMP-1, the C. elegans orthologue of lysosome-associated LAMP2 (ref. 15). We observed LMP-1::GFP-positive vesicles throughout hermaphrodite (100%, n = 21) and female (100%, n = 24) germlines (Fig. 2g). In contrast, GFP-tagged VHA-13 was present in proximal, but not distal, germ cells (100%, n = 26; Fig. 2h, i). As V-ATPase puncta developed, they co-localized with LMP-1::GFP-positive vesicles (Fig. 2j) and predicted hotspots of acidity (Extended Data Fig. 4b, c). V-ATPase puncta were absent from the oocytes of females before mating (100%, n = 18; Fig. 2h, i), but appeared after mating (Extended Data Fig. 4d). Thus, we conclude that sperm trigger V-ATPase accumulation in proximal oocytes, thereby inducing lysosome acidification.
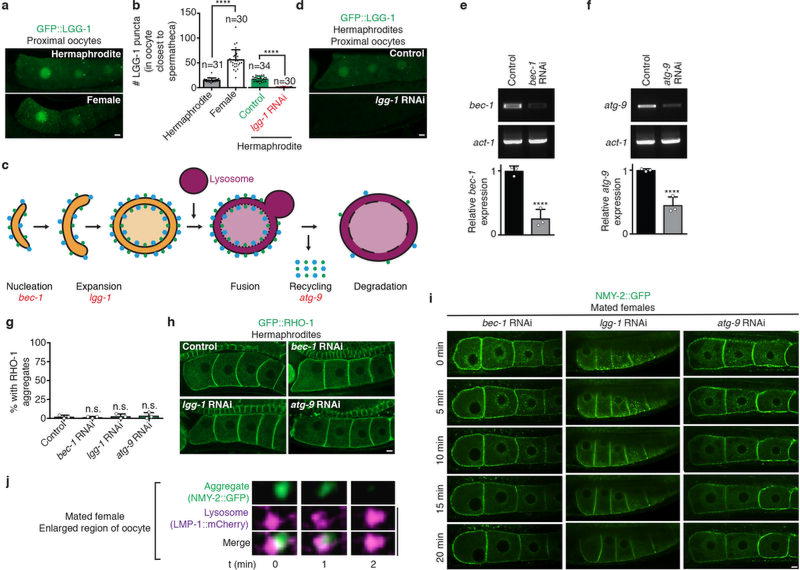
It seemed possible that lysosomes might actively clear the aggregates; for example, via macroautophagy, a lysosome-based degradation pathway14,16. In this pathway, autophagosomes fuse with acidic lysosomes. We found that autophagosomes labelled with GFP::LGG-1 (orthologous to LC3, ref. 16) accumulated in the oocytes of females (Extended Data Fig. 5a, b), consistent with their lack of acidic lysosomes. However, knockdown of macroautophagy genes did not induce protein aggregation in hermaphrodite oocytes, nor did it block the mobilization and clearance of oocyte protein aggregates in mated females (Extended Data Fig. 5c–i). Thus, macroautophagy does not appear to clear the aggregates. Moreover, when we tracked protein aggregates and lysosomes in real time, we observed lysosomes extending arm-like projections that enveloped sperm-mobilized aggregates immediately before their disappearance (Fig. 2k, l; Extended Data Fig. 5j). Thus, lysosomes appear to engulf the aggregates directly. This process resembles microautophagy17; however, microautophagy genes have not been identified in C. elegans, precluding further analysis.
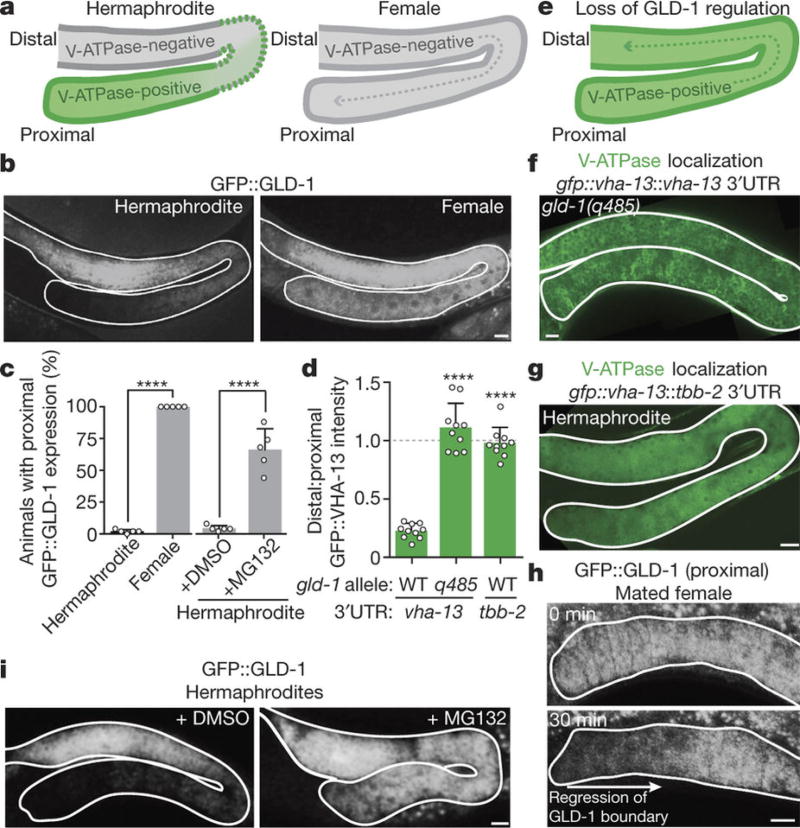
Next, we investigated the molecular control of V-ATPase accumulation. The rise in GFP::VHA-13 signal, starting at the bend of the hermaphrodite gonad (Figs. 2h, 3a), suggested that vha-13 expression might be repressed distally. GLD-1, a major translational repressor4, is abundant in the distal germline, where it binds the 3'-untranslated regions (UTRs) of many germline mRNAs18, but it is absent from proximal oocytes of hermaphrodites19 (Fig. 3b, c). Notably, a previous GLD-1-immunoprecipitation analysis18 identified mRNAs encoding 10 of the 21 C. elegans V-ATPase subunits, suggesting that GLD-1 may define the spatial expression of the V-ATPase.
Figure 3. Sperm trigger proteasome-dependent GLD-1 loss, releasing the block on synthesis of the lysosomal V-ATPase.
a, b, Schematic of V-ATPase localization in the germline (a, as shown in Fig. 2h), and reciprocal GFP::GLD-1 localization (b). c, Percentage of animals with proximal GFP::GLD-1 expression. Mean ± s.d. from five biological replicates, each of n = 50 animals. ****P <0.0001. d, Ratios (mean ± s.d.) of distal:proximal GFP::VHA-13 fluorescence intensities. n = 10 germlines per genotype. ****P < 0.0001. e–g, Expanded GFP::VHA-13 expression in germlines lacking GLD-1 repression. h, Proximal germline of a GFP::GLD-1-expressing female following mating. i, GFP::GLD-1 expression in hermaphrodites treated with DMSO or the proteasome inhibitor MG132. Bars, 10 µm.
To test this hypothesis, we examined GFP::VHA-13 localization in gld-1(q485)-null mutants20. As would be expected if GLD-1 repressed V-ATPase translation in distal regions, GFP::VHA-13 fluorescence was increased in distal germ cells lacking GLD-1 (100%, n = 15; Fig. 3d–f), and lysosomal acidity developed distally (Extended Data Fig. 6a). We verified that GLD-1 regulates vha-13 translation in a wild-type germline by expressing gfp::vha-13 with the 3' UTR of tbb-2 (encoding tubulin), which prevents GLD-1 binding21; again, GFP::VHA-13 expression extended distally (100%, n = 22; Fig. 3d, g).
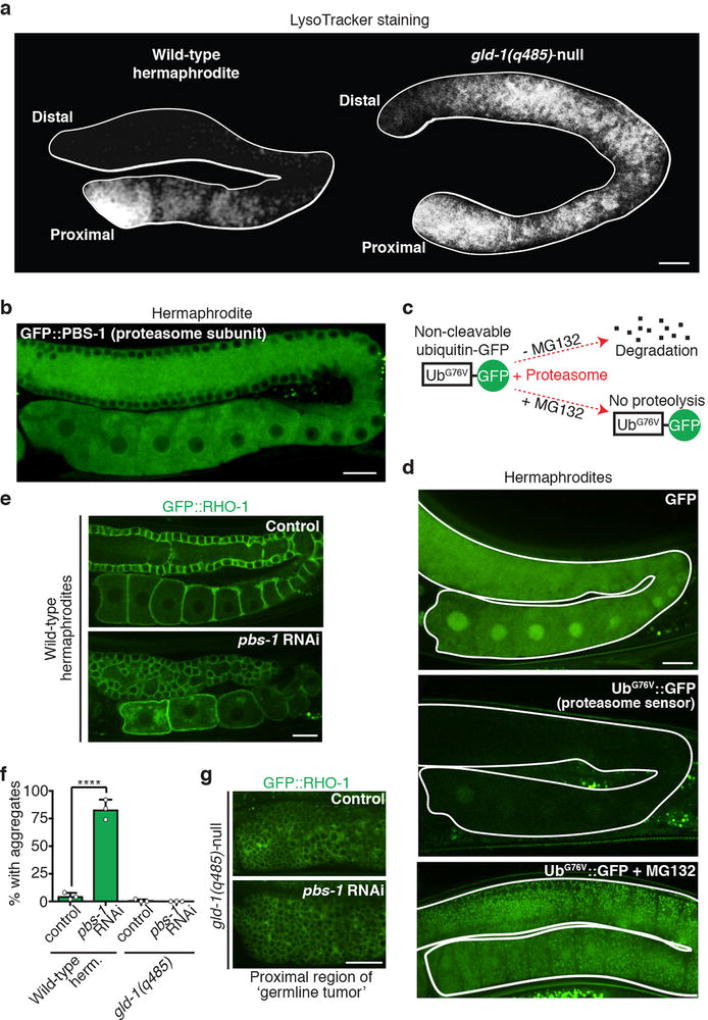
These findings suggest that sperm signalling prompts V-ATPase expression in proximal oocytes by removing GLD-1. Indeed, in female worms, GLD-1 was present in proximal as well as distal oocytes (Fig. 3a–c), but was eliminated from proximal oocytes after mating (Fig. 3h). Thus, GLD-1 degradation is an initiating event for proteostasis renewal. GLD-1 degradation was proteasome-dependent (Fig. 3c, i). The proteasome was present and active throughout the hermaphrodite germline (Extended Data Fig. 6b–d), implying that sperm signalling activates a target-specific pathway to degrade GLD-1. If the proteasome also degraded aggregates, then proteasome inhibition should lead to protein aggregation in gld-1-null mutants. This did not occur (Extended Data Fig. 6e–g), consistent with our finding that lysosomes engulf aggregates directly.
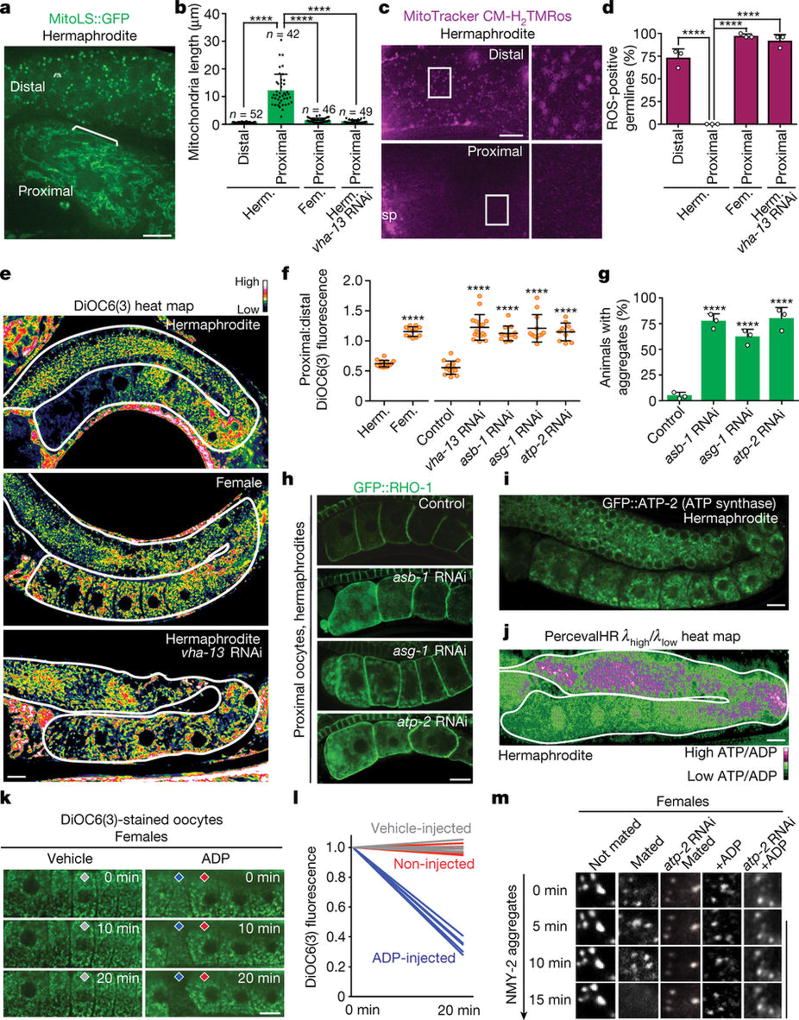
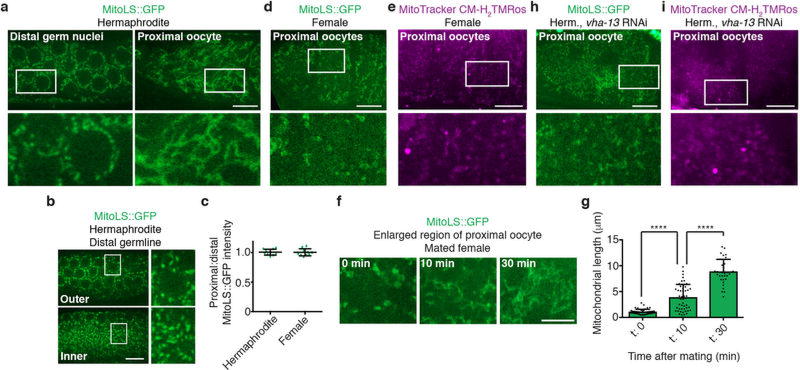
Because oocyte maturation would seem to be metabolically demanding, we investigated whether mitochondrial function might contribute to enhanced proteostasis. We detected changes in mitochondria during oocyte maturation. In normal hermaphrodites, mitochondria in distal oocytes were fragmented and reactive-oxygen species (ROS)-positive, whereas those in proximal oocytes were tubular, with lower ROS levels (Fig. 4a–d; Extended Data Fig. 7a, b). Fluorescence of a GFP-tagged mitochondria localization signal (MitoLS) was comparable in mitochondria with the different morphologies (Extended Data Fig. 7c), suggesting that the decrease in ROS was not a consequence of mitochondrial depletion. The shift to a tubular, low-ROS state required sperm and V-ATPase activity (Fig. 4b, d; Extended Data Fig. 7d–i). Therefore, we concluded that lysosome activation supports sperm-dependent changes in mitochondrial morphology and function.
Figure 4. Mitochondria aid proteostasis enhancement.
a, Mitochondria labelled with MitoLS::GFP. b, Lengths of mitochondria (mean ± s.d.) in distal and proximal germlines. c, Germlines stained with MitoTracker CM-H2TMRos. Sp, sperm. d, ROS-positive germlines. Mean ± s.d. from three biological replicates, each of n = 50 animals. ****P < 0.0001. e, DiOC6(3) heat maps. f, Proximal:distal DiOC6(3) fluorescence ratios (mean ± s.d.). ****P < 0.0001. g, h, GFP::RHO-1-aggregation in hermaphrodites after knockdown of ATP synthase subunits. Mean ± s.d. from three biological replicates, each of n = 50 animals. ****P < 0.0001. i, GFP::ATP-2 ATP synthase localization. j, PercevalHR λhigh/λlow heat map. k, l, DiOC6(3) staining of oocytes, showing mitochondrial membrane-potential fluorescence following ADP injection. n = 5 oocytes per condition. m, Aggregate movement. Bars, 10 µm.
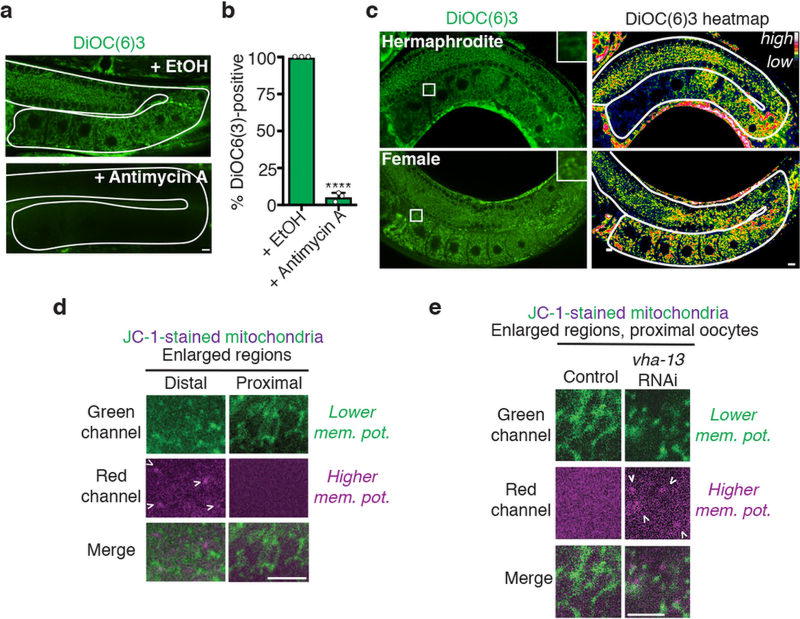
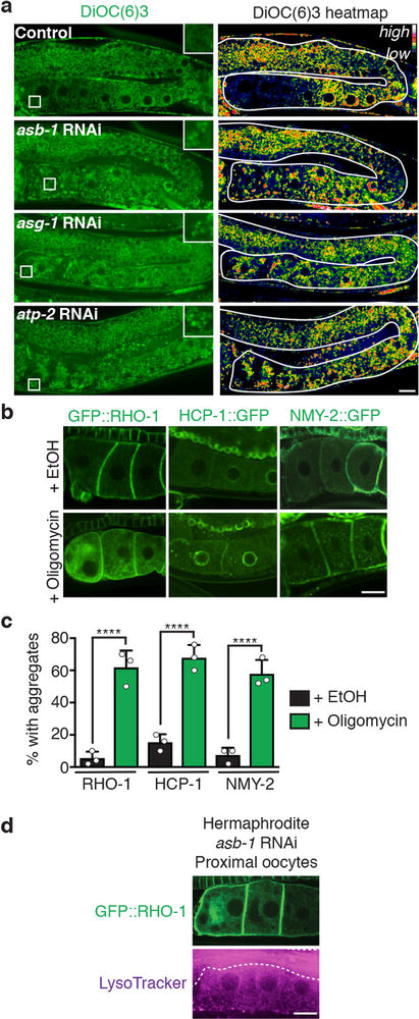
We hypothesized that these mitochondrial changes reflect a metabolic shift. The use of DiOC6(3) and JC-1, dyes that sense mitochondrial membrane potential12 (Extended Data Fig. 8a, b), indicated that distal, fragmented mitochondria had a high membrane potential (Fig. 4e; Extended Data Fig. 8c, d). This suggests that these mitochondria might be arrested in a ‘primed’ but inactive state. In contrast, the membrane potential decreased in tubular mitochondria of sperm-proximal oocytes, provided that the V-ATPase was present (Fig. 4e, f; Extended Data Fig. 8c–e). Inhibition of the mitochondrial ATP synthase, which normally dissipates the membrane-potential gradient to drive ATP production22, blocked the sperm-proximal reduction in mitochondrial membrane potential and the shift to a tubular morphology (Fig. 4f; Extended Data Fig. 9a). ATP-synthase inhibition also caused oocyte protein aggregation (Fig. 4g, h; Extended Data Fig. 9b, c) without compromising lysosomal acidity (Extended Data Fig. 9d). Thus, mitochondria play a causal role in proteostasis renewal, with ATP-synthase activity potentially acting downstream of lysosomes to enhance oocyte proteostasis.
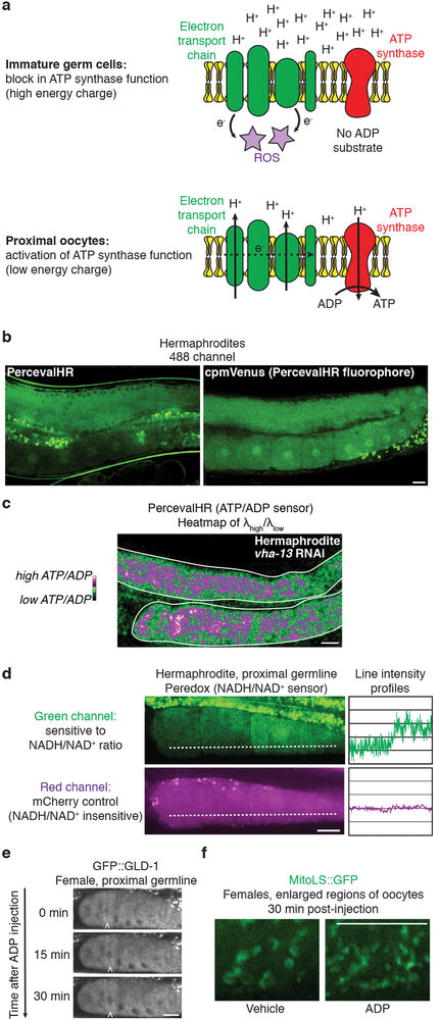
A fluorescently-tagged ATP synthase subunit, GFP::ATP-2, was expressed throughout the germline (Fig. 4i), so we reasoned that parameters other than expression were likely to promote ATP-synthase activity in response to sperm. One possibility was that ATP-synthase activity was gated by ADP levels22,23. In this model, ATP-synthase activity stalls when ADP is limiting; as ADP levels increase, ATP-synthase activation triggers proton flow, reducing membrane potential22,23 (Extended Data Fig. 10a). Using PercevalHR24, a ratiometric ATP:ADP sensor, we found that the ATP:ADP ratio, like the mitochondrial membrane potential, was high in distal oocytes but lower in sperm-proximal oocytes (Fig. 4j). Control experiments confirmed that the change in PercevalHR fluorescence depended on its ATP/ADP-sensing domain (Extended Data Fig. 10b).
Together, these findings predict that distal mitochondria are primed but inactive, and that during oocyte maturation, a rise in ADP levels unlocks the ATP synthase. Consistent with this model, injecting free ADP into oocytes of females was sufficient to reduce mitochondrial membrane potential (Fig. 4k, l). In principle, lysosomal V-ATPase activity should boost ADP levels, consistent with its localization where the ATP:ADP ratio has dropped (Figs 2h, 4j). We found that the V-ATPase was required not only to lower the mitochondrial membrane potential (Fig. 4e, f), but also to decrease the ATP:ADP ratio (Extended Data Fig. 10c). Thus, we infer that V-ATPase activity contributes to a transition from high to low energy charge, characteristic of activation of metabolism22.Additionally, the NADH:NAD+ ratio, monitored using Peredox25, was lower in sperm-proximal oocytes, also indicative of metabolic activation (Extended Data Fig. 10d).
When females were mated, sperm triggered dynamic movement of aggregates prior to their degradation (Fig. 4m; Extended Data Fig. 2d–f). This movement was blocked by ATP-synthase knockdown (Fig. 4m), which also caused protein aggregation despite lysosome acidification (Extended Data Fig. 9d). Therefore, aggregate movement may depend on cellular metabolic state26. To test this idea, we elicited ATP-synthase activity in oocytes of females by injecting ADP. ADP was sufficient to mobilize aggregates in the absence of sperm, and this effect required ATP synthase (Fig. 4m). ADP injection did not lead to aggregate clearance (Fig. 4m), presumably because it did not eliminate GLD-1 (which blocks lysosome activation) (Extended Data Fig. 10e), nor did it alter mitochondrial morphology (Extended Data Fig. 10f). However, as ADP stimulates aggregate movement, which probably primes cells for aggregate degradation when active lysosomes are present, these findings suggest a plausible mechanism by which a metabolic shift could facilitate proteostasis renewal.
Oocyte maturation is a well-conserved process in animals6. Lysosome activation occurs during oocyte maturation in C. elegans (Fig. 2f), but it is not known whether this is also true of other species. Therefore, we investigated lysosome activation during oocyte maturation in Xenopus laevis. Arrested Xenopus oocytes had no detectable lysosomal acidity (100%, n = 9; Fig. 5a). However, acidic lysosomes were seen in progesterone-stimulated Xenopus oocytes undergoing maturation6(100%, n = 13; Fig. 5a). Thus, lysosome acidification during oocyte maturation is evolutionarily conserved, and may enhance oocyte proteostasis in multiple species.
Figure 5. Conservation and model of a germline lysosomal switch.
a, LysoTracker-stained Xenopus oocytes. Bar, 20 µm. b, In C. elegans, arrested oocytes exhibit a relaxation in proteostasis, which is reversed just before fertilization when sperm signalling relieves GLD-1-mediated repression of V-ATPase synthesis. Activated lysosomes enhance oocyte proteostasis by engulfing and clearing protein aggregates, and by promoting a metabolic shift from a primed, quiescent state accompanied by elevated ROS to an active metabolic state that supports aggregate mobilization for removal. This mechanism may also underlie the sperm-dependent clearance of carbonylated proteins5.
In summary, we have shown that signalling from sperm triggers enhancement of proteostasis as C. elegans oocytes prepare for fertilization by coupling lysosome activation to oocyte maturation (Fig. 5b). Linking the quality-control switch to oocyte maturation may be biologically cost-effective5. Otherwise, it would be energetically demanding for oocytes to continuously cleanse themselves of damage while ‘waiting’ for fertilization, especially in species in which oocytes remain dormant for long periods. In such animals, signals distinct from MSPs, but similarly important for oocyte maturation6, may stimulate proteostasis renewal, as suggested by the results of our Xenopusexperiment. We note that an initial relaxation of proteostasis may actively promote germline quality control, as driving damaged proteins into aggregates may facilitate their removal27. In addition, consumption of aggregates could potentially help to provide raw materials to developing oocytes. Furthermore, defective mitochondrial fragments that cannot sustain a high membrane potential may also be sensed and destroyed. Keeping dormant oocytes in a metabolically charged state may prime the system for quick activation once metabolic enzymes, such as the lysosomal V-ATPase, are synthesized. How active metabolism initiates aggregate mobilization is unknown; it could involve energy and/or metabolite production, or possibly a cytoplasmic phase transition26. Finally, a striking implication of our study is that C. elegansgerm cells, similar to yeast28, naturally reverse multiple age-related phenotypes across generations. It will be of particular interest to test whether a lysosomal quality-control switch, potentially linked to metabolic activation, can be induced in the ageing soma to reverse age-related phenotypes, as a molecular competence for rejuvenation appears to also exist in somatic cells29,30.
Methods
Molecular biology
The pie-1 promoter was used for germline expression21 of all markers created in this study. Genes were expressed with their own 3' UTRs or with the germline-permissive, GLD-1-insensitive 3' UTR of tbb-2 (ref. 21).
Ppie-1::gfp::vha-13::tbb-2 UTR and Ppie-1::gfp::vha-13::vha-13 UTR
vha-13 was amplified by PCR from C. elegans genomic DNA and inserted into the pDONR221 Gateway entry vector. A KpnI restriction site was inserted just upstream of the vha-13 start codon. A GFP-coding sequence, which had 5' and 3' KpnI overhangs but lacked a stop codon, was inserted into the KpnI site, and correct orientation was verified. The 531 base pairs immediately downstream of the vha-13 stop codon were also amplified from C. elegans genomic DNA. This 3' UTR of vha-13was then swapped with the tbb-2 3' UTR of pCM1.36 using Gibson Assembly (New England Biolabs). pDONR P4-P1R Ppie-1 (pCM1.127), pDONR221 gfp::vha-13, and pDONR P2R-P3 containing either the tbb-23' UTR (pCM1.36) or the vha-13 3' UTR were combined within pCG150, a pDEST R4-R3 Gateway destination vector, using the MultiSite Gateway Three-Fragment Vector Construction Kit (Life Technologies).
Ppie-1::MitoLS::gfp::tbb-2 UTR
MitoLS::gfp was amplified by PCR from pPD96.32 (Fire Lab vector kit) and inserted into the pDONR221 Gateway entry vector. pDONR P4-P1R Ppie-1 (pCM1.127), pDONR221 MitoLS::gfp, and pDONR P2R-P3 tbb-2 3' UTR (pCM1.36) were combined within pCG150 using Gateway technology.
Ppie-1::lmp-1::gfp::lmp-1 UTR and Ppie-1::lmp-1::mcherry::lmp-1 UTR
lmp-1 was amplified by PCR from C. elegans genomic DNA and inserted into the pDONR221 Gateway entry vector. A KpnI restriction site was inserted in place of the lmp-1 stop codon. A GFP- or mCherry-coding sequence, with 5' and 3' KpnI overhangs and a stop codon, was inserted into the KpnI site, and correct orientation was verified. The 300 base pairs immediately downstream of the lmp-1 stop codon were also amplified from C. elegans genomic DNA and inserted into the pDONR P2R-P3 Gateway entry vector. pDONR P4-P1R Ppie-1, pDONR221 containing lmp-1::gfp or lmp-1::mcherry, and pDONR P2R-P3 lmp-1 3' UTR were combined within the pDEST R4-R3 Gateway destination vector using Gateway technology.
Ppie-1::gfp::atp-2::atp-2 UTR
atp-2 was amplified by PCR from C. elegans genomic DNA and inserted into the pDONR221 Gateway entry vector. A BglII restriction site was inserted just upstream of the atp-2 start codon. A GFP-coding sequence, with 5' and 3' BglII overhangs but lacking a stop codon, was inserted into the BglII site, and correct orientation was verified. The 309 base pairs immediately downstream of the atp-2 stop codon were also PCR-amplified from C. elegans genomic DNA. This atp-2 3' UTR was inserted into the pDONR P2R-P3 Gateway entry vector. pDONR P4-P1R Ppie-1, pDONR221 gfp::atp-2, and pDONR P2R-P3 atp-2 3' UTR were combined within the pDEST R4-R3 Gateway destination vector using Gateway technology
Ppie-1::percevalhr::tbb-2 UTR, Ppie-1::peredox::tbb-2 UTR, and Ppie-1::cpmvenus::tbb-2 UTR
Sequences encoding PercevalHR and Peredox were codon-optimized for C. elegans with the C. elegans codon adaptor tool31, with three introns inserted in each sequence. Gene fragments were synthesized by Integrated DNA Technologies, and combined into the pDONR221 Gateway entry vector using Gibson assembly. The cpmVenus-encoding sequence from codon-optimized PercevalHR was also amplified and inserted into the pDONR221 entry vector. This sequence included two introns. pDONR P4-P1R Ppie-1, pDONR221 containing percevalhr, peredox, or cpmvenus, and pDONR P2R-P3 tbb-2 3' UTR were combined within the pDEST R4-R3 Gateway destination vector using Gateway technology.
Ppie-1::gfp::pbs-1::pbs-1 UTR
pbs-1 was amplified by PCR from C. elegans genomic DNA and inserted into the pDONR221 Gateway entry vector. A KpnI restriction site was inserted just upstream of the pbs-1 start codon. A GFP-coding sequence, with 5' and 3' KpnI overhangs but lacking a stop codon, was inserted into the KpnI site, and correct orientation was verified. The 214 base pairs immediately downstream of the pbs-1 stop codon were also amplified from C. elegans genomic DNA. This pbs-1 3' UTR was inserted into the pDONR P2R-P3 Gateway entry vector. pDONR P4-P1R Ppie-1, pDONR221 gfp::pbs-1, and pDONR P2R-P3 pbs-1 3' UTR were combined within the pDEST R4-R3 Gateway destination vector using Gateway technology.
Ppie-1::gfp::tbb-2 UTR and Ppie-1::ub G76V ::gfp::tbb-2 UTR
gfp was amplified by PCR and inserted into the pDONR221 Gateway entry vector. To create a proteasome sensor, a gene fragment encoding the non-cleavable ubiquitin moiety UbG76V (ref. 32) was codon-optimized for C. elegans31, synthesized by Integrated DNA Technologies, and inserted before the gfp start codon using Gibson assembly. pDONR P4-P1R Ppie-1, pDONR221 containing gfp or ubG76V::gfp, and pDONR P2R-P3 tbb-2 3' UTR were combined within the pDEST R4-R3 Gateway destination vector using Gateway technology.
C. elegans strain generation and maintenance
Animals expressing germline markers were maintained at 25 °C to delay transgene silencing21. The remaining experiments were performed at 20 °C. For ageing experiments, adult animals were transferred to fresh plates every 2 d. Day 10 or older animals were designated as ‘old’, as in other studies7.
The following C. elegans strains were provided by the CGC: SA115 (unc-119(ed3) III; tjIs1[Ppie-1::gfp::rho-1, unc-119(+)]); OD7 (unc-119(ed3) III; ltIs3[Ppie-1::hcp-1::gfp-tev-Stag, unc-119(+)]; JJ1473 (unc-119(ed3) III; zuIs45[Pnmy-2::nmy-2::gfp, unc-119(+)] V); RT130 (pwIs130[Pvit-2::vit-2::gfp]); KG524 (gsa-1(ce94gf) I); JK1466 (gld-1(q485)/dpy-5(e61) unc-13(e51) I); JH2060 (unc-119(ed3) III; axIs1498[Ppie-1::gfp::gld-1::gld-1 UTR, unc-119(+)]); HH142 (fer-1(b232) I); BA3 (fer-3(hc3) III); BA708 (spe-9(hc52) I); OD95 (unc-119(ed3) III; ltIs37[Ppie-1::mcherry::his-58, unc-119(+)] IV; ltIs38[Ppie-1::gfp::PH, unc-119(+)]). K. Sato (Gunma University) provided GK682 (unc-119(ed3) III; dkIs398[Ppie-1::gfp::lgg-1, unc-119(+)]).
N2B and CF2137 (fem-1(hc17) IV) strains were from our own stocks.
Strain generation: genetic crosses
The following C. elegans strains were created by standard mating techniques: CF4115 (fem-1(hc17) IV; tjIs1[Ppie-1::gfp::rho-1, unc-119(+)]); CF4116 (ltIs37[Ppie-1::mcherry::his-58, unc-119(+)]; CF4134 (fer-1(b232) I; tjIs1[Ppie-1::gfp::rho-1, unc-119(+)]); CF4143 (spe-9(hc52) I; tjIs1[Ppie-1::gfp::rho-1, unc-119(+)]); CF4144 (fer-3(hc3) II; tjIs1[Ppie-1::gfp::rho-1, unc-119(+)]); CF4151 (fem-1(hc17) IV; zuIs45[Pnmy-2::nmy-2::gfp, unc-119(+)] V); CF4180 (fem-1(hc17) IV; dkIs398[Ppie-1::gfp::lgg-1, unc-119(+)]); CF4182 (unc-119(ed3) III; fem-1(hc-17) IV; ltIs3[Ppie-1::hcp-1::gfp-tev-Stag, unc-119(+)]); CF4234 (fem-1(hc17) IV; axIs1498[Ppie-1::gfp::gld-1::gld-1 UTR, unc-119(+)]); CF4336 (gsa-1(ce94gf) I; tjIs1[Ppie1::gfp::rho-1, unc-119(+)]); CF4439 (gld-1(q485)/dpy-5(e61) unc-13(e51) I; tjIs1[pie-1::gfp::rho-1 + unc-119(+)]).
Strain generation: microinjection
Germline gene expression was achieved using a microinjection-based protocol with diluted transgenic DNA33. Ppie-1::gfp::vha-13::tbb-2 UTR, Ppie-1::gfp::vha-13::vha-13 UTR, Ppie::1::MitoLS::gfp::tbb-2 UTR, Ppie-1::lmp-1::gfp::lmp-1 UTR, Ppie-1::lmp-1::mcherry::lmp-1 UTR, Ppie-1::gfp::atp-2::atp-2 UTR, Ppie-1::percevalhr::tbb-2 UTR, Ppie-1::peredox::tbb-2 UTR, Ppie-1::cpmvenus::tbb-2 UTR, Ppie-1::gfp::pbs-1::pbs-1 UTR, Ppie-1::gfp::tbb-2 UTR, or Ppie-1::ubG76V::gfp::tbb-2 UTR constructs (5 ng µl−1) were co-injected with PvuII-digested genomic DNA fragments from E. coli (100 ng µl−1) using a standard microinjection procedure34. For expression in female animals, fem-1(hc17) worms raised at a permissive temperature (20 °C) were injected at day 1 of reproductive adulthood, and progeny were subsequently shifted to the restrictive temperature (25 °C) before imaging. For expression in a gld-1genetic-null background, gld-1(q485)/dpy-5(e61) unc-13(e51)heterozygotes (strain JK1466) were injected at day 1 of reproductive adulthood, and GFP-positive gld-1(q485)/gld-1(q485) F1 homozygotes were selected for imaging.
Female and self-sterile strains
The fem-1(hc17) temperature-sensitive allele35 was used to generate female adult animals lacking sperm. Eggs from fem-1(hc17) animals that had been raised at a permissive temperature (20 °C) were shifted to the restrictive temperature (25 °C) and maintained at this elevated temperature throughout development until the adults were imaged. Self-sterility was likewise induced in temperature-sensitive fer-1(b232), fer-3(hc3) and spe-9(hc52) strains.
Mating experiments
Males expressing Ppie-1::mcherry::his-58 to mark sperm nuclei (25–100 animals) were placed on a 35-mm NG-agar plate with a small lawn of OP50 bacteria. Hermaphrodites or females were transferred individually to the centre of these plates, and mating events were monitored using a benchtop stereomicroscope. Efficient transfer of sperm was confirmed by the appearance of mCherry-marked sperm in the uterus and spermatheca. When necessary, fluorescence intensities or mitochondrial lengths were quantified using Volocity software. Controls were performed to ensure that the disappearance of protein aggregates was not due to photobleaching.
Microscopy
Standard fluorescence imaging was performed with either an UltraVIEW Vox confocal imaging system (PerkinElmer), which includes an Olympus IX70 microscope, a CSU-X1 confocal scanner (Yokogawa), 488 nm and 561 nm solid-state lasers, and Volocity software; or a Nikon/Andor confocal spinning disk system, equipped with a Nikon Eclipse Ti microscope, a CSU-X1 confocal scanner (Yokogawa), 405, 488, and 561 nm solid-state lasers, and NIS Elements imaging software. FRAP experiments were performed using the Leica TCS SP8 confocal imaging platform, equipped with a DMi8 microscope, a resonant scanner, and a white-light laser tuned to 488 nm for detection of GFP-tagged aggregation-prone proteins.
Mounting worms for microscopy
Pads made of 4% agarose (GeneMate) were dried briefly on Kimwipes (Kimtech) and then transferred to microscope slides. Around 1 µl of 2 mM levamisole (Sigma) was pipetted onto the centre of the agarose pads. Animals were transferred to the levamisole drop, and a cover slip was placed on top before imaging.
Staining of the C. elegans germline
NG agar containing 2 µM LysoTracker Red DND-99 (Life Technologies), 2 µM LysoSensor Blue DND-167 (Life Technologies), 2 µM MitoTracker CM-H2TMRos (Life Technologies), or 2 µM DiOC6(3) (Life Technologies) was poured into petri dishes. After pouring, the plates were dried for 2 d. The plates were then seeded with bacterial aliquots containing 2 µM of the respective dye and allowed to sit for 2 d. Eggs from adult animals were harvested by bleaching and placed on dyed NG plates. Animals were raised at 25 °C for ~3–4 d before imaging. A similar protocol was followed for Proteostat staining, except 1 µl of the Proteostat Aggresome Detection Reagent (Enzo Life Sciences) was added per 2.5 ml of NG agar before plate pouring, and the same dilution of this reagent was applied to bacterial aliquots used to seed the plates. Some knockdown experiments required animals to be transferred to different plates during development (see below). In these cases, consecutive plates contained the same dye. When gonad extrusion was required, adult animals that had been raised on dyed plates were nicked with a scalpel to free the gonad arm19, and then fixed in 3% paraformaldehyde (Electron Microscopy Sciences) prior to imaging. To stain germlines with JC-1 dye, 15 µM JC-1 (ThermoFisher) was injected into germlines, and animals were allowed to recover on NG agar seeded with OP50 for 4–6 h before imaging.
Imaging of metabolic sensors
The ATP:ADP ratiometric sensor PercevalHR contains a cpmVenus fluorophore flanked by the ADP-binding bacterial protein GlnK24. Images were acquired for the fluorophore’s two excitation peaks, using a 525/36 nm emission filter with excitation at 488 nm (corresponding to ATP-bound PercevalHR); and at 405 nm (corresponding to the ADP-bound PercevalHR)24. PercevalHR images are presented as a heatmap of λhigh/λlow (488 nm/405 nm) intensities, generated using a custom LUTS profile in ImageJ. Imaging of cpmVenus expressed without ATP:ADP-sensitive GlnK was performed as a control, using 488 nm excitation and a 525/36 nm emission filter. The NADH:NAD+ ratiometric sensor Peredox contains a T-Sapphire fluorophore integrated within the NADH-binding bacterial protein Rex, along with a tandem C-terminal mCherry25. Binding of NADH increases 405 nm-excited fluorescence through the 525/36 nm emission filter, but does not affect the fluorescence of the tandem mCherry (a normalizing control), which was imaged using 561 nm excitation and a 605/70 nm emission filter.
RNA interference
All RNAi clones were from the J. Ahringer lab collection11. An empty L4440 vector was used as a negative control. RNAi bacteria (confirmed by DNA sequencing) were seeded onto NG plates supplemented with 100 ng µl−1 carbenicillin and 1.0 mM isopropyl β-D-1-thiogalactopyranoside. Bacteria were allowed to form a lawn for 2 d at 30 °C before animals were transferred to plates. RNAi feeding commenced at different times of animal development depending on the experiment.
Knockdowns initiated at hatching
Knockdowns of autophagy genes (bec-1, lgg-1, and atg-9) were initiated at hatching. In brief, eggs from adult animals were harvested by bleaching and placed directly on RNAi bacteria. Animals were raised on RNAi bacteria for ~3–4 d before imaging or mating on the first day of adulthood.
Knockdowns initiated at the late L4 stage
The goa-1 knockdown and knockdowns of all tested V-ATPase, proteasome, and mitochondrial ATP synthase genes were initiated at the late L4 stage. In brief, animals were raised on NG-agar plates seeded with OP50 bacteria until late L4, when they were washed in M9 buffer and transferred to RNAi bacteria. When applicable, imaging was performed 24–48 h later.
Lifespan analysis
Late L4 hermaphrodites were transferred to NG agar seeded with control or vha-13 RNAi bacteria. The pre-fertile period of adulthood was set as Day 0. Adult animals were transferred to fresh plates every 2 d. Plates were maintained at 20 °C throughout analysis. Animals that exploded, bagged, or crawled off plates were censored at the time of the event, as is standard practice.
Drug, metabolite, and chemical treatments
To inhibit proteasome activity, adult animals were incubated overnight in S basal liquid medium with or without 50 µM MG132 (Sigma) at 20 °C. To neutralize lysosomal acidity with a weak base, adults were incubated in M9 buffer with or without 200 mM NH4Cl (Fisher Scientific) for 4 h at room temperature. To block V-ATPase proton pump activity, 1 µM bafilomycin A1 (Sigma) dissolved in DMSO was injected into the gonad arms of hermaphrodites, and worms were allowed to recover overnight on NG agar plates before imaging. To eliminate mitochondrial membrane potential, adult hermaphrodites were placed on 60-mm NG-agar plates that had previously been spotted with 50 µl of 0.01 M antimycin A (Sigma) dissolved in 100% ethanol. To inhibit mitochondrial ATP-synthase activity, adult hermaphrodites were placed on NG-agar plates containing 50 µM oligomycin (Tocris Bioscience) 12 h before imaging. For ADP injection experiments, 1 mM ADP (Sigma) dissolved in water was loaded into microinjection needles (100 mm; World Precision Instruments), and injected directly into the individual oocytes of females, or hermaphrodites treated with ATP synthase RNAi, for immediate imaging.
RNA preparation and RT-PCR
Whole-animal RNA was isolated from control- or RNAi-treated animals using the PureLink™ RNA Mini Kit (Ambion). Ten animals were lysed per sample, and RNA was extracted according to the manufacturer’s protocol. First strand cDNA was synthesized from RNA samples using a oligo(dT)18 primer and the Maxima H Minus First Strand cDNA Synthesis Kit (Thermo Scientific). bec-1, atg-9, and act-1 cDNA fragments were then amplified using internal primers that spanned exon/exon boundaries. Amplified products were resolved on a 1% agarose gel stained with 1× SYBR Safe (Invitrogen).
Maturation and imaging of Xenopus oocytes
Defolliculated Xenopus laevis oocytes were provided by Ecocyte Bioscience. After washing in OR2 liquid medium (82.5 mM NaCl, 2.5 mM KCl, 1 mM CaCl2, 1 mM MgCl2, 1 mM Na2HPO4, 5 mM HEPES pH 7.8), oocytes were stained with 500 nM LysoTracker Red DND-99 (Life Technologies) and incubated with or without 5 µg ml−1 progesterone (Sigma–Aldrich) for at least 10 h at room temperature. For imaging, oocytes were transferred to 1/3× OR2 liquid medium containing 5% Ficoll PM 400 (Sigma–Aldrich) and placed in 1/16-inch diameter holes created by steel balls (VXB Bearing) in 2% agarose pads.
Statistical analysis and quantification
Statistical tests with appropriate underlying assumptions on data distribution and variance were used. No statistical method was employed to predetermine sample size. The experiments were not randomized, except that animals were pooled before being exposed to different experimental conditions. The investigators were not blinded to allocation during experiments or analysis. Statistical analysis and graphing were performed using GraphPad Prism 6 for Mac OS X. All nnumbers refer to sample size.
General scoring of phenotypes
Experiments to determine percentages of germlines with protein aggregation, acidic lysosomes, proximal GLD-1, mitochondrial ROS, or mitochondrial membrane potential were performed for least three biological replicates, and 50 animals were scored for each genotype or condition per trial. Where pertinent, mean percentages are plotted with s.d., and unpaired, two-tailed t-tests were performed using Prism software to determine statistical significance. When different genotypes or conditions resulted in opposite phenotypes entirely (that is, 0% versus 100%), sample size and percentages are noted in the text (Figs 2g, 2h, 3f, 3g and 5a).
Protein-aggregate fluorescence with mating
Average pixel intensities were measured for set bounding areas in ImageJ. Fluorescence intensities were compared either before and after mating a female, or over the course of an hour for non-mated control worms. Individual data points are plotted along with s.d. for each aggregation-prone protein at the different time points in each experiment, and a paired, two-tailed t-test was performed using Prism software to determine statistical significance.
Recovery of fluorescence after photobleaching
Relative fluorescence intensity (RFI) for a region of interest (ROI) was determined from the equation RFI = (Tt/Ct)/(T0/C0), where T0 is the intensity in the ROI before photobleaching; Tt, the intensity in the ROI at a defined time after photobleaching; C0, the intensity in the non-bleached part of the structure before photobleaching; and Ct, the intensity in the non-bleached part of the structure after photobleaching. All intensities were measured using ImageJ software and corrected for background before calculations were performed. Three biological replicates were performed in hermaphrodites and females for each protein. Mean RFI at each time point is plotted with s.d.
Quantification of lifespan
Lifespan following control (n = 244 animals) or vha-13 RNAi (n = 282 animals) was analysed using OASIS36(http://sbi.postech.ac.kr/oasis). Mean lifespans are noted in plots.
Co-localization of acidic lysosomes and the V-ATPase
Puncta in the most proximal oocyte in ten different hermaphrodites were scored. Puncta were grouped into three categories: those positive for LysoTracker alone, those positive for the V-ATPase alone, and those positive for both LysoTracker and the V-ATPase. Mean percentages are plotted with s.d. for each category.
Co-localization of protein aggregates with lysosomes during clearance
NMY-2::GFP protein aggregates were tracked together with LMP-1::mCherry in five different females that had been mated. Aggregates (n = 34) were grouped into those that showed clear association with lysosomes at their disappearance, and those that disappeared without showing lysosome association (perhaps owing to loss in tracking between frames).
Gradients of V-ATPase and Peredox fluorescence intensities in the germline
Using ImageJ software, GFP::VHA-13 fluorescence intensities were scored along a medial line tracking from distal to proximal regions of the germline. Positions along the tracked line were normalized for hermaphrodite and female worms. In addition, summed GFP::VHA-13 fluorescence intensities for set areas in distal and proximal regions were scored using ImageJ, and ratios of distal-to-proximal fluorescence intensities were averaged for ten germlines per genotype. Mean ratios are plotted with s.d., and an unpaired, two-tailed t-test was performed using Prism software to determine statistical significance. Peredox fluorescence (in both green and red channels) was also scored along a line that spanned the proximal germline using ImageJ software.
Mitochondrial fluorescence intensities
Summed MitoLS::GFP or DiOC6(3) fluorescence intensities for set areas in distal and/or proximal regions were scored using ImageJ. Ratios of proximal-to-distal fluorescence intensities were averaged for at least ten germlines per genotype or condition. Mean ratios are plotted with s.d., and unpaired, two-tailed t-tests were performed using Prism software to determine statistical significance. DiOC6(3) fluorescence intensities before and after ADP (or vehicle) injection were scored for five animals each. Where appropriate, DiOC6(3) fluorescence is presented as a heatmap generated using a custom LUTS profile in ImageJ.
Lengths of germline mitochondria
Mitochondrial lengths (scored using Volocity software) were determined for distal germ cells and proximal oocytes of hermaphrodites, proximal oocytes of hermaphrodites treated with vha-13 RNAi, and proximal oocytes of females. At least 30 different mitochondria were scored for each genotype or condition (as noted in figures). Mean mitochondrial lengths with s.d. are plotted for each genotype or condition, and an unpaired, two-tailed t-test was performed using Prism software to determine statistical significance. Similar analyses were performed for the mitochondria of oocytes of females before and after mating.
Quantification of LGG-1-positive autophagosomes
LGG-1 puncta were counted in the most proximal oocyte of wild-type hermaphrodites and females, or in hermaphrodites treated with control or lgg-1 RNAi. At least 30 worms were analysed for each genotype or condition. The mean number of LGG-1-positive puncta is presented with s.d. for each genotype or condition, and an unpaired, two-tailed t-test was performed using Prism software to determine statistical significance.
Relative expression of autophagy gene transcripts
RT–PCR experiments were performed in triplicate. Band intensities were quantified using ImageJ software. Band intensities for autophagy transcripts were normalized to act-1, which encodes a C. elegans actin isoform. The average normalized intensity for control experiments was set to an arbitrary value of 1. Mean normalized intensities are plotted with s.d. for each condition, and an unpaired, two-tailed t-test was performed using Prism software to determine statistical significance.
Data availability
All relevant data supporting the findings of this study have been included in the paper and the supplementary files. Graph source data for Figs 1, 2, 3, 4 and Extended Data Figs 2, 3, 4, 5, 6, 7, 8, 9, 10 are provided with the paper. Gel source data are provided in Supplementary Fig. 1.
Extended Data
Extended Data Figure 1. Pattern of germline protein aggregates.
a–c, Full gonad images of three aggregation-prone proteins in young hermaphrodites and females. Enlarged regions of different parts of the gonad are also shown. Bars, 10 µm.
Extended Data Figure 2. Signals from sperm reduce protein aggregation in oocytes.
a–f, Time-lapse images of aggregation-prone proteins in oocytes of females, or females after mating. g–i, Localized fluorescence intensities in oocytes of mated females and non-mated controls. Mean ± s.d. for n = 10 aggregate sites. NS, not significant. ****P < 0.0001. j, k, GFP::RHO-1-aggregation in females and sperm-defective hermaphrodite mutants that still produce MSPs. Mean ± s.d. from three biological replicates, each of n = 50 animals. ****P < 0.0001. Bars, 10 µm.
Extended Data Figure 3. V-ATPase suppression of oocyte protein aggregation.
a, Lifespan, mean lifespans in parentheses. b–d, GFP::RHO-1-expressing hermaphrodites with catalytic (V1) or membrane-anchoring (V0) V-ATPase subunits knocked down. Animals with oocyte protein aggregation counted. Mean ± s.d. from three biological replicates, each of n = 50 animals. ****P < 0.0001. e, Mating after vha-13 knockdown. f, GFP::RHO-1-expressing gsa-1(ce94gf) hermaphrodites following control or vha-13 RNAi. g, Percentage of gsa-1(ce94gf) animals with oocyte protein aggregation. Mean ± s.d. from three biological replicates, each of n = 50 animals. ****P < 0.0001. h, DMSO- or bafilomycin A1-injected germlines. i, Control or NH4Cl-treated germlines. Bars, 10 µm.
Extended Data Figure 4. Regulation of lysosomal acidity in the germline.
a, Hermaphrodite and female worms stained with LysoSensor Blue DND-99. Gonads are outlined. b, Percentage of puncta that are positive for LysoTracker and/or GFP::VHA-13. Mean ± s.d. from n = 10 proximal oocytes. c, Co-localization (arrows) of GFP::VHA-13 and LysoTracker puncta in an oocyte (enlarged region). d, Proximal oocyte before and after mating in a GFP::VHA-13-expressing female. Bars, 5 µm.
Extended Data Figure 5. Aggregates are not cleared by macroautophagy.
a, GFP::LGG-1-expressing germlines. b, Number of autophagosomes (mean ± s.d.) in the most proximal oocyte. c, Schematic of macroautophagy. d, GFP::LGG-1 after control or lgg-1 RNAi. e,f, Quantification of macroautophagy gene expression by RT-PCR. Normalized expression (mean ± s.d.) was scored for three biological replicates. ****P < 0.0001. The gel source data are shown in Supplementary Figure 1. g, h, GFP::RHO-1-expressing hermaphrodites treated with macroautophagy-gene RNAi. Percentage of animals with oocyte protein aggregation. Mean ± s.d. from three biological replicates, each of n = 50 animals. ****P < 0.0001. i, Matings after macroautophagy-gene RNAi. j, Time-lapse images of aggregate clearance. Bars, 5 µm.
Extended Data Figure 6. Proteasome involvement in germline proteostasis.
a, LysoTracker-stained dissected germlines. b, GFP::PBS-1 localization. c, d, Schematic and imaging of proteasome sensor UbG76V::GFP. Active proteasomes degrade UbG76V::GFP, unless inhibited by MG132. e–g, GFP::RHO-1-aggregation following control or proteasomal pbs-1 RNAi. The gld-1(q485) mutation precluded aggregation following pbs-1 RNAi. This finding fits the model that the proteasome degrades GLD-1, but not the aggregates, consistent with aggregate engulfment by lysosomes. However, we note that proximal gld-1 germ cells, which form tumors20, could potentially be non-permissive for aggregation. Mean ± s.d. from three biological replicates, each of n = 50 animals. ****P < 0.0001. Bars, 10 µm.
Extended Data Figure 7. Sperm-induced changes in mitochondrial morphology and ROS levels require V-ATPase function.
a, MitoLS::GFP in germ cells of hermaphrodites. b, Different z-planes for MitoLS::GFP in the same distal germline. c, Proximal:distal MitoLS::GFP fluorescence ratios (mean ± s.d.) for n = 10 germlines. d, e, Proximal oocytes from MitoLS::GFP-expressing or MitoTracker CM-H2TMRos-stained females. f, g, Mitochondria from proximal oocytes in MitoLS::GFP-expressing females before and after mating. Mitochondrial lengths (mean ± s.d.). ****P < 0.0001. h, i, Proximal oocytes from MitoLS::GFP-expressing or MitoTracker CM-H2TMRos-stained hermaphrodites after vha-13 RNAi. Bars, 10 µm.
Extended Data Figure 8. Regulation of mitochondrial membrane potential in the germline.
a, DiOC6(3)-stained germlines from control (ethanol solvent)- or antimycin-treated hermaphrodites. b, Percentage of DiOC6(3)-stained germlines. Mean ± s.d. from three biological replicates, each of n = 50 animals. ****P < 0.0001. c, Real-colour and heatmap images of DiOC6(3)-stained germlines. d, JC-1-stained mitochondria in the distal and proximal germline of a wild-type hermaphrodite. e, JC-1-stained proximal germline mitochondria following control or vha-13 RNAi. Bars, 5 µm.
Extended Data Figure 9. ATP-synthase inhibition prevents the reduction in mitochondrial membrane potential in proximal oocytes and blocks aggregate clearance.
a, Real-colour and heatmap images of DiOC6(3)-stained germlines after RNAi of genes encoding ATP synthase subunits. b, c, Aggregation-prone proteins in control (ethanol solvent)- or oligomycin-treated hermaphrodites. Percentage of animals with oocyte protein aggregation. Mean ± s.d. from three biological replicates, each of n = 50 animals. ****P < 0.0001. d, LysoTracker reveals lysosome acidification in GFP::RHO-1-expressing hermaphrodites following asb-1 knockdown. Dotted line, intestine. Bars, 10 µm.
Extended Data Figure 10. Activation of germ cell metabolism.
a, Immature germ cells arrest with a high ATP:ADP ratio and a high energy charge, which are reversed in response to sperm signals as ADP levels rise and unlock the ATP synthase. These changes reflect a shift from a resting to an active metabolic state22,23. b, 488 nm-excited fluorescence of PercevalHR and cpmVenus. c, Heatmap of the PercevalHR λhigh/λlow ratio after vha-13 knockdown. d, Peredox fluorescence in a hermaphrodite germline, with line profiles. e, f, GFP::GLD-1 and mitochondrial morphology in ADP- or vehicle-injected female oocytes. Bars, 10 µm.
Supplementary Material
Acknowledgments
We thank members of the Kenyon laboratory and our colleagues at Calico for discussions and comments on the manuscript, and the Calico microscopy core, especially M. Ingaramo, for help with microscopy and sensors. We thank the E. Blackburn and P. O’Farrell laboratories for sharing equipment at UCSF. K. Sato provided the Ppie-1::gfp::lgg-1 strain. Other strains were provided by the CGC, funded by the NIH Office of Research Infrastructure Programs (P40 OD010440). Research was performed at UCSF and then Calico, and was supported at UCSF by the George and Judy Marcus Family Foundation, the Life Extension and Chuan Lyu Foundations, and by NIH grant R37/R01 AG11816 to C.K. C.K. is now Vice President of Aging Research at Calico Life Sciences, which supported the research done at Calico. K.A.B. is an Honorary Fellow of the Jane Coffin Childs Memorial Fund.
Footnotes
Contributions
K.A.B. and C.K. designed experiments, interpreted data, and wrote the manuscript. K.A.B. performed all experiments.
Competing interests
The authors declare no competing financial interests.
References
- 1.Medvedev ZA. On the immortality of the germ line: genetic and biochemical mechanism. Mech Ageing Dev. 1981;17:331–359. doi: 10.1016/0047-6374(81)90052-x. [DOI] [PubMed] [Google Scholar]
- 2.Miller MA, et al. A sperm cytoskeletal protein that signals oocyte meiotic maturation and ovulation. Science. 2001;291:2144–2147. doi: 10.1126/science.1057586. [DOI] [PubMed] [Google Scholar]
- 3.Ohkuma S, Moriyama Y, Takano T. Identification and characterization of a proton pump on lysosomes by fluorescein-isothiocyanate-dextran fluorescence. Proc Natl Acad Sci U S A. 1982;79:2758–2762. doi: 10.1073/pnas.79.9.2758. [DOI] [PMC free article] [PubMed] [Google Scholar]
- 4.Nousch M, Eckmann CR. Translational control in the Caenorhabditis elegans germ line. Adv Exp Med Biol. 2013;757:205–247. doi: 10.1007/978-1-4614-4015-4_8. [DOI] [PubMed] [Google Scholar]
- 5.Goudeau J, Aguilaniu H. Carbonylated proteins are eliminated during reproduction in C. elegans. Aging Cell. 2010;9:991–1003. doi: 10.1111/j.1474-9726.2010.00625.x. [DOI] [PubMed] [Google Scholar]
- 6.Greenstein D. Control of oocyte meiotic maturation and fertilization. WormBook. 2005 doi: 10.1895/wormbook.1.53.1. [DOI] [PMC free article] [PubMed] [Google Scholar]
- 7.David DC, et al. Widespread protein aggregation as an inherent part of aging in C. elegans. PLoS Biol. 2010;8:e100045. doi: 10.1371/journal.pbio.1000450. [DOI] [PMC free article] [PubMed] [Google Scholar]
- 8.McCarter J, Bartlett B, Dang T, Schedl T. On the control of oocyte meiotic maturation and ovulation in Caenorhabditis elegans. Dev Biol. 1999;205:111–128. doi: 10.1006/dbio.1998.9109. [DOI] [PubMed] [Google Scholar]
- 9.Singson A, Mercer KB, L'Hernault SW. The C. elegans spe-9 gene encodes a sperm transmembrane protein that contains EGF-like repeats and is required for fertilization. Cell. 1998;93:71–79. doi: 10.1016/s0092-8674(00)81147-2. [DOI] [PubMed] [Google Scholar]
- 10.Govindan JA, Cheng H, Harris JE, Greenstein D. Gαo/i and Gαs signaling function in parallel with the MSP/Eph receptor to control meiotic diapause in C. elegans. Curr Biol. 2006;16:1257–1268. doi: 10.1016/j.cub.2006.05.020. [DOI] [PubMed] [Google Scholar]
- 11.Kamath RS, et al. Systematic functional analysis of the Caenorhabditis elegans genome using RNAi. Nature. 2003;421:231–237. doi: 10.1038/nature01278. [DOI] [PubMed] [Google Scholar]
- 12.Hughes AL, Gottschling DE. An early age increase in vacuolar pH limits mitochondrial function and lifespan in yeast. Nature. 2012;492:261–265. doi: 10.1038/nature11654. [DOI] [PMC free article] [PubMed] [Google Scholar]
- 13.Yoshimori T, Yamamoto A, Moriyama Y, Futai M, Tashiro Y. Bafilomycin A1, a specific inhibitor of vacuolar-type H(+)-ATPase, inhibits acidification and protein degradation in lysosomes of cultured cells. J Biol Chem. 1991;266:17707–17712. [PubMed] [Google Scholar]
- 14.Zhou Q, Li H, Xue D. Elimination of paternal mitochondria through the lysosomal degradation pathway in C. elegans. Cell Res. 2011;21:1662–1669. doi: 10.1038/cr.2011.182. [DOI] [PMC free article] [PubMed] [Google Scholar]
- 15.Kostich M, Fire A, Fambrough DM. Identification and molecular-genetic characterization of a LAMP/CD68-like protein from Caenorhabditis elegans. J Cell Sci. 2000;113:2595–2606. doi: 10.1242/jcs.113.14.2595. [DOI] [PubMed] [Google Scholar]
- 16.Sato M, Sato K. Degradation of paternal mitochondria by fertilization-triggered autophagy in C. elegans embryos. Science. 2011;334:1141–1144. doi: 10.1126/science.1210333. [DOI] [PubMed] [Google Scholar]
- 17.Mijaljica D, Prescott M, Devenish RJ. Microautophagy in mammalian cells: revisiting a 40-year-old conundrum. Autophagy. 2011;7:673–682. doi: 10.4161/auto.7.7.14733. [DOI] [PubMed] [Google Scholar]
- 18.Wright J, et al. A quantitative RNA code for mRNA target selection by the germline fate determinant GLD-1. EMBO J. 2011;30:533–545. doi: 10.1038/emboj.2010.334. [DOI] [PMC free article] [PubMed] [Google Scholar]
- 19.Jones AR, Francis R, Schedl T. GLD-1, a cytoplasmic protein essential for oocyte differentiation, shows stage- and sex-specific expression during Caenorhabditis elegans germline development. Dev Biol. 1996;180:165–183. doi: 10.1006/dbio.1996.0293. [DOI] [PubMed] [Google Scholar]
- 20.Francis R, Barton MK, Kimble J, Schedl T. gld-1, a tumor suppressor gene required for oocyte development in Caenorhabditis elegans. Genetics. 1995;139:579–606. doi: 10.1093/genetics/139.2.579. [DOI] [PMC free article] [PubMed] [Google Scholar]
- 21.Merritt C, Seydoux G. Transgenic solutions for the germline. WormBook. 2010 doi: 10.1895/wormbook.1.148.1. [DOI] [PMC free article] [PubMed] [Google Scholar]
- 22.Brand MD, Nicholls DG. Assessing mitochondrial dysfunction in cells. Biochem J. 2011;435:297–312. doi: 10.1042/BJ20110162. [DOI] [PMC free article] [PubMed] [Google Scholar]
- 23.Chance B, Williams GR. Respiratory enzymes in oxidative phosphorylation. I. Kinetics of oxygen utilization. J Biol Chem. 1955;217:383–393. [PubMed] [Google Scholar]
- 24.Tantama M, Martinez-Francois JR, Mongeon R, Yellen G. Imaging energy status in live cells with a fluorescent biosensor of the intracellular ATP-to-ADP ratio. Nat Commun. 2013;4:2550. doi: 10.1038/ncomms3550. [DOI] [PMC free article] [PubMed] [Google Scholar]
- 25.Hung YP, Albeck JG, Tantama M, Yellen G. Imaging cytosolic NADH-NAD(+) redox state with a genetically encoded fluorescent biosensor. Cell Metab. 2011;14:545–554. doi: 10.1016/j.cmet.2011.08.012. [DOI] [PMC free article] [PubMed] [Google Scholar]
- 26.Parry BR, et al. The bacterial cytoplasm has glass-like properties and is fluidized by metabolic activity. Cell. 2014;156:183–194. doi: 10.1016/j.cell.2013.11.028. [DOI] [PMC free article] [PubMed] [Google Scholar]
- 27.Pastore A, Temussi P. Protein aggregation and misfolding: good or evil? J Phys Condens Matter. 2012;24:244101. doi: 10.1088/0953-8984/24/24/244101. [DOI] [PubMed] [Google Scholar]
- 28.Unal E, Kinde B, Amon A. Gametogenesis eliminates age-induced cellular damage and resets life span in yeast. Science. 2011;332:1554–1557. doi: 10.1126/science.1204349. [DOI] [PMC free article] [PubMed] [Google Scholar]
- 29.Roux AE, Langhans K, Huynh W, Kenyon C. Reversible Age-Related Phenotypes Induced during Larval Quiescence in C. elegans. Cell Metab. 2016;23:1113–1126. doi: 10.1016/j.cmet.2016.05.024. [DOI] [PMC free article] [PubMed] [Google Scholar]
- 30.Conboy IM, et al. Rejuvenation of aged progenitor cells by exposure to a young systemic environment. Nature. 2005;433:760–764. doi: 10.1038/nature03260. [DOI] [PubMed] [Google Scholar]
- 31.Redemann S, et al. Codon adaptation-based control of protein expression in C. elegans. Nat Methods. 2011;8:250–252. doi: 10.1038/nmeth.1565. [DOI] [PubMed] [Google Scholar]
- 32.Dantuma NP, Lindsten K, Glas R, Jellne M, Masucci MG. Short-lived green fluorescent proteins for quantifying ubiquitin/proteasome-dependent proteolysis in living cells. Nat Biotechnol. 2000;18:538–543. doi: 10.1038/75406. [DOI] [PubMed] [Google Scholar]
- 33.Kelly WG, Xu S, Montgomery MK, Fire A. Distinct requirements for somatic and germline expression of a generally expressed Caernorhabditis elegans gene. Genetics. 1997;146:227–238. doi: 10.1093/genetics/146.1.227. [DOI] [PMC free article] [PubMed] [Google Scholar]
- 34.Mello CC, Kramer JM, Stinchcomb D, Ambros V. Efficient gene transfer in C. elegans: extrachromosomal maintenance and integration of transforming sequences. EMBO J. 1991;10:3959–3970. doi: 10.1002/j.1460-2075.1991.tb04966.x. [DOI] [PMC free article] [PubMed] [Google Scholar]
- 35.Doniach T, Hodgkin J. A sex-determining gene, fem-1, required for both male and hermaphrodite development in Caenorhabditis elegans. Dev Biol. 1984;106:223–235. doi: 10.1016/0012-1606(84)90077-0. [DOI] [PubMed] [Google Scholar]
- 36.Yang JS, et al. OASIS: online application for the survival analysis of lifespan assays performed in aging research. PLoS One. 2011;6:e23525. doi: 10.1371/journal.pone.0023525. [DOI] [PMC free article] [PubMed] [Google Scholar]
Associated Data
This section collects any data citations, data availability statements, or supplementary materials included in this article.
Supplementary Materials
Data Availability Statement
All relevant data supporting the findings of this study have been included in the paper and the supplementary files. Graph source data for Figs 1, 2, 3, 4 and Extended Data Figs 2, 3, 4, 5, 6, 7, 8, 9, 10 are provided with the paper. Gel source data are provided in Supplementary Fig. 1.


