

Abstract
Anti–vascular endothelial growth factor (VEGF) therapy has failed to improve survival in patients with breast cancer (BC). Potential mechanisms of resistance to anti-VEGF therapy include the up-regulation of alternative angiogenic and proinflammatory factors. Obesity is associated with hypoxic adipose tissues, including those in the breast, resulting in increased production of some of the aforementioned factors. Hence, we hypothesized that obesity could contribute to anti-VEGF therapy’s lack of efficacy. We found that BC patients with obesity harbored increased systemic concentrations of interleukin-6 (IL-6) and/or fibroblast growth factor 2 (FGF-2), and their tumor vasculature was less sensitive to anti-VEGF treatment. Mouse models revealed that obesity impairs the effects of anti-VEGF on angiogenesis, tumor growth, and metastasis. In one murine BC model, obesity was associated with increased IL-6 production from adipocytes and myeloid cells within tumors. IL-6 blockade abrogated the obesity-induced resistance to anti-VEGF therapy in primary and metastatic sites by directly affecting tumor cell proliferation, normalizing tumor vasculature, alleviating hypoxia, and reducing immunosuppression. Similarly, in a second mouse model, where obesity was associated with increased FGF-2, normalization of FGF-2 expression by metformin or specific FGF receptor inhibition decreased vessel density and restored tumor sensitivity to anti-VEGF therapy in obese mice. Collectively, our data indicate that obesity fuels BC resistance to anti-VEGF therapy via the production of inflammatory and angiogenic factors.
INTRODUCTION
Antiangiogenic therapy in cancer patients has fallen short of expectations (1, 2). In metastatic breast cancer (BC) in particular, the U.S. Food and Drug Administration (FDA) revoked the approval of the vascular endothelial growth factor (VEGF) antibody bevacizumab because of a lack of overall survival benefit in phase 3 trials (3). Therefore, understanding the mechanisms of resistance to anti-VEGF treatment and seeking potential biomarkers of response to anti-VEGF are paramount. In metastatic colon cancer, obesity has been associated with reduced survival, specifically in patients receiving antiangiogenic therapies (4). Reports for other cancers, such as metastatic kidney cancer, have been conflicting, whereas the effect of obesity on anti-VEGF response in BC patients is unknown (5–7).
Proinflammatory and alternative angiogenic factors can sustain angiogenesis and tumor progression despite VEGF blockade (1, 8–11). Many of these same factors are also increased in obesity, where the rate of adipose tissue expansion exceeds that of angiogenesis, resulting in inadequate tissue vascularization and hypoxia (12–15). In response to hypoxia, cytokines and chemokines (adipokines) are released, causing inflammation and the recruitment of additional proinflammatory and proangiogenesis mediators (6, 16–19). Adipose tissue makes up a large proportion of BC, with cancer-associated adipocytes (CAAs) being the predominant cell population in the stromal compartment of BCs (20). Consistent with this, obesity can increase tumor inflammation (15, 21, 22). Therefore, we hypothesized that obesity promotes resistance to anti-VEGF therapy in BCs via systemic as well as local overproduction of inflammatory and alternative angiogenic factors.
Combining preclinical studies with a phase 2 clinical study of BC patients treated with anti-VEGF, we found that multiple cell types contributed to the overproduction of interleukin-6 (IL-6) in tumors with obesity. Blockade of IL-6 reverted obesity-induced resistance to anti-VEGF therapy in primary and metastatic BC models. In addition, we found that fibroblast growth factor 2 (FGF-2) was also associated with obesity and may contribute to resistance to anti-VEGF. With 60 to 70% of BC patients presenting with excess weight at diagnosis (23), this study is timely, provides relevant insight into the mechanisms underlying the poor efficacy of antiangiogenic therapy, and identifies potential strategies for overcoming these hurdles in BC patients.
RESULTS
In BC patients treated with anti-VEGF therapy, IL-6 correlates with worse outcome in patients with excess weight
To evaluate the impact of obesity on response to anti-VEGF in patients, we performed a sub-analysis of a phase 2 clinical trial assessing neoadjuvant bevacizumab therapy. Ninety-nine patients with estrogen receptor–positive (ER+) and triple-negative (TN) BC were treated with bevacizumab (monoclonal antibody against VEGF) alone for 2 weeks, followed by bevacizumab plus chemotherapy (Fig. 1A) (24). In the original study, only ~16% of patients presented with a pathologic complete response, confirming previous reports of the limited efficacy of anti-VEGF therapy in BC (3). We obtained body mass index (BMI) data (average BMI, 27.9) and measured the areas of visceral and subcutaneous adipose tissue (VAT and SAT, respectively) by computerized tomography (CT) scan image analysis (Fig. 1B). As expected, VAT and SAT strongly correlated with BMI (fig. S1). We found that patients with a BMI ≥ 25 presented with 33% larger tumor size at baseline (4.1 versus 3.3 cm average size) compared to patients with a BMI < 25 (Fig. 1C). In addition, we performed immunohistochemical staining for tumor vessels in biopsy samples obtained before (day 0) and after (day 14) bevacizumab treatment (Fig. 1D). At day 0, tumor vessel density inversely correlated with adipose tissue area (Fig. 1E). Consistent with this, expression of the hypoxia marker carbonic anhydrase IX (CA-IX) positively correlated with VAT (Fig. 1F). Both of these findings are reminiscent of the vascular impairment that characterizes adipose tissue in obesity (17, 25). However, on day 14 of bevacizumab treatment, vessel densities and hypoxia became independent of patient VAT (Fig. 1, E and F). These data suggest that the differences in vessel density in patients with low and high adiposity were abrogated after bevacizumab treatment because of a greater sensitivity to this therapy in the low adiposity setting compared to the high adiposity setting. We then determined whether molecules associated with resistance to anti-VEGF therapies (1, 8–11), such as IL-6 and FGF-2, were increased in the circulation of patients with obesity. We observed that plasma concentrations of IL-6 (Fig. 1G, left) and FGF-2 (Fig. 1H, top) positively correlated with the degree of adiposity (VAT). IL-6, in particular, was increased at baseline and throughout the course of treatment in patients with elevated VAT, SAT (Fig. 1G and fig. S2), and BMI measurements (Fig. 1G and fig. S3). Moreover, immunohistochemical observation of tumors in obesity revealed that IL-6 and FGF-2 expression in tumors was particularly abundant in adipocyte-rich regions (Fig. 1, G and H, images). Collectively, we found that patients with excess weight present with larger and more hypoxic tumors. These patients also had increased circulating concentrations of IL-6 and FGF-2, and expression of these factors in tumors was localized in close proximity to adipocyte-rich regions.
Fig. 1. Reduced anti-vascular effect of anti-VEGF therapy in patients with excess weight is associated with increased IL-6 and FGF-2.
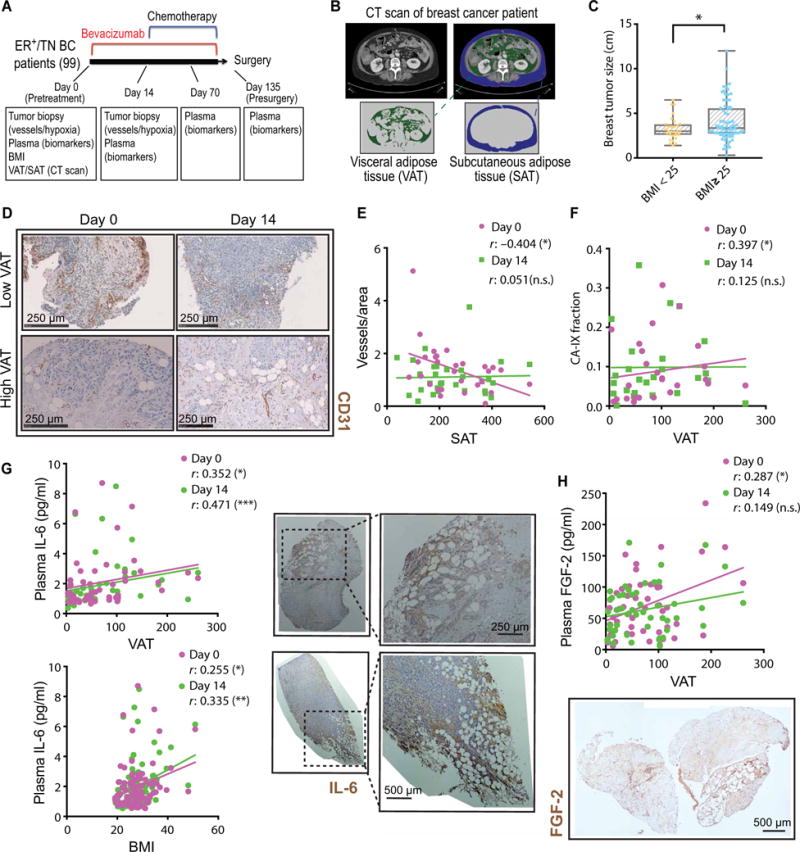
(A) Schematic of the clinical study performed using samples and data from a phase 2 neoadjuvant trial in BC. (B) Representative CT scans demonstrating how VAT and SAT data were collected in BC patients. (C) Baseline tumor size in patients with BMI below or above 25 (n = 29 and 70, respectively). (D) Representative images of vessel staining (CD31) in human breast tumor samples from patients with low or high VAT, before (day 0) and after (day 14) bevacizumab (anti-VEGF) treatment. (E) Correlation of tumor vessel count with SAT before (day 0) and after (day 14) anti-VEGF therapy. n.s., not significant. (F) Correlation of tumor CA-IX expression with VAT before and after anti-VEGF therapy. (G) Left: Correlation of plasma IL-6 with VAT and BMI at baseline and day 14. Right: Representative images of IL-6 staining in human breast tumor samples. (H) Top: Correlation of plasma FGF-2 with VAT at baseline and day 14. Bottom: Representative image of FGF-2 staining in a human breast tumor sample. Significant differences were assessed in (C) using t test and in (E) to (H) using Spearman’s correlation test. *P < 0.05, **P < 0.01, ***P < 0.001. Data in (C) and (E) to (H) are shown as individual values, regression line, and box plots with minimum, maximum, and median values.
Diet-induced obesity attenuates the effect of anti-VEGF therapy on BC progression in mouse models
To dissect the role of obesity in BC response to anti-VEGF therapy, high- and low-fat diets were used to generate obese and lean mice [Fig. 2, A and B; individual body weight (BW) gain curves in fig. S4]. We used two syngeneic murine models reflecting ER+ (E0771) and TN (MCaIV) BC subtypes (Fig. 2C), similar to the patient populations studied. Obesity accelerated tumor growth in the early stages of tumor development, with tumors in obese mice becoming 50% larger in size compared to those in lean mice (~150 versus 100 mm3) (figs. S5 and S6, A and B). However, once tumors reached this size range, the growth rate was identical between the lean and obese mice (fig. S6A, from day 13 in obese mice and day 17 in lean mice onward, as also depicted in fig. S6C). We assigned animals to control/treatment groups when tumors became established at a median volume of around 100 to 150 mm3 (with minor variability between experiments), with tumor sizes being equally distributed in all control/treatment/diet groups in each experiment. After tumors were size-matched at around 125 mm3 on day 0, tumor growth rates in lean versus obese control mice (no treatment) appeared indistinguishable, as depicted in Fig. 2D and fig. S6C. Treatment with anti-mouse VEGF antibody (B20-4.1.1) was more effective at inhibiting tumor growth in lean compared to obese mice (Fig. 2, D and E; individual curves in fig. S7). Nine days of B20 treatment reduced the E0771 and MCaIV tumor volumes in lean mice by 50 and 57%, respectively, but only by 12 and 28% in obese mice, respectively (Fig. 2, D and E). To determine whether the reduced sensitivity of tumors in obesity to B20 treatment was due to diet or BW, a proportion of tumor-bearing animals previously fed a low-fat diet were switched to a high-fat diet. Tumor growth in animals that experienced a change in diet was similar to that observed in animals maintained on low-fat diet, indicating that BW, rather than diet, accounted for the reduced sensitivity of tumors in obesity to B20 treatment (fig. S8). Together, these data indicate that anti-VEGF therapy is less effective in inhibiting BC progression in obese mice.
Fig. 2. Obesity associates with resistance to anti-VEGF therapy in mouse models of BC.
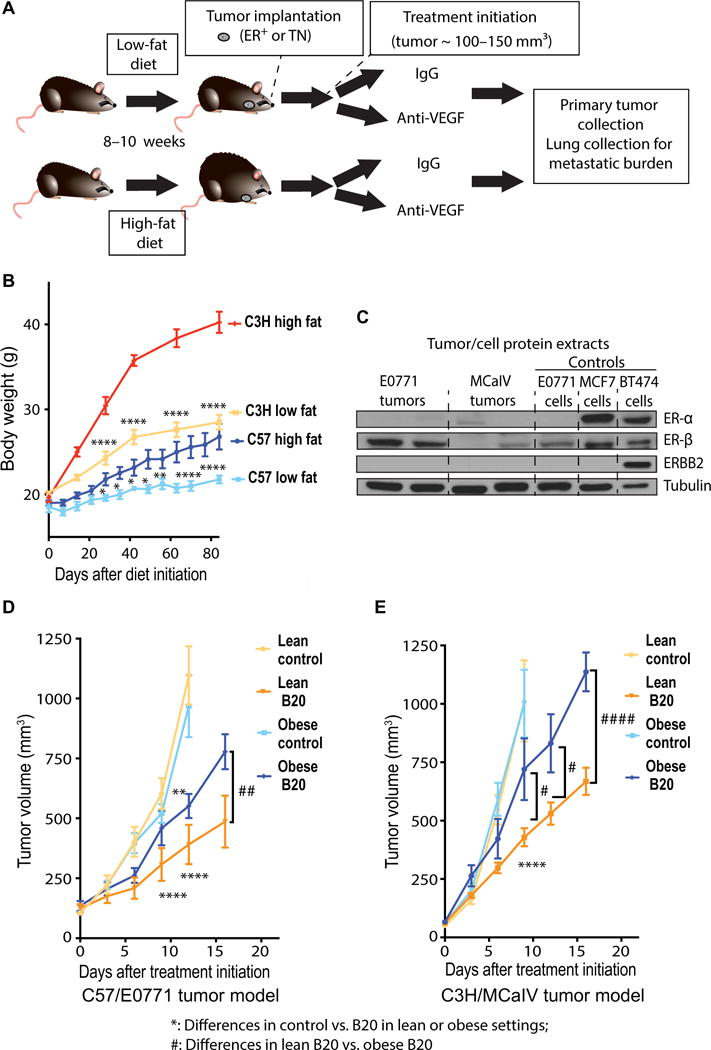
(A) Schematic demonstrating the experimental design of preclinical studies. C57BL/6 and C3H mice were fed a high-fat diet (HFD; 60% fat) or a low-fat diet (LFD; 10% fat) from 6 weeks of age. Tumor cells/chunks were implanted 8 to 10 weeks after diet initiation, and treatments began when tumors reached ~100 to 150 mm3. (B) BW gain over time in C3H and C57BL/6 mice fed either an LFD or HFD (C57BL/6: LFD, n = 6; HFD, n = 7; C3H: LFD, n = 4; HFD, n = 4). Significant differences using two-way analysis of variance (ANOVA) with post hoc test for multiple comparisons are indicated. *P < 0.05, **P < 0.01, ****P < 0.0001. (C) Tumor/cell protein extracts were used to access the expression of ER and epidermal growth factor receptor 2 (ERBB2) in tumors/cell lines. MCF7 and BT474 cell lines were used as positive controls for ER and (in the case of BT474) ERBB2 (antibody used detects both human and mouse HER2/ERBB2). Tubulin was used as loading control. (D and E) Tumor growth curves. E0771 (D) and MCaIV (E) tumors grown in obese versus lean mice were treated with anti-VEGF antibody (B20) or control immunoglobulin G (IgG) [E0771: n = 3 animals in obese control group and 6 animals for other groups; MCaIV: n = 8 animals in obese control group and 6 animals for other groups; two additional animals in the obese control group were removed after treatment (IgG) initiation because of failure of tumor growth]. Significant differences using two-way ANOVA with post hoc test for multiple comparisons are indicated. **P < 0.01, ****P < 0.0001 control versus B20 in lean or obese settings; #P < 0.05, ##P < 0.01, ####P < 0.0001, lean B20 versus obese B20. Data in (B), (D), and (E) are means ± SEM.
The adipocyte-rich and hypoxic tumor microenvironment in obese mice is associated with reduced response to anti-VEGF therapy
To determine why B20 failed to control tumors from obese animals to the same extent as in lean animals, we first assessed the effects of B20 on tumor vasculature. Similar to patients with obesity, E0771 tumors from obese mice presented with lower vessel density (Fig. 3A) and higher expression of hypoxia markers, namely, CA-IX and glucose transporter 1 (GLUT-1), compared to tumors from lean mice (Fig. 3B and fig. S9, A and B). In addition, the phosphorylated forms of major regulators of cell proliferation and survival [extracellular signal–regulated kinase (ERK), AKT, and S6] were highly expressed in obese tumors and retained their expression even in the presence of anti-VEGF therapy (Fig. 3C; quantification in fig. S10). Conversely, in lean mice, the expression of the active forms of these mediators was relatively low and appeared to decrease after anti-VEGF therapy (Fig. 3C and fig. S10). These findings may account for the increased tumor burden in anti-VEGF–treated obese mice compared to anti-VEGF–treated lean mice (Fig. 2, D and E). Furthermore, the hypovascularity and hypoxia in tumors from obese animals were associated with increased presence of CAAs (Fig. 4A, left). We further confirmed the presence of CAAs by detecting various adipocyte markers such as perilipin, Oil Red O staining, caveolin, and fatty acid synthase (FAS) (fig. S11, A to D) (26). Not surprisingly, in obese tumors, we observed increases in both adipocyte size and number (Fig. 4, A and B). Moreover, adipocyte-rich tumor areas had lower vessel density and were hypoxic (Fig. 4, C and D). The expression of proliferative markers was particularly pronounced in tumor areas abundant in hypertrophic CAAs (Fig. 4, E and F) (27). In addition, when tumor-bearing animals were treated with B20, tumor tissue in adipocyte-rich regions remained viable (nonnecrotic), whereas extensive necrosis was observed in adipocyte-poor areas, suggesting a protective effect of adipose stroma in tumors (Fig. 4G and fig. S11E).
Fig. 3. Anti-VEGF therapy is less effective in reducing tumor vessel density in obese mice.
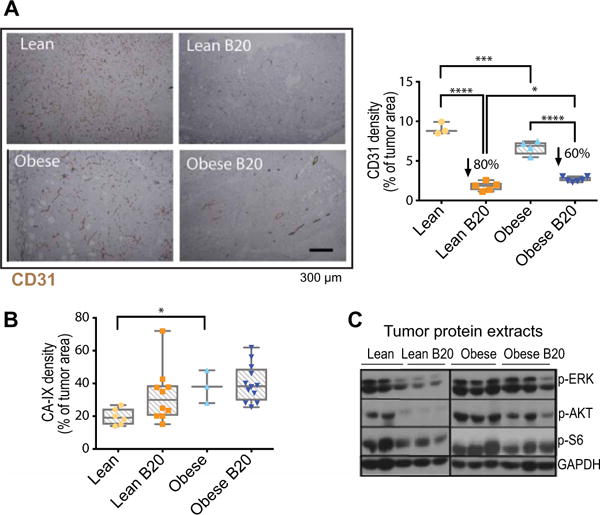
(A) Left: Representative images of CD31 staining (immunohistochemistry) in E0771 tumors from lean and obese mice, treated with control IgG or B20 for 14 days (tumor size-matched at treatment initiation). Right: Quantification of CD31+ expression (percentage of viable tumor area). (B) Quantification of hypoxia [percentage of CA-IX expression over 4′,6-diamidino-2-phenylindole (DAPI) viable area] in whole E0771 tumors from lean and obese animals treated with B20 or control IgG. (C) Protein expression determined by Western blot in tumors from lean and obese animals treated with control IgG or B20. Each lane corresponds to an individual tumor. GAPDH, glyceraldehyde-3-phosphate dehydrogenase. Significant differences in (A) and (B) using two-way ANOVA with post hoc test for multiple comparisons are indicated, *P < 0.05, ***P < 0.001, ****P < 0.0001. Data in (A) and (B) are shown as individual values plus box plots with minimum, maximum, and median values.
Fig. 4. The hypoxic adipocyte-rich tumor microenvironment in obese mice associates with sustained E0771 tumor progression despite anti-VEGF therapy.
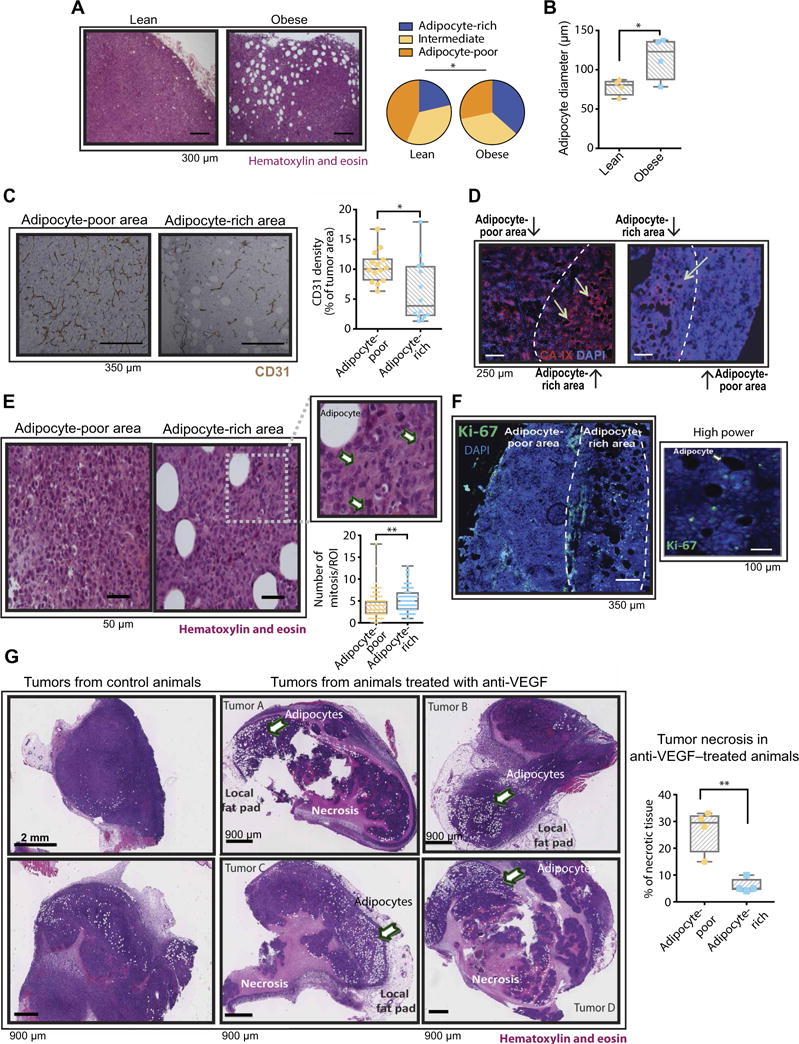
(A) Left: Representative images of hematoxylin and eosin (H&E)–stained E0771 tumors from lean and obese mice. Right: Density of adipocytes in E0771 tumors. Quantification denotes enrichment for adipocytes [adipocyte-rich: 12 or more adipocytes per region of interest (ROI); intermediate: 5 to 11 adipocytes per ROI; adipocyte-poor: less than 5 adipocytes per ROI (2.16 by 1.44 mm at ×4 magnification), n = 4 to 10 ROIs per tumor from a total of four tumors per group]. (B) Quantification of adipocyte diameter in E0771 tumors. Cross-sectional diameter was obtained from H&E-stained tumor sections (n = 12 to 20 ROIs per tumor from a total of four tumors per group). (C) Left: Representative images of tumor vessel density (CD31 staining) in adipocyte-poor and adipocyte-rich areas in the E0771 model. Right: Quantification of vessel density in regions with low and high numbers of adipocytes (n = 3 to 4 ROIs from a total of eight tumors). Significant difference using t test, *P < 0.05. (D) Representative images of CA-IX staining in adipocyte-poor and adipocyte-rich areas of E0771 tumors. Arrows in images point to adipocytes. (E) Left: Representative images of adipocyte-poor and adipocyte-rich areas after H&E staining of E0771 tumors. Inset highlights an abundance of mitotic cells (arrows) near an adipocyte. Bottom right: Number of mitosis in adipocyte-poor and adipocyte-rich regions (n = 15 to 22 ROIs from a total of eight tumors). (F) Left: Immunofluorescence images of an E0771 tumor from an obese mouse showing the expression of Ki-67 in tumor adipocyte-rich areas. Right: Higher-magnification inset from a region expressing Ki-67. (G) Left: Representative images of H&E-stained whole E0771 tumors before and after anti-VEGF therapy. Right: Quantification of necrosis in adipose-poor and adipocyte-rich regions of tumors from animals treated with anti-VEGF. Significant differences using χ2 for (A) and t test for (B), (C), (E), and (G) are indicated. *P < 0.05, **P < 0.01. Data in (B), (C), (E), and (G) are shown as individual values plus box plots with minimum, maximum, and median values.
Adipocytes and infiltrating myeloid cells in adipocyte-rich regions of mouse tumors overexpress IL-6
Similar to the enlarged adipocytes that form in adipose tissue during obesity, CAAs are associated with increased production of proangiogenic growth factors and proinflammatory cytokines (15, 16, 21). These growth factors and cytokines, when present in the tumor microenvironment, can sustain angiogenesis and tumor progression despite blockade of VEGF signaling (1, 9–11, 28, 29). Consistent with the higher concentrations of IL-6 observed in the plasma and adipocyte-rich tumor regions of BC patients with obesity, we found that E0771 tumors from obese mice presented with increased mRNA expression (more than fourfold) of Il6, Cxcl1, Cxcl3, Ifnß, and Lif (Fig. 5A). A protein array for inflammatory cytokines confirmed the robust increase in IL-6, in addition to CXCL1, IL-12, and TNFα (tumor necrosis factor–α) (Fig. 5B and fig. S12). IL-6 concentrations in tumors from E0771 tumor-bearing mice were increased at baseline in obese mice (fig. S13), possibly reflecting the baseline increase in tumor hypoxia, because hypoxia can increase IL-6 production (30, 31). Similar to human tumor samples, IL-6 expression was localized in adipocyte-rich regions of E0771 tumors and colocalized with the expression of hypoxia markers (Fig. 5, C and D). Double staining for cell surface markers and IL-6 in tumor tissue revealed the cellular sources of IL-6 to be adipocytes and infiltrating CD11b+ myeloid cells, in particular F4/80+ macrophages (Fig. 5, E and F). Consistent with the predominance of IL-6 in hypoxic adipocyte-rich areas, macrophage infiltration was also more prevalent in these areas (Fig. 5G and fig. S14). We found that E0771 tumor cells express both the IL-6 receptor (IL-6R) and the IL-6 signal-transducing subunit gp130, indicating that IL-6 can act directly on cancer cells to activate signaling pathways (Fig. 5H). Consistent with a local release of IL-6 by myeloid cells and adipocytes, we detected expression of phosphorylated signal transducer and activator of transcription 3 (p-STAT3) particularly in cells localized adjacent to immune cells and CAAs (Fig. 5I). Overall, these results suggest that IL-6 may be a rational target to overcome obesity-induced resistance to anti-VEGF therapy.
Fig. 5. Hypoxic tumors from obese mice associate with increased production of IL-6 by adipocytes and myeloid cells.
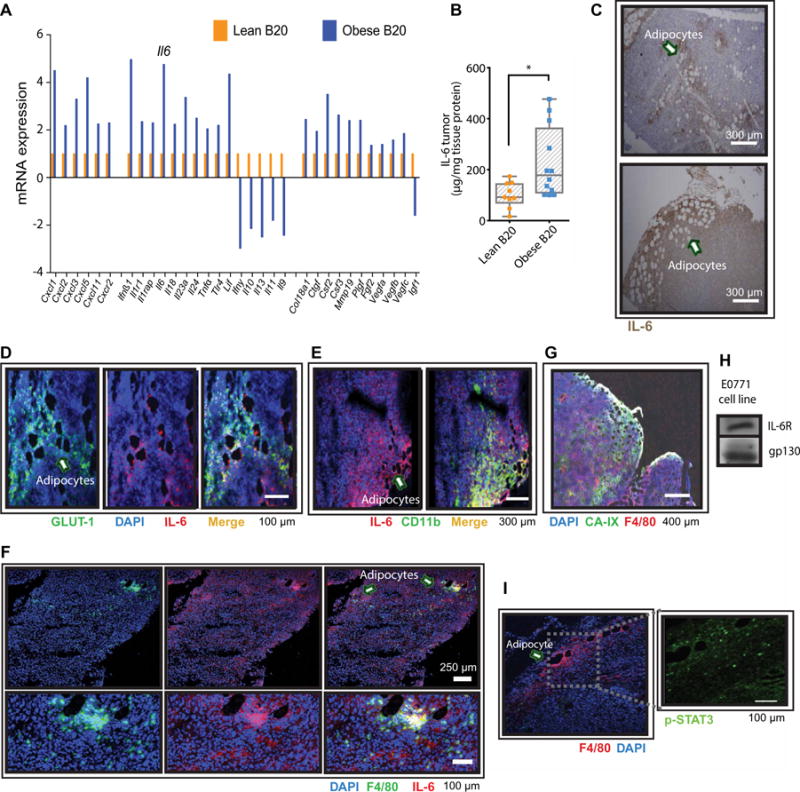
(A) mRNA expression (normalized to a panel of housekeeping genes) of proinflammatory cytokines and proangiogenic growth factors in E0771 tumors from lean and obese animals treated with B20. Four samples per group were pooled in each array plate used. Genes that increased more than about twofold are included (in addition to VEGF family genes). (B) Protein expression of IL-6 in E0771 tumors from lean and obese animals treated with B20. Significant differences using t test are indicated, *P < 0.05. Data are shown as individual values plus box plots with minimum, maximum, and median values. (C) Immunohistochemistry indicating IL-6 expression in adipocyte-rich areas (arrows point to adipocytes). (D) Immunofluorescence showing IL-6 expression and hypoxic (GLUT-1+) adipocyte-rich areas (arrow points to adipocytes). (E) Colocalization of IL-6 with the myeloid marker CD11b (arrow points to adipocytes). (F) Colocalization of macrophages (F4/80+ cells) with IL-6 in tumors (arrows point to adipocytes). (G) Colocalization of macrophages (F4/80+ cells) with adipocytes in hypoxic (CA-IX–positive) areas. Scale bar, 400 μm. (H) E0771 BC cells express IL-6R and the IL-6 signal-transducing subunit gp130. (I) Immunofluorescence showing tumor expression of p-STAT3 and macrophages infiltrating adipocyte-rich areas (arrow points to an adipocyte). Scale bar, 100 μm.
IL-6 blockade overcomes resistance to anti-VEGF therapy in obese mice
Pharmacological inhibition of IL-6 (~50% decreased concentration of IL-6 in tumors; fig. S15) in combination with B20 treatment reduced tumor growth (Fig. 6A; individual curves in fig. S16) and metastasis (Fig. 6B and fig. S17) in obese mice to rates similar to lean mice receiving B20. IL-6 blockade did not improve response to B20 in the lean setting, indicating that IL-6 specifically mediates obesity-induced resistance to antiangiogenic therapy. Deletion of host-derived IL-6 using IL-6 knockout (Il6−/−) mice reduced tumor IL-6 by ~75%, suggesting that host stromal cells are the major source of IL-6 production in tumors (fig. S15). The tumor growth curve for obese mice treated with anti–IL-6 in combination with B20 did not vary much from that of obese Il6−/− mice treated with B20 (fig. S18). Conversely, IL-6 inhibition alone did not alter tumor growth in the absence of VEGF inhibition even in the obese setting (fig. S19). Together, these findings suggest that IL-6 plays an important role in tumor progression but only in the context of obesity and VEGF blockade. In mice treated with B20, consistent with tumor growth data, IL-6 inhibition decreased tumor cell proliferation (Fig. 6C) and number of mitoses in obese but not lean mice (fig. S20), although attenuation of obesity-induced signaling pathways like p-STAT3, p-JNK (phosphorylated c-Jun N-terminal kinase), and p-p38 was not observed in IL-6–inhibited tumors (Fig. 6D; quantification in fig. S21). B20 treatment increased necrosis, but addition of IL-6 blockade to B20 did not further increase the amount of necrosis (fig. S22). In addition to its effects on tumor cells, anti–IL-6 combined with anti-VEGF therapy increased functional (perfused) vessel density (about sixfold; Fig. 6E, left) and decreased the expression of hypoxia marker CA-IX by ~60% in obese animals (no effects were observed in lean mice) (Fig. 6E, right). Both hypoxia and IL-6 can promote infiltration of immune cells, which may contribute to resistance to anti-VEGF therapy by acting as additional sources of IL-6 and other angiogenic and tumor-promoting factors (29). In obese mice, both genetic and pharmacological IL-6 inhibition attenuated the B20-induced infiltration of CD4+CD25+ regulatory T cells (Fig. 6F, left) and CD4+ T cells (Fig. 6F, right). Regulatory T cells, in particular, induce immunosuppression and tumor progression (32, 33). Consistent with a decrease in immunosuppressive cell recruitment, IL-6 inhibition reduced tumor concentrations of the prometastatic chemokine CXCL1 (34) in obese mice (fig. S23). Together, these findings indicate that IL-6 up-regulation contributes to resistance to anti-VEGF in obesity by sustaining tumor cell proliferation, reducing perfusion with associated aberrant hypoxic microenvironment, and promoting chemokine and immune cell recruitment. Finally, we evaluated whether the addition of anti–IL-6 could improve the efficacy of chemotherapy/anti-VEGF combination treatment in BC. To this end, we used a suboptimal dose of doxorubicin (2 mg/kg) to mimic patient response in the clinical setting (35). Consistent with tumor growth data in Fig. 6A, the addition of IL-6 inhibition to B20 plus doxorubicin in obese animals prolonged the time to tumor progression to levels similar to those seen in lean mice that received B20/doxorubicin treatment, whereas in lean animals the triple combination therapy did not further enhance the efficacy of anti-VEGF/doxorubicin (Fig. 6, G and H).
Fig. 6. IL-6 inhibition improves tumor response to anti-VEGF in the obese setting.
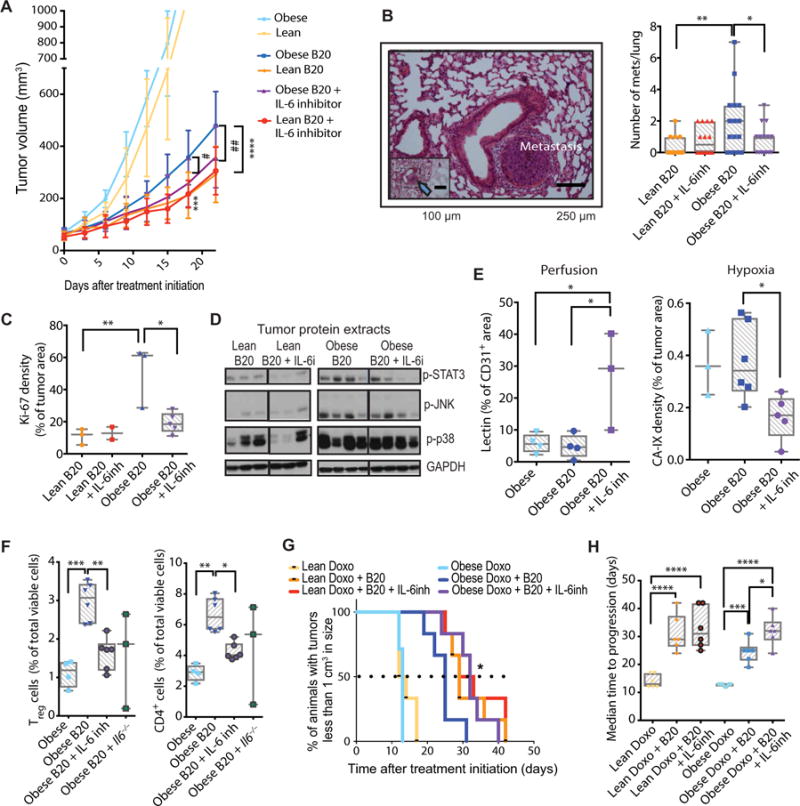
(A) Tumor growth curves. E0771 tumors grown in lean versus obese C57BL/6 mice were treated with control IgG (lean, n = 9; obese, n = 6), B20 (lean, n = 6; obese, n = 7), or a combination of B20 and IL-6 inhibitor (lean, n = 8; obese, n = 7). ***P < 0.001, ****P < 0.0001 lean B20 versus obese B20; #P < 0.05, ##P < 0.01 obese B20 versus obese B20 + IL-6 inhibition. (B) Left: Representative image of lung collected from E0771 tumor-bearing obese mice (arrow points to lung metastasis in the inset). Right: Number of lung metastases collected from E0771 tumor-bearing lean and obese C57BL/6 mice treated with control IgG, B20, anti–IL-6 antibody, or a combination of B20 and anti–IL-6. (C) Tumor cell proliferation (Ki-67) in tumors collected from lean and obese mice treated with B20 or B20 + anti–IL-6 antibody. (D) Protein expression from tumors in lean and obese mice, treated with B20 or B20 plus IL-6 inhibitor. Western blots, where each lane represents an individual tumor. (E) Left: Vessel perfusion (percentage of CD31+ stain colocalizing with lectin) in EO771 tumors. Right: Expression of the hypoxia marker CA-IX in EO771 tumors. (F) Flow cytometric analysis of immune cells in tumors in obese mice, showing the percentage of total immune cells of regulatory T (Treg) cells (CD4+CD25+; left) and CD4+ T cells (right). (G) Kaplan-Meier survival curves (percentages of animals that bear tumors of less than 1 cm3 in size); the difference between obese B20 plus doxorubicin (Doxo, 2 mg/kg) and obese B20 plus doxorubicin plus IL-6 inhibitor (IL-6inh) groups is significant by log-rank test, as indicated. *P < 0.05. (H) Median time to progression (time for tumors to reach 1 cm3) is depicted in the right. Significant differences using one-way ANOVA for (E) and (F) and two-way ANOVA for (A) to (C), (E), and (H) with post hoc multiple comparisons tests are indicated. *P < 0.05, **P < 0.01, ***P < 0.001, ****P < 0.0001. Data in (A) are shown as means ± SEM and in (B), (C), (E), (F), and (H) are shown as individual values plus box plots with minimum, maximum, and median values.
In the absence of obesity-promoted IL-6 up-regulation, FGF-2 may mediate resistance to anti-VEGF therapy in obesity
In a second breast tumor model, we discovered that FGF-2, but not IL-6, was strongly associated with obesity. B20-treated TN MCaIV tumors displayed higher gene expression of Fgf2, Il6, Tnfα , Vegfa, and angiogenin (12-, 3-, 5-, 2-, and 4-fold increases, respectively) in obese compared to lean animals (Fig. 7A). Protein expression analysis confirmed increased FGF-2, but not IL-6, TNFα, or VEGF-A (Fig. 7B and fig. S24). Akin to the increased IL-6 expression in the E0771 model, baseline tumor FGF-2 expression (both mRNA and protein) was increased in untreated obese mice compared to untreated lean mice (fig. S25, A and B). Similarly, FGF-2 was expressed abundantly in adipocyte-rich areas toward the tumor periphery (Fig. 7C, top, and fig. S25C), as well as in activated cancer-associated fibroblasts (Fig. 7C, bottom, and fig. S25D). These findings are consistent with the localization of FGF-2 to adipocyte-rich regions in human BCs (Fig. 1H, bottom) and the association of obesity with circulating FGF-2 in patients (Fig. 1H, top). Considering that FGF-2 has previously been implicated in resistance to antiangiogenic therapy (36–38), this poses yet another potential mechanism of resistance to anti-VEGF therapy induced by obesity. As seen in E0771 tumors, MCaIV tumors were less vascularized and more hypoxic when grown in obese mice (Fig. 7D and figs. S26 and S27). Obesity also rendered B20 ineffective in reducing vessel density compared to lean mice (53% reduction) (Fig. 7D). We next investigated the role of FGF-2 in anti-VEGF therapy resistance. Specific inhibition of the FGF receptor (FGFR) using anti-FGFR (AZD4547, 12.5 mg/kg orally, once daily) improved tumor responsiveness to B20 in obese mice (Fig. 7E, green versus blue curves in the graph; individual curves in fig. S28), whereas in lean mice the improvement was not significant (Fig. 7E, brown versus orange curves). However, this treatment was associated with substantial BW loss in mice from all treated groups, suggesting systemic toxicity (fig. S29). Therefore, we sought nontoxic alternatives to reduce FGF-2 in our model. The biguanide metformin—a clinically used anti-diabetes drug with a good safety profile—can reduce the cellular expression of FGF-2 (39) and has promising anticancer effects in the obese setting (22, 40, 41). We found that metformin reduced gene and protein expression of FGF-2 in B20-treated MCaIV tumors in obesity (Fig. 7, A and B). We also observed that metformin treatment induced robust deactivation of FGF-2 downstream signaling pathways such as AKT, S6, ERK, and STAT3 (Fig. 7F; quantification in fig. S30), reduced vessel density (Fig. 7, G and H), and ultimately resensitized tumors to anti-VEGF treatment in obese mice (Fig. 7I). Although FGFR phosphorylation in metformin-treated tumors was approximately half, the difference was not statistically significant (fig. S30). Notably, metformin also caused activation of adenosine 5′-monophosphate–activated protein kinase/acetyl-CoA carboxylase (AMPK/ACC) in tumors (Fig. 7F and fig. S30), suggesting that it may have direct effects on tumor cell signaling. Together, these data indicate that, in the absence of obesity-promoted IL-6 up-regulation as seen in the MCaIV/C3H model, FGF-2 may mediate resistance to anti-VEGF therapy in the obese setting by sustaining angiogenesis. Overall, we identified two complementary strategies to overcome BC resistance to anti-VEGF therapy in obesity by targeting IL-6 and/or FGF-2 (Fig. 7J).
Fig. 7. FGF-2 inhibition improves tumor response to anti-VEGF in obese setting in a second BC model.
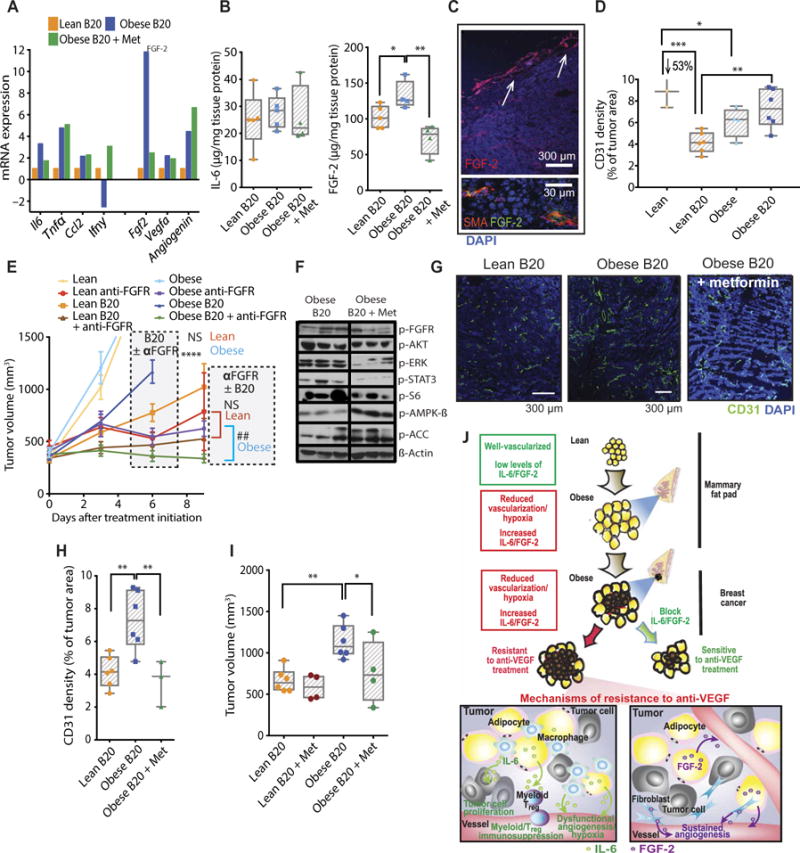
(A) mRNA expression (normalized to a panel of housekeeping genes) of proinflammatory cytokines and proangiogenic growth factors in tumors from lean and obese animals treated with B20, as well as obese mice treated with B20 + metformin (Met). Four samples per group were pooled in each array plate used. (B) Protein expression of IL-6 and FGF-2 in MCaIV tumors from lean and obese mice treated with B20 or B20 plus metformin. (C) Immunofluorescent staining of MCaIV tumor sections. FGF-2 is expressed by adipocytes (top, arrows) and fibroblasts [smooth muscle actin (SMA)] (top). (D) Quantification of vessel density in MCaIV tumors from lean or obese mice untreated or treated with B20. (E) Tumor growth curves. MCaIV tumor-bearing lean and obese mice were treated with anti-VEGF (B20) and/or anti-FGFR once fully established (at median tumor volume ~350 mm3; lean animals: control, n = 5; anti-FGFR, n = 4; B20, n = 5; B20 + anti-FGFR, n = 5; obese animals: control, n = 4; anti-FGFR, n = 4; B20, n = 8; B20 + anti-FGFR, n = 9). Significant differences using two-way ANOVA with post hoc multiple comparisons tests between B20 and B20 + anti-FGFR groups in both lean and obese conditions are indicated in the graph, ****P < 0.0001 in obese and NS (not significant) in lean (day 6). At day 9, a direct comparison between anti-FGFR and B20 + anti-FGFR groups was made for both lean and obese mice. Significant differences using t test, ##P < 0.01 in obese and NS in lean. (F) Western blot demonstrating the effect of metformin on downstream signaling of the FGF pathway and AMPK/ACC. (G and H) Effect of metformin on vessel density in obese animals treated with B20. Representative images (G) showing CD31+ expression in whole tumors. Scale bars, 300 μm. (H) Quantification of CD31+ density in total DAPI viable area. (I) Effect of metformin on tumor volume in lean and obese animals treated with B20. Data shown as tumor volume 16 days after treatment initiation. (J) The obese microenvironment promotes tumor resistance to antiangiogenic therapy. In breast tumors treated with anti-VEGF, obesity-induced IL-6 and FGF-2 production may mediate resistance to anti-VEGF via potentially distinct mechanisms. IL-6 sustains tumor cell proliferation, promotes immune cell recruitment, and drives dysfunctional angiogenesis that further aggravates hypoxia and promotes tumor progression despite anti-VEGF therapy. The proangiogenic factor FGF-2 sustains angiogenesis despite VEGF blockade. Significant differences using t test in (F); one-way ANOVA in (B) and (H) and two-way ANOVA in (D), (E), and (I) with post hoc multiple comparisons tests are indicated. *P < 0.05, **P < 0.01, ***P < 0.001, ****P < 0.0001. Data in (B), (D), (H), and (I) are shown as individual values plus box plots with minimum, maximum, and median values and in (E) are shown as means ± SEM.
DISCUSSION
The results from our clinical study and clinically relevant orthotopic tumor models reveal that obesity associates with hypovascularized and hypoxic tumors at diagnosis, accelerated tumor growth, and resistance to anti-VEGF therapy in BC via increased secretion of IL-6 and/or FGF-2 from hypoxic adipocyte-rich regions in tumors. Previous studies have reported the role of IL-6 or FGF-2 in the context of resistance to antiangiogenic therapies (1, 8–11). This study, however, suggests that these molecules mediate obesity-induced resistance to anti-VEGF therapy. In addition, given that conflicting findings have been reported for the same tumor type, such as when obesity was reported to associate with both better and worse clinical outcomes in kidney cancer patients taking antiangiogenic therapies (5, 7), the effect of obesity in BC on anti-VEGF therapy was unknown.
Here, we confirmed that breast adipose tissue tends to be invaded by the advancing BC (20, 42). Furthermore, the increase in intratumoral adipocyte size and density that we observed in obese mice is also consistent with previous reports (17, 43, 44), and adipocytes proximal to tumors are hypoxic in BC patients (17, 43, 44). These characteristic findings may be due to the invasion of BC into the local breast adipose tissues, which are already hypoxic and hypovascular in the obese setting (13). Notably, we observed increased tumor cell proliferation in these adipocyte-rich regions, which remained viable despite anti-VEGF therapy, whereas adipocyte-poor areas tended to be necrotic. The abundance of these protumor adipocytes that arise in obese mouse tumors allowed for continuous tumor progression during anti-VEGF treatment. Such protumor functions in the vicinity of intratumoral adipocytes have also been reported in nonobese mice (27, 42, 45–47). In addition, E0771 BC cells proliferate faster when co-cultured with adipocytes, and when co-implanted with these cells in mice, breast tumors grow faster and are more metastatic (27, 42, 46–48). Here, we show that adipocyte-rich areas in tumors are associated with resistance to anti-VEGF therapy in obesity. Together, our findings indicate that, under obese conditions, tumors grow in and adapt to (with up-regulation of hypoxia adaptation factors, such as CA-IX and GLUT-1) the hypoxic microenvironment of obese adipose tissue. Thus, obese microenvironment–adapted BC cells are able to survive during anti-VEGF therapy, whereas lean BC cells do not. These results corroborate previous reports showing that hypovascularization, hypoxia, or hypoxia-related markers are associated with resistance to anti-VEGF therapy (36, 49–52).
One of the mechanisms by which hypoxia may contribute to the resistance to antiangiogenic therapy is production of inflammatory cytokines and angiogenic factors by adipocytes and infiltrating myeloid cells (25, 36, 53–59). We found the expression of IL-6 and/or FGF-2 in adipocytes, myeloid cells including macrophages (IL-6), and fibroblasts (FGF-2) preferentially in adipocyte-rich hypoxic regions. These adipose-rich regions were more prevalent in tumors from obese mice. Hence, IL-6 and FGF-2 were also higher as well. These findings further support the hypothesis that an intrinsic resistance mechanism is already in place in BCs in obesity before anti-VEGF therapy is initiated. Consistent with that, macrophages and IL-6 expression are typically found in close proximity to dead adipocytes in breast adipose tissue (56). In addition, our results align with the finding in patients that adipocytes located near tumor cells up-regulate IL-6 production (27, 42, 55). The link between IL-6 and obesity is well-established (60–62). In addition, transcriptomic analysis revealed marked up-regulation of IL-6 inflammatory pathway in the tumors of BC patients with obesity in comparison to those without obesity (63). In our study, we found that IL-6 increased with BW in BC patients and mice, was particularly expressed in adipose-rich regions of tumors, and was associated with worse response to anti-VEGF therapy. Although IL-6 appeared to originate from adipocytes and myeloid cells, CAAs seem to be the major contributor for the increased IL-6 in tumors from obese mice. We have recently found that obesity did not promote infiltration of myeloid cells, monocytes, or macrophages in E0771 tumors (22). Another study also found no difference in the expression of myeloid (CD11b+)–specific IL-6 originating from E0771 tumors implanted in lean and obese mice (63).
IL-6 can influence all stages of tumor development and metastasis (64, 65), induce up-regulation of CA-IX, and promote a hypoxia-resistant invasive phenotype in BC cells (66). In addition, high plasma concentrations of IL-6 have been associated with poor outcomes in cancer patients (kidney and liver cancer) treated with antiangiogenic agents, and IL-6 inhibition improved response to anti-VEGF in a mouse glioma model (10, 29, 65, 67). Here, targeting IL-6 in B20-treated E0771 breast tumors in obese mice decreased STAT3 signaling, tumor cell proliferation, tumor growth, and metastasis and increased survival. IL-6R expression and the downstream mediator gp130 in E0771 cells are consistent with the effect on tumor cell proliferation. However, IL-6 blockade was ineffective without obesity or anti-VEGF therapy. It is possible that the abundance of IL-6 in the obese setting predisposes obese tumors to respond to IL-6 inhibition. In addition, IL-6 may be a critical protumorigenic molecule only in the context of VEGF signaling blockade. IL-6 can also regulate trafficking and recruitment of immune cells such as myeloid cells, which are a further source of proinflammatory and protumorigenic cytokines and can induce tumor immunosuppression by induction of regulatory T cells (68–70). In our study, IL-6 inhibition reversed the B20-induced recruitment of immunosuppressive regulatory T cells in obese mice, suggesting that IL-6 inhibition may potentiate immunotherapy especially in the obese setting. Furthermore, the addition of IL-6 blockade to anti-VEGF therapy improved blood vessel perfusion and tissue oxygenation, hallmarks of vascular normalization (2), in obese mice. This is consistent with findings in an asthma model, in which lung vascular permeability was decreased by IL-6 inhibition (71). As shown elsewhere (2), vascular normalization can improve concomitantly administered cytotoxic therapies, demonstrating additional benefit of the combination of anti-VEGF with IL-6 inhibition. In conclusion, IL-6 blockade may prevent the effects of obesity on cell proliferation, vascular dysfunction, immune cell recruitment, and immunosuppression.
In addition to IL-6, FGF-2 was also increased in patients and mice with obesity. Adipocytes produce FGF-2, and plasma FGF-2 correlated with BMI (37, 72). In addition, FGF pathway activation has been proposed as a mechanism of escape from VEGF-targeted therapies (36–38). Here, FGF inhibition using an FGFR inhibitor tested in clinical trials (73) or metformin sensitized tumors to anti-VEGF treatment in obese but not in lean mice. In B20-treated obese mice, metformin decreased tumor FGF-2 at the gene and protein levels, as well as its downstream signaling and vessel density without any signs of toxicity. This is consistent with previous studies showing that metformin may be more effective in a hypoxic setting (74) and that it can decrease tumor vessel density induced by obesity to levels observed in lean mice (63). These studies may explain the benefits recently reported in a cancer patient when metformin was added to bevacizumab treatment (75). In addition, metformin is particularly effective in the obese setting and likely acts via multiple mechanisms (22, 41).
Epidemiological evidence suggests that BC patients who have obesity at diagnosis have a worse prognosis compared to patients without obesity (76–79). In particular, a meta-analysis of 43 studies that examined the association between obesity at diagnosis and BC outcome revealed that patients with obesity were 33% more likely to die of BC compared to patients without it (79). Moreover, in a recent study with 137 ER+ BC patients, those with obesity had lower overall and progression-free survival (48). For our clinical study, no data for recurrence, overall survival, or progression-free survival are available yet, given the neoadjuvant setting and the recent completion of the study, which poses a limitation to our study. However, we observed 33% larger tumor size at diagnosis in patients with excess weight compared to lean subjects, which was corroborated by our animal models. In addition, E0771 tumor cell growth was only modestly accelerated in obese compared to lean mice, particularly in the early stages of tumor growth. Although studies using the same tumor model have shown a similar growth pattern (80), Chen et al. (81) and Kolb et al. (63) have shown a more dramatic acceleration in tumor growth in obese mice. Several factors may explain this discrepancy, including the existence of subclones of E0771 with different aggressiveness (those with lower aggressiveness may respond more to obesity-induced metabolic or inflammatory cues), number of cells implanted [2 × 10⁵ cells in the studies of Chen et al. (81) and Kolb et al. (63) versus 1 × 10⁶ cells in our study], cell media used for implantation [50:50 Matrigel/phosphate-buffered saline (PBS) in the study of Kolb et al. (63) versus PBS only in our study], diets used for control mice [normal chow diets in the study of Chen et al. (81) and Kolb et al. (63) versus purified nutrient-matched low-fat diet in our study], and environment where animals are located, which may affect the microbiota (animals in the Steele Laboratories are located in a gnotobiotic facility, which may differ from other groups). This point has also been raised recently by Scully et al. (80), who, similar to our study, observed only a mild increase in E0771 tumor growth in obese mice (and similar vascular phenotypes, as discussed below). They stated that differences in the duration of feeding, the type of diet, age, or menopausal status of the mice may explain the different observations in the literature. Similarly, there have been inconsistent reports of the effect of obesity on tumor vessel density, which can also be explained by the factors discussed above. In particular, in the study by Kolb et al. (63), the authors observed increased IL-1β, VEGF-A, and vessel density in tumors of obese mice, with the latter two returning to the concentrations observed in lean mice after treatment with anti–IL-1β. In our study, neither IL-1β nor VEGF-A expression was affected by obesity in patients or mouse models, which may explain the differences in vessel density in these studies. On the other hand, Scully et al. (80), using a similar E0771 model in lean and obese female C57BL/6, showed not only similar tumor growth behavior to our studies but also a similar vessel density decrease in tumors from obese mice. They went on to conclude that the association between tumor vessel density and obesity not only is influenced by menopausal status but also is age-and model-dependent.
These findings indicate that adipocyte-dense hypoxic areas in tumors from individuals with obesity induce resistance to anti-VEGF therapy by producing inflammatory cytokines and angiogenic factors such as IL-6 or FGF-2, which sustain vasculature and promote an immunosuppressive environment and tumor cell survival. Targeting these pathways with specific drugs, such as tocilizumab, an anti–IL-6R antibody that has already been approved by FDA for other indications (82), or other agents that affect these pathways, such as metformin, ultimately sensitizes primary and metastatic tumors to anti-VEGF therapy in obesity. On the other hand, this study is consistent with recent evidence that weight management in BC patients may be an effective tool to improve prognosis (83). Given the prevalence of obesity among BC patients, the lack of stratification by obesity status using BMI or VAT may explain the lack of overall survival benefit with anti-VEGF therapy in BCs. Our work reveals strategies to improve the clinical outcome of BC. Whether stratifying patients based on obesity or obesity-related markers as well as inflammatory or angiogenic factors will allow a more personalized approach to BC treatment, and in particular whether targeting specific inflammatory or angiogenic pathways will overcome obesity-induced resistance to anti-VEGF treatment, warrants prospective evaluation. Finally, because inflammation and angiogenesis can affect response to conventional and other molecularly targeted therapies, the findings of this work may extend beyond anti-VEGF treatment in BC.
MATERIALS AND METHODS
Study design
The objective of the present study was to evaluate the impact of obesity on response to anti-VEGF–targeted therapy. The sample sizes of the experiments were selected on the basis of previous experience. Data collection was stopped at a priori defined time points. Animal experiments were performed with an a priori hypothesis without repetition. Experiments were carried out in an unblinded fashion except for analyses of immunohistochemistry images.
Statistical analysis
Statistical differences were assessed by two-tailed Student’s t test for comparisons between two groups, one-way ANOVA followed by post hoc multiple comparisons test when analyzing multiple pairs of interest without a priori selection within the obese mouse population, two-way ANOVA with post hoc multiple comparisons test when comparing tumor growth and multiple treatment/genetic groups in lean and obese mice, and Spearman test for correlation between continuous variables. Density of adipocyte-rich or adipocyte-poor regions in tumors from lean and obese mice was assessed using χ2 test. Time to progression (survival curves) was estimated by Kaplan-Meier curves and compared using the log-rank test. All statistical analyses were performed using GraphPad Prism software. A P value of less than 0.05 was considered to denote statistical significance as calculated by the appropriate statistical test. For more details on experimental procedures, please see the Supplementary Materials.
Supplementary Material
www.sciencetranslationalmedicine.org/cgi/content/full/10/432/eaag0945/DC1
Materials and Methods
Fig. S1. Correlation of VAT and SAT with BMI.
Fig. S2. Correlation between plasma IL-6 and VAT at day 70 and presurgery time points.
Fig. S3. Correlation between plasma IL-6 and BMI at day 70 and presurgery time points.
Fig. S4. Individual curves of data presented in Fig. 2B.
Fig. S5. Correlation between obesity and tumor growth.
Fig. S6. Early tumor progression in the setting of diet-induced obesity.
Fig. S7. Individual curves of data presented in Fig. 2 (D and E).
Fig. S8. Tumor progression influenced by BW but not diet.
Fig. S9. Association between obesity and expression of the hypoxia marker GLUT-1.
Fig. S10. Quantification of Western blot data presented in Fig. 3C.
Fig. S11. Detection and location of adipocytes in tumors.
Fig. S12. Expression of additional inflammatory and angiogenic markers in tumors from lean and obese mice treated with B20.
Fig. S13. Association between obesity and increased concentrations of tumor IL-6.
Fig. S14. Additional representative immunofluorescence stains of F4/80 and CA-IX in E0771 tumors.
Fig. S15. Decreased concentration of tumor IL-6 after pharmacological or genetic inhibition in anti-VEGF–treated mice.
Fig. S16. Individual tumor growth curves of data presented in Fig. 6A.
Fig. S17. Additional images of lungs from mice implanted with E0771 tumors.
Fig. S18. Similar effects of pharmacological and genetic inhibition of IL-6 on tumor growth in animals treated with anti-VEGF (B20).
Fig. S19. No effect on tumor growth after pharmacological or genetic inhibition of IL-6 alone in obese mice.
Fig. S20. Reduced mitotic count with IL-6 inhibition in E0771 tumors from obese mice treated with B20.
Fig. S21. Quantification of Western blot data presented in Fig. 6D.
Fig. S22. Tumor necrosis induced by B20.
Fig. S23. Reduced concentration of tumor CXCL1 in obese mice treated with B20 and IL-6 inhibition.
Fig. S24. Expression of additional inflammatory and angiogenic markers in MCaIV tumors from lean and obese mice treated with B20 or obese mice treated with B20 plus metformin.
Fig. S25. Association of obesity and increased FGF-2 expression in tumors, particularly around adipocytes and fibroblasts.
Fig. S26. CA-IX expression near adipocytes in MCaIV tumors.
Fig. S27. Effect of obesity on CA-IX expression in MCaIV tumors.
Fig. S28. Individual tumor growth curves of data presented in Fig. 7E.
Fig. S29. Decreased BW after FGFR inhibition in tumor-bearing mice treated with B20.
Fig. S30. Quantification of Western blot data presented in Fig. 7F.
Table S1. Antibodies used for immunohistochemistry.
Table S2. Antibodies used for immunofluorescence.
Table S3. Antibodies used for Western blotting.
Table S4. Antibodies used for flow cytometry.
References (84–92)
Acknowledgments
We thank P. Huang for providing transgenic mouse support, J. Kahn for assistance with tumor implantation, P. Woo for assistance with animal husbandry, A. Khachatryan for assistance with multiplex array assay, C. Smith for assistance in our immunohistochemical studies, and E. Mihich (Roswell Park Cancer Institute) for providing the E0771 BC cell line. Anti-mouse VEGF antibody (B20-4.1.1) for this study was provided by Genentech under a material transfer agreement between Massachusetts General Hospital (MGH) and Genentech.
Funding: This study was supported in part by U.S. Department of Defense Breast Cancer Research Innovator Award W81XWH-10-1-0016 (R.K.J.); U.S. National Cancer Institute (NCI) grants R01-CA126642 and R35CA197743 (R.K.J.), P01-CA080124 and R01-CA208205 (R.K.J. and D.F.), R01-CA096915 and S10-RR027070 (D.F.), and R01-CA159258 (D.G.D.); NCI/Federal Share Proton Beam Program Income (R.K.J.); National Foundation for Cancer Research (R.K.J.); Harvard Ludwig Cancer Center (R.K.J.); FCT (Foundation for Science and Technology, Portugal) fellowship and grant (POPH/FSE funding program) to J.I.; Sao Paulo Research Foundation fellowship (FAPESP 2016/21320-1) to I.L.G.-S.; and an Erwin Schrödinger fellowship from the Austrian Science Fund (FWF; project number: J 3747-B28) to M.P.
The research described in this paper is not related in any way to the following affiliations and relationships of the respective authors: consulting work of M.A. for Probabilitas LLC; advisory/consulting relationships of D.G.D. with Bayer and Bristol-Myers Squibb (BMS); work of U.H. related to KOWA, MedImmune, Siemens, HeartFlow Inc., and Abbott; advisory/consulting relationships of I.E.K. with Genentech; advisory/consulting relationships of M.P. with Bayer and BMS. D.F., J.I., and R.K.J. are inventors on the following patent applications submitted by MGH: PCT/US2015/062710 that covers VEGF pathway and obesity-induced tumor progression; PCT/US2016/67149 that covers strategies to reduce BW in obese hosts using pH-sensitive nanoformulations.
Footnotes
Author contributions: J.I., D.T.M., P.S., K.K., M.P., S.M.C., S.B., T.D.V., Y.H., N.N.R., K.J., S.R., D.W., I.L.G.-S., S.B.P., and C.L.S. performed experiments. J.I., J.A.L., D.T.M., P.S., K.K., S.M.C., M.P., S.B., T.D.V., Y.H., N.N.R., K.J., S.R., D.W., S.B.P., C.L.S., U.H., M.A., S.M.T., I.E.K., D.G.D., Y.B., D.F., and R.K.J. designed experiments and analyzed data. J.I., D.T.M., D.F., and R.K.J. wrote the paper. All authors read and agreed on the final version of the manuscript.
Competing interests: R.K.J. received consultant fees from Merck, Ophthotech, Pfizer, SPARC, SynDevRx, and XTuit. R.K.J. owns equity in Enlight, Ophthotech, SynDevRx, and XTuit and serves on the Board of Directors of XTuit and the Boards of Trustees of Tekla Healthcare Investors, Tekla Life Sciences Investors, Tekla Healthcare Opportunities Fund, and Tekla World Healthcare Fund. No reagents or funding from these companies was used in these studies.
REFERENCES AND NOTES
- 1.Jain RK. Normalizing tumor microenvironment to treat cancer: Bench to bedside to biomarkers. J Clin Oncol. 2013;31:2205–2218. doi: 10.1200/JCO.2012.46.3653. [DOI] [PMC free article] [PubMed] [Google Scholar]
- 2.Jain RK. Antiangiogenesis strategies revisited: From starving tumors to alleviating hypoxia. Cancer Cell. 2014;26:605–622. doi: 10.1016/j.ccell.2014.10.006. [DOI] [PMC free article] [PubMed] [Google Scholar]
- 3.Lohmann AE, Chia S. Patients with metastatic breast cancer using bevacizumab as a treatment: Is there still a role for it? Curr Treat Options Oncol. 2012;13:249–262. doi: 10.1007/s11864-012-0181-9. [DOI] [PubMed] [Google Scholar]
- 4.Guiu B, Petit JM, Bonnetain F, Ladoire S, Guiu S, Cercueil JP, Krausé D, Hillon P, Borg C, Chauffert B, Ghiringhelli F. Visceral fat area is an independent predictive biomarker of outcome after first-line bevacizumab-based treatment in metastatic colorectal cancer. Gut. 2010;59:341–347. doi: 10.1136/gut.2009.188946. [DOI] [PubMed] [Google Scholar]
- 5.Ladoire S, Bonnetain F, Gauthier M, Zanetta S, Petit JM, Guiu S, Kermarrec I, Mourey E, Michel F, Krause D, Hillon P, Cormier L, Ghiringhelli F, Guiu B. Visceral fat area as a new independent predictive factor of survival in patients with metastatic renal cell carcinoma treated with antiangiogenic agents. Oncologist. 2011;16:71–81. doi: 10.1634/theoncologist.2010-0227. [DOI] [PMC free article] [PubMed] [Google Scholar]
- 6.Gati A, Kouidhi S, Marrakchi R, Gaaied A El, Kourda N, Derouiche A, Chebil M, Caignard A, Perier A. Obesity and renal cancer: Role of adipokines in the tumor-immune system conflict. Oncoimmunology. 2014;3:e27810. doi: 10.4161/onci.27810. [DOI] [PMC free article] [PubMed] [Google Scholar]
- 7.Steffens S, Grünwald V, Ringe KI, Seidel C, Eggers H, Schrader M, Wacker F, Kuczyk MA, Schrader AJ. Does obesity influence the prognosis of metastatic renal cell carcinoma in patients treated with vascular endothelial growth factor–targeted therapy? Oncologist. 2011;16:1565–1571. doi: 10.1634/theoncologist.2011-0213. [DOI] [PMC free article] [PubMed] [Google Scholar]
- 8.Jain RK, Duda DG, Willett CG, Sahani DV, Zhu AX, Loeffler JS, Batchelor TT, Sorensen AG. Biomarkers of response and resistance to antiangiogenic therapy. Nat Rev Clin Oncol. 2009;6:327–338. doi: 10.1038/nrclinonc.2009.63. [DOI] [PMC free article] [PubMed] [Google Scholar]
- 9.Carmeliet P, Jain RK. Molecular mechanisms and clinical applications of angiogenesis. Nature. 2011;473:298–307. doi: 10.1038/nature10144. [DOI] [PMC free article] [PubMed] [Google Scholar]
- 10.Duda DG, Munn LL, Jain RK. Can we identify predictive biomarkers for antiangiogenic therapy of cancer using mathematical modeling? J Natl Cancer Inst. 2013;105:762–765. doi: 10.1093/jnci/djt114. [DOI] [PMC free article] [PubMed] [Google Scholar]
- 11.Carmeliet P, Jain RK. Principles and mechanisms of vessel normalization for cancer and other angiogenic diseases. Nat Rev Drug Discov. 2011;10:417–427. doi: 10.1038/nrd3455. [DOI] [PubMed] [Google Scholar]
- 12.Ye J, Gao Z, Yin J, He Q. Hypoxia is a potential risk factor for chronic inflammation and adiponectin reduction in adipose tissue of ob/ob and dietary obese mice. Am J Physiol Endocrinol Metab. 2007;293:E1118–E1128. doi: 10.1152/ajpendo.00435.2007. [DOI] [PubMed] [Google Scholar]
- 13.Incio J, Soares R. Obesity, diabetes and metabolic syndrome impact on tumor angiogenesis, in. Tumor Angiogenesis Regulators, R R Gonzalez-Perez, B R Rueda, Eds (CRC Press. 2013 [Google Scholar]
- 14.Khan S, Shukla S, Sinha S, Meeran SM. Role of adipokines and cytokines in obesity-associated breast cancer: Therapeutic targets. Cytokine Growth Factor Rev. 2013;24:503–513. doi: 10.1016/j.cytogfr.2013.10.001. [DOI] [PubMed] [Google Scholar]
- 15.Fukumura D, Incio J, Shankaraiah RC, Jain RK. Obesity and Cancer: An angiogenic and inflammatory link. Microcirculation. 2016;23:191–206. doi: 10.1111/micc.12270. [DOI] [PMC free article] [PubMed] [Google Scholar]
- 16.Costa C, Incio J, Soares R. Angiogenesis and chronic inflammation: Cause or consequence? Angiogenesis. 2007;10:149–166. doi: 10.1007/s10456-007-9074-0. [DOI] [PubMed] [Google Scholar]
- 17.Hosogai N, Fukuhara A, Oshima K, Miyata Y, Tanaka S, Segawa K, Furukawa S, Tochino Y, Komuro R, Matsuda M, Shimomura I. Adipose tissue hypoxia in obesity and its impact on adipocytokine dysregulation. Diabetes. 2007;56:901–911. doi: 10.2337/db06-0911. [DOI] [PubMed] [Google Scholar]
- 18.Hursting SD. Minireview: The year in obesity and cancer. Mol Endocrinol. 2012;26:1961–1966. doi: 10.1210/me.2012-1283. [DOI] [PMC free article] [PubMed] [Google Scholar]
- 19.Lijnen HR. Angiogenesis and obesity. Cardiovasc Res. 2008;78:286–293. doi: 10.1093/cvr/cvm007. [DOI] [PubMed] [Google Scholar]
- 20.Wang YY, Lehuédé C, Laurent V, Dirat B, Dauvillier S, Bochet L, Le Gonidec S, Escourrou G, Valet P, Muller C. Adipose tissue and breast epithelial cells: A dangerous dynamic duo in breast cancer. Cancer Lett. 2012;324:142–151. doi: 10.1016/j.canlet.2012.05.019. [DOI] [PubMed] [Google Scholar]
- 21.Incio J, Liu H, Suboj P, Chin SM, Chen IX, Pinter M, Ng MR, Nia HT, Grahovac J, Kao S, Babykutty S, Huang Y, Jung K, Rahbari NN, Han X, Chauhan VP, Martin JD, Kahn J, Huang P, Desphande V, Michaelson J, Michelakos TP, Ferrone CR, Soares R, Boucher Y, Fukumura D, Jain RK. Obesity-induced inflammation and desmoplasia promote pancreatic cancer progression and resistance to chemotherapy. Cancer Discov. 2016;6:852–869. doi: 10.1158/2159-8290.CD-15-1177. [DOI] [PMC free article] [PubMed] [Google Scholar]
- 22.Incio J, Tam J, Rahbari NN, Suboj P, McManus DT, Chin SM, Vardam TD, Batista A, Babykutty S, Jung K, Khachatryan A, Hato T, Ligibel JA, Krop IE, Puchner SB, Schlett CL, Hoffmman U, Ancukiewicz M, Shibuya M, Carmeliet P, Soares R, Duda DG, Jain RK, Fukumura D. PlGF/VEGFR-1 signaling promotes macrophage polarization and accelerated tumor progression in obesity. Clin Cancer Res. 2016;22:2993–3004. doi: 10.1158/1078-0432.CCR-15-1839. [DOI] [PMC free article] [PubMed] [Google Scholar]
- 23.Sparano JA, Wang M, Zhao F, Stearns V, Martino S, Ligibel JA, Perez EA, Saphner T, Wolff AC, Sledge GW, Jr, Wood WC, Fetting J, Davidson NE. Obesity at diagnosis is associated with inferior outcomes in hormone receptor-positive operable breast cancer. Cancer. 2012;118:5937–5946. doi: 10.1002/cncr.27527. [DOI] [PMC free article] [PubMed] [Google Scholar]
- 24.Tolaney SM, Boucher Y, Duda DG, Martin JD, Seano G, Ancukiewicz M, Barry WT, Goel S, Lahdenrata J, Isakoff SJ, Yeh ED, Jain SR, Golshan M, Brock J, Snuderl M, Winer EP, Krop IE, Jain RK. Role of vascular density and normalization in response to neoadjuvant bevacizumab and chemotherapy in breast cancer patients. Proc Natl Acad Sci USA. 2015;112:14325–14330. doi: 10.1073/pnas.1518808112. [DOI] [PMC free article] [PubMed] [Google Scholar]
- 25.Trayhurn P. Hypoxia and adipose tissue function and dysfunction in obesity. Physiol Rev. 2013;93:1–21. doi: 10.1152/physrev.00017.2012. [DOI] [PubMed] [Google Scholar]
- 26.Mottagui-Tabar S, Rydén M, Löfgren P, Faulds G, Hoffstedt J, Brookes AJ, Andersson I, Arner P. Evidence for an important role of perilipin in the regulation of human adipocyte lipolysis. Diabetologia. 2003;46:789–797. doi: 10.1007/s00125-003-1112-x. [DOI] [PubMed] [Google Scholar]
- 27.Dirat B, Bochet L, Dabek M, Daviaud D, Dauvillier S, Majed B, Wang YY, Meulle A, Salles B, Le Gonidec S, Garrido I, Escourrou G, Valet P, Muller C. Cancer-associated adipocytes exhibit an activated phenotype and contribute to breast cancer invasion. Cancer Res. 2011;71:2455–2465. doi: 10.1158/0008-5472.CAN-10-3323. [DOI] [PubMed] [Google Scholar]
- 28.Fukumura D, Jain RK. Tumor microvasculature and microenvironment: Targets for anti-angiogenesis and normalization. Microvasc Res. 2007;74:72–84. doi: 10.1016/j.mvr.2007.05.003. [DOI] [PMC free article] [PubMed] [Google Scholar]
- 29.Duda DG, Ancukiewicz M, Jain RK. Biomarkers of antiangiogenic therapy: How do we move from candidate biomarkers to valid biomarkers? J Clin Oncol. 2010;28:183–185. doi: 10.1200/JCO.2009.24.8021. [DOI] [PubMed] [Google Scholar]
- 30.Rattigan Y, Hsu JM, Mishra PJ, Glod J, Banerjee D. Interleukin 6 mediated recruitment of mesenchymal stem cells to the hypoxic tumor milieu. Exp Cell Res. 2010;316:3417–3424. doi: 10.1016/j.yexcr.2010.07.002. [DOI] [PubMed] [Google Scholar]
- 31.Hong J, Tobin NP, Rundqvist H, Li T, Lavergne M, García-Ibáñez Y, Qin H, Paulsson J, Zeitelhofer M, Adzemovic MZ, Nilsson I, Roswall P, Hartman J, Johnson RS, Ostman A, Bergh J, Poljakovic M, Genové G. Role of tumor pericytes in the recruitment of myeloid-derived suppressor cells. J Natl Cancer Inst. 2015;107:djv209. doi: 10.1093/jnci/djv209. [DOI] [PMC free article] [PubMed] [Google Scholar]
- 32.Li Z, Pang Y, Gara SK, Achyut BR, Heger C, Goldsmith PK, Lonning S, Yang L. Gr-1+CD11b+ cells are responsible for tumor promoting effect of TGF-β in breast cancer progression. Int J Cancer. 2012;131:2584–2595. doi: 10.1002/ijc.27572. [DOI] [PMC free article] [PubMed] [Google Scholar]
- 33.Spranger S, Spaapen RM, Zha Y, Williams J, Meng Y, Ha TT, Gajewski TF. Up-regulation of PD-L1, IDO, and Tregs in the melanoma tumor microenvironment is driven by CD8+ T cells. Sci Transl Med. 2013;5:200ra116. doi: 10.1126/scitranslmed.3006504. [DOI] [PMC free article] [PubMed] [Google Scholar]
- 34.Kluger HM, Chelouche Lev D, Kluger Y, McCarthy MM, Kiriakova G, Camp RL, Rimm DL, Price JE. Using a xenograft model of human breast cancer metastasis to find genes associated with clinically aggressive disease. Cancer Res. 2005;65:5578–5587. doi: 10.1158/0008-5472.CAN-05-0108. [DOI] [PubMed] [Google Scholar]
- 35.Chauhan VP, Martin JD, Liu H, Lacorre DA, Jain SR, Kozin SV, Stylianopoulos T, Mousa AS, Han X, Adstamongkonkul P, Popović Z, Huang P, Bawendi MG, Boucher Y, Jain RK. Angiotensin inhibition enhances drug delivery and potentiates chemotherapy by decompressing tumor blood vessels. Nat Commun. 2013;4:2516. doi: 10.1038/ncomms3516. [DOI] [PMC free article] [PubMed] [Google Scholar]
- 36.Casanovas O, Hicklin DJ, Bergers G, Hanahan D. Drug resistance by evasion of antiangiogenic targeting of VEGF signaling in late-stage pancreatic islet tumors. Cancer Cell. 2005;8:299–309. doi: 10.1016/j.ccr.2005.09.005. [DOI] [PubMed] [Google Scholar]
- 37.Lieu C, Heymach J, Overman M, Tran H, Kopetz S. Beyond VEGF: Inhibition of the fibroblast growth factor pathway and antiangiogenesis. Clin Cancer Res. 2011;17:6130–6139. doi: 10.1158/1078-0432.CCR-11-0659. [DOI] [PMC free article] [PubMed] [Google Scholar]
- 38.Gyanchandani R, Ortega Alves MV, Myers JN, Kim S. A proangiogenic signature is revealed in FGF-mediated bevacizumab-resistant head and neck squamous cell carcinoma. Mol Cancer Res. 2013;11:1585–1596. doi: 10.1158/1541-7786.MCR-13-0358. [DOI] [PMC free article] [PubMed] [Google Scholar]
- 39.Wang XF, Zhang JY, Li L, Zhao XY. Beneficial effects of metformin on primary cardiomyocytes via activation of adenosine monophosphate-activated protein kinase. Chin Med J. 2011;124:1876–1884. [PubMed] [Google Scholar]
- 40.Muti P, Berrino F, Krogh V, Villarini A, Barba M, Strano S, Blandino G. Metformin, diet and breast cancer: An avenue for chemoprevention. Cell Cycle. 2009;8:2661. doi: 10.4161/cc.8.16.9226. [DOI] [PubMed] [Google Scholar]
- 41.Incio J, Suboj P, Chin SM, Vardam-Kaur T, Liu H, Hato T, Babykutty S, Chen I, Deshpande V, Jain RK, Fukumura D. Metformin reduces desmoplasia in pancreatic cancer by reprogramming stellate cells and tumor-associated macrophages. PLOS ONE. 2015;10:e0141392. doi: 10.1371/journal.pone.0141392. [DOI] [PMC free article] [PubMed] [Google Scholar]
- 42.Bochet L, Meulle A, Imbert S, Salles B, Valet P, Muller C. Cancer-associated adipocytes promotes breast tumor radioresistance. Biochem Biophys Res Commun. 2011;411:102–106. doi: 10.1016/j.bbrc.2011.06.101. [DOI] [PubMed] [Google Scholar]
- 43.Halberg N, Khan T, Trujillo ME, Wernstedt-Asterholm I, Attie AD, Sherwani S, Wang ZV, Landskroner-Eiger S, Dineen S, Magalang UJ, Brekken RA, Scherer PE. Hypoxia-inducible factor 1α induces fibrosis and insulin resistance in white adipose tissue. Mol Cell Biol. 2009;29:4467–4483. doi: 10.1128/MCB.00192-09. [DOI] [PMC free article] [PubMed] [Google Scholar]
- 44.Zyromski NJ, Mathur A, Pitt HA, Wade TE, Wang S, Nakshatri P, Swartz-Basile DA, Nakshatri H. Obesity potentiates the growth and dissemination of pancreatic cancer. Surgery. 2009;146:258–263. doi: 10.1016/j.surg.2009.02.024. [DOI] [PubMed] [Google Scholar]
- 45.White PB, True EM, Ziegler KM, Wang SS, Swartz-Basile DA, Pitt HA, Zyromski NJ. Insulin, leptin, and tumoral adipocytes promote murine pancreatic cancer growth. J Gastrointest Surg. 2010;14:1888–1893. doi: 10.1007/s11605-010-1349-x. discussion 1893–1894. [DOI] [PubMed] [Google Scholar]
- 46.Zhang Y, Daquinag AC, Amaya-Manzanares F, Sirin O, Tseng C, Kolonin MG. Stromal progenitor cells from endogenous adipose tissue contribute to pericytes and adipocytes that populate the tumor microenvironment. Cancer Res. 2012;72:5198–5208. doi: 10.1158/0008-5472.CAN-12-0294. [DOI] [PubMed] [Google Scholar]
- 47.Calle EE, Kaaks R. Overweight, obesity and cancer: Epidemiological evidence and proposed mechanisms. Nat Rev Cancer. 2004;4:579–591. doi: 10.1038/nrc1408. [DOI] [PubMed] [Google Scholar]
- 48.Fuentes-Mattei E, Velazquez-Torres G, Phan L, Zhang F, Chou P-C, Shin J-H, Choi HH, Chen J-S, Zhao R, Chen J, Gully C, Carlock C, Qi Y, Zhang Y, Wu Y, Esteva FJ, Luo Y, McKeehan WL, Ensor J, Hortobagyi GN, Pusztai L, Fraser Symmans W, Lee M-H, Yeung S-C. Effects of obesity on transcriptomic changes and cancer hallmarks in estrogen receptor–positive breast cancer. J Natl Cancer Inst. 2014;106:dju158. doi: 10.1093/jnci/dju158. [DOI] [PMC free article] [PubMed] [Google Scholar]
- 49.Sathornsumetee S, Cao Y, Marcello JE, Herndon JE, II, McLendon RE, Desjardins A, Friedman HS, Dewhirst MW, Vredenburgh JJ, Rich JN. Tumor angiogenic and hypoxic profiles predict radiographic response and survival in malignant astrocytoma patients treated with bevacizumab and irinotecan. J Clin Oncol. 2008;26:271–278. doi: 10.1200/JCO.2007.13.3652. [DOI] [PMC free article] [PubMed] [Google Scholar]
- 50.Bergers G, Hanahan D. Modes of resistance to anti-angiogenic therapy. Nat Rev Cancer. 2008;8:592–603. doi: 10.1038/nrc2442. [DOI] [PMC free article] [PubMed] [Google Scholar]
- 51.Hong YS, Cho HJ, Kim SY, Jung KH, Park JW, Choi HS, Oh JH, Kim BC, Sohn DK, Kim DY, Chang HJ. Carbonic anhydrase 9 is a predictive marker of survival benefit from lower dose of bevacizumab in patients with previously treated metastatic colorectal cancer. BMC Cancer. 2009;9:246. doi: 10.1186/1471-2407-9-246. [DOI] [PMC free article] [PubMed] [Google Scholar]
- 52.Bao B, Ali S, Ahmad A, Azmi AS, Li Y, Banerjee S, Kong D, Sethi S, Aboukameel A, Padhye SB, Sarkar FH. Hypoxia-induced aggressiveness of pancreatic cancer cells is due to increased expression of VEGF, IL-6 and miR-21, which can be attenuated by CDF treatment. PLOS ONE. 2012;7:e50165. doi: 10.1371/journal.pone.0050165. [DOI] [PMC free article] [PubMed] [Google Scholar]
- 53.Sasser AK, Sullivan NJ, Studebaker AW, Hendey LF, Axel AE, Hall BM. Interleukin-6 is a potent growth factor for ER-α-positive human breast cancer. FASEB J. 2007;21:3763–3770. doi: 10.1096/fj.07-8832com. [DOI] [PubMed] [Google Scholar]
- 54.Sansone P, Storci G, Tavolari S, Guarnieri T, Giovannini C, Taffurelli M, Ceccarelli C, Santini D, Paterini P, Marcu KB, Chieco P, Bonafè M. IL-6 triggers malignant features in mammospheres from human ductal breast carcinoma and normal mammary gland. J Clin Invest. 2007;117:3988–4002. doi: 10.1172/JCI32533. [DOI] [PMC free article] [PubMed] [Google Scholar]
- 55.Sullivan NJ, Sasser AK, Axel AE, Vesuna F, Raman V, Ramirez N, Oberyszyn TM, Hall BM. Interleukin-6 induces an epithelial–mesenchymal transition phenotype in human breast cancer cells. Oncogene. 2009;28:2940–2947. doi: 10.1038/onc.2009.180. [DOI] [PMC free article] [PubMed] [Google Scholar]
- 56.Trayhurn P, Wang B, Wood IS. Hypoxia and the endocrine and signalling role of white adipose tissue. Arch Physiol Biochem. 2008;114:267–276. doi: 10.1080/13813450802306602. [DOI] [PubMed] [Google Scholar]
- 57.Ye J. Emerging role of adipose tissue hypoxia in obesity and insulin resistance. Int J Obes. 2009;33:54–66. doi: 10.1038/ijo.2008.229. [DOI] [PMC free article] [PubMed] [Google Scholar]
- 58.Trayhurn P, Wang B, Wood IS. HIF-1α protein rather than mRNA as a marker of hypoxia in adipose tissue in obesity: Focus on “Inflammation is associated with a decrease of lipogenic factors in omental fat in women,” by Poulain-Godefroy et al. Am J Physiol Regul Integr Comp Physiol. 2008;295:R1097. doi: 10.1152/ajpregu.90633.2008. author reply R1098. [DOI] [PubMed] [Google Scholar]
- 59.Fukumura D, Duda DG, Munn LL, Jain RK. Tumor microvasculature and microenvironment: Novel insights through intravital imaging in pre-clinical models. Microcirculation. 2010;17:206–225. doi: 10.1111/j.1549-8719.2010.00029.x. [DOI] [PMC free article] [PubMed] [Google Scholar]
- 60.Kim JH, Bachmann RA, Chen J. Interleukin-6 and insulin resistance. Vitam Horm. 2009;80:613–633. doi: 10.1016/S0083-6729(08)00621-3. [DOI] [PubMed] [Google Scholar]
- 61.Park HS, Park JY, Yu R. Relationship of obesity and visceral adiposity with serum concentrations of CRP, TNF-α and IL-6. Diabetes Res Clin Pract. 2005;69:29–35. doi: 10.1016/j.diabres.2004.11.007. [DOI] [PubMed] [Google Scholar]
- 62.Bowers LW, Cavazos DA, Maximo IXF, Brenner AJ, Hursting SD, deGraffenried LA. Obesity enhances nongenomic estrogen receptor crosstalk with the PI3K/Akt and MAPK pathways to promote in vitro measures of breast cancer progression. Breast Cancer Res. 2013;15:R59. doi: 10.1186/bcr3453. [DOI] [PMC free article] [PubMed] [Google Scholar]
- 63.Kolb R, Phan L, Borcherding N, Liu Y, Yuan F, Janowski AM, Xie Q, Markan KR, Li W, Potthoff MJ, Fuentes-Mattei E, Ellies LG, Knudson CM, Lee MH, Yeung SJ, Cassel SL, Sutterwala FS, Zhang W. Obesity-associated NLRC4 inflammasome activation drives breast cancer progression. Nat Commun. 2016;7:13007. doi: 10.1038/ncomms13007. [DOI] [PMC free article] [PubMed] [Google Scholar]
- 64.Chang Q, Bournazou E, Sansone P, Berishaj M, Gao SP, Daly L, Wels J, Theilen T, Granitto S, Zhang X, Cotari J, Alpaugh ML, de Stanchina E, Manova K, Li M, Bonafe M, Ceccarelli C, Taffurelli M, Santini D, Altan-Bonnet G, Kaplan R, Norton L, Nishimoto N, Huszar D, Lyden D, Bromberg J. The IL-6/JAK/Stat3 feed-forward loop drives tumorigenesis and metastasis. Neoplasia. 2013;15:848–862. doi: 10.1593/neo.13706. [DOI] [PMC free article] [PubMed] [Google Scholar]
- 65.Knüpfer H, Preiss R. Significance of interleukin-6 (IL-6) in breast cancer (review) Breast Cancer Res Treat. 2007;102:129–135. doi: 10.1007/s10549-006-9328-3. [DOI] [PubMed] [Google Scholar]
- 66.Sanguinetti A, Santini D, Bonafe M, Taffurelli M, Avenia N. Interleukin-6 and pro inflammatory status in the breast tumor microenvironment. World J Surg Oncol. 2015;13:129. doi: 10.1186/s12957-015-0529-2. [DOI] [PMC free article] [PubMed] [Google Scholar]
- 67.Saidi A, Hagedorn M, Allain N, Verpelli C, Sala C, Bello L, Bikfalvi A, Javerzat S. Combined targeting of interleukin-6 and vascular endothelial growth factor potently inhibits glioma growth and invasiveness. Int J Cancer. 2009;125:1054–1064. doi: 10.1002/ijc.24380. [DOI] [PubMed] [Google Scholar]
- 68.Remick DG. Interleukin-8. Crit Care Med. 2005;33:S466–S467. doi: 10.1097/01.ccm.0000186783.34908.18. [DOI] [PubMed] [Google Scholar]
- 69.Remick DG, Bolgos G, Copeland S, Siddiqui J. Role of interleukin-6 in mortality from and physiologic response to sepsis. Infect Immun. 2005;73:2751–2757. doi: 10.1128/IAI.73.5.2751-2757.2005. [DOI] [PMC free article] [PubMed] [Google Scholar]
- 70.Chen J, Ye Y, Liu P, Yu W, Wei F, Li H, Yu J. Suppression of T cells by myeloid-derived suppressor cells in cancer. Human Immunol. 2016;78:113–119. doi: 10.1016/j.humimm.2016.12.001. [DOI] [PubMed] [Google Scholar]
- 71.Pedroza M, Schneider DJ, Karmouty-Quintana H, Coote J, Shaw S, Corrigan R, Molina JG, Alcorn JL, Galas D, Gelinas R, Blackburn MR. Interleukin-6 contributes to inflammation and remodeling in a model of adenosine mediated lung injury. PLOS ONE. 2011;6:e22667. doi: 10.1371/journal.pone.0022667. [DOI] [PMC free article] [PubMed] [Google Scholar]
- 72.Giavazzi R, Sennino B, Coltrini D, Garofalo A, Dossi R, Ronca R, Tosatti MP, Presta M. Distinct role of fibroblast growth factor-2 and vascular endothelial growth factor on tumor growth and angiogenesis. Am J Pathol. 2003;162:1913–1926. doi: 10.1016/S0002-9440(10)64325-8. [DOI] [PMC free article] [PubMed] [Google Scholar]
- 73.Clarke JM, Hurwitz HI. Understanding and targeting resistance to anti-angiogenic therapies. J Gastrointest Oncol. 2013;4:253–263. doi: 10.3978/j.issn.2078-6891.2013.036. [DOI] [PMC free article] [PubMed] [Google Scholar]
- 74.Wheaton WW, Weinberg SE, Hamanaka RB, Soberanes S, Sullivan LB, Anso E, Glasauer A, Dufour E, Mutlu GM, Budigner GS, Chandel NS. Metformin inhibits mitochondrial complex I of cancer cells to reduce tumorigenesis. eLife. 2014;3:e02242. doi: 10.7554/eLife.02242. [DOI] [PMC free article] [PubMed] [Google Scholar]
- 75.Indraccolo S, Randon G, Zulato E, Nardin M, Aliberti C, Pomerri F, Casarin A, Nicoletto MO. Metformin: A modulator of bevacizumab activity in cancer? A case report. Cancer Biol Ther. 2015;16:210–214. doi: 10.1080/15384047.2014.1002366. [DOI] [PMC free article] [PubMed] [Google Scholar]
- 76.Carmichael AR. Obesity and prognosis of breast cancer. Obes Rev. 2006;7:333–340. doi: 10.1111/j.1467-789X.2006.00261.x. [DOI] [PubMed] [Google Scholar]
- 77.La Vecchia C, Negri E, Franceschi S, Talamini R, Bruzzi P, Palli D, Decarli A. Body mass index and post-menopausal breast cancer: An age-specific analysis. Br J Cancer. 1997;75:441–444. doi: 10.1038/bjc.1997.73. [DOI] [PMC free article] [PubMed] [Google Scholar]
- 78.Renehan AG, Tyson M, Egger M, Heller RF, Zwahlen M. Body-mass index and incidence of cancer: A systematic review and meta-analysis of prospective observational studies. Lancet. 2008;371:569–578. doi: 10.1016/S0140-6736(08)60269-X. [DOI] [PubMed] [Google Scholar]
- 79.Protani M, Coory M, Martin JH. Effect of obesity on survival of women with breast cancer: Systematic review and meta-analysis. Breast Cancer Res Treat. 2010;123:627–635. doi: 10.1007/s10549-010-0990-0. [DOI] [PubMed] [Google Scholar]
- 80.Scully T, Firth SM, Scott CD, de Silva HC, Pintar JE, Chan-Ling T, Twigg SM, Baxter RC. Insulin-like growth factor binding protein-3 links obesity and breast cancer progression. Oncotarget. 2016;7:55491–55505. doi: 10.18632/oncotarget.10675. [DOI] [PMC free article] [PubMed] [Google Scholar]
- 81.Chen CT, Du Y, Yamaguchi H, Hsu JM, Kuo HP, Hortobagyi GN, Hung MC. Targeting the IKKβ/mTOR/VEGF signaling pathway as a potential therapeutic strategy for obesity-related breast cancer. Mol Cancer Ther. 2012;11:2212–2221. doi: 10.1158/1535-7163.MCT-12-0180. [DOI] [PMC free article] [PubMed] [Google Scholar]
- 82.Kim GW, Lee NR, Pi RH, Lim YS, Lee YM, Lee JM, Jeong HS, Chung SH. IL-6 inhibitors for treatment of rheumatoid arthritis: Past, present, and future. Arch Pharm Res. 2015;38:575–584. doi: 10.1007/s12272-015-0569-8. [DOI] [PubMed] [Google Scholar]
- 83.Ligibel JA, Alfano CM, Hershman D, Ballard RM, Bruinooge SS, Courneya KS, Daniels EC, Demark-Wahnefried W, Frank ES, Goodwin PJ, Irwin ML, Levit LA, McCaskill-Stevens W, Minasian LM, O’Rourke MA, Pierce JP, Stein KD, Thomson CA, Hudis CA. Recommendations for obesity clinical trials in cancer survivors: American Society of Clinical Oncology statement. J Clin Oncol. 2015;33:3961–3967. doi: 10.1200/JCO.2015.63.1440. [DOI] [PubMed] [Google Scholar]
- 84.Irlbeck T, Massaro JM, Bamberg F, O’Donnell CJ, Hoffmann U, Fox CS. Association between single-slice measurements of visceral and abdominal subcutaneous adipose tissue with volumetric measurements: The Framingham Heart Study. Int J Obes. 2010;34:781–787. doi: 10.1038/ijo.2009.279. [DOI] [PMC free article] [PubMed] [Google Scholar]
- 85.Borkan GA, Gerzof SG, Robbins AH, Hults DE, Silbert CK, Silbert JE. Assessment of abdominal fat content by computed tomography. Am J Clin Nutr. 1982;36:172–177. doi: 10.1093/ajcn/36.1.172. [DOI] [PubMed] [Google Scholar]
- 86.Maurovich-Horvat P, Massaro J, Fox CS, Moselewski F, O’Donnell CJ, Hoffmann U. Comparison of anthropometric, area- and volume-based assessment of abdominal subcutaneous and visceral adipose tissue volumes using multi-detector computed tomography. Int J Obes. 2007;31:500–506. doi: 10.1038/sj.ijo.0803454. [DOI] [PubMed] [Google Scholar]
- 87.Tam J, Duda DG, Perentes JY, Quadri RS, Fukumura D, Jain RK. Blockade of VEGFR2 and not VEGFR1 can limit diet-induced fat tissue expansion: Role of local versus bone marrow-derived endothelial cells. PLOS ONE. 2009;4:e4974. doi: 10.1371/journal.pone.0004974. [DOI] [PMC free article] [PubMed] [Google Scholar]
- 88.Wu Y, Brodt P, Sun H, Mejia W, Novosyadlyy R, Nunez N, Chen X, Mendoza A, Hong SH, Khanna C, Yakar S. Insulin-like growth factor-I regulates the liver microenvironment in obese mice and promotes liver metastasis. Cancer Res. 2010;70:57–67. doi: 10.1158/0008-5472.CAN-09-2472. [DOI] [PMC free article] [PubMed] [Google Scholar]
- 89.Kanda T, Raychoudhuri A, Steele R, Sagartz JE, West C, Ray RB. MBP-1 inhibits breast cancer growth and metastasis in immunocompetent mice. Cancer Res. 2009;69:9354–9359. doi: 10.1158/0008-5472.CAN-09-2974. [DOI] [PubMed] [Google Scholar]
- 90.Silobrcic V, Suit HD. Tumor-specific antigen(s) in a spontaneous mammary carcinoma of C3H mice. I. Quantitative cell transplants into mammary-tumor-agent-positive and -free mice. J Natl Cancer Inst. 1967;39:1113–1119. [PubMed] [Google Scholar]
- 91.Reagan-Shaw S, Nihal M, Ahmad N. Dose translation from animal to human studies revisited. FASEB J. 2008;22:659–661. doi: 10.1096/fj.07-9574LSF. [DOI] [PubMed] [Google Scholar]
- 92.Aperio. Positive Pixel Count Algorithm. Aperio; 2009. http://tmalab.jhmi.edu/aperiou/userguides/Positive_Pixel.pdf. [Google Scholar]
Associated Data
This section collects any data citations, data availability statements, or supplementary materials included in this article.
Supplementary Materials
www.sciencetranslationalmedicine.org/cgi/content/full/10/432/eaag0945/DC1
Materials and Methods
Fig. S1. Correlation of VAT and SAT with BMI.
Fig. S2. Correlation between plasma IL-6 and VAT at day 70 and presurgery time points.
Fig. S3. Correlation between plasma IL-6 and BMI at day 70 and presurgery time points.
Fig. S4. Individual curves of data presented in Fig. 2B.
Fig. S5. Correlation between obesity and tumor growth.
Fig. S6. Early tumor progression in the setting of diet-induced obesity.
Fig. S7. Individual curves of data presented in Fig. 2 (D and E).
Fig. S8. Tumor progression influenced by BW but not diet.
Fig. S9. Association between obesity and expression of the hypoxia marker GLUT-1.
Fig. S10. Quantification of Western blot data presented in Fig. 3C.
Fig. S11. Detection and location of adipocytes in tumors.
Fig. S12. Expression of additional inflammatory and angiogenic markers in tumors from lean and obese mice treated with B20.
Fig. S13. Association between obesity and increased concentrations of tumor IL-6.
Fig. S14. Additional representative immunofluorescence stains of F4/80 and CA-IX in E0771 tumors.
Fig. S15. Decreased concentration of tumor IL-6 after pharmacological or genetic inhibition in anti-VEGF–treated mice.
Fig. S16. Individual tumor growth curves of data presented in Fig. 6A.
Fig. S17. Additional images of lungs from mice implanted with E0771 tumors.
Fig. S18. Similar effects of pharmacological and genetic inhibition of IL-6 on tumor growth in animals treated with anti-VEGF (B20).
Fig. S19. No effect on tumor growth after pharmacological or genetic inhibition of IL-6 alone in obese mice.
Fig. S20. Reduced mitotic count with IL-6 inhibition in E0771 tumors from obese mice treated with B20.
Fig. S21. Quantification of Western blot data presented in Fig. 6D.
Fig. S22. Tumor necrosis induced by B20.
Fig. S23. Reduced concentration of tumor CXCL1 in obese mice treated with B20 and IL-6 inhibition.
Fig. S24. Expression of additional inflammatory and angiogenic markers in MCaIV tumors from lean and obese mice treated with B20 or obese mice treated with B20 plus metformin.
Fig. S25. Association of obesity and increased FGF-2 expression in tumors, particularly around adipocytes and fibroblasts.
Fig. S26. CA-IX expression near adipocytes in MCaIV tumors.
Fig. S27. Effect of obesity on CA-IX expression in MCaIV tumors.
Fig. S28. Individual tumor growth curves of data presented in Fig. 7E.
Fig. S29. Decreased BW after FGFR inhibition in tumor-bearing mice treated with B20.
Fig. S30. Quantification of Western blot data presented in Fig. 7F.
Table S1. Antibodies used for immunohistochemistry.
Table S2. Antibodies used for immunofluorescence.
Table S3. Antibodies used for Western blotting.
Table S4. Antibodies used for flow cytometry.
References (84–92)